FinTSB: A Comprehensive and Practical Benchmark for
Financial Time Series Forecasting
Abstract.
Financial time series (FinTS) record the behavior of human-brain-augmented decision-making, capturing valuable historical information that can be leveraged for profitable investment strategies. Not surprisingly, this area has attracted considerable attention from researchers, who have proposed a wide range of methods based on various backbones. However, the evaluation of the area often exhibits three systemic limitations: 1. Failure to account for the full spectrum of stock movement patterns observed in dynamic financial markets. (Diversity Gap), 2. The absence of unified assessment protocols undermines the validity of cross-study performance comparisons. (Standardization Deficit), and 3. Neglect of critical market structure factors, resulting in inflated performance metrics that lack practical applicability. (Real-World Mismatch). Addressing these limitations, we propose FinTSB, a comprehensive and practical benchmark for financial time series forecasting (FinTSF). To increase the variety, we categorize movement patterns into four specific parts, tokenize and pre-process the data, and assess the data quality based on some sequence characteristics. To eliminate biases due to different evaluation settings, we standardize the metrics across three dimensions and build a user-friendly, lightweight pipeline incorporating methods from various backbones. To accurately simulate real-world trading scenarios and facilitate practical implementation, we extensively model various regulatory constraints, including transaction fees, among others. Finally, we conduct extensive experiments on FinTSB, highlighting key insights to guide model selection under varying market conditions. Overall, FinTSB provides researchers with a novel and comprehensive platform for improving and evaluating FinTSF methods. The code is available at https://github.com/TongjiFinLab/FinTSBenchmark.
1. Introduction
Financial time series (FinTS) forecasting stands as a pivotal pillar within the realm of quantitative finance, offering profound insights that underpin the formulation of lucrative investment strategies (Zou et al., 2023; Xia et al., 2024a; Cheng et al., 2018, 2022; Zhu et al., 2024b, a). Unlike general time series prediction challenges (Hu et al., 2024; Liu et al., 2024c; Dai et al., 2024; Hu et al., 2025b), stock prices are not merely statistical series but the manifestation of complex, often chaotic human behavior shaped by many cognitive, emotional, and sociopolitical factors. Accurately forecasting future returns amidst this maelstrom of data can unlock extraordinary financial gains, positioning it as an invaluable tool for strategic decision-making. As a result, FinTSF has emerged as a cutting-edge domain of scholarly exploration, drawing intense interest from the global research community.
for descendants=anchor=west,child anchor=west, grow=east,anchor=north,parent anchor=south, l sep=1cm, for tree=fill=white, draw=blue, rounded corners, inner sep=5pt, scale=0.75, [root,rotate=90, content=Financial Time Series Forecasting Methods, [,content=⑥ LLM-Based Methods, text width=1.6cm, text centered, parent anchor=east,grow=east [,content=LLM-based MAS: FinCon (Yu et al., 2024), TradingGPT (Li et al., 2023), FinMem (Li et al., 2024c), …, text width=5cm] [,content=LLM as a Predictor: TimeMoe (Shi et al., 2025), …, text width=5cm ] [,content=LLM as a Enhancer: CausalStock (Li et al., 2024b), FinAgent (Zhang et al., 2024), …, text width=5cm ] ] [,content=⑤ Generative-Based Methods: FactorVAE (Duan et al., 2022), DiffStock (Daiya et al., 2024), Diffsformer (Gao et al., 2024), Market-GAN (Xia et al., 2024b), …, text width=8cm] [,content=④ RL-Based Methods: AlphaStock (Wang et al., 2019), FinRL (Liu et al., 2021), DeepTrader (Wang et al., 2021), FreQuent (Jeon et al., 2024), IMM (Niu et al., 2024), …, text width=7cm] [,content=③ DL-Based Methods, text width=1.4cm, text centered, parent anchor=east,grow=east [,content=MASTER (Li et al., 2024a), CI-STHPAN (Xia et al., 2024a), VGNN (Xing et al., 2024), …, text width=2.3cm, parent anchor=east,grow=east [,content=Inter-Stock Corr.] [,content=Temporal Features, ] ] ] [,content=② ML-Based Methods: XGBoost (Chen and Guestrin, 2016), SVM (Lin et al., 2013), …] [,content=① Classic Strategies: CSM (Jegadeesh and Titman, 1993), BLSW (Poterba and Summers, 1988), …] ] \Description..
Financial time series refers to a sequence of data points ordered chronologically, typically representing asset price factors or market indicators, that reflect the dynamic behavior of financial markets. As shown in Fig. 1, existing FinTSF methods can be broadly categorized into six types based on their underlying backbone approach. Early methods were primarily rooted in classic strategies derived from practitioner experience, ① classic quantitative trading strategies such as momentum (Jegadeesh and Titman, 1993) and mean reversion (Poterba and Summers, 1988) strategies. ② machine learning-based methods (Lin et al., 2013; Deng et al., 2023; Illa et al., 2022) include a wide range of algorithms, including autoregressive models like ARIMA (Box et al., 1968) and tree-based models like XGBoost (Chen and Guestrin, 2016), LightGBM (Ke et al., 2017), and Random Forests (Zheng et al., 2024), each of which offers distinct advantages in capturing non-linear relationships in financial data. In recent years, ③ deep learning-based methods (Li et al., 2024a; Zhu et al., 2024a; Xia et al., 2024a; Hu et al., 2025b; Liu et al., 2024c; Xiang et al., 2022; Yan and Tan, 2024) have demonstrated state-of-the-art (SOTA) performance by leveraging various neural network architectures (e.g. RNN, CNN, Transformer, Mamba, GNN) to model both stock features and inter-stock correlations, becoming a dominant paradigm in the FinTSF field. Moreover, ④ reinforcement learning-based methods (Schulman et al., 2017; Wang et al., 2021; Soleymani and Paquet, 2021; Liu et al., 2021; Pan et al., 2024) have also emerged as another promising direction to better optimize sequential decision making processes and end-to-end optimization of some key non-differentiable metrics (such as the sharpe ratio, maximum drawdown). Additionally, to better capture the inherent noise and uncertainty within financial markets, ⑤ generative model-based methods (Duan et al., 2022; Hirshleifer et al., 2024; Huang et al., 2024; Daiya et al., 2024; Gao et al., 2024), such as Variational Autoencoders (VAE) and Diffusion Models, have been adapted to reflect the heightened levels of uncertainty characteristic of the market, accounting for the low signal-to-noise FinTS. Recently, Large Language Models (LLMs) have attracted considerable attention due to their ability to process vast amounts of unstructured data and perform sophisticated reasoning. ⑥ LLM-based methods have found diverse applications in FinTSF, including: as an enhancer (Li et al., 2024b; Zhang et al., 2024), where they utilize news sentiment and other textual information to augment decision making; as a predictor (Liu et al., 2024a; Shi et al., 2025), where they leverage extensive time series training to generalize effectively across different domains; and in LLM-based multi-agent systems (MAS) (Yu et al., 2024; Li et al., 2024c, 2023), where autonomous agents are employed to replicate decision-making processes, communication, and interactions.
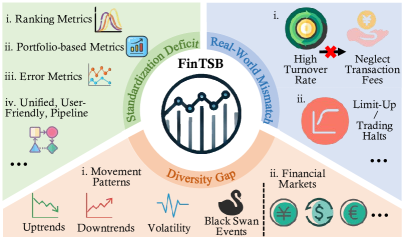
As the number of proposed methods expands across various settings, the demand for comprehensive and practical empirical evaluations has correspondingly increased. However, as depicted in Fig. 2, existing evaluation frameworks often face challenges such as Diversity Gap, Standardization Deficit, and Real-World Mismatch, which hinder their ability to fully assess the performance of these methods in real-world contexts. To address these limitations, we introduce FinTSB, a novel evaluation framework designed to enhance the robustness and applicability of empirical assessments, thereby improving the evaluation capabilities in FinTSF.
..
Issue ❶: Diversity Gap. Given the inherent complexity of financial markets, which often include different phases of stock movement such as uptrends, downtrends, periods of volatility, and extreme events (black swan events), current evaluation datasets face several limitations. On the one hand, some datasets contain only three to five years of historical data, which fails to comprehensively represent all possible movement patterns, thus hindering the generalization capacity of models and preventing them from effectively handling unseen patterns in the training set. On the other hand, datasets covering over a decade of data suffer from severe distribution shifts, resulting in reduced model accuracy when confronted with current market conditions. These shortcomings prevent existing evaluations from providing a complete picture of stock movement behavior. In addition, FinTS exhibits distinct characteristics in different markets. For example, the Chinese stock market is often characterized by high retail participation and higher volatility, while the U.S. market tends to have a more balanced mix of institutional and retail investors with a generally higher degree of efficiency. Some existing works evaluate models in only one market, which does not provide a holistic view of their performance.
Our approach emphasizes the diversity of FinTS, focusing on both the comprehensiveness of movement patterns and the broad scope of financial markets. This allows for a more thorough assessment of model performance. Specifically, in terms of movement patterns, we advocate a fine-grained analysis of how different methods perform over different periods of market volatility, with the aim of more accurately reflecting real-world scenarios.
..
Issue ❷. Standardization Deficit: In the existing literature, discrepancies in evaluation criteria lead to inconsistencies in performance comparisons. To address this issue, we classify the current evaluation metrics into three main categories: ranking metrics, which assess the distribution between predicted and actual daily returns; portfolio-based metrics, which evaluate the profitability and risk of investment strategies derived from predictions; and error metrics, which quantify the degree of approximation between predicted and true values. Nevertheless, it is important to note that forecasting errors show little correlation with overall investment returns.
On top of that, current FinTSF methods lack a standardized pipeline for evaluation. Evaluating SOTA models often requires re-running them on proprietary datasets and settings, which is both time-consuming and labor-intensive. In addition, factors such as differences in data pre-processing, feature engineering, and model tuning further complicate fair comparisons. While the Qlib (Yang et al., 2020) framework offers a wealth of practical tools, its steep learning curve remains a significant barrier. There is an urgent need for a unified, user-friendly, and lightweight evaluation framework in FinTSF, similar to those found in general time series forecasting fields, such as TSLib (Wang et al., 2024a) and TFB (Qiu et al., 2024).
Issue ❸: Real-World Mismatch. The ultimate goal of FinTSF methods is to be deployed in real-world trading scenarios and to generate actual investment returns in the highly competitive, human-brain-armed environment of financial markets. As a result, there are stringent requirements for simulating realistic trading conditions. Existing research often overlooks these constraints, resulting in overly optimistic portfolio metrics. For example, some models still assume short selling in the Chinese A-share market, which is impractical due to restrictions in certain sectors. Moreover, many studies do not take transaction fees into account, which is particularly critical when constructing portfolios based on the prediction of stocks with top- returns. High turnover rates without considering transaction costs can result in significant overlooked expenses that negatively impact the profitability of the strategy. Furthermore, many works neglect trading restrictions such as limit-ups or trading halts, which are common in various markets and can have a profound effect on trading strategies. Thus, we emphasize the necessity of incorporating these real-world constraints into evaluations to ensure more objective and accurate assessments of model performance.
The importance of benchmarking in any field cannot be overstated, as it provides a common basis for comparing the performance of different approaches. Similar to computer vision, where benchmarks such as ImageNet (Deng et al., 2009) or COCO (Lin et al., 2015) provide standardized datasets against which models can be evaluated, the absence of a consistent benchmark in FinTSF leads to fragmented and incomparable results. Without a standardized evaluation, it becomes difficult to gauge the true effectiveness of models in real-world applications. By addressing the three key issues of establishing a consistent dataset for fair comparisons, ensuring comprehensive evaluation metrics, and considering real-world trading constraints, the FinTSF community will be able to establish a solid foundation for model assessment, ultimately advancing the field and improving its applicability in real-world investment scenarios.
Building on the above motivations, we propose FinTSB, a comprehensive and practical financial time series benchmark. This dataset first tokenizes sensitive information and then pre-processes real historical stock data from multiple financial markets to mitigate distribution shifts. It categorizes the data into four distinct movement patterns based on daily change rates and assesses the data quality through sequence-based metrics. Additionally, we conduct fair and robust evaluations of a diverse set of FinTSF methods, including all six different backbone models, and derive insightful and critical research conclusions. In a nutshell, our contributions are as follows:
-
•
Diversity Inclusion. We collect and pre-process tokenization historical financial time series data to provide FinTSB, which captures all types of movement patterns across various markets.
-
•
Standardization Consistency. We advocate for a comprehensive evaluation of the capabilities of various methods from three perspectives: ranking, portfolio, and error, which ensures a holistic assessment.
-
•
Real-World Alignment. We meticulously design investment strategies that align with real-world market conditions, facilitating practical implementation in actual trading environments.
-
•
In-depth Evaluation. We evaluate a wide range of FinTSF methods and extract key insights that advance the understanding of model performance in the context of financial time series forecasting.
The paper is organized in the following manner: Sec. 2 provides a review of related work, while Sec. 3 introduces the definitions of FinTSF tasks and relevant concepts. In Sec. 4, we present the design of FinTSB, and Sec. 5 evaluates existing FinTSF methods using our benchmark. Finally, Sec. 6 concludes the paper.
..
2. Related Work
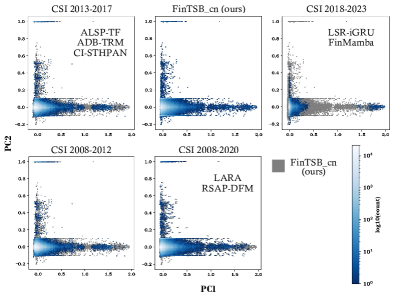
To date, there remains a significant gap in the availability of a comprehensive dataset of financial time series. Existing studies typically focus on specific slices of historical stock data for their experiments. For example, ALSP-TF (Wang et al., 2022), ADB-TRM (Chen et al., 2024), and CI-STHPAN (Xia et al., 2024a) utilize New York Stock Exchange (NYSE) and NASDAQ stocks for the period from 2013 to 2017. Meanwhile, MASTER (Li et al., 2024a), FactorVAE (Duan et al., 2022), LARA (Zeng et al., 2024), and RSAP-DFM (Xiang et al., 2024) select data from the Chinese A-share market, but with distinct temporal ranges: MASTER (Li et al., 2024a) covers 2008 to 2022, FactorVAE (Duan et al., 2022) covers 2010 to 2020, and both LARA (Zeng et al., 2024) and RSAP-DFM (Xiang et al., 2024) cover 2008 to 2020. Similarly, LSR-iGRU (Zhu et al., 2024a), FinMamba (Hu et al., 2025a), and MCI-GRU (Zhu et al., 2024b), as well as THGNN (Xiang et al., 2022), focus on stocks from both the Chinese and U.S. markets, with time slices ranging from 2018 to 2023 and 2016 to 2021, respectively. Qlib (Yang et al., 2020) provides a wealth of raw data and factor data, from which users can extract the segments they need. The varying time horizons of these data slices pose a challenge to consistent and fair evaluations. Furthermore, after applying Principal Component Analysis (PCA) (Abdi and Williams, 2010) for dimensionality reduction, we visualized FinTSB and other time-sliced stocks as a hexbin plot in Fig. 4. The results indicate that FinTSB covers the most cells, suggesting that reliance on sliced historical data lacks diversity. In contrast, FinTSB offers more comprehensive coverage, thus effectively capturing the complex distribution of financial time series.
3. Preliminaries
In this section, we will introduce some related concepts and formally define the problem of financial time series forecasting.
3.1. Problem Definition
Definition 1. Stock Context.
Let the set of all stocks be denoted as , where is a specific stock, is the total number of stocks, is the length of the lookback window and is the number of features. For each stock , its data on trading day is represented by , with the closing price as one of the features. The one-day return ratio is given by . On any trading day , stocks are ranked according to their underlying scores . If , then , establishes an overall ranking based on return ratios. This ranking reflects the expected investment returns for each stock on day , where stocks that achieve higher ranking scores are expected to achieve a higher investment revenue (profit) on day .
Problem 1. Financial time series forecasting.
Formally, given the stock-specific time series information of , the goal is to develop a ranking function that predicts the scores for the next day, ordering the stocks by their expected profitability.
3.2. Sequence Characteristics
To explore the intrinsic properties of financial time series data, we introduce the following sequence characteristics. This allows for a more thorough evaluation of the sophisticated dynamics within stock market behavior, providing deeper insights into the underlying patterns and trends that drive financial assets.
Characteristic 1. Movement Patterns.
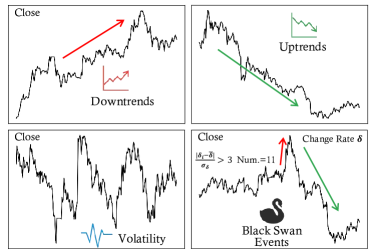
Based on the daily return ratio , derived from the closing price changes, FinTS can be categorized into different periods, each characterized by a dominant movement pattern, including uptrends, downtrends, periods of volatility, and extreme events. Specifically, uptrends are characterized by a higher frequency of trading days with positive , while downtrends are marked by a higher frequency of trading days with negative . Extreme events are defined by significant fluctuations in , representing periods of sharp price movements. Conversely, periods of volatility are identified by a roughly equal number of positive and negative , indicating more frequent market fluctuations without a clear directional trend.
Characteristic 2. Non-Stationarity.
It is well known that stock data, due to their inherent volatility and external influences, typically exhibit non-stationarity, reflecting complex, time-varying patterns that defy simple statistical modeling. Such time series are considered to be integrated of order , denoted as , if it becomes stationary after applying times differences. For example, a stock series is if its first difference is stationary. To test for non-stationarity, the Augmented Dickey-Fuller (ADF) test (Mushtaq, 2011) is commonly employed. It tests the null hypothesis of the presence of a unit root, indicating non-stationarity:
| (1) |
Where is the differenced series, represents the coefficient of the lagged series, and is the error term. A rejection of the null hypothesis () indicates stationarity, while a failure to reject it indicates non-stationarity. A smaller ADF test result indicates more stationary time series data.
Characteristic 3. Autocorrelation.
Autocorrelation (Madsen, 2007) measures the correlation between a time series and its lagged values. Strong autocorrelation suggests that past values of the series have a significant influence on future values, which can be valuable for predictive modeling and identifying underlying patterns. Mathematically, this can be expressed as:
| (2) |
Characteristic 4. Forecastability.
Forecasting is inextricably linked to the time domain. Following ForeCA (Goerg, 2013), we can leverage frequency domain properties to assess the forecastability of a time series. A higher value indicates that series exhibits a lower forecast uncertainty as measured by the entropy.
| (3) |
where denotes the entropy derived from the Fourier decomposition of the time series.
| Movement Patterns | Non-Stationarity | Autocorrelation | Forecastability | Split |
|---|---|---|---|---|
| Uptrends | -12.35 | 0.678 | 0.187 | 7:1:2 |
| Downtrends | -16.25 | 0.681 | 0.092 | 7:1:2 |
| Volatility | -15.63 | 0.676 | 0.112 | 7:1:2 |
| Extreme | -15.48 | 0.639 | 0.068 | 7:1:2 |
4. FinTSB
4.1. Dataset Details
4.1.1. Dataset Construction
We construct the FinTSB dataset by tokenizing and pre-processing a large amount of raw stock data. Specifically, we first divide 15 years of historical stock data into non-overlapping segments to prevent data leakage. Then, we calculate the daily return (change rate) for each stock and, based on this metric, categorize the stocks in each fixed 250-day segment into one of four distinct movement patterns. If there are extreme outliers in the change rate, the stocks are classified as black swan events. Next, we rank the remaining stocks based on a positive change rate, selecting the top 300 as uptrends, the bottom 300 as downtrends, and the remaining 300 as periods of volatility. Afterward, we compute sequence characteristics for each pattern and select the five most appropriate ones. It is important to note that in the pre-processing stage, we need to avoid future information leakage, which necessitates normalization at the stock dimension for each trading day, rather than across the time dimension. Through the above steps, we generate five smaller datasets for each of the four movement patterns, resulting in a total of 20 datasets in the FinTSB. This ensures that FinTSB is comprehensive and diverse, accurately reflecting the dynamics of the financial market.
4.1.2. Dataset Overview
The benchmark, FinTSB, contains a total of 20 datasets, representing four different movement patterns, with each dataset containing 300 stocks over 250 consecutive trading days. We have carefully designed the dataset selection strategy to ensure that there is no overlap between any two datasets. During training, each dataset is split into training, validation, and test sets in a 7:1:2 ratio. The statistics for each movement pattern are summarized in Tab. 1. All patterns exhibit strong non-stationarity, with extreme event patterns being particularly prominent, highlighting the low signal-to-noise ratio typical of financial data. Autocorrelation measures the degree to which a stock’s past price movements influence its future behavior. It can be observed that stocks in the uptrend and downtrend patterns tend to exhibit higher autocorrelation, reflecting the persistence of their directional movements, while stocks in volatile periods show weaker autocorrelation due to frequent reversals. The predictability of different movement patterns varies significantly, with uptrends and downtrends generally being more predictable, while periods of volatility and extreme events pose greater forecasting challenges due to their inherent unpredictability and the occurrence of abrupt, large price movements. Overall, FinTSB encompasses a wide variety of sequence indicators, ensuring that it captures the multifaceted nature of FinTS. By integrating these key characteristics, FinTSB enables the exploration of diverse forecasting challenges.
4.2. Comparison Baselines
To investigate the advantages and limitations of different methods, as well as their adaptability across different patterns, our evaluation covers the six categories of methods mentioned previously. For classic strategies, we choose CSM (Jegadeesh and Titman, 1993) and BLSW (Poterba and Summers, 1988). In terms of ML-based methods, we include XGBoost (Chen and Guestrin, 2016), LightGBM (Ke et al., 2017), DoubleEnsemble (2020) and ARIMA (Box et al., 1968). Among DL-based methods, we choose Linear, LSTM (Hochreiter and Schmidhuber, 1997), ALSTM (Qin et al., 2017), GRU (Chung et al., 2014), GCN (Kipf and Welling, 2016), GAT (Velickovic et al., 2017), TCN (Bai et al., 2018), Transformer (Vaswani et al., 2017), Mamba (Gu and Dao, 2024), PatchTST (Nie et al., 2023), Crossformer (Zhang and Yan, 2023), iTransformer (Liu et al., 2024b), AMD (Hu et al., 2024), PDF (Dai et al., 2024), Localformer (Zhao et al., 2024). For RL-based methods, we include PPO (Schulman et al., 2017), DDPG (Lillicrap et al., 2019), SAC (Haarnoja et al., 2019) and DQN (Carta et al., 2021). For Generative-based methods, we choose DDPM (Ho et al., 2020), DDIM (Song et al., 2020) and FactorVAE (Duan et al., 2022). For LLM-based methods, we include Timer (Liu et al., 2024d), Time-MoE (Shi et al., 2025) and Chronos (Ansari et al., 2024).
4.3. Evaluation Metrics
Existing work on FinTSF evaluation varies. To achieve a consistent and comprehensive assessment of forecast performance, we employ eleven metrics across three dimensions, including ranking, portfolio, and error. The detailed explanation is provided below.
4.3.1. Ranking Metrics
Ranking metrics systematically assess the performance of predicted ranking scores (returns) in quantitative research, measuring both cross-sectional and predictive power.
Information Coefficient (IC) quantifies the directional alignment between and subsequent true returns , calculated as the Spearman correlation coefficient. It evaluates the raw predictive power of scores , with statistically significant positive IC values indicating economically meaningful forecasting power.
| (4) |
Information Coefficient Information Ratio (ICIR) measures the stability of the performance of by comparing the annualized mean IC with its temporal volatility. ()
Rank Information Coefficient (RankIC) is the Spearman correlation metric that employs dual-ranking normalization: both and are converted to uniform percentile ranks before calculating the correlation. This process eliminates scaling artifacts and reduces sensitivity to outlier bias, which is particularly beneficial when analyzing non-linear factor-response relationships.
| (5) |
where is the rank function.
Rank Information Coefficient Information Ratio (RankICIR) evaluates the reliability of rank-based relationships between and . ()
4.3.2. Portfolio-Based Metrics
Portfolio-based metrics evaluate the performance and risk characteristics of investment strategies through simulated portfolio implementation. These metrics provide a perspective for assessing both absolute and risk-adjusted returns, drawdown behavior, and strategy efficiency of FinTSF methods.
Annualized Return Ratio (ARR) measures the geometric mean return of a strategy annualized over the evaluation period and serves as the primary indicator of strategy profitability. ()
Annualized Volatility (AVol) quantifies the dispersion of strategy returns and captures the consistency of performance delivery, with lower values indicating more stable return streams. denotes the daily return of the portfolio. ()
Maximum Draw Down (MDD) represents the largest peak-to-trough decline () in portfolio value over the evaluation period and is critical in assessing the strategy’s risk tolerance and ability to preserve capital. ()
Annualized Sharpe Ratio (ASR) measures the excess return per unit of total risk, assessing risk-adjusted performance. ()
Information Ratio (IR) assesses the ability to generate excess returns relative to a benchmark and the effectiveness of active management. , where is the daily return of the market index.
4.3.3. Error Metrics
Some reviewers emphasize the use of mean square error (MSE) and mean absolute error (MAE) to quantify the discrepancy between predicted and actual returns . However, it is important to note that a lower MSE or MAE does not guarantee profitability; market impact, position sizing rules and transaction costs ultimately determine the success of the strategy. The formulations are: , .
4.4. Unified Pipeline
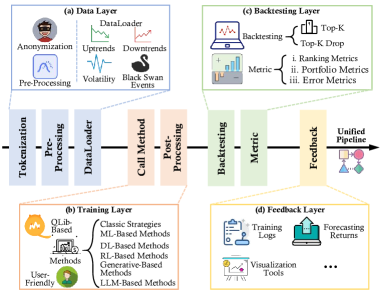
As discussed in Issue ❷, the use of divergent evaluation criteria has led to differences in model performance. To ensure a fair, comprehensive, and practical evaluation, we introduce a unified pipeline that is structurally divided into the data layer, the training layer, the backtesting layer, and the feedback layer. A detailed description of each module is provided below.
..
Data Layer stores comprehensive market information in FinTSB, encompassing four different movement patterns. For data pre processing, we implement tokenization (anonymization) and normalization operations. The dataloader dynamically constructs global training/validation/test sets based on the selected movement modes. Researchers can evaluate model performance under identical market conditions by maintaining consistent modes for training and testing phases. Cross-pattern evaluation through transfer learning (training on selected patterns and testing on others) enables granular analysis of strategy adaptability across market regimes, which is particularly valuable for assessing model generalization capabilities. Additionally, historical stock market data verification validates model effectiveness in real-world financial scenarios.
| FinTSB Evaluation | ||||||||||||
|---|---|---|---|---|---|---|---|---|---|---|---|---|
| Error Metrics | Ranking Metrics | Portfolio-Based Metrics | ||||||||||
| Methods | MSE | MAE | IC | ICIR | RankIC | RankICIR | ARR | AVol | MDD | ASR | IR | |
| Classic | BLSW (1988) | - | - | - | - | - | - | 0.152 | 0.120 | -0.061 | 0.865 | 0.000 |
| Strategies | CSM (1993) | - | - | - | - | - | - | -0.143 | 0.115 | -0.075 | -1.409 | -0.559 |
| ML-Based Methods | ARIMA (1968) | 0.017 | 0.382 | 0.0002 | 0.055 | 0.0003 | 0.023 | 0.062 | 0.088 | -0.139 | 0.776 | 0.0002 |
| XGBoost (2016) | 0.015 | 0.365 | 0.098 | 0.308 | 0.095 | 0.283 | 0.221 | 0.136 | -0.142 | 1.628 | 0.047 | |
| LightGBM (2017) | 0.016 | 0.382 | 0.109 | 0.533 | 0.086 | 0.345 | 0.171 | 0.102 | -0.196 | 1.679 | 0.109 | |
| DoubleEnsemble (2020) | 0.017 | 0.383 | 0.011 | 0.122 | 0.081 | 0.122 | 0.191 | 0.105 | -0.135 | 1.813 | 0.114 | |
| Linear (Ridge) | 0.012 | 0.325 | 0.007 | 0.061 | 0.008 | 0.099 | 0.026 | 0.140 | -0.129 | 0.186 | 0.073 | |
| Linear (NNLS) | 0.017 | 0.382 | 0.013 | 0.146 | 0.009 | 0.166 | 0.072 | 0.105 | -0.127 | 0.686 | 0.013 | |
| LSTM (1997) | 0.165 | 0.331 | 0.028 | 0.421 | 0.015 | 0.275 | 0.198 | 0.095 | -0.268 | 2.083 | 0.125 | |
| Adv-LSTM (2017) | 0.167 | 0.335 | -0.005 | -0.092 | 0.001 | -0.004 | 0.124 | 0.084 | -0.282 | 1.472 | -0.022 | |
| GRU (2014) | 0.166 | 0.332 | 0.002 | 0.034 | 0.007 | 0.121 | 0.179 | 0.093 | -0.199 | 1.937 | 0.009 | |
| TCN (2018) | 0.166 | 0.332 | 0.006 | 0.093 | 0.004 | 0.071 | 0.148 | 0.092 | -0.259 | 1.611 | 0.027 | |
| GCN (2016) | 0.083 | 0.250 | 0.005 | 0.075 | 0.002 | 0.029 | 0.093 | 0.084 | -0.248 | 1.105 | 0.005 | |
| DL-Based | GAT (2017) | 0.166 | 0.332 | 0.014 | 0.245 | 0.009 | 0.167 | 0.250 | 0.091 | -0.197 | 2.746 | 0.014 |
| Methods | Transformer (2017) | 0.167 | 0.335 | -0.009 | -0.099 | 0.004 | 0.001 | 0.141 | 0.082 | -0.214 | 1.720 | -0.040 |
| Mamba (2024) | 0.165 | 0.329 | 0.013 | 0.184 | 0.018 | 0.288 | 0.178 | 0.093 | -0.249 | 1.915 | 0.013 | |
| PatchTST (2023) | 0.166 | 0.333 | 0.008 | 0.147 | 0.006 | 0.113 | 0.148 | 0.085 | -0.200 | 1.739 | 0.036 | |
| Crossformer (2023) | 0.163 | 0.329 | 0.002 | 0.035 | -0.001 | -0.007 | 0.069 | 0.082 | -0.231 | 1.175 | 0.009 | |
| SegRNN (2023) | 0.166 | 0.328 | -0.002 | -0.027 | 0.012 | 0.169 | 0.167 | 0.094 | -0.193 | 1.765 | -0.009 | |
| PDF (2024) | 0.165 | 0.332 | 0.022 | 0.391 | 0.018 | 0.329 | 0.209 | 0.092 | -0.135 | 2.277 | 0.098 | |
| TimeMixer (2024b) | 0.165 | 0.330 | 0.015 | 0.249 | 0.107 | 0.187 | 0.200 | 0.088 | -0.212 | 2.274 | 0.067 | |
| Localformer (2024) | 0.162 | 0.328 | 0.044 | 0.646 | 0.037 | 0.662 | 0.355 | 0.100 | -0.102 | 3.562 | 0.044 | |
| Generative-Based Methods | DDPM (2020) | 0.163 | 0.328 | 0.026 | 0.451 | 0.023 | 0.413 | 0.198 | 0.084 | -0.147 | 2.353 | 0.026 |
| DDIM (2020) | 0.166 | 0.333 | 0.002 | 0.043 | 0.003 | 0.044 | 0.112 | 0.084 | -0.245 | 1.335 | 0.002 | |
| FactorVAE (2022) | 0.167 | 0.334 | -0.004 | -0.061 | -0.004 | -0.077 | 0.093 | 0.081 | -0.220 | 1.146 | -0.004 | |
| Timer (2024d) | 0.020 | 0.431 | 0.006 | 0.083 | 0.006 | 0.092 | 0.230 | 0.084 | -0.123 | 2.756 | 0.006 | |
| Time-MoE (2025) | 0.022 | 0.483 | 0.003 | 0.062 | 0.003 | 0.058 | 0.164 | 0.084 | -0.129 | 1.964 | 0.003 | |
| Time-MoE (2025) | 0.023 | 0.493 | 0.004 | 0.081 | 0.004 | 0.082 | 0.145 | 0.083 | -0.124 | 1.756 | 0.004 | |
| Chronos-T5 (2024) | 0.017 | 0.387 | 0.011 | 0.174 | 0.013 | 0.205 | 0.291 | 0.090 | -0.126 | 3.238 | 0.011 | |
| Chronos-T5 (2024) | 0.017 | 0.387 | 0.010 | 0.163 | 0.013 | 0.197 | 0.219 | 0.088 | -0.098 | 2.497 | 0.010 | |
| LLM-Based | Chronos-T5 (2024) | 0.017 | 0.386 | 0.009 | 0.144 | 0.011 | 0.180 | 0.227 | 0.089 | -0.148 | 2.549 | 0.009 |
| Methods | Chronos-T5 (2024) | 0.017 | 0.387 | 0.009 | 0.149 | 0.011 | 0.167 | 0.210 | 0.088 | -0.135 | 2.394 | 0.010 |
| Chronos-T5 (2024) | 0.017 | 0.387 | 0.013 | 0.199 | 0.015 | 0.225 | 0.314 | 0.087 | -0.114 | 3.593 | 0.013 | |
| Chronos-bolt (2024) | 0.017 | 0.393 | 0.015 | 0.234 | 0.015 | 0.241 | 0.296 | 0.089 | -0.099 | 3.331 | 0.015 | |
| Chronos-bolt (2024) | 0.017 | 0.395 | 0.013 | 0.202 | 0.013 | 0.194 | 0.303 | 0.088 | -0.094 | 3.457 | 0.013 | |
| Chronos-bolt (2024) | 0.017 | 0.393 | 0.014 | 0.230 | 0.015 | 0.238 | 0.356 | 0.090 | -0.080 | 3.968 | 0.014 | |
| Chronos-bolt (2024) | 0.017 | 0.390 | 0.017 | 0.277 | 0.018 | 0.292 | 0.366 | 0.085 | -0.097 | 4.327 | 0.017 | |
Training Layer integrates dozens of canonical models built on six heterogeneous backbone architectures. We extend Qlib’s foundation by designing an easy-to-use and unified training pipeline that ensures evaluation consistency. The framework maintains model-agnostic compatibility - researchers employing FinTSF paradigm can seamlessly integrate their new models while maintaining evaluation impartiality. In particular, we implement parameter encapsulation through dedicated configuration modules rather than monolithic config files/main functions, significantly enhancing code readability and customization flexibility.
Backtesting Layer currently incorporates two classic strategies: Top and Top-Drop, with transaction cost simulations reflecting real market conditions. Through multi-dimensional evaluation spanning prediction errors (2 metrics), ranking accuracy (4 metrics), and portfolio performance (5 metrics), we comprehensively quantify model capabilities across 11 rigorously wide-used indicators.
Feedback Layer systematically archives training logs, preserves prediction results, and provides interactive visualization tools. This design facilitates continuous model optimization by tracking performance across training iterations, enables comparative analysis through standardized results formats, and supports decision-making via intuitive graphical representations of strategy behavior.
Users only need to deploy their method at the training layer and configure the configuration file, then FinTSB can automatically run the pipeline in Fig. 5, enabling to better understand, compare, and select FinTSF methods for specific financial scenarios.
5. Expeiments
5.1. Experiment Setup
Our experiment is trained on the NVIDIA A100 GPU for LLM-based methods and NVIDIA V100 GPU for others, and all models are built using PyTorch (Paszke et al., 2019). The training, validation, and test sets (from FinTSB) are kept consistent for all models. The lookback horizon is set to and we will predict the returns on the next trading day. For each method, we adhere to performing hyperparameter searches across multiple sets for optimal results. The training process employs a dual-objective optimization framework, simultaneously minimizing a composite loss function that integrates both point-wise regression loss and pair-wise ranking loss. These complementary objectives are balanced through an adaptive weighting coefficient , which is set to .
..
5.2. Trading Protocols
We adopt the Top-Drop strategy (Yang et al., 2020) to maintain a portfolio on each trading day. The Top-Drop strategy improves upon Top strategy by dynamically optimizing portfolio turnover. Rather than fully rebalancing holdings daily, it retains stocks that persistently rank in the top- cohort and only replaces underperformers. This reduces the frequency of transactions, thereby lowering commission costs in proportion to the actual turnover rate, and maintains exposure to stocks with sustained high scores, avoiding unnecessary exits. Formally, on trading day , Top-Drop constructs an equal-weighted portfolio of stocks , which are selected according to the rank of predicted returns . Given the turnover constraint, the number of intersection stocks is required to fulfill the condition . In our experiment, we set at one tenth of the total number of stocks, i.e., , and is set to . Furthermore, we charge a transaction fee at a rate of , in line with standard market practice.
| Tested on CSI 300 in 2024, trained on FinTSB. | |||||||
|---|---|---|---|---|---|---|---|
| Ranking Metrics | Portfolio-Based Metrics | ||||||
| Methods | IC | ICIR | ARR | AVol | MDD | ASR | IR |
| LSTM (1997) | 0.008 | 0.062 | 0.163 | 0.208 | -0.159 | 0.782 | 0.008 |
| Adv-LSTM (2017) | -0.012 | -0.087 | 0.167 | 0.250 | -0.180 | 0.666 | -0.012 |
| TCN (2018) | -0.008 | 0.078 | 0.109 | 0.309 | -0.243 | 0.351 | -0.008 |
| GAT (2017) | -0.012 | -0.083 | 0.224 | 0.220 | -0.128 | 1.019 | -0.012 |
| Transformer (2017) | 0.015 | 0.103 | 0.242 | 0.199 | -0.131 | 1.215 | 0.015 |
| PatchTST (2023) | 0.004 | 0.025 | 0.190 | 0.243 | -0.125 | 0.784 | 0.004 |
| SegRNN (2023) | 0.001 | 0.004 | 0.064 | 0.208 | -0.162 | 0.306 | 0.001 |
| PDF (2024) | 0.005 | 0.032 | 0.144 | 0.261 | -0.198 | 0.551 | 0.005 |
| TimeMixer (2024b) | -0.003 | -0.040 | 0.168 | 0.251 | -0.195 | 0.671 | -0.004 |
| Localformer (2024) | 0.003 | 0.032 | 0.195 | 0.222 | -0.168 | 0.878 | 0.003 |
| DDPM (2020) | -0.009 | -0.126 | 0.124 | 0.242 | -0.188 | 0.512 | -0.009 |
| DDIM (2020) | -0.003 | -0.038 | 0.040 | 0.225 | -0.148 | 0.176 | -0.003 |
5.3. Experiment Results
The performance results of various FinTSF methods are reported in Tab. 2. We observe that no single method achieves the best performance across all three dimensional metrics. There is significant performance heterogeneity among different methods, even within the same backbone category, which we attribute to the critical factor of how effectively models capture temporal dependencies and cross-sectional relationships to predict future stock movements. Notably, LLM-based approaches exhibit a paradoxical pattern in which performance initially deteriorates with model scaling but subsequently shows marked improvement at larger scales, suggesting the emergence of financial time series specific capabilities that manifest only beyond critical thresholds of model capacity, possibly due to the need for sufficient parameters to disentangle complex market noise and latent factor interactions. Contrary to expectations, modern deep learning techniques do not universally outperform traditional quantitative strategies or tree-based models, underscoring the necessity for rigorous benchmarking across diverse architectures and temporal regimes. This empirical evidence argues for a more nuanced evaluation framework that takes into account both model scalability and FinTS characteristics.
5.4. Transfer Learning Results
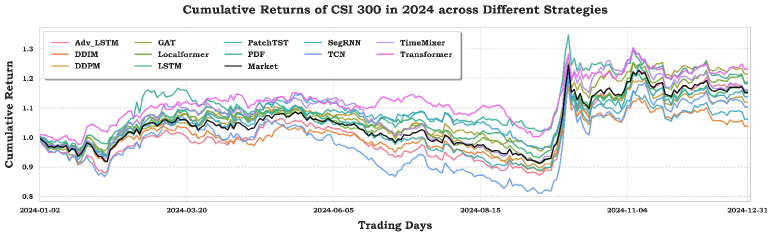
To validate the cross-data generalization capability of FinTSB, we conduct transfer learning experiments by applying models pre-trained on FinTSB to backtest the entire 2024 CSI 300 stock market. The empirical results reveal two key insights. First, as shown by the metrics in Tab. 3 and the cumulative return trajectories in Fig. 6, the model demonstrates remarkable performance consistency across different market regimes. Second, the superior risk-adjusted returns achieved through this zero-shot transfer learning paradigm highlight FinTSB’s unique advantages in both pattern diversity coverage and temporal robustness, establishing it as a comprehensive benchmark for heterogeneous market behaviors spanning bull, bear, and transitional market phases.
5.5. Inference Efficiency
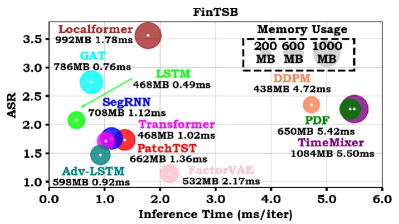
It is well known that quantitative trading in real-world markets places high demands on system latency sensitivity. Given this critical operational requirement, we conducted a comparative visualization analysis of representative algorithmic models in Fig. 7, focusing on three key performance metrics, ASR performance, computational inference efficiency, and memory footprint allocation.
..
6. Conclusion
In this paper, we propose FinTSB, a comprehensive benchmark for FinTSF that addresses three key challenges. By categorizing stock movement patterns into four different types, we ensure a more diverse and representative evaluation, filling the Diversity Gap overlooked in previous studies. Furthermore, we introduce a unified evaluation framework that standardizes performance metrics across multiple dimensions, mitigating the Standardization Deficit and enabling more reliable cross-study comparisons. To bridge the gap between theoretical models and real-world applications, we incorporate critical market structure factors to overcome the Real-World Mismatch that often distorts performance metrics. In general, FinTSB offers a robust platform for advancing the evaluation and development of FinTSF methods, which we believe may pave the way for further research into the practical application of FinTSF.
References
- (1)
- Abdi and Williams (2010) Hervé Abdi and Lynne J Williams. 2010. Principal component analysis. Wiley interdisciplinary reviews: computational statistics 2, 4 (2010), 433–459.
- Ansari et al. (2024) Abdul Fatir Ansari, Lorenzo Stella, Caner Turkmen, Xiyuan Zhang, Pedro Mercado, Huibin Shen, Oleksandr Shchur, Syama Syndar Rangapuram, Sebastian Pineda Arango, Shubham Kapoor, Jasper Zschiegner, Danielle C. Maddix, Michael W. Mahoney, Kari Torkkola, Andrew Gordon Wilson, Michael Bohlke-Schneider, and Yuyang Wang. 2024. Chronos: Learning the Language of Time Series. Transactions on Machine Learning Research (2024). https://openreview.net/forum?id=gerNCVqqtR
- Bai et al. (2018) Shaojie Bai, J Zico Kolter, and Vladlen Koltun. 2018. An empirical evaluation of generic convolutional and recurrent networks for sequence modeling. arXiv preprint arXiv:1803.01271 (2018).
- Box et al. (1968) G. E. P. Box, Gwilym M. Jenkins, and John F. Macgregor. 1968. Some Recent Advances in Forecasting and Control. Journal of The Royal Statistical Society Series C-applied Statistics 17 (1968), 158–179. https://api.semanticscholar.org/CorpusID:227323668
- Carta et al. (2021) Salvatore Carta, Anselmo Ferreira, Alessandro Sebastian Podda, Diego Reforgiato Recupero, and Antonio Sanna. 2021. Multi-DQN: An ensemble of Deep Q-learning agents for stock market forecasting. Expert Systems with Applications (2021).
- Chen and Guestrin (2016) Tianqi Chen and Carlos Guestrin. 2016. XGBoost: A Scalable Tree Boosting System. In Proceedings of the 22nd ACM SIGKDD International Conference on Knowledge Discovery and Data Mining (San Francisco, California, USA) (KDD ’16). Association for Computing Machinery, New York, NY, USA, 785–794. https://doi.org/10.1145/2939672.2939785
- Chen et al. (2024) Weijun Chen, Shun Li, Xipu Yu, Heyuan Wang, Wei Chen, and Tengjiao Wang. 2024. Automatic De-Biased Temporal-Relational Modeling for Stock Investment Recommendation. In Proceedings of the Thirty-Third International Joint Conference on Artificial Intelligence, IJCAI-24, Kate Larson (Ed.). International Joint Conferences on Artificial Intelligence Organization, 1999–2008. https://doi.org/10.24963/ijcai.2024/221 Main Track.
- Cheng et al. (2018) Dawei Cheng, Ye Liu, Zhibin Niu, and Liqing Zhang. 2018. Modeling Similarities Among Multi-Dimensional Financial Time Series. IEEE Access 6 (2018), 43404–43413. https://doi.org/10.1109/ACCESS.2018.2862908
- Cheng et al. (2022) Dawei Cheng, Fangzhou Yang, Sheng Xiang, and Jin Liu. 2022. Financial time series forecasting with multi-modality graph neural network. Pattern Recognition 121 (2022), 108218. https://doi.org/10.1016/j.patcog.2021.108218
- Chung et al. (2014) Junyoung Chung, Caglar Gulcehre, KyungHyun Cho, and Yoshua Bengio. 2014. Empirical Evaluation of Gated Recurrent Neural Networks on Sequence Modeling. arXiv preprint arXiv:1412.3555 (2014).
- Dai et al. (2024) Tao Dai, Beiliang Wu, Peiyuan Liu, Naiqi Li, Jigang Bao, Yong Jiang, and Shu-Tao Xia. 2024. Periodicity Decoupling Framework for Long-term Series Forecasting. International Conference on Learning Representations (2024).
- Daiya et al. (2024) Divyanshu Daiya, Monika Yadav, and Harshit Singh Rao. 2024. Diffstock: Probabilistic Relational Stock Market Predictions Using Diffusion Models. In ICASSP 2024 - 2024 IEEE International Conference on Acoustics, Speech and Signal Processing (ICASSP).
- Deng et al. (2009) Jia Deng, Wei Dong, Richard Socher, Li-Jia Li, Kai Li, and Li Fei-Fei. 2009. ImageNet: A large-scale hierarchical image database. In 2009 IEEE Conference on Computer Vision and Pattern Recognition. 248–255. https://doi.org/10.1109/CVPR.2009.5206848
- Deng et al. (2023) Shangkun Deng, Xiaoru Huang, Yingke Zhu, Zhihao Su, Zhe Fu, and Tatsuro Shimada. 2023. Stock index direction forecasting using an explainable eXtreme Gradient Boosting and investor sentiments. The North American Journal of Economics and Finance (2023).
- Duan et al. (2022) Yitong Duan, Lei Wang, Qizhong Zhang, and Jian Li. 2022. FactorVAE: A Probabilistic Dynamic Factor Model Based on Variational Autoencoder for Predicting Cross-Sectional Stock Returns. Proceedings of the AAAI Conference on Artificial Intelligence (2022).
- Gao et al. (2024) Yuan Gao, Haokun Chen, Xiang Wang, Zhicai Wang, Xue Wang, Jinyang Gao, and Bolin Ding. 2024. DiffsFormer: A Diffusion Transformer on Stock Factor Augmentation. arXiv preprint arXiv:2402.06656 (2024).
- Goerg (2013) Georg M. Goerg. 2013. Forecastable component analysis. In International Conference on Machine Learning (ICML’13). JMLR.org.
- Gu and Dao (2024) Albert Gu and Tri Dao. 2024. Mamba: Linear-Time Sequence Modeling with Selective State Spaces. In First Conference on Language Modeling. https://openreview.net/forum?id=tEYskw1VY2
- Haarnoja et al. (2019) Tuomas Haarnoja, Aurick Zhou, Kristian Hartikainen, George Tucker, Sehoon Ha, Jie Tan, Vikash Kumar, Henry Zhu, Abhishek Gupta, Pieter Abbeel, and Sergey Levine. 2019. Soft Actor-Critic Algorithms and Applications. arXiv preprint arXiv:1812.05905 (2019).
- Hirshleifer et al. (2024) David Hirshleifer, Lin Peng, and Qiguang Wang. 2024. News Diffusion in Social Networks and Stock Market Reactions. The Review of Financial Studies (2024), hhae025. https://doi.org/10.1093/rfs/hhae025
- Ho et al. (2020) Jonathan Ho, Ajay Jain, and Pieter Abbeel. 2020. Denoising diffusion probabilistic models. Advances in neural information processing systems (2020).
- Hochreiter and Schmidhuber (1997) Sepp Hochreiter and Jürgen Schmidhuber. 1997. Long Short-Term Memory. Neural Computation (1997).
- Hu et al. (2025a) Yifan Hu, Peiyuan Liu, Yuante Li, Dawei Cheng, Naiqi Li, Tao Dai, Jigang Bao, and Xia Shu-Tao. 2025a. FinMamba: Market-Aware Graph Enhanced Multi-Level Mamba for Stock Movement Prediction. arXiv preprint arXiv:2502.06707 (2025).
- Hu et al. (2024) Yifan Hu, Peiyuan Liu, Peng Zhu, Dawei Cheng, and Tao Dai. 2024. Adaptive Multi-Scale Decomposition Framework for Time Series Forecasting. arXiv preprint arXiv:2406.03751 (2024).
- Hu et al. (2025b) Yifan Hu, Guibin Zhang, Peiyuan Liu, Disen Lan, Naiqi Li, Dawei Cheng, Tao Dai, Shu-Tao Xia, and Shirui Pan. 2025b. TimeFilter: Patch-Specific Spatial-Temporal Graph Filtration for Time Series Forecasting. arXiv preprint arXiv:2501.13041 (2025).
- Huang et al. (2024) Yu-Hao Huang, Chang Xu, Yang Liu, Weiqing Liu, Wu-Jun Li, and Jiang Bian. 2024. Controllable Financial Market Generation with Diffusion Guided Meta Agent. arXiv preprint arXiv:2408.12991 (2024).
- Illa et al. (2022) Pavan Kumar Illa, Balakesavareddy Parvathala, and Anand Kumar Sharma. 2022. Stock price prediction methodology using random forest algorithm and support vector machine. Materials Today: Proceedings (2022).
- Jegadeesh and Titman (1993) Narasimhan Jegadeesh and Sheridan Titman. 1993. Returns to Buying Winners and Selling Losers: Implications for Stock Market Efficiency. Journal of Finance 48 (1993), 65–91. https://api.semanticscholar.org/CorpusID:13713547
- Jeon et al. (2024) Jihyeong Jeon, Jiwon Park, Chanhee Park, and U Kang. 2024. FreQuant: A Reinforcement-Learning based Adaptive Portfolio Optimization with Multi-frequency Decomposition. In Proceedings of the 30th ACM SIGKDD Conference on Knowledge Discovery and Data Mining (KDD ’24). Association for Computing Machinery.
- Ke et al. (2017) Guolin Ke, Qi Meng, Thomas Finley, Taifeng Wang, Wei Chen, Weidong Ma, Qiwei Ye, and Tie-Yan Liu. 2017. LightGBM: a highly efficient gradient boosting decision tree. In Proceedings of the 31st International Conference on Neural Information Processing Systems (Long Beach, California, USA) (NIPS’17). Curran Associates Inc., Red Hook, NY, USA.
- Kipf and Welling (2016) Thomas N Kipf and Max Welling. 2016. Semi-supervised classification with graph convolutional networks. arXiv preprint arXiv:1609.02907 (2016).
- Li et al. (2024c) Haohang Li, Yangyang Yu, Zhi Chen, Yuechen Jiang, Yang Li, Denghui Zhang, Rong Liu, Jordan W. Suchow, and Khaldoun Khashanah. 2024c. FinMem: A Performance-Enhanced LLM Trading Agent with Layered Memory and Character Design. In ICLR 2024 Workshop on Large Language Model (LLM) Agents. https://openreview.net/forum?id=sstfVOwbiG
- Li et al. (2024b) Shuqi Li, Yuebo Sun, Yuxin Lin, Xin Gao, Shuo Shang, and Rui Yan. 2024b. CausalStock: Deep End-to-end Causal Discovery for News-driven Multi-stock Movement Prediction. In The Thirty-eighth Annual Conference on Neural Information Processing Systems. https://openreview.net/forum?id=5BXXoJh0Vr
- Li et al. (2024a) Tong Li, Zhaoyang Liu, Yanyan Shen, Xue Wang, Haokun Chen, and Sen Huang. 2024a. MASTER: Market-Guided Stock Transformer for Stock Price Forecasting. Proceedings of the AAAI Conference on Artificial Intelligence 38 (2024).
- Li et al. (2023) Yang Li, Yangyang Yu, Haohang Li, Zhi Chen, and Khaldoun Khashanah. 2023. TradingGPT: Multi-Agent System with Layered Memory and Distinct Characters for Enhanced Financial Trading Performance. arXiv preprint arXiv:2309.03736 (2023).
- Lillicrap et al. (2019) Timothy P. Lillicrap, Jonathan J. Hunt, Alexander Pritzel, Nicolas Heess, Tom Erez, Yuval Tassa, David Silver, and Daan Wierstra. 2019. Continuous control with deep reinforcement learning. arXiv preprint arXiv:1509.02971 (2019).
- Lin et al. (2023) Shengsheng Lin, Weiwei Lin, Wentai Wu, Feiyu Zhao, Ruichao Mo, and Haotong Zhang. 2023. Segrnn: Segment recurrent neural network for long-term time series forecasting. arXiv preprint arXiv:2308.11200 (2023).
- Lin et al. (2015) Tsung-Yi Lin, Michael Maire, Serge Belongie, Lubomir Bourdev, Ross Girshick, James Hays, Pietro Perona, Deva Ramanan, C. Lawrence Zitnick, and Piotr Dollár. 2015. Microsoft COCO: Common Objects in Context. arXiv preprint arXiv:1405.0312 (2015).
- Lin et al. (2013) Yuling Lin, Haixiang Guo, and Jinglu Hu. 2013. An SVM-based approach for stock market trend prediction. In The 2013 International Joint Conference on Neural Networks (IJCNN).
- Liu et al. (2024a) Peiyuan Liu, Hang Guo, Tao Dai, Naiqi Li, Jigang Bao, Xudong Ren, Yong Jiang, and Shu-Tao Xia. 2024a. CALF: Aligning LLMs for Time Series Forecasting via Cross-modal Fine-Tuning. arXiv preprint arXiv:2403.07300 (2024).
- Liu et al. (2024c) Peiyuan Liu, Beiliang Wu, Yifan Hu, Naiqi Li, Tao Dai, Jigang Bao, and Shu-Tao Xia. 2024c. TimeBridge: Non-Stationarity Matters for Long-term Time Series Forecasting. arXiv preprint arXiv:2410.04442 (2024).
- Liu et al. (2021) Xiao-Yang Liu, Hongyang Yang, Jiechao Gao, and Christina Dan Wang. 2021. FinRL: Deep reinforcement learning framework to automate trading in quantitative finance. ACM International Conference on AI in Finance (ICAIF) (2021).
- Liu et al. (2024b) Yong Liu, Tengge Hu, Haoran Zhang, Haixu Wu, Shiyu Wang, Lintao Ma, and Mingsheng Long. 2024b. iTransformer: Inverted Transformers Are Effective for Time Series Forecasting. In International Conference on Learning Representations.
- Liu et al. (2024d) Yong Liu, Haoran Zhang, Chenyu Li, Xiangdong Huang, Jianmin Wang, and Mingsheng Long. 2024d. Timer: Generative Pre-trained Transformers Are Large Time Series Models. In Forty-first International Conference on Machine Learning. https://openreview.net/forum?id=bYRYb7DMNo
- Madsen (2007) Henrik Madsen. 2007. Time series analysis. Chapman & Hall.
- Mushtaq (2011) Rizwan Mushtaq. 2011. Augmented dickey fuller test. (2011).
- Nie et al. (2023) Yuqi Nie, Nam H Nguyen, Phanwadee Sinthong, and Jayant Kalagnanam. 2023. A Time Series is Worth 64 Words: Long-term Forecasting with Transformers. In International Conference on Learning Representations.
- Niu et al. (2024) Hui Niu, Siyuan Li, Jiahao Zheng, Zhouchi Lin, Bo An, Jian Li, and Jian Guo. 2024. IMM: An Imitative Reinforcement Learning Approach with Predictive Representation Learning for Automatic Market Making. In Proceedings of the Thirty-Third International Joint Conference on Artificial Intelligence, IJCAI-24. International Joint Conferences on Artificial Intelligence Organization.
- Pan et al. (2024) Kaiming Pan, Yifan Hu, Li Han, Haoyu Sun, Dawei Cheng, and Yuqi Liang. 2024. Cross-contextual Sequential Optimization via Deep Reinforcement Learning for Algorithmic Trading. In Proceedings of the 33rd ACM International Conference on Information and Knowledge Management (Boise, ID, USA) (CIKM ’24). Association for Computing Machinery, New York, NY, USA, 4811–4818.
- Paszke et al. (2019) Adam Paszke, Sam Gross, Francisco Massa, Adam Lerer, James Bradbury, Gregory Chanan, Trevor Killeen, Zeming Lin, Natalia Gimelshein, Luca Antiga, et al. 2019. Pytorch: An imperative style, high-performance deep learning library. Advances in neural information processing systems 32 (2019).
- Poterba and Summers (1988) James M. Poterba and Lawrence H. Summers. 1988. Mean reversion in stock prices: Evidence and Implications. Journal of Financial Economics (1988).
- Qin et al. (2017) Yao Qin, Dongjin Song, Haifeng Chen, Wei Cheng, Guofei Jiang, and Garrison W. Cottrell. 2017. A Dual-Stage Attention-Based Recurrent Neural Network for Time Series Prediction. In Proceedings of the Twenty-Sixth International Joint Conference on Artificial Intelligence, IJCAI-17. 2627–2633. https://doi.org/10.24963/ijcai.2017/366
- Qiu et al. (2024) Xiangfei Qiu, Jilin Hu, Lekui Zhou, Xingjian Wu, Junyang Du, Buang Zhang, Chenjuan Guo, Aoying Zhou, Christian S. Jensen, Zhenli Sheng, and Bin Yang. 2024. TFB: Towards Comprehensive and Fair Benchmarking of Time Series Forecasting Methods. Proc. VLDB Endow. (2024).
- Schulman et al. (2017) John Schulman, Filip Wolski, Prafulla Dhariwal, Alec Radford, and Oleg Klimov. 2017. Proximal Policy Optimization Algorithms. arXiv preprint arXiv:1707.06347 (2017).
- Shi et al. (2025) Xiaoming Shi, Shiyu Wang, Yuqi Nie, Dianqi Li, Zhou Ye, Qingsong Wen, and Ming Jin. 2025. Time-MoE: Billion-Scale Time Series Foundation Models with Mixture of Experts. In The Thirteenth International Conference on Learning Representations. https://openreview.net/forum?id=e1wDDFmlVu
- Soleymani and Paquet (2021) Farzan Soleymani and Eric Paquet. 2021. Deep graph convolutional reinforcement learning for financial portfolio management – DeepPocket. Expert Syst. Appl. (2021).
- Song et al. (2020) Jiaming Song, Chenlin Meng, and Stefano Ermon. 2020. Denoising diffusion implicit models. arXiv preprint arXiv:2010.02502 (2020).
- Vaswani et al. (2017) Ashish Vaswani, Noam Shazeer, Niki Parmar, Jakob Uszkoreit, Llion Jones, Aidan N Gomez, Łukasz Kaiser, and Illia Polosukhin. 2017. Attention is all you need. Advances in neural information processing systems (2017).
- Velickovic et al. (2017) Petar Velickovic, Guillem Cucurull, Arantxa Casanova, Adriana Romero, Pietro Lio, Yoshua Bengio, et al. 2017. Graph attention networks. stat (2017).
- Wang et al. (2022) Heyuan Wang, Tengjiao Wang, Shun Li, Jiayi Zheng, Shijie Guan, and Wei Chen. 2022. Adaptive Long-Short Pattern Transformer for Stock Investment Selection. In Proceedings of the Thirty-First International Joint Conference on Artificial Intelligence, IJCAI-22, Lud De Raedt (Ed.). International Joint Conferences on Artificial Intelligence Organization, 3970–3977. https://doi.org/10.24963/ijcai.2022/551 Main Track.
- Wang et al. (2019) Jingyuan Wang, Yang Zhang, Ke Tang, Junjie Wu, and Zhang Xiong. 2019. AlphaStock: A Buying-Winners-and-Selling-Losers Investment Strategy using Interpretable Deep Reinforcement Attention Networks. In Proceedings of the 25th ACM SIGKDD International Conference on Knowledge Discovery & Data Mining.
- Wang et al. (2024b) Shiyu Wang, Haixu Wu, Xiaoming Shi, Tengge Hu, Huakun Luo, Lintao Ma, James Y. Zhang, and JUN ZHOU. 2024b. TimeMixer: Decomposable Multiscale Mixing for Time Series Forecasting. In International Conference on Learning Representations. https://openreview.net/forum?id=7oLshfEIC2
- Wang et al. (2024a) Yuxuan Wang, Haixu Wu, Jiaxiang Dong, Yong Liu, Mingsheng Long, and Jianmin Wang. 2024a. Deep Time Series Models: A Comprehensive Survey and Benchmark. arXiv preprint arXiv:2407.13278 (2024).
- Wang et al. (2021) Zhicheng Wang, Biwei Huang, Shikui Tu, Kun Zhang, and Lei Xu. 2021. DeepTrader: A Deep Reinforcement Learning Approach for Risk-Return Balanced Portfolio Management with Market Conditions Embedding. Proceedings of the AAAI Conference on Artificial Intelligence (2021).
- Xia et al. (2024a) Hongjie Xia, Huijie Ao, Long Li, Yu Liu, Sen Liu, Guangnan Ye, and Hongfeng Chai. 2024a. CI-STHPAN: Pre-trained Attention Network for Stock Selection with Channel-Independent Spatio-Temporal Hypergraph. Proceedings of the AAAI Conference on Artificial Intelligence 38, 8 (Mar. 2024), 9187–9195. https://doi.org/10.1609/aaai.v38i8.28770
- Xia et al. (2024b) Haochong Xia, Shuo Sun, Xinrun Wang, and Bo An. 2024b. Market-GAN: Adding Control to Financial Market Data Generation with Semantic Context. Proceedings of the AAAI Conference on Artificial Intelligence (2024).
- Xiang et al. (2024) Quanzhou Xiang, Zhan Chen, Qi Sun, and Rujun Jiang. 2024. RSAP-DFM: Regime-Shifting Adaptive Posterior Dynamic Factor Model for Stock Returns Prediction. In Proceedings of the Thirty-Third International Joint Conference on Artificial Intelligence, IJCAI-24. International Joint Conferences on Artificial Intelligence Organization.
- Xiang et al. (2022) Sheng Xiang, Dawei Cheng, Chencheng Shang, Ying Zhang, and Yuqi Liang. 2022. Temporal and Heterogeneous Graph Neural Network for Financial Time Series Prediction. In Proceedings of the 31st ACM International Conference on Information & Knowledge Management.
- Xing et al. (2024) Rong Xing, Rui Cheng, Jiwen Huang, Qing Li, and Jingmei Zhao. 2024. Learning to Understand the Vague Graph for Stock Prediction With Momentum Spillovers. IEEE Trans. on Knowl. and Data Eng. (April 2024), 1698–1712. https://doi.org/10.1109/TKDE.2023.3310592
- Yan and Tan (2024) Wenbo Yan and Ying Tan. 2024. TCGPN: Temporal-Correlation Graph Pre-trained Network for Stock Forecasting. arXiv preprint arXiv:2407.18519 (2024).
- Yang et al. (2020) Xiao Yang, Weiqing Liu, Dong Zhou, Jiang Bian, and Tie-Yan Liu. 2020. Qlib: An AI-oriented Quantitative Investment Platform. arXiv preprint arXiv:2009.11189 (2020).
- Yu et al. (2024) Yangyang Yu, Zhiyuan Yao, Haohang Li, Zhiyang Deng, Yuechen Jiang, Yupeng Cao, Zhi Chen, Jordan W. Suchow, Zhenyu Cui, Rong Liu, Zhaozhuo Xu, Denghui Zhang, Koduvayur Subbalakshmi, GUOJUN XIONG, Yueru He, Jimin Huang, Dong Li, and Qianqian Xie. 2024. FinCon: A Synthesized LLM Multi-Agent System with Conceptual Verbal Reinforcement for Enhanced Financial Decision Making. In The Thirty-eighth Annual Conference on Neural Information Processing Systems. https://openreview.net/forum?id=dG1HwKMYbC
- Zeng et al. (2024) Liang Zeng, Lei Wang, Hui Niu, Ruchen Zhang, Ling Wang, and Jian Li. 2024. Trade When Opportunity Comes: Price Movement Forecasting via Locality-Aware Attention and Iterative Refinement Labeling. In Proceedings of the Thirty-Third International Joint Conference on Artificial Intelligence, IJCAI-24. International Joint Conferences on Artificial Intelligence Organization.
- Zhang et al. (2020) Chuheng Zhang, Yuanqi Li, Xi Chen, Yifei Jin, Pingzhong Tang, and Jian Li. 2020. DoubleEnsemble: A New Ensemble Method Based on Sample Reweighting and Feature Selection for Financial Data Analysis. In 2020 IEEE International Conference on Data Mining (ICDM).
- Zhang et al. (2024) Wentao Zhang, Lingxuan Zhao, Haochong Xia, Shuo Sun, Jiaze Sun, Molei Qin, Xinyi Li, Yuqing Zhao, Yilei Zhao, Xinyu Cai, Longtao Zheng, Xinrun Wang, and Bo An. 2024. A Multimodal Foundation Agent for Financial Trading: Tool-Augmented, Diversified, and Generalist. In Proceedings of the 30th ACM SIGKDD Conference on Knowledge Discovery and Data Mining (KDD ’24). Association for Computing Machinery.
- Zhang and Yan (2023) Yunhao Zhang and Junchi Yan. 2023. Crossformer: Transformer Utilizing Cross-Dimension Dependency for Multivariate Time Series Forecasting. In International Conference on Learning Representations. https://openreview.net/forum?id=vSVLM2j9eie
- Zhao et al. (2024) Qingsong Zhao, Yi Wang, Zhipeng Zhou, Duoqian Miao, Limin Wang, Yu Qiao, and Cairong Zhao. 2024. Rethinking the Zigzag Flattening for Image Reading. arXiv preprint arXiv:2202.10240 (2024).
- Zheng et al. (2024) Jiajian Zheng, Duan Xin, Qishuo Cheng, Miao Tian, and Le Yang. 2024. The Random Forest Model for Analyzing and Forecasting the US Stock Market in the Context of Smart Finance. arXiv preprint arXiv:2402.17194 (2024).
- Zhu et al. (2024a) Peng Zhu, Yuante Li, Yifan Hu, Qinyuan Liu, Dawei Cheng, and Yuqi Liang. 2024a. LSR-IGRU: Stock Trend Prediction Based on Long Short-Term Relationships and Improved GRU. International Conference on Information and Knowledge Management (2024).
- Zhu et al. (2024b) Peng Zhu, Yuante Li, Yifan Hu, Sheng Xiang, Qinyuan Liu, Dawei Cheng, and Yuqi Liang. 2024b. MCI-GRU: Stock Prediction Model Based on Multi-Head Cross-Attention and Improved GRU. arXiv preprint arXiv:2410.20679 (2024).
- Zou et al. (2023) Jinan Zou, Qingying Zhao, Yang Jiao, Haiyao Cao, Yanxi Liu, Qingsen Yan, Ehsan Abbasnejad, Lingqiao Liu, and Javen Qinfeng Shi. 2023. Stock Market Prediction via Deep Learning Techniques: A Survey. arXiv preprint arXiv:2212.12717 (2023).