Density functional theory of resonant inelastic x-ray scattering in the quasi-one-dimensional dimer iridate Ba3InIr2O9
Abstract
We have investigated the electronic structure of Ba3InIr2O9 within the density-functional theory (DFT) using the generalized gradient approximation while considering strong Coulomb correlations (GGA+) in the framework of the fully relativistic spin-polarized Dirac linear muffin-tin orbital band-structure method. We have investigated resonant inelastic x-ray scattering (RIXS) spectra at the Ir edge. The calculated results are in good agreement with experimental data. The RIXS spectrum of Ba3InIr2O9 at the Ir edge possesses several sharp features below 2 eV corresponding to transitions within the Ir levels. The excitation located from 2 to 5 eV is due to transitions. The third wide structure situated at 512 eV appears due to charge transfer transitions. We have also presented comprehensive theoretical calculations of the RIXS spectrum at the oxygen edge.
pacs:
75.50.Cc, 71.20.Lp, 71.15.RfI Introduction
In 5 transition metal compounds the energy scale of the spin-orbit coupling (SOC) is comparable with the on-site Coulomb interaction and the crystal-field energy. Due to the strong competition between these interactions fascinating electronic states can arise. SOC in such systems splits the orbitals into a quartet ( = ) and a doublet ( = ) Jackeli and Khaliullin (2009); Chen et al. (2010); Witczak-Krempa et al. (2014). In 5 (Ir4+) iridium oxides, such as Sr2IrO4, the quartet = is fully occupied, and the relatively narrow = doublet, occupied by one electron, can be splitted by moderate Hubbard with opening a small band gap called the relativistic Mott gap Kim et al. (2008); Martins et al. (2011); Antonov et al. (2018); Antonov et al. (2024a). Iridates have been at the center of an intensive research in recent years for novel phenomena, such as topological insulators Qi and Zhang (2010); Ando (2013); Wehling et al. (2014); Bansi et al. (2016), Mott insulators Kim et al. (2008, 2009); Watanabe et al. (2010); Martins et al. (2011), Weyl semimetals Witczak-Krempa and Kim (2012); Go et al. (2012); Sushkov et al. (2015), and quantum spin liquids (QSLs) Kimchi et al. (2014); Balents (2010); L and Balents (2017).
The specific features of the systems with spin and orbital degeneracy strongly depend on the local geometry. The most typical cases, widely discussed in the literature, are those with MO6 octahedra (M is a transition-metal ion) sharing a common oxygen (or common corner), such as the LaMnO3 perovskite or layered systems as La2CuO4, and the situation with two common oxygen for neighboring octahedra (octahedra with a common edge), met in many layered systems with triangular lattices such as NaCoO2 and LiNiO2. The features of spin-orbital systems in both these cases were studied in detail; see, e.g., Ref. Khomskii (2014). However, there exists yet the third typical geometry, which is also very often met in many real materials: the case of octahedra with a common face (three common oxygens). This case has relatively small attention in the literature. Actually, there are many transition-metal compounds with face-sharing geometry Kugel et al. (2015). Such materials include, for example, hexagonal crystals such as BaCoO3 Yamaura et al. (1999), BaVS3 Gardner et al. (1969), or CsCuCl3 Hirotsu (1977). Many other similar systems have finite face-sharing blocks, e.g., BaIrO3 Siegrist and Chamberland (1991), BaRuO3 Hong and Sleight (1997); Zhao et al. (2007), or Ba4Ru3O10 Carim et al. (2000); Klein et al. (2011) with blocks of three such face-sharing octahedra, connected between themselves by common corners; or blocks of two such octahedra as in large series of systems with the general formula A3BM2O9 Köhl and Reinen (1977); Kimber et al. (2012); Senn et al. (2013a); Fernandez et al. (1980); Senn et al. (2013b); Rijssenbeek et al. (1999); Streltsov (2013); von Treiber et al. (1982), where A is Ba, Ca, Sr, Li, or Na, and the face-sharing MO6 octahedra of transition metals are separated by BO6 octahedra (which have common corners with MO6). Such systems have very diverse properties: some of them are metallic Rijssenbeek et al. ; others are insulators Köhl and Reinen (1977) or undergo a metal-insulator transition Kimber et al. (2012). Materials in this family with magnetic B sites have been shown to exhibit quantum spin-liquid behavior, in particular Ba3NiSb2O9 Cheng et al. (2011); Quilliam et al. (2016); Fak et al. (2017) and Ba3IrTi2O9 Dey et al. (2012), while others, Ba3CuSb2O9 Zhou et al. (2011); Nakatsuji et al. (2012); Quilliam et al. (2012) and Ba3ZnIr2O9 Nag et al. (2016), exhibit possible quantum spin-orbital liquids. Furthermore, Ba3CoSb2O9 has allowed for some of the first studies on the magnetization process of a truly triangular spin- antiferromagnet Shirata et al. (2012); Zhou et al. (2012); Susuki et al. (2013); Koutroulakis et al. (2015); Quirion et al. (2015).
The series of perovskites Ba3MIr2O9 (M = an alkaline-earth, transition metal, or rare-earth element) is rather interesting also because a wide range of elements with a variety of Ir oxidation states can be fitted by changing component M. The nominal oxidation state of Ir can be 5.5+ (for M = Li+, Na+ Kim et al. (2004)), 5+ (for M = Zn2+, Mg2+, Ca2+, Cd2+ Sakamoto et al. (2006)), 4.5+ (for M=Y3+, Sc3+, In3+, Lu3+ Sakamoto et al. (2006); Doi and Hinatsu (2004)), and 4+ (for M=Ti4+, Zr4+ Sakamoto et al. (2006)). There are several experimental studies on the 6H Ba3MIr2O9 compounds with M= Zn, Mg, Ca, Sr, Y, Sc, and In Nag et al. (2016); Sakamoto et al. (2006); Dey et al. (2013); Nag et al. (2018); Dey et al. (2017); Khan et al. (2019), which show diverse ground-state properties. For instance, Ba3ZnIr2O9 was reported to exhibit a spin-orbital liquid state, with an effective moment of 0.26 /Ir site Nag et al. (2016). The closely related Ba3CdIr2O9 Khan et al. (2019) and Ba3MgIr2O9 Nag et al. (2018) were also seen to exhibit no long-range magnetic order down to the lowest measured temperatures. However, Ba3CaIr2O9 and Ba3SrIr2O9 systems were observed to exhibit weak-dimer-like and ferromagnetic (FM)-like features in the magnetic susceptibility, respectively, though these transitions could not be identified in heat capacity measurements Nag et al. (2018).
The materials with a fractional oxidation state of Ir are especially very interesting because the fractional oxidation state of Ir (accompanied by a unique crystallographic site) can lead them to fascinating ground states. Such materials have been less explored theoretically, despite the fact that their experimental magnetic response reveals several peculiarities. There are three holes per dimer in Ba3M3+IrO9 compounds. At high temperatures, where the mixed-valence dimers can be seen as isolated, the magnetic susceptibility deviates from the conventional Curie-Weiss behavior Doi et al. (2002); Sakamoto et al. (2006); Nag and Ray (2017) suggesting nontrivial temperature evolution of the local magnetic moment. At low temperatures, interactions between the dimers become important, and signatures of frustrated magnetic behavior Ziat et al. (2017) including possible formation of a spin-liquid ground state have been reported Dey et al. (2017). The linear fit to the high-temperature part produces the effective moments of 1.53 /f.u. (for M = Ir) and 1.79 /f.u. (for M = Sc) that were interpreted as the = 1 state of the mixed-valence dimer Sakamoto et al. (2006). At lower temperatures, the interactions between the dimers occur. Ba3YIr2O9 undergoes long-range magnetic ordering at 4.5 K Dey et al. (2014); Panda et al. (2015) but Ba3ScIr2O9 does not show no long-range magnetic order down to at least 2 K Dey et al. (2014). At the same time, according to thermodynamic measurements, nuclear magnetic resonance, and muon spin resonance, Ba3In3+IrO9 shows persistent spin dynamics down to 20 mK without any long-range magnetic order Dey et al. (2017). This can point toward a possible gapless spin-liquid ground state in this perovskite.
Here we report a theoretical investigation of the electronic and magnetic structures of the Ba3InIr2O9 perovskite. The structure of this compound consists of InO6 and IrO6 octahedra. The latter octahedra share a face and develop along the crystallographic axis so called Ir2O9 dimers, which are connected through corners with the InO6 octahedra and form an edge-shared triangular lattice in the plane. Therefore, such a compound would become geometrically frustrated in the presence of the antiferromagnetic (AFM) interaction. Novel properties are expected from this structural arrangement in addition to those driven by SOC.
In this article, we focus our attention on the RIXS properties of Ba3InIr2O9. Since the first publication by Kao et al. on NiO Kao et al. (1996), the RIXS method has shown remarkable progress as a spectroscopic technique to record the momentum and energy dependence of inelastically scattered photons in complex materials. RIXS rapidly became the forefront of experimental photon science Ament et al. (2011); de Groot et al. (2024). RIXS combines spectroscopy and inelastic scattering to probe the electronic structure of materials. This method is an element- and orbital-selective X-ray spectroscopy technique, based on a two-step, two-photon resonant process. It combines X-ray emission spectroscopy (XES) with X-ray absorption spectroscopy (XAS) by measuring the coherent X-ray emission at incident X-ray photon energy within the near edge X-ray absorption spectrum. In the first step (X-ray absorption), an electron of the absorbing atom is resonantly excited from a core level to an empty state. The resulting state, called the intermediate state, carries a core hole with a very small lifetime. In the second step (X-ray emission), the system radiatively decays into a final state in which the core hole is filled by another electron accompanied by photon-out emission. The polarization of the incoming and outgoing light and the resonant energy are involved in the RIXS process, making RIXS a simultaneous spectroscopy and scattering technique. RIXS has a number of unique features in comparison with other spectroscopic techniques. It covers a large scattering phase space and requires only small sample volumes. It is also bulk sensitive, polarization dependent, as well as element and orbital specific Ament et al. (2011). A detail comparison with other spectroscopic techniques can be found in recent review article de Groot et al. (2024). Spectral broadening owing to a short core hole lifetime can be reduced to produce the RIXS spectra with high resolution. It permits direct measurements of phonons, plasmons, single-magnon, and orbitons as well as other many-body excitations in strongly correlated systems, such as cuprates, nickelates, osmates, ruthenates, and iridates, with complex low-energy physics and exotic phenomena in the energy and momentum space.
There is great progress in the RIXS experiments over the past decade. The most calculations of the RIXS spectra of various materials have been carried out using the atomic multiplet approach with some adjustable parameters and the number of theoretical first-principle calculations of RIXS spectra is extremely limited. In this paper, we report a theoretical investigation from the first principles of the RIXS spectra of Ba3InIrO9. Recently, the RIXS measurements have been successfully performed at the Ir edge in Ba3InIrO9 by Revelli et al. Revelli et al. (2022) in the energy range up to 5.5 eV. In addition to the elastic peak centered at zero energy loss, the spectrum consists of several peaks below 2 eV with a high energy shoulder at 1.8 eV and a peak at 4 eV.
We carry out here a detailed study of the electronic structure and RIXS spectra of Ba3InIrO9 in terms of the density functional theory. Our study sheds light on the important role of band structure effects and transition metal 5 oxygen 2 hybridization in the spectral properties of 5 oxides. We use the ab initio approach using the fully relativistic spin-polarized Dirac linear muffin-tin orbital band-structure method. Both the generalized gradient approximation (GGA) and the GGA+ approach are used to assess the sensitivity of the RIXS results to different treatment of the correlated electrons.
The paper is organized as follows. The crystal structure of Ba3InIrO9 and computational details are presented in Sec. II. Section III presents the electronic and magnetic structures of Ba3InIrO9. In Sec. IV, the theoretical investigation of the RIXS spectrum of Ba3InIrO9 at the Ir edge is presented, the theoretical results are compared with experimental measurements. Finally, the results are summarized in Sec. V.
II Computational details
II.1 RIXS
In the direct RIXS process Ament et al. (2011) the incoming photon with energy , momentum , and polarization excites the solid from ground state with energy to intermediate state with energy . During relaxation an outgoing photon with energy , momentum and polarization is emitted, and the solid is in state with energy . As a result, an excitation with energy and momentum = is created. Our implementation of the code for the calculation of the RIXS intensity uses Dirac four-component basis functions Nemoshkalenko et al. (1983) in the perturbative approach Arola et al. (1997). RIXS is the second-order process, and its intensity is given by
| (1) | |||||
where the RIXS perturbation operator in the dipole approximation is given by the lattice sum , where are the Dirac matrices. The sum over intermediate states includes the contributions from different spin-split core states at the given absorption edge. The matrix elements of the RIXS process in the frame of the fully relativistic Dirac LMTO method were presented in Ref. Antonov et al. (2022a).
II.2 Crystal structure
The Rietveld refinement of room-temperature (300 K) neutron diffraction data for Ba3InIr2O9 obtained by Dey et al. Dey et al. (2017) reveals the hexagonal crystal structure (space group , number 194). At 3.4 K the symmetry is reduced to the monoclinic structure ( space group, number 15). The corresponding lattice parameters and Wyckoff positions are presented in Table 1. The mixed-valence Ba3InIr2O9 shows a high degree of structural order. Dey et al. Dey et al. (2017) were able to obtain reasonable atomic displacement parameters in the fully ordered models of both hexagonal and monoclinic structures, however, a weak site-mixing scenario was observed with 2.8% InIr intersite mixing.
Both the hexagonal and monoclinic structures feature a single crystallographic position of Ir, suggesting the intermediate-valence Ir 4.5+ state. This is different from, e.g., Ba5AlIr2O11, where two sites of the Ir2O9 dimer belong to two different crystallographic positions, thus making possible charge redistribution within the dimer Terzic et al. (2015). The structure consists of Ir2O9 dimers, which are IrO6 face-shared octahedra along the crystallographic axis, connected through corners with InO6 octahedra and forming an edge-shared triangular lattice in the plane, with Ba ions sitting in typical for normal perovskites 12-fold coordination sites (see Fig. 1). Ba3InIr2O9 contains two formula units and hence two structural dimers in the unit cell, which are connected via O-In-O paths along the axis.
The IrO1 and IrO2 interatomic distances for the hexagonal structure are equal to 2.034 and 1.962 Å, respectively. The corresponding IrO1, IrO2, IrO3, IrO4, and IrO5 distances for the monoclinic structure are equal to 2.056, 2.023, 1.951, 2.017, and 1.958 Å, respectively. The InO2 interatomic distance in InO6 octahedra for the hexagonal structure is equal to 2.118 Å. The corresponding InO3, InO4, and InO5 distances for the monoclinic structure are equal to 2.132, 2.105, and 2.101 Å, respectively. The low-temperature monoclinic distortion is primarily related to the tilting of IrO6 and InO6 octahedra. It has nearly no effect on relative positions of Ir atoms. For example, the Ir-Ir distance within the dimer shrinks from 2.637 Å at 300 K to 2.596Å at 3.4 K, presumably, due to thermal contraction Dey et al. (2017).
| Structure | WP | Atom | |||
|---|---|---|---|---|---|
| Ba1 | 0 | 0 | 0.25 | ||
| Ba2 | 0.3333 | 0.6667 | 0.0889 | ||
| In | 0 | 0 | 0 | ||
| Ir | 0.3333 | 0.6667 | 0.1590 | ||
| O1 | 0.4867 | 0.5133 | 0.25 | ||
| O2 | 0.1715 | 0.3430 | 0.0841 | ||
| Ba1 | 0 | 0.0010 | 0.25 | ||
| Ba2 | 0.0049 | 0.3360 | 0.0889 | ||
| In | 0 | 0 | 0 | ||
| Ir | 0.0081 | 0.3334 | 0.8397 | ||
| O1 | 0 | 0.4918 | 0.75 | ||
| O2 | 0.2300 | 0.2573 | 0.7541 | ||
| O3 | 0.0180 | 0.1717 | 0.9140 | ||
| O4 | 0.2260 | 0.4158 | 0.9251 | ||
| O5 | 0.2630 | 0.4144 | 0.9079 |
Note that in our electronic structure calculations, we rely on experimentally measured atomic positions and lattice constants, because they are well established for this material and still more accurate than those obtained from DFT.
II.3 Calculation details
The details of the computational method are described in our previous papers Antonov et al. (2006, 2007, 2010); Antonov et al. (2022a) and here we only mention several aspects. The band structure calculations were performed using the fully relativistic LMTO method Andersen (1975); Antonov et al. (2004). This implementation of the LMTO method uses four-component basis functions constructed by solving the Dirac equation inside an atomic sphere Nemoshkalenko et al. (1983). The exchange-correlation functional of a GGA-type was used in the version of Perdew, Burke and Ernzerhof Perdew et al. (1996). The Brillouin zone integration was performed using the improved tetrahedron method Blöchl et al. (1994). The basis consisted of Ir and Ba , , , and ; and In and O , , and LMTO’s.
To consider the electron-electron correlation effects we used the relativistic generalization of the rotationally invariant version of the GGA+ method Yaresko et al. (2003) which considers that, in the presence of spin-orbit coupling, the occupation matrix of localized electrons becomes nondiagonal in spin indexes. Hubbard was considered an external parameter and varied from 0.65 to 3.65 eV. We used in our calculations the value of exchange Hund coupling =0.65 eV obtained from constrained LSDA calculations Dederichs et al. (1984); Pickett et al. (1998). Thus, the parameter , which roughly determines the splitting between the lower and upper Hubbard bands, varied between 0 and 3.0 eV. We adjusted the value of to achieve the best agreement with the experiment.
In the RIXS process, an electron is promoted from a core level to an intermediate state, leaving a core hole. As a result, the electronic structure of this state differs from that of the ground state. To reproduce the experimental spectrum, the self-consistent calculations should be carried out including a core hole. Usually, the core-hole effect has no impact on the shape of XAS at the edges of 5 systems and just a minor effect on the XMCD spectra at these edges Antonov et al. (2004). However, the core hole has a strong effect on the RIXS spectra in transition metal compounds Antonov et al. (2022a, b); therefore, we consider it in our calculations.
III Electronic and magnetic structures
We performed GGA, GGA+SO, and GGA+SO+ calculations of the electronic and magnetic structures of Ba3InIr2O9 for the experimental crystal structure Dey et al. (2017) (see Table 1). In order to understand the magnetic properties of the system, four different magnetic configurations, namely FM (both the intra- and inter-dimer couplings are FM), AFM1 (both the intra- and inter-dimer couplings are AFM), AFM2 (the intra-dimer coupling is FM and the inter-dimer coupling is AFM), and AFM3 (the intra-dimer coupling is AFM and the inter-dimer coupling is FM), have been simulated (see Fig. 2). The calculations show that the AFM2 state has the lowest energy (Table 2). A similar magnetic ground state was obtained by Panda et al. for Ba2YIr2O9 Panda et al. (2015) and Nag et al. for Ba2ZnIr2O9 Nag et al. (2016).
The difference in total energy between magnetic and nonmagnetic solutions (with considering SOC and Hubbard correlations) is relatively large and equals to 1.682 eV per formula unit. However, between different magnetic solutions it is very small. Probably, it may explain the fact that Ba3InIr2O9 possesses no long-range magnetic order down to very low temperatures and points out on possible spin-liquid behavior of local moments below 1 K in this perovskite Dey et al. (2017). We also found several noncollinear AFM solutions but with significantly higher total energy than the solutions with FM and AFM ordering along the direction.
| FM | AFM1 | AFM2 | AFM3 |
|---|---|---|---|
| 0.232 | 3.375 | 0 | 4.273 |
In Figure 3 the plots of orbital resolved partial density of states (DOS) for Ba3InIr2O9 are presented. For the dimers formed by two face-shared IrO6 octahedra (see Fig. 1), the local distortion of symmetry leads to the splitting of orbitals into an singlet and an doublet. The original ( ) doublet remains unsplit. The largest bonding-antibonding splitting corresponds to orbitals, directed to each other in this geometry. The rightmost peak in Fig. 3(a) corresponds to the antibonding orbital at 0.2 eV, while the antibonding states are centered at -0.4 to 0.1 eV [Fig. 3(b, c)]. Due to the strong distortion of IrO6 octahedra the orbitals are strongly mixed. In the local coordinate system with directed from the Ir ion to the O5 one [see Fig. 1(b)], the molecular orbital can be presented as = 0.523+0.275+0.712. There is competition between the SO entanglement and the dimerization in Ba3InIr2O9. The former mixes up different orbital states to create the orbital moment. The latter selects a specific orbital to gain bonding energy. We note that the effect of electron correlations may narrow the bandwidth and make the RIXS peaks sharper.
The dimerization of transition-metal ions has been frequently seen, for example, in high pressure honeycomb-based 5 iridates Antonov et al. (2018); Takayama et al. (2019); Antonov et al. (2021) and in a wide variety of honeycomb-based 3 and 4 oxides and halides, including -TiCl3 (3) Ogawa (1960), -MoCl3 (4) McGuire et al. (2017), Li2RuO3 (4) Miura et al. (2007), and -RuCl3 Agrestini et al. (2017).
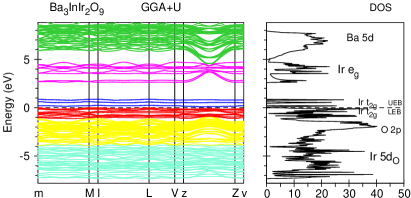
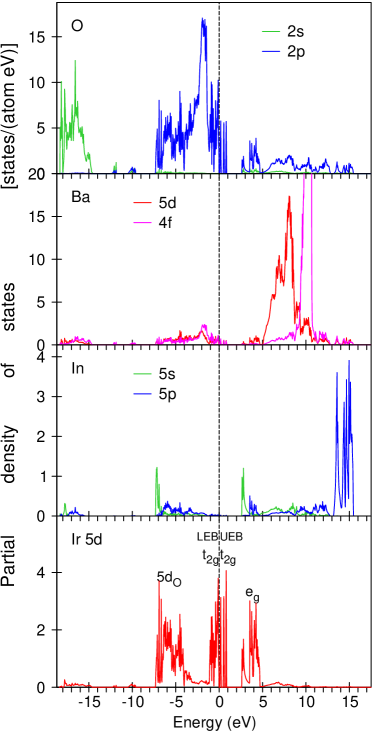
According to the experimental measurements of Revelli et al. Revelli et al. (2022), the real part of the conductivity is 10-6/ cm, which firmly indicates the insulating character of Ba3InIr2O9. This conclusion is also supported by the observation that the dielectric loss is much smaller than the permittivity , as usually expected for an insulator Revelli et al. (2022). Figure 4 shows the Ir 5 partial DOS for Ba3InIr2O9 calculated in the GGA+SO, GGA+, and GGA+SO+ approaches. The GGA and GGA+SO approaches give a metallic ground state in Ba3InIr2O9. It is in contradiction with the experiment. To produce an insulating ground state we used the GGA+SO+ method. We discovered that the energy gap opens up for = 1.5 eV for the AFM ground state. The calculations show that the energy gap is already formed in the GGA+ approximation without SOC. Ba3InIr2O9 can be classified as a Mott insulator, since it was expected to be metallic from GGA band structure calculations. We found that the best agreement between the calculated and experimentally measured RIXS spectra at the Ir edge can be achieved for = 2.3 eV (see Section IV).
Figures 5 and 6 present the energy band structure and partial DOSs, respectively, in Ba3InIr2O9 for the AFM2 solution calculated in the GGA+SO+ approach with = 2.3 eV. The occupied states [the low energy band (LEB)] are situated in the energy interval from 1.2 eV to and can be subdivided into two band groups from 1.2 to 0.6 eV and from 0.6 eV to . The empty states [the upper energy band (UEB)] consist of three narrow single peaks divided by energy gaps and occupy the energy range from 0.07 to 0.88 eV. There is a significant amount of Ir 5 DOS located at the bottom of oxygen 2 states from 7.35 to 4.05 eV below the Fermi energy. These, so called, Ir 5 states are provided by the tails of oxygen 2 states inside the Ir atomic spheres and play an essential role in the RIXS spectrum at the Ir edge (see Section IV).
The In 5 states are mostly situated above the Fermi level from 13.2 to 15.5 eV and consist of four separated energy peaks. The Ba 5 states occupy the energy region from 5.1 to 9.2 eV above the energy Fermi. A narrow and intensive DOS peak of Ba 4 states is located just above the Ba 5 states from 9.2 to 10.8 eV. The oxygen 2 states are situated far below the Fermi level from 18.3 to 14.6 eV. The occupied O 2 states are localized from 7.35 eV to . They are strongly hybridized with Ir 5 states from 7.35 eV to 4.05 eV and from 1.2 eV to . The empty oxygen 2 states are strongly hybridized with Ir UEB just above the Fermi level and with the Ir states from 2.6 to 4.7 eV. They are also hybridized with Ba 5 and 4 states as well as In 5 states.
| atom | |||
|---|---|---|---|
| Ba1 | 0.0415 | 0.0020 | 0.0395 |
| Ba2 | 0.0141 | 0.0056 | 0.0197 |
| In | 0 | 0 | 0 |
| Ir | 0.3903 | 0.1393 | 0.5296 |
| O1 | 0.1188 | 0.0397 | 0.1585 |
| O2 | 0.0386 | 0.0054 | 0.0440 |
| O3 | 0.0513 | 0.0133 | 0.0646 |
| O4 | 0.0430 | 0.0015 | 0.0445 |
| O5 | 0.0667 | 0.0131 | 0.0798 |
Table 3 presents the theoretically calculated in the GGA+SO+ approach ( = 3.2 eV) spin , orbital , and total magnetic moments in Ba3InIr2O9 for the AFM001 solution. The spin and orbital moments at the Ir site in Ba2InIrYO9 equal to 0.3903 and 0.1393 , respectively. They are in the same direction, as Ir 5 states are more than half filled. The ratio 0.357 is relatively small compared to other SOC driven = iridates, i.e., Sr2IrO4, where it is 1.68 Antonov et al. (2024a). It may indicate only a moderate SOC influence in Ba2InIr2O9.
IV Ir RIXS spectra
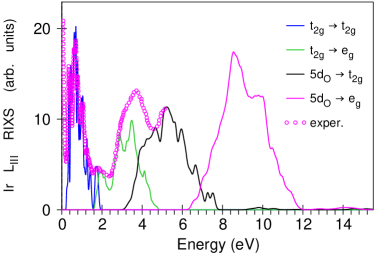
The experimental RIXS spectrum at the Ir edge was measured by Revelli et al. Revelli et al. (2022) in the energy range up to 5.5 eV. In addition to the elastic peak centered at zero energy loss the spectrum consists of several peaks below 2 eV, a strong peak at 3.9 eV, and a fine structure above 4.4 eV. We found that the fine structure situated below 2 eV corresponds to intra- excitations. These peaks are very sensitive to the value of the energy gap in Ba3InIr2O9 and the relative position of LEB and UEB (Fig. 5). Figure 7 shows the experimental RIXS spectrum measured by Revelli et al. Revelli et al. (2022) compared with the theoretical spectra calculated for transitions in the GGA+SO+ approach for the AFM001 solution for different values. The best agreement was found for = 2.3 eV. The GGA+SO calculations (not shown) as well as the GGA+SO+ approach with smaller do not produce adequate agreement with the experimental data. The larger values of shift the RIXS spectrum towards higher energies.
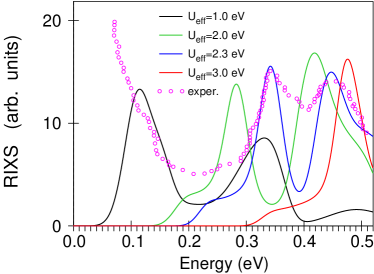
Figure 8(a) shows the theoretical RIXS spectrum at the Ir edge for the transitions in Ba3InIrO9 compared with the measurements of Revelli et al. Revelli et al. (2022). The Ir spectrum for the transitions has quite a rich fine structure with at least twelve well separated peaks from to below 2 eV. The appearance of multiple peaks in the RIXS spectrum is a direct consequence of strong noncubic crystal field (CF) splitting originating from the distorted octahedral environment of the Ir ions. The CF splitting leads to a very specific energy band structure of Ir states presented in Fig. 9. There are nine bands below (from 1 to 9) and three empty bands , , and separated by energy gaps. The interband transitions between these nine occupied and three empty bands produce 27 peaks. Some of these peaks are quite small. As a result, the structure of the Ir RIXS spectrum below 2 eV consists of at least twelve well distinguished peaks. The corresponding interband transitions are presented in Fig. 8(b). The low energy peaks , , and are due to the transitions from the first, second, and third occupied bands (the red, green, and blue bands in Fig. 9) into the low energy empty band (the blue band with DOS peak ). The other peaks from to are due to many interband transitions, which are presented in Fig. 8(b).
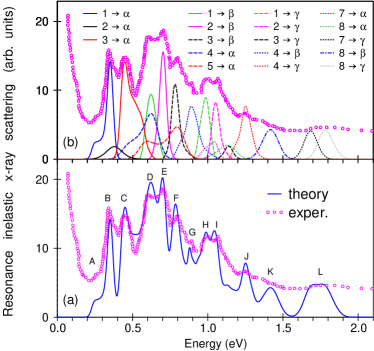
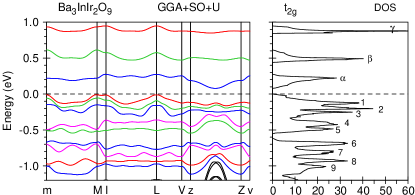
Figure 10 presents the theoretically calculated and experimentally measured RIXS spectra at the Ir edge for Ba3InIr2O9 Revelli et al. (2022) in a wide energy interval up to 14 eV. As we mentioned above, the peaks situated below 2 eV correspond to intra- excitations (the blue curve in Fig. 10). The peak located at 4 eV was found to be due to transitions (the green curve). The increase of the intensity above 4.5 eV can be associated with charge-transfer excitations 5 (the black curve). These transitions also contribute into the major peak at 4 eV. The strong fine structure at 9 eV (the magenta curve) is due to 5 transitions. The theoretical calculations are in good agreement with the experimental data.
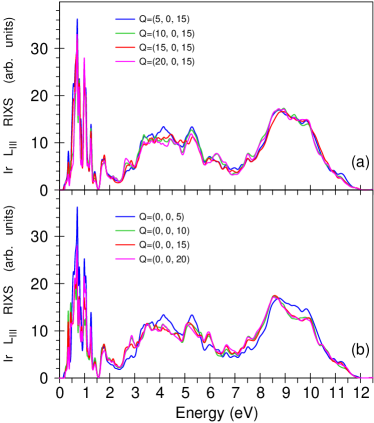
It is widely believed that excitations show only small momentum transfer vector Q dependence in 5 transition metal compounds Liu et al. (2012); Krajewska et al. (2020). As we see in the upper panel of Fig. 11, the RIXS spectra show small dependence as a function of with the momentum transfer vector Q = (Qx, 0, 15) in reciprocal lattice units (r.l.u.) for incident photon energy = 11215 eV in the energy interval up to 12 eV. The lower panel of Fig. 11 shows the RIXS spectra at the Ir edge in Ba3InIr2O9 calculated as a function of with the momentum transfer vector Q = (0, 0, Qz) r.l.u. We found that the RIXS spectrum possesses an oscillation character. With increasing Qz from 5 to 10, 15, and 20 r.l.u. the low energy structure, which reflects the transitions, is increased then decreased, again increased and after that decreased. The high energy fine structures above 3 eV are changed insignificantly with the increase of Qz. Similar dependence of the RIXS spectrum on Qz was detected experimentally by Revelli et al. Revelli et al. (2022). Namely, they found that the low energy RIXS spectrum below 1.5 eV show an oscillation character for the momentum transfer vector Q = (0.3, 0, Qz). It is increased with the changing of Qz from 11.2 to 14.0, then decreased for Qz = 16.8, and increased for Qz = 19.6 r.l.u. Although, the peaks above 3 eV were found to be almost insensible to the changing of Qz. Analyzing Fig. 11, we can conclude that the momentum dependence of the excitations in Ba3InIr2O9 is rather small, as it was earlier observed in other iridates, such as Sr3CuIrO6 Liu et al. (2012), In2Ir2O7 Krajewska et al. (2020) or Sr2IrO4 Antonov et al. (2024a).
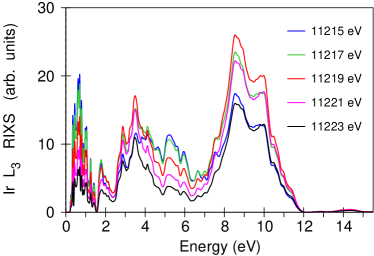
Figure 12 shows the Ir RIXS spectrum as a function of incident photon energy above the corresponding edge with the momentum transfer vector Q = (0, 0, 15). We found that the low energy fine structure corresponding to the intra- excitations steadily decreases when the incident photon energy changes from 11215 to 11223 eV, whereas the energy peak corresponding to the transitions firstly increases, when the incident photon energy changes from 11215 to 11219 eV, and after that decreases. The same behavior occurs for the high energy peak between 7 and 12 eV, which corresponds to the charge transfer transitions 5 .
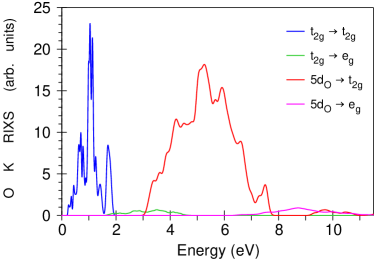
Figure 13 shows the theoretically calculated RIXS spectrum at the O edge in Ba3InIr2O9 in the GGA+SO+ approach. We found that the transitions (the blue curve), which are situated below 2 eV, are quite intensive and even exceed the 5 transitions (the red curve). This is quite unusual because the latter transitions in some other transition metal oxides, such as Sr2IrO4 Antonov et al. (2024a) and Ca3Ru2O7 Antonov et al. (2024b), are dominant. The (the green curve) and 5 transitions (the magenta curve) are rather small. Experimental measurements of the RIXS spectrum at the O edge in Ba3InIr2O9 are highly desirable.
V Conclusions
To summarize, we have investigated the electronic and magnetic structures of Ba3InIr2O9 in the frame of the fully relativistic spin-polarized Dirac approach. We have also presented comprehensive theoretical calculations of the RIXS spectra at the Ir and oxygen edges.
The delicate interplay between electron correlations, SOC, intersite hopping, and a crystal field splitting leads to a strongly competing ground state for Ba3InIr2O9. We found that the ground magnetic state in Ba3InIr2O9 is AFM2 with the FM intra-dimer and AFM inter-dimer coupling. The GGA and GGA+SO approaches give a metallic ground state in Ba3InIr2O9. It is in contradiction with electric conductivity and energy loss measurements, which firmly indicate an insulating character of Ba3InIr2O9. After taking into account the Coulomb correlations in the frame of the GGA+SO+ method, we obtained the energy gap for = 1.5 eV for the AFM ground state. The calculations show that the energy gap is already formed in the GGA+ approximation without SOC. Ba3InIr2O9 can be classified as a Mott insulator, since it was expected to be metallic from GGA band structure calculations. We found that the best agreement between the calculated and experimentally measured RIXS spectra at the Ir edge in Ba3InIr2O9 can be achieved for = 2.3 eV.
Ba3InIr2O9 contains two formula units and two structural Ir2O9 dimers in the unit cell, which are IrO6 face-shared octahedra connected via O-In-O paths along the axis. The Ir-Ir distance within the dimer is quite small and equal to 2.596Å at low temperature. As a result, there is clear formation of the molecular orbital in Ba3InIr2O9.
The theoretically calculated Ir RIXS spectrum is in good agreement with the experiment. We found that the low energy part of the RIXS spectrum 2 eV corresponds to intra- excitations. It has quite a rich fine structure with at least twelve well separated peaks. Such a shape of the RIXS spectrum can be explained by a specific energy band structure of Ir states with nine DOS peaks below and three empty narrow DOS peaks separated by energy gaps. The interband transitions between these nine occupied and three empty bands produce the rich structure of the Ir RIXS spectrum below 2 eV. The appearance of multiple peaks in the RIXS spectrum is a direct consequence of strong noncubic crystal field splitting originating from the distorted octahedral environment of the Ir ions. The RIXS peak located at 4 eV was found to be due to transitions with some additional contributions from 5 transitions. The strong fine structure at 9 eV is due to 5 transitions.
We found rather small momentum dependence of the excitations in Ba3InIr2O9, which is typical for 5 transition oxides. Our investigation of the Ir RIXS spectrum as a function of incident photon energy shows that the intra- excitations steadily decrease with increasing the incident photon energy, whereas the high energy peaks corresponding to the transitions and the charge transfer transitions 5 possess oscillation dependence on the incident photon energy.
Acknowledgments
We are thankful to Dr. Alexander Yaresko from the Max Planck Institute FKF in Stuttgart and Dr. Yuri Kucherenko from the G. V. Kurdyumov Institute for Metal Physics of the N.A.S. of Ukraine for helpful discussions. The studies were supported by the National Academy of Sciences of Ukraine within the budget program KPKBK 6541230 ”Support for the development of priority areas of scientic research”.
References
- Jackeli and Khaliullin (2009) G. Jackeli and G. Khaliullin, Phys. Rev. Lett. 102, 017205 (2009).
- Chen et al. (2010) G. Chen, R. Pereira, and L. Balents, Phys. Rev. B 82, 174440 (2010).
- Witczak-Krempa et al. (2014) W. Witczak-Krempa, G. Chen, Y. B. Kim, and L. Balents, Annu. Rev. Condens. Matter Phys. 5, 57 (2014).
- Kim et al. (2008) B. J. Kim, H. Jin, S. J. Moon, J.-Y. Kim, B.-G. Park, C. S. Leem, J. Yu, T. W. Noh, C. Kim, S.-J. Oh, et al., Phys. Rev. Lett. 101, 076402 (2008).
- Martins et al. (2011) C. Martins, M. Aichhorn, L. Vaugier, and S. Biermann, Phys. Rev. Lett. 107, 266404 (2011).
- Antonov et al. (2018) V. N. Antonov, S. Uba, and L. Uba, Phys. Rev. B 98, 245113 (2018).
- Antonov et al. (2024a) V. N. Antonov, D. A. Kukusta, and L. V. Bekenov, Phys. Rev. B 109, 165120 (2024a).
- Qi and Zhang (2010) X.-L. Qi and S.-C. Zhang, Physics Today 63, 33 (2010).
- Ando (2013) Y. Ando, J. Phys. Soc. Jpn. 82, 102001 (2013).
- Wehling et al. (2014) T. O. Wehling, A. Black-Schafferc, and A. Balatsky, Adv. Phys. 63, 1 (2014).
- Bansi et al. (2016) A. Bansi, L. H, and T. Das, Rev. Mod. Phys. 88, 021004 (2016).
- Kim et al. (2009) B. J. Kim, H. Ohsumi, T. Komesu, S. Sakai, T. Morita, H. Takagi, and T. Arima, Science 323, 1329 (2009).
- Watanabe et al. (2010) H. Watanabe, T. Shirakawa, and S. Yunoki, Phys. Rev. Lett. 105, 216410 (2010).
- Witczak-Krempa and Kim (2012) W. Witczak-Krempa and Y. B. Kim, Phys. Rev. B 85, 045124 (2012).
- Go et al. (2012) A. Go, W. Witczak-Krempa, G. S. Jeon, K. Park, and Y. B. Kim, Phys. Rev. Lett. 109, 066401 (2012).
- Sushkov et al. (2015) A. B. Sushkov, J. B. Hofmann, G. S. Jenkins, J. Ishikawa, S. Nakatsuji, S. DasSarma, and H. D. Drew, Phys. Rev. B 92, 241108 (2015).
- Kimchi et al. (2014) I. Kimchi, J. G. Analytis, and A. Vishwanath, Phys. Rev. B 90, 205126 (2014).
- Balents (2010) L. Balents, Nature 464, 199 (2010).
- L and Balents (2017) L. S. L and L. Balents, Rep. Progr. Phys. 80, 016502 (2017).
- Khomskii (2014) D. I. Khomskii, Transition Metal Compounds (Cambridge University Press, Cambridge, 2014).
- Kugel et al. (2015) K. I. Kugel, D. I. Khomskii, A. O. Sboychakov, and S. V. Streltsov, Phys. Rev. B 91, 155125 (2015).
- Yamaura et al. (1999) K. Yamaura, H. W. Zandbergen, K. Abe, and R. J. Cava, J. Solid State Chem. 146, 96 (1999).
- Gardner et al. (1969) R. A. Gardner, M. Vlasse, and A. Wold, Acta Cryst. p. 781 (1969).
- Hirotsu (1977) S. Hirotsu, J. Phys. C 10, 967 (1977).
- Siegrist and Chamberland (1991) T. Siegrist and B. L. Chamberland, J. Less-Common Met. 170, 83 (1991).
- Hong and Sleight (1997) S.-T. Hong and A. W. Sleight, J. Solid State Chem. 128, 251 (1997).
- Zhao et al. (2007) J. G. Zhao, L. X. Yang, Y. Yu, F. Y. Li, R. C. Yu, Z. Fang, L. C. Chen, and C. Q. Jin, J. Solid State Chem. 180, 2816 (2007).
- Carim et al. (2000) A. H. Carim, P. Dera, L. W. Finger, B. Mysen, C. T. Prewitt, and D. G. Schlom, J. Solid State Chem. 149, 137 (2000).
- Klein et al. (2011) Y. Klein, G. Rousse, F. Damay, F. Porcher, G. Andre, and I. Terasaki, Phys. Rev. B 84, 054439 (2011).
- Köhl and Reinen (1977) P. Köhl and D. Reinen, Z. Anorg. Allg. Chem. 433, 81 (1977).
- Kimber et al. (2012) S. A. J. Kimber, M. S. Senn, S. Fratini, H. Wu, M. A. H. Hill, J. P. Attfield, D. N. Argyriou, and P. F. Henry, Phys. Rev. Lett. 108, 217205 (2012).
- Senn et al. (2013a) M. S. Senn, A. M. A. Lopez, T. Saito, Y. Shimakawa, and J. P. Attfield, J. Phys.: Condens. Matter 25, 496008 (2013a).
- Fernandez et al. (1980) I. Fernandez, R. Greatrex, and N. N. Greenwood, J. Solid State Chem. 34, 121 (1980).
- Senn et al. (2013b) M. S. Senn, S. A. J. Kimber, A. M. A. Lopez, A. H. Hill, and J. P. Attfield, Phys. Rev. B 87, 134402 (2013b).
- Rijssenbeek et al. (1999) J. T. Rijssenbeek, Q. Huang, R. W. Erwin, H. W. Zandbergen, and R. J. Cava, J. Solid State Chem. 146, 65 (1999).
- Streltsov (2013) S. V. Streltsov, Phys. Rev. B 88, 024429 (2013).
- von Treiber et al. (1982) U. von Treiber, S. Kemmler-Sack, and A. Ehmann, Z. Anorg. Allg. Chem. 487, 189 (1982).
- (38) J. T. Rijssenbeek, R. Jin, Y. Zadorozhny, Y. Liu, B. Batlogg, and R. J. Cava (????).
- Cheng et al. (2011) J. G. Cheng, G. Li, L. Balicas, J. S. Zhou, J. B. Goodenough, C. Xu, and H. D. Zhou, Phys. Rev. Lett. 107, 197204 (2011).
- Quilliam et al. (2016) J. A. Quilliam, F. Bert, A. Manseau, C. Darie, C. Guillot-Deudon, C. Payen, C. Baines, A. Amato, and P. Mendels, Phys. Rev. B 93, 214432 (2016).
- Fak et al. (2017) B. Fak, S. Bieri, E. Canevet, L. Messio, C. Payen, M. Viaud, C. Guillot-Deudon, C. Darie, J. Ollivier, and P. Mendels, Phys. Rev. B 95, 060402 (2017).
- Dey et al. (2012) T. Dey, A. V. Mahajan, P. Khuntia, M. Baenitz, B. Koteswararao, and F. C. Chou, Phys. Rev. B 86, 140405(R) (2012).
- Zhou et al. (2011) H. D. Zhou, E. S. Choi, G. Li, L. Balicas, C. R. Wiebe, Y. Qiu, J. R. D. Copley, and J. S. Gardner, Phys. Rev. Lett. 106, 147204 (2011).
- Nakatsuji et al. (2012) S. Nakatsuji, K. Kuga, K. Kimura, R. Satake, N. Katayama, E. Nishibori, H. Sawa, R. Ishii, M. Hagiwara, F. B. T. U. Ito, et al., Science 336, 559 (2012).
- Quilliam et al. (2012) J. A. Quilliam, F. Bert, E. Kermarrec, C. Payen, C. Guillot-Deudon, P. Bonville, C. Baines, H. Luetkens, and P. Mendels, Phys. Rev. Lett. 109, 117203 (2012).
- Nag et al. (2016) A. Nag, S. Middey, S. Bhowal, S. K. Panda, R. Mathieu, J. C. Orain, F. Bert, P. Mendels, P. G. Freeman, M. Mansson, et al., Phys. Rev. Lett. 116, 097205 (2016).
- Shirata et al. (2012) Y. Shirata, H. Tanaka, A. Matsuo, and K. Kindo, Phys. Rev. Lett. 109, 057205 (2012).
- Zhou et al. (2012) H. D. Zhou, C. Xu, A. M. Hallas, H. J. Silverstein, C. R. Wiebe, I. Umegaki, J. Q. Yan, T. P. Murphy, J. H. Park, Y. Qiu, et al., Phys. Rev. Lett. 109, 267206 (2012).
- Susuki et al. (2013) T. Susuki, N. Kurita, T. Tanaka, H. Nojiri, A. Matsuo, K. Kindo, and H. Tanaka, Phys. Rev. Lett. 110, 267201 (2013).
- Koutroulakis et al. (2015) G. Koutroulakis, T. Zhou, Y. Kamiya, J. D. Thompson, H. D. Zhou, C. D. Batista, and S. E. Brown, Phys. Rev. B 91, 024410 (2015).
- Quirion et al. (2015) G. Quirion, M. Lapointe-Major, M. Poirier, J. A. Quilliam, Z. L. Dun, and H. D. Zhou, Phys. Rev. B 92, 014414 (2015).
- Kim et al. (2004) S.-J. Kim, M. D. Smith, J. Darriet, and H.-C. zur Loye, J. Solid State Chem. 177, 1493 (2004).
- Sakamoto et al. (2006) T. Sakamoto, Y. Doi, and Y. Hinatsu, J. Solid State Chem. 179, 2995 (2006).
- Doi and Hinatsu (2004) Y. Doi and Y. Hinatsu, J. Phys.: Condens. Matter 16, 2849 (2004).
- Dey et al. (2013) T. Dey, A. V. Mahajan, R. Kumar, B. Koteswararao, F. C. Chou, A. A. Omrani, and H. M. Ronnow, Phys. Rev. B 88, 134425 (2013).
- Nag et al. (2018) A. Nag, S. Bhowal, F. Bert, A. D. Hillier, M. Itoh, I. Carlomagno, C. Meneghini, T. Sarkar, R. Mathieu, I. Dasgupta, et al., Phys. Rev. B 97, 064408 (2018).
- Dey et al. (2017) T. Dey, M. Majumder, J. C. Orain, A. Senyshyn, M. Prinz-Zwick, S. Bachus, Y. Tokiwa, F. Bert, P. Khuntia, N. Büttgen, et al., Phys. Rev. B 96, 174411 (2017).
- Khan et al. (2019) M. S. Khan, A. Bandyopadhyay, A. Nag, V. Kumar, A. V. Mahajan, and S. Ray, Phys. Rev. B 100, 064423 (2019).
- Doi et al. (2002) Y. Doi, K. Matsuhira, and Y. Hinatsu, J. Solid State Chem. 165, 317 (2002).
- Nag and Ray (2017) A. Nag and S. Ray, J. Magn. Magn. Mater. 424, 93 (2017).
- Ziat et al. (2017) D. Ziat, A. A. Aczel, R. Sinclair, Q. Chen, H. D. Zhou, T. J. Williams, M. B. Stone, A. Verrier, and J. A. Quilliam, Phys. Rev. B 95, 184424 (2017).
- Dey et al. (2014) T. Dey, R. Kumar, A. V. Mahajan, S. D. Kaushik, and V. Siruguri, Phys. Rev. B 89, 205101 (2014).
- Panda et al. (2015) S. K. Panda, S. Bhowal, Y. Li, S. Ganguly, R. Valentí, L. Nordstrom, and I. Dasgupta, Phys. Rev. B 92, 180403(R) (2015).
- Kao et al. (1996) C.-C. Kao, W. A. L. Caliebe, J. B. Hastings, and J.-M. Gillet, Phys. Rev. B 54, 16361 (1996).
- Ament et al. (2011) L. J. P. Ament, M. van Veenendaal, T. P. Devereaux, J. P. Hill, and J. van den Brink, Rev. Mod. Phys. 83, 705 (2011).
- de Groot et al. (2024) F. M. F. de Groot, M. W. Haverkort, H. Elnaggar, A. Juhin, K.-J. Zhou, and P. Glatzel, Nat. Rev. Methods Primers 4, 46 (2024).
- Revelli et al. (2022) A. Revelli, M. M. Sala, G. Monaco, M. Magnaterra, J. Attig, L. Peterlini, T. Dey, A. A. T. amd P. Gegenwart, T. Fröhlich, M. Braden, et al., Phys. Rev. B 106, 155107 (2022).
- Guo et al. (1994) G. Y. Guo, H. Ebert, W. M. Temmerman, and P. J. Durham, Phys. Rev. B 50, 3861 (1994).
- Antonov et al. (2004) V. Antonov, B. Harmon, and A. Yaresko, Electronic Structure and Magneto-Optical Properties of Solids (Kluwer, Dordrecht, 2004).
- Arola et al. (2004) E. Arola, M. Horne, P. Strange, H. Winter, Z. Szotek, and W. M. Temmerman, Phys. Rev. B 70, 235127 (2004).
- Nemoshkalenko et al. (1983) V. V. Nemoshkalenko, A. E. Krasovskii, V. N. Antonov, V. N. Antonov, U. Fleck, H. Wonn, and P. Ziesche, Phys. status solidi B 120, 283 (1983).
- Arola et al. (1997) E. Arola, P. Strange, and B. L. Gyorffy, Phys. Rev. B 55, 472 (1997).
- Antonov et al. (2022a) V. N. Antonov, D. A. Kukusta, and L. V. Bekenov, Phys. Rev. B 105, 155144 (2022a).
- Terzic et al. (2015) J. Terzic, J. C. Wang, F. Ye, W. H. Song, S. J. Yuan, S. Aswartham, L. E. DeLong, S. V. Streltsov, D. I. Khomskii, and G. Cao, Phys. Rev. B 91, 235147 (2015).
- Antonov et al. (2006) V. N. Antonov, O. Jepsen, A. N. Yaresko, and A. P. Shpak, J. Appl. Phys. 100, 043711 (2006).
- Antonov et al. (2007) V. N. Antonov, B. N. Harmon, A. N. Yaresko, and A. P. Shpak, Phys. Rev. B 75, 184422 (2007).
- Antonov et al. (2010) V. N. Antonov, A. N. Yaresko, and O. Jepsen, Phys. Rev. B 81, 075209 (2010).
- Andersen (1975) O. K. Andersen, Phys. Rev. B 12, 3060 (1975).
- Perdew et al. (1996) J. P. Perdew, K. Burke, and M. Ernzerhof, Phys. Rev. Lett. 77, 3865 (1996).
- Blöchl et al. (1994) P. E. Blöchl, O. Jepsen, and O. K. Andersen, Phys. Rev. B 49, 16223 (1994).
- Yaresko et al. (2003) A. N. Yaresko, V. N. Antonov, and P. Fulde, Phys. Rev. B 67, 155103 (2003).
- Dederichs et al. (1984) P. H. Dederichs, S. Blügel, R. Zeller, and H. Akai, Phys. Rev. Lett. 53, 2512 (1984).
- Pickett et al. (1998) W. E. Pickett, S. C. Erwin, and E. C. Ethridge, Phys. Rev. B 58, 1201 (1998).
- Antonov et al. (2022b) V. N. Antonov, D. A. Kukusta, and L. V. Bekenov, Phys. Rev. B 105, 155145 (2022b).
- Takayama et al. (2019) T. Takayama, A. Krajewska, A. S. Gibbs, A. N. Yaresko, H. Ishii, H. Yamaoka, K. Ishii, N. Hiraoka, N. P. Funnell, C. L. Bull, et al., Phys. Rev. B 99, 125127 (2019).
- Antonov et al. (2021) V. N. Antonov, D. A. Kukusta, L. Uba, A. Bonda, and S. Uba, Phys. Rev. B 103, 235127 (2021).
- Ogawa (1960) S. Ogawa, J. Phys. Soc. Jpn. 15, 1901 (1960).
- McGuire et al. (2017) M. A. McGuire, J. Yan, P. Lampen-Kelley, A. F. May, V. R. Cooper, L. Lindsay, A. Puretzky, L. Liang, S. KC, E. Cakmak, et al., Phys. Rev. Mater. 1, 064001 (2017).
- Miura et al. (2007) Y. Miura, Y. Yasui, M. Sato, N. Igawa, and K. Kakurai, J. Phys. Soc. Jpn. 76, 033705 (2007).
- Agrestini et al. (2017) S. Agrestini, C.-Y. Kuo, K.-T. Ko, Z. Hu, D. Kasinathan, H. B. Vasili, J. Herrero-Martin, S. M. Valvidares, E. Pellegrin, L.-Y. Jang, et al., Phys. Rev. B 96, 161107(R) (2017).
- Liu et al. (2012) X. Liu, V. M. Katukuri, L. Hozoi, W.-G. Yin, M. P. M. Dean, M. H. Upton, J. Kim, D. Casa, A. Said, T. Gog, et al., Phys. Rev. Lett. 109, 157401 (2012).
- Krajewska et al. (2020) A. Krajewska, T. Takayama, R. Dinnebier, A. Yaresko, K. Ishii, M. Isobe, and H. Takagi, Phys. Rev. B 101, 121101(R) (2020).
- Antonov et al. (2024b) V. N. Antonov, D. A. Kukusta, and L. V. Bekenov, Phys. Rev. Mat. 8, 074401 (2024b).