The Cosmic-Ray sea explains the diffuse Galactic gamma-ray and neutrino emission from GeV to PeV
Abstract
The LHAASO collaboration has recently released the spectrum and the angular distribution of the -ray Galactic diffuse emission from 1 TeV to 1 PeV measured with the Kilometer-2 Array (KM2A) and Water Cherenkov Detector Array (WCDA). We show that these data are in remarkably good agreement with a set of models that assume the emission to be produced by the Galactic population of cosmic rays if its spectral shape traces that measured by CALET and DAMPE as well as KASCADE at higher energies. No extra-components besides the CR sea is needed to explain LHAASO results. Accounting for unresolved sources, we consistently reproduce Tibet AS as well as a wide set of -ray data at lower energy. To do this, we consider two different transport setups: a conventional one and a -optimized spatial-dependent one (a development of the widely adopted KRAγ model). We demonstrate that both setups are compatible with LHAASO results. However, the latter is preferred if one takes into account Fermi-LAT gamma-ray data and neutrino measurements. In fact, we also compute the associated Galactic neutrino diffuse emission finding that the contribution from sources cannot be dominant and showing that spatial-dependent propagation models closely match the ANTARES and IceCube best fits for the Galactic Center Ridge and the Galactic Plane emissions. We argue that our -optimized model should be used as a template for future analyses of upcoming data from the Global Neutrino Network.
1 Introduction
The Galaxy is a guaranteed source of neutrinos produced by the interaction of the dominant hadronic component of Galactic Cosmic Rays (CRs) with the interstellar medium gas. This emission is the counterpart of the hadronically generated component of the -ray diffuse – or more precisely, interstellar – emission, detected by the Fermi Large Area space Telescope (LAT) [1] from a fraction of GeV up to hundreds GeVs and, more recently, by several Air Shower, water Cherenkov and Cherenkov Array ground-based experiments at higher energies (see below). The first pioneering estimates of the correlated expected neutrino Galactic diffuse emission (GDE) [2, 3] assumed uniform interstellar gas and CR and densities all over the Galaxy equal to their locally measured values. More recent works considered more realistic gas [4] and, subsequently, CR source distributions determined on the basis of astronomical observations and computed the CR propagated spectrum in each point of the Galaxy solving the transport equation [5, 6]. Although predicting a significantly larger flux than the previous computations also such an improved approach generally found, however, a GDE well below the expected sensitivities of the planned neutrino telescopes.
Besides the improvements of experimental and analysis techniques, the search of the GDE also revived by the introduction of a new class of CR transport models featuring a spatial-dependent CR transport setup suggested by a variety of analyses of Fermi-LAT data [7, 8, 9, 10, 11, 12] and possibly connected to non-trivial aspects of CR transport microphysics [13, 14]. Such class of models typically predict a considerable increase of the GDE in the innermost region of the Galactic Plane (GP) with respect to conventional (spatial-independent) models. In particular the so called KRAγ models [7, 8] were used in a number of ANTARES and IceCube analysis works looking for a possible signal from the GP [15, 16]. Noticeably, a combined maximum-likelihood estimate of the data of both experiments [17] yielded a non-zero GDE flux for both models with a p-value of for KRA and for the KRA. Afterwards the IceCube collaboration reported a hint using the KRA as a template with a best-fit normalization flux 0.85 times the predicted one [18].
The breakthrough, however, arrived with the IceCube collaboration announcement of a clear identification of the GDE with a 4.5 significance [19]. In order to cope with the overwhelming down-going muon background, a deep learning analysis was used to build the sample of fifty thousand neutrino cascade events used in this template fitting analysis. That required a statistical fit of the data against some spatial and spectral distribution template models of the emission. Again, the KRA models (the exponent representing the assumed exponential cutoff energy of the CR source spectrum) were used for that purpose together with a conventional GALPROP-based [20] model ( [1]), identified as model in this context. That model does not include the aforementioned spatial-dependent diffusion setup. Using that approach, IceCube [19] found an excess with respect to the background with significances 4.71, 4.37 and 3.96 for the , KRA and KRA models, respectively. Even more recently, the KRA template was adopted as a benchmark in the analysis of the ultra-high-energy event KM3-230213A [21] reported by the KM3NeT collaboration aimed at assessing its potential Galactic origin [22].
Regarding the IceCube analysis, it is important to notice the significantly different rescaling factors required for the original physical models to fit IceCube data. At 100 GeV they were found to be 4.5, 0.55 and 0.37 for the , KRA and KRA models, respectively. The large discrepancy between the IceCube fit and the original GALPROP-based physical model may indicate a potential tension with Fermi-LAT data.
Moreover, the model does not account for the IceCube finding of a hardening of the GDE in the innermost region of the GP, with , where the spectral index gets close to (see Fig. S11 in the Supplementary Material of Ref.[19]). Rather, that feature is just one of the distinctive behaviors predicted by the KRAγ models. In fact, the original model assumes a featureless spectrum with spectral index up to several PeV in the whole Galaxy then failing to reproduce the hardening founds in the Fermi-LAT data above 10 GeV in the inner GP for the corresponding -ray Galactic diffuse emission (GDE) [1, 9]. That is not the case for the KRAγ models which were originally built to reproduce that feature invoking a progressive hardening of the diffusion coefficient rigidity dependence, hence of the propagated CR spectrum, towards the Galactic Centre (GC) [7]. As a consequence, the GDE and GDE predicted by the KRAγ models at very high energies are significantly more peaked and harder in that region with respect to conventional models 111see also [11] for an analytical and more phenomenological implementation of the same scenario. including the one. This is crucial to allow these models to consistently match Fermi-LAT data and the very high GDE and GDE emissions up to the PeV from the GP including the GC Ridge [23].
On the other hand, the KRA models if normalized against the Fermi-LAT data over-predict IceCube fits by a factor 1.8(2.7). As we will argue, this discrepancy may be due to an oversimplified CR source spectral shape assumed for these models at their highest energies, which was adopted given the lack of high-energy CR data at TeV-PeV energies.
A valuable independent input on the Very High Energy (VHE) spectral energy distribution of Galactic CRs has recently been provided by a new generation of orbital experiments as well as of Air Shower (AS) and Water Cherenkov Detector Arrays (WCDAs) which besides CR spectra and composition up to several PeVs first measured the GDE up to the PeV allowing an indirect probe of the CR Spectral Energy Distribution (SED) well beyond our local region. Among them the HAWC WCDA experiment recently measured the GDE between 300 GeV and 100 TeV [24] in a limited region of the GP, while Tibet AS [25] and LHAASO [26, 27] probed more extended and inner regions up to the PeV. Although Tibet and LHASSO found apparently discrepant results – which however may be due to the different procedures they adopt to mask resolved sources (see e.g. [28] and the Discussion below) – both experiments agreed claiming to have found in the inner GP a GDE larger than expected if the Galactic CR flux would everywhere be the same as the local one. Since at such high energies the GDE is expected to be dominated by hadronic emission, those findings may have relevant implications for the interpretation of IceCube results as well.
A significant update of the KRAγ models (as well as of the corresponding conventional models) was carried out in Refs. [29, 30], where the injection spectrum was re-evaluated using the most recent CR data available as well as Fermi-LAT data. Two alternative source spectral shapes (Min and Max) were considered for the CR protons and helium nuclei in order to bracket the uncertainty in the PeV region, where the different datasets provided by KASCADE [31, 32] and IceTop [33] differ significantly. The predictions of those models were then compared with Tibet AS [25] and preliminary LHAASO results [34] taken in the sky window and [29]. While finding a general consistence between IceCube results and -ray data, those analysis showed that the available data did not allow to discriminate between Min and Max scenario.
Here we take a step further: We perform a comprehensive comparison of our models to both the GeV-TeV diffuse gamma-ray data and the very-high-energy data in the TeV-PeV domain. As in the aforementioned studies dedicated to LHAASO and Tibet data, we do not aim at providing a best fit of the data: Instead, once the CR injection spectra are tuned to the local charged CR data, and the propagation setup is tuned on measurements of secondary-to-primary CR ratios (both in the conventional case and in the radial-dependent case), we directly compute our prediction for the -ray flux with the HERMES code [35]. We do not further tune any additional parameter to reproduce the very-high-energy gamma-ray data. The same procedure is followed to obtain predictions of the diffuse VHE fluxes from models of uniform propagation (Conventional models, or “Base” models).
After presenting (Sec. 2) our improved models and discussing the predicted Inverse-Compton (IC) emission at energies above 100 GeV, we perform, in Sec. 3, a comparison of the predictions of our -optimized models in different sky windows along the Galactic plane with updated Fermi-LAT observations up to several hundred GeV. Then, we report a comparison with the recent HAWC measurements [24] between 300 GeV and 100 TeV, as well as with Tibet-AS at higher energies [25]. In this context, we extensively discuss the role of unresolved sources. Moreover, we compare with LHAASO-KM2A [26] data, as well as the recently released LHAASO-WCDA data [27] and discuss the implications of the mask used by the LHAASO collaboration to remove the contribution of sources. Finally, in Sec. 4 the relevant implications of our findings for neutrino astronomy will be discussed including a comparison with recent ANTARES results. In Sec. 5 we discuss the implications of our results and summarize our main conclusions.
2 The -optimized models: an updated KRAγ
In our previous works [29, 30] we introduced two classes of models for the -ray diffuse emission: the “Base” and “-optimized” models, a development of the “Conventional” and “KRAγ” models.
Both scenarios are based on numerical solutions of the transport equation performed with the DRAGON2 code [36, 37], a widely used public tool to compute the energy and spatial distribution of charged CR data in any point of the Galaxy222https://github.com/cosmicrays/. In both models, the normalization of the CR fluxes is set by local data, and the local transport properties are tuned on secondary-to-primary ratios.
The key difference is that, while the Base model is characterized by homogeneous diffusion along the Galactic plane (as often assumed in large-scale propagation setups), the -optimized model features a radial-dependent diffusion setup. The latter is strongly suggested by a large number of analyses of Fermi-LAT data performed over more than a decade, adopting a variety of statistical methods [7, 8, 9, 10, 11, 12]. The remarkable phenomenological consequences of these models in the context of multi-messenger multi-TeV astronomy – both regarding the whole Galactic plane and specific regions – have also been pointed out in a variety of papers [23, 38, 39, 40].
The -optimized models provide an improved treatment upon KRAγ models first introduced in Ref. [8] and feature updated gas maps, more accurate CR propagation setup (as detailed in [29]), and improved tuning on a wide range of locally measured charged CR data in the whole energy range available, from the GeV to the PeV domain.
In the following, we provide a further improvement of these models and a comprehensive comparison to all available -ray data from the GeV to the PeV domain 333The FITS files of the updated models can be found at https://github.com/tospines/Gamma-variable_High-resolution.
2.1 CR nuclei source spectra: the Min and Max setups
The considerable precision recently reached by space-based CR experiments such as PAMELA [41] AMS-02 [42, 43], DAMPE [44, 45], CREAM/ISS-CREAM [46, 47], ATIC-2 [48], CALET [49] or NUCLEON [50], has significantly improved our knowledge of the composition and spectral energy distributions of primary and secondary CRs up to TeV, allowing to develop better models of particle acceleration and Galactic CR transport (see e.g. Ref. [51]). However, at higher energies, these direct measurements become more challenging, and – due to limited statistics – only indirect measurements are available, obtained by the analysis of atmospheric showers. These high-energy detectors, capable to reach energies of up to GeV, are mostly able to measure CR protons and helium and suffer from severe uncertainties from the reconstruction of the shower at different heights.
As a result of these complementary experimental efforts and these challenges, several features are being revealed at GeV-TeV energies showing a more complex structure with respect to a simple power-law behaviour. However, at even higher energies, the “CR knee” region is still subject to important uncertainties that may be hiding potential features in the spectra.
In our models, the injection of CRs is assumed to follow a broken power-law behaviour, a functional form that allows to correctly reproduce the spectral features obserbed by the aforementioned CR experiments (see for instance Sec. 3 of Ref. [29]). The normalization of the spectrum is spatial dependent and follows the spatial distribution of supernova remnants as modeled in [52, 53]. The slopes are instead considered uniform, since SNRs (and other classes of Galactic accelerators) are typically expected to provide a similar injection independently of their position in the Galaxy.
In the following we do not account for CR species heavier than helium since, under reasonable conditions, their contribution to the -ray emission is subdominant (less than 10%) with respect to that due to protons plus helium [54]
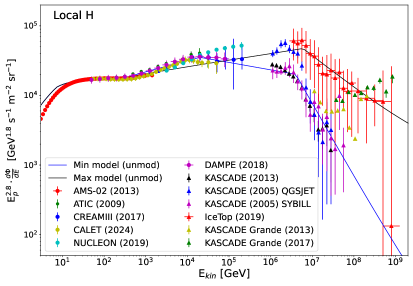
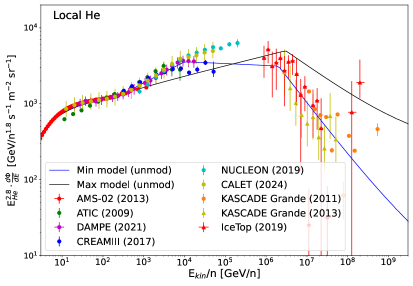
One of the main discrepancies in the very-high-energy domain ( TeV) is the significant difference between the proton spectrum measured by KASCADE [31] and KASCADE-Grande [32] on the one hand, and that measured by IceTop [33] air-shower experiments on the other hand. This discrepancy turns into a factor of (at least) a few uncertainty in the predicted TeV-PeV diffuse -ray and neutrino emissions. We consider here two alternative setups, one reproducing KASCADE + KASCADE-Grande, as well as CALET [49, 55] and DAMPE [44] at lower energies (what we call “Min” setup) and another one following the measurements by IceTop (the “Max” setup). The local (propagated) spectra (fitted to data) of CR proton and helium for the Min and Max setups are shown in Fig. 10, compared to existent CR data sets, covering around nine orders of magnitude in energy. Complete details are provided in [29] (see also Ref. [30]). We note that having more and more precise measurements of the -ray diffuse emission at different regions of the Galaxy would allow us to infer the distribution of CRs, or, at least, to have valuable complementary information to local CR data.
2.2 CR electron and Inverse-Compton emission
The leptonic component of the CR sea produces -rays via bremsstrahlung and IC scattering. In order to estimate these contributions, we need to model the spatial distribution and spectrum of CR electrons (and positrons) in the Galaxy. We use DRAGON2 to compute the steady state solution of the diffuse electron/positron distribution, based on the local electron and positron spectra measured from various detectors [56, 55, 57, 48, 42, 58].
A key aspect in this context is the fact that the high-energy positron spectrum (above a few tens of GeV) may be dominated by the emission from pulsars, which inject equal amounts electrons and positrons. We describe this component as a broken power-law with a cut-off, tuned to the AMS-02 local positron data. Therefore, as far as the total lepton spectrum is concerned, we perform our modeling under the assumption that two classes of sources are at work: SNRs (that accelerate electrons), and pulsars (that accelerate electrons and positrons in equal amounts). The injection spectrum of SNRs in tuned on the electron spectrum, while the pulsar contribution is tuned on the positron component.
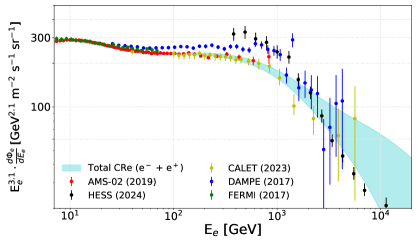
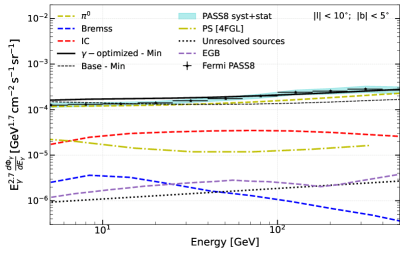
We show our results concerning the leptonic component of the CR sea in Fig. 1. In order to bracket the large uncertainties associated to the different normalization of different datasets (possibly due, among other effects, to energy calibration), we consider a range of rigidities for the high-energy cutoff of the injection spectrum. The range [ GeV - TeV] is adequate to capture the large scatter that characterize the data reported by the most important experimental collaborations in this channel.
Another important ingredient in this computation is the distribution of sources in the Galaxy, due to the fact that electrons and positrons lose energy very quickly in the high-energy domain as a consequence of to Inverse Compton and synchrotron emission. Here we provide a more refined model for this astrophysical ingredient with respect to the previously published models: We adopt a spatial distribution of sources that follows the spiral arm distribution of our Galaxy, based on the 4-arm model derived in Ref. [59]. This setup is relevant only as far as the leptonic component is concerned (protons do not suffer from the aforementioned energy losses in the high-energy domain). We will refer to this scenario as the 3D model.
While both the previously considered cylindrical model and the 3D model lead to equally good fit of local CRe data, the injection spectra is harder for the case of a source distribution following the spiral arms. This is needed to compensate the fact that the average distance of a source with respect to the Earth is larger in the 3D model, because the Earth is located at the edge of the Sagittarius arm, resulting in severe energy losses for CRe. As a consequence, the average IC emission in the plane of the Galaxy increases by a factor of a few in the 3D model we consider here. This is shown in the right panel of Figure 1, where we compare a variety of measurements in the Galactic region at and with the expected IC emission predicted from with the 3D source distribution (blue line) and from a cylindrical distribution of sources (the Ferriere distribution, also used for CR nuclei, as discussed above). We display here, around the prediction from the 3D model, the uncertainty band due to the variations in the cutoff from to TeV. The lines describe the predicted IC emission assuming the cutoff at TeV. As seen, the difference between both estimations is above a factor of at TeV, but the total emission is always lower than a of the measured -ray emission at that region of the Galaxy and totally negligible above a few tens of TeV.
We note that a potential limitation of our modeling is that we are assuming a smooth distribution of electron sources, while a Monte Carlo approach that accounts for a stochastic distribution of sources could be more accurate at these energies (see for instance [60]).
Finally, we note that we disagree significantly with Ref. [61], where the authors obtain a dominant IC emission at TeV energies. This can be due to the fact that their median distribution of local electrons appears to be significantly higher than the one that we fit to local data. In fact, the new H.E.S.S. data [62] seems to be in significant tension with their estimated confidence interval. We also show that our estimations are compatible with Fermi data above and below the Galactic plane, where the IC emission becomes more significant, in the right panels of Figs. 3 and 11. The study of synchrotron emission in these regions of the Galaxy will be fundamental to constrain better the CRe spectrum. Unfortunately, to constrain the cutoff energy, we need measurements at frequencies above, at least GHz, where data is scarce and there is also an important free-free emission. In addition, uncertainties in the magnetic field intensity prevent us from obtaining robust conclusions. Future CTA [63] data on the CRe local flux and anisotropies will certainly help us understand the role of nearby sources and the IC emission in the Galaxy.
3 Predicted -ray Galactic emission from 10 GeV to 1 PeV
In this section, we compare the prediction of our -optimized models with the measurements taken by several -ray experiments over a wide range of energies. The spectrum of the GDE measured by this experiment provides an indispensable lever arm to model the neutrino and -ray diffuse emissions at larger energies.
To determine the spectrum of -rays produced by the scattering of CR protons and helium onto the interstellar hydrogen and helium gas we use the AAFRAG packgage [64, 65] which, respect to other parameterizations, minimizes the computed emission and is the most updated. The uncertainty associated to that choice has been discussed in Ref. [66] (see also Ref. [67]).
All the spectra and angular distributions of the , as well as of the , interstellar emission shown below are obtained with the HERMES code [35] which also accounts for opacity due scattering onto the CMB and the Interstellar Radiation Field as shown in Ref. [29]. Details about the interstellar gas distribution used in this work can be found in that paper. We remark that the predictions of the hadronic diffuse emission that we show in the following sections were already available in Refs. [29, 30]. Here, we perform a detailed and comprehensive comparison with all the recently released high-energy data sets without any further tuning on the aforementioned prediction (as far as the hadronic component is concerned).
3.1 Comparison with Fermi-LAT data
The Fermi-LAT collaboration has provided the most detailed and accurate information on the -ray sky over a wide energy range from from GeV to from TeV, with angular resolution reaching in the range from to GeV. These data are currently the most valuable tool to build templates aimed at studying the very-high-energy emission in multi-messenger context. This -ray map allowed to infer the gradual change in the slope of the hadronic component towards the center of the Galaxy that we discussed in the previous Sections [7, 9]. Such trend has been confirmed by a variety of studies, and was shown to persist above few tens of GeV [12].
In this Section we present a comparison between our models and Fermi-LAT data. In more detail, we test our prediction taking into account:
-
•
The sum of the truly diffuse gamma-ray emission ( emission, Inverse Compton and bremsshtrahung) obtained with the HERMES code as detailed in the previous Section.
-
•
The emission from the point sources reported and modeled in the 4FGL-DR2 [68] catalog
-
•
The isotropic background as provided by the Fermi-LAT collaboration444We adopt here the template that refers to CLEAN data: (iso_P8R3_CLEAN_V3_v1) from https://fermi.gsfc.nasa.gov/ssc/data/access/lat/BackgroundModels.html. This component is actually a sum of the “true” extragalactic diffuse flux and the residual mis-classified CRs.
- •
The dataset consists in more than 12 years of Fermi-LAT data, analyzed as explained in Ref. [29], to which we refer the reader for details.
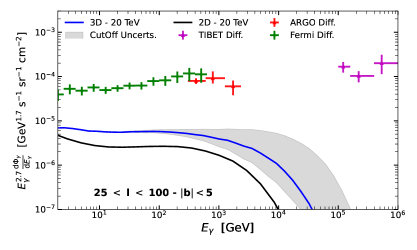
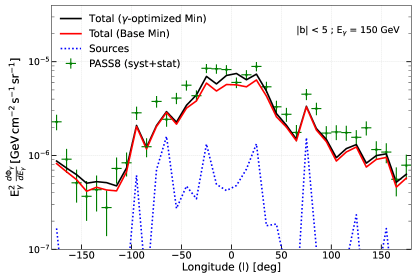
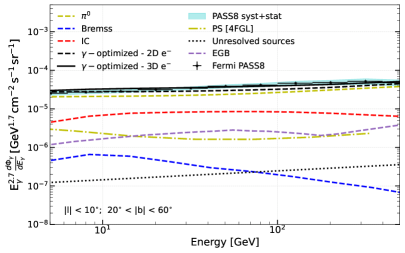
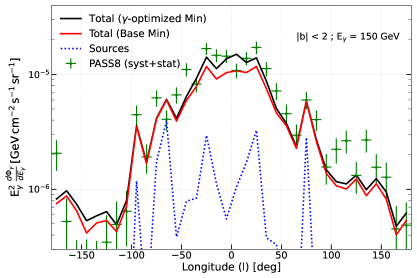
The first comparison we present concerns the Galactic longitude and latitude profiles, displayed in Fig. 2. The “Total” lines represented in this panel correspond to the sum of the four components listed above, for both our updated “Base” and “-optimized” (i.e. featuring inhomogeneous diffusion) model.
Overall, we point out a good agreement between the relevant features exhibited by the data and our models, especially as far as the longitude profile is concerned. This is a consequence of the detailed gas model implemented in HERMES, that allow to trace the morphology of dominant emission from decay with remarkable accuracy.
We notice that the difference between the -optimized and Base model becomes relevant in the inner and , as expected given the progressive hardening towards the center that characterized the former class of models.
Moreover, we see that emission from sources can be very important in certain regions of the Galaxy. In turn, we observe that emission at high latitudes is dominated by the isotropic (Extra-Galactic) background, with a non-negligible subdominant contribution from the diffuse emission. We show a similar figure for other regions of the sky (showing a similar agreement to data) in Fig.12, and other similar comparisons can be found in Ref. [30].
As we see from these comparisons, the inhomogeneous diffusion setup with a hardening towards the GC improves the agreement of our predictions with Fermi-LAT observations, as highlighted in the aforementioned statistical analyses performed over a decade.
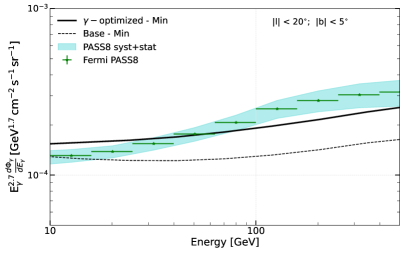
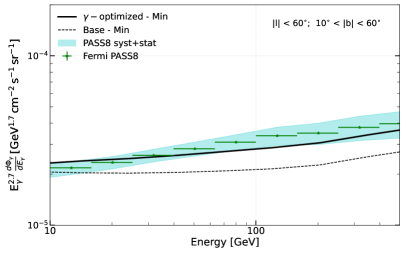
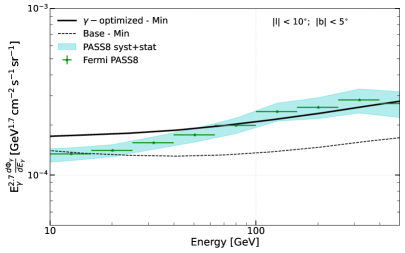
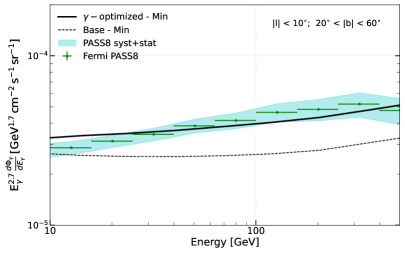
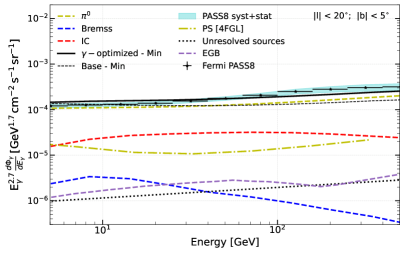
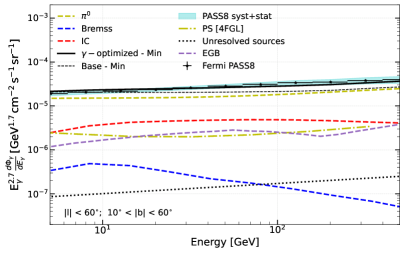
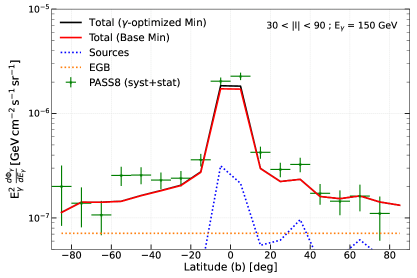
More evidence favoring this scenario is shown in Fig. 3, where we report a spectral comparison of the predictions for the -optimized and Base models – both in their Min setup – with the Fermi-LAT data in four different sky windows. The cyan bands around the data represent the systematic uncertainties from the effective area (plus statistical uncertainty, that is usually negligible in comparison). The two left panels focus on a region that contain the GC, where hadronic emission is significantly dominant, while the right panels focus on regions above the GP, where the IC contribution becomes more relevant. As we see here, the difference between both models becomes very important in comparison with the Fermi-LAT uncertainties in the measurement. A similar figure is shown in Fig. 11 (Appendix B) but detailing the different components of the -ray emission. Again here, in the left panels we show the different contributions to the emission close to the GP (), while in the right panels we show the emission for zones of the Galaxy away from the Galactic plane. As shown above, the Base and -optimized models differ more significantly in zones close to the Galactic plane. Here, while bremsstrahlung contribution is always very subdominant (contributing, at most, at the percent level), the IC contribution constitutes around a of the total emission in the Galactic plane and larger than a out of the plane (especially, this can be seen in the bottom-right panel, where the IC contribution reaches around a of the total flux).
We also note that the contribution from unresolved sources, although increasing its importance with energy, remains very low for Fermi-LAT even at high latitudes. However, our estimation of the contribution of unresolved sources to Fermi-LAT observations is only accurate below GeV. This is due to the lower effective area above these energies and the fact that above GeV the spatial resolution of the detector is significantly poorer.
We note a remarkable agreement of our model with Fermi-LAT observations above few tens of GeV in different zones of the Galaxy (more details can be found in Refs. [29, 30]). We also note that our model is much simpler than the Fermi-LAT diffuse template: In fact, the latter requires the independent tuning of several spatial templates in each energy bin and the addition of dedicated patches. However, the accuracy of our modeling of Fermi-LAT data is enough for the purpose of the present paper, given the large uncertainties in the TeV-PeV data.
3.2 Comparison with HAWC results
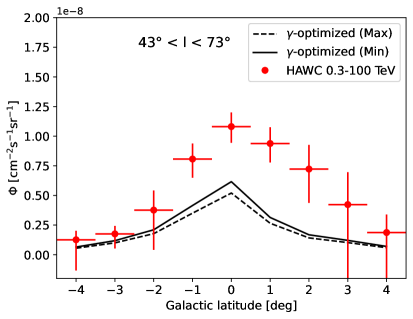
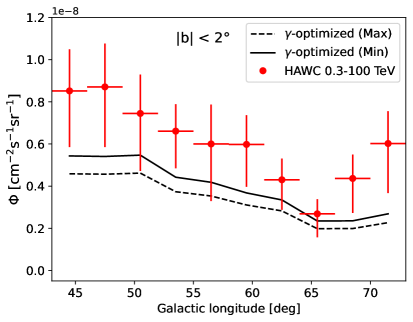
The High-Altitude Water Cherenkov Observatory (HAWC) is a VHE -ray observatory consisting in 300 Water-Cherenkov detectors, covering an area of 22,000 m2 in Mexico. We consider here latest published diffuse data from Ref. [24]: They span the energy range from GeV to TeV and cover the Galactic plane region at . The HAWC collaboration presented the average DGE in this longitude range at (the inner plane) and (shown in Fig.4), as well as the flux divided in three sub-regions , and . In addition to these averaged fluxes, they provided the longitudinal (from to , with wide longitude bins) and latitudinal emission profiles (from to in 9 latitude bins wide, at ) (shown in the Fig. 13).
The HAWC diffuse analysis [24] is based on a template-fitting technique, and adopts an older version of the Base model (Base5) [8] as a spatial template for the GDE. The emission of point-like and extended sources from H.E.S.S. [56] and third HAWC [70] catalogs was subtracted. The GDE spectrum in the region , was fitted with a power-law with index , finding a normalization a factor two higher than the Base5 model [8] prediction. The systematic uncertainties of the measurement are not included in the analysis.
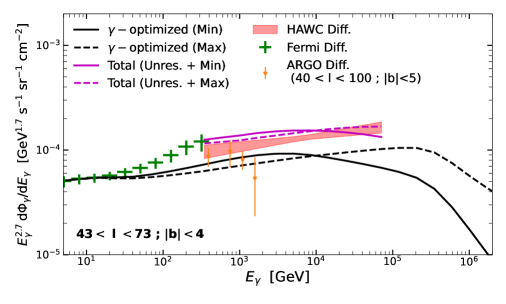
In Fig.4, we compare the spectrum measured by HAWC (as a salmon red band) at and to our -optimized Min and Max models (black lines). In this figure, we also include Fermi-LAT diffuse data (i.e. the emission after subtracting point-like sources and the EGB) and ARGO data [71] (available in a slightly different region, at and ). We did not apply any mask here, which is expected to only affect our result with a slight reduction of the predicted diffuse flux, given the very small portion of the Galactic plane that is masked in the HAWC analysis. We notice factor difference between the HAWC measurement to the predicted emission from the -optimized model (and similarly for the most inner region at ). This is expected because the contribution from unresolved sources must be significant for the HAWC detector in this region (see, e.g. [72, 73, 74]). To show this, we also include an estimation of the total GDE emission (magenta lines) in this figure, which is the result of summing the truly diffuse emission from CR interactions (from the Min and Max -optimized models) plus the contribution from unresolved sources that was estimated in Ref. [74], where the authors showed a remarkable agreement between previous HAWC measurements and the total GDE. As we see, summing both contributions, which were derived in a totally independent way, lead to a reasonable match of HAWC observation (which includes only statistical errors). Unfortunately, given the relevance of unresolved sources here and the fact that in this region of the sky the difference between our Base and -optimized models is only of tens of percent (much lower than the uncertainties in the measurement), current HAWC measurements cannot provide evidence for uniform or inhomogeneous CR propagation. However, these observations clearly show that the contribution from the truly diffuse -ray emission (i.e. the one only coming from CR interactions) must be very relevant, and probably dominant at TeV energies. Moreover, no clear preference for the Min or Max setups can be obtained at those relatively low energies.
In the Appendix C (Fig. 13) we also compare our models with the GDE longitude (right panel) and latitude (left panel) profiles measured by HAWC (integrated between and TeV). We note here that while the regions at high latitude seem to be reasonably well described by the truly diffuse emission, the regions closer to the Galactic plane (where we expect more sources [72]) require a significant, although still subdominant, contribution from unresolved sources.
3.3 Comparison with Tibet-AS results
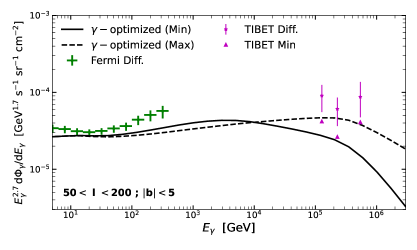
The first detection of the GDE above GeV was achieved by the Tibet-AS collaboration [25]. This consists of a hybrid experiment, located in China, using a surface array (AS) combined with an underground water-Cherenkov-type muon detector array. The AS array covers a large area of m2 while the underground muon detector array has a detection area of m2. The angular resolution is estimated to be approximately and for and TeV gamma rays, respectively. The Tibet collaboration claimed a GDE detection with significance 5.9 for TeV and .
To extract the GDE, Tibet adopts a mask to avoid emission from the point-like sources reported in the TeVCat, HAWC and LHAASO catalogs, removing around their nominal positions. Again here, the mask only subtracts a very small portion of the GP, therefore resulting in a measurement that is expected to represent the real GDE in the range. The Tibet collaboration provided their observation in two regions: one at , (region A) and another at , (region B) – which are shown in Fig. 5 ). Remarkably, in Ref. [75], the authors showed that none of the Tibet diffuse -ray events detected above TeV come from the LHAASO catalog sources detected above TeV, supporting the diffusive nature of these events. However, the fact that the emission around certain sources (especially, the Cygnus cocoon [76]) can be more extended than what they assumed, have triggered discussions about the possible overestimation of the GDE measured by Tibet. In this respect, we also remark that the highest-energy Tibet data point is estimated from only events, with a few of them coming from a region close to the Cygnus cocoon. Interestingly, a few studies have pointed to this as the origin of the discrepancy between the -GDE measured by LHAASO and Tibet. Here, we find that Tibet -GDE is between a few tens of percent and a bit more than a factor of larger than the flux measured by LHAASO in both, inner and outer regions, after rescaling their measurements to account for the effect applying the LHAASO mask and the slightly different regions where the experiments provided their observations (see more details in the next section).
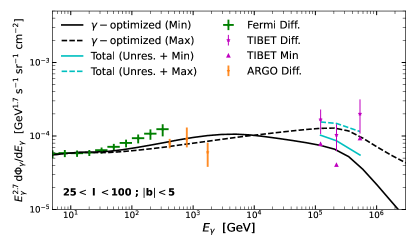
In Fig. 5 we compare our -optimized Min and Max models with Tibet-AS results. The GDE spectral observations from Fermi-LAT and ARGO-YBJ [71] in the same region are also reported (ARGO data is only available for Region A).
Let us clarify some aspects of this comparison:
- •
-
•
We do not apply any mask to our models, since we expect that the Tibet mask would only affect our prediction at percent level.
-
•
As far as unresolved sources are concerned, Refs. [72, 74, 75, 78] estimated this contribution to be lower than of the total GDE. Here, we use as reference the estimated flux of unresolved sources derived in Ref. [77], which is shown summed to the truly diffuse emission (i.e. originated from CR interactions) to give the cyan line shown in the left panel.
The limited statistics does not allow to claim a preference for a class of model with respect to the other. Both the Base and the gamma-optimized scenarios – both in the “Min” and “Max” versions – appear compatible with the data. We can however safely conclude that truly diffuse emission must dominate the emission, with a subdominant (but non-negligible) contribution from unresolved sources.
In fact in Ref.[75] it was estimated that source gives the largest contribution in both regions A and B; it accounts for 34.9% (43.6%) of the source flux at 100 TeV (1 PeV) in region A, while 35.8% (51.8%) at 100 TeV (1 PeV) in region B.
In [25] the measured spectra were compared with a conventional and a spatial dependent analytical CR models presented in Ref.[11]. In the inner region (A) Tibet results looked in slightly better agreement with the spatial dependent scenario although the scatter of the data points and their large errors did not allow a conclusive preference of one models over the other. although unresolved sources may explain it.
3.4 Comparison with LHAASO results
The Large High Altitude Air Shower Observatory (LHAASO) is a large area, wide field-of-view observatory for CRs and -rays using a hybrid detection technique [79]. This experiment combines measurements taken with the 78,000 m2 wide Kilometer-2 Array (KM2A) charged particle detector with those of a Water Cherenkov Detector Array (WCDA) allowing to cover an energy interval going from few TeV up to PeV. Due to its wide field of view and energy band coverage and resolution, LHAASO is presently the best instruments suited to study the GDE above the TeV. With an unprecedented sensitivity to very-high energy events, LHAASO has an angular resolution of - at 10 TeV around at 1 PeV, which allows it to discern extended Galactic sources and study the long-sought PeVatrons [80]. While the field of view (2 sr) and energy and spatial resolutions are comparable to those of Tibet, its sensitivity allows LHAASO to collect much more events and have measurements with high significance in much shorter times.
After releasing preliminary measurements of the diffuse -ray emission in Ref. [34], the LHAASO collaboration presented its official results for the average diffuse flux in two different regions covering the Galactic plane – the inner () and outer () regions () – from TeV to PeV obtained with the KM2A array, in Ref. [26]. Moreover, they also provided latitude and longitude emission profiles in the - TeV and - TeV energy bands. More recently the collaboration updated those results including also the GDE flux measurement performed with the WCDA from to TeV, which led to the release of wide-band spectral distributions in the inner and outer regions from 1 TeV to 1 PeV [27]. Latitude and longitude emission profiles were released also for the - TeV energy band. The detection significance of the GDE measured by the combined WCDAKM2A was found to be 24.6 and 9.1 in the inner and outer regions respectively.
Interestingly, the WCDA spectra are consistent with a power-law with indices of and in the inner and outer regions, respectively, hinting (with a significance of ) that the primary CR spectrum may get harder toward the GC. However, we will see that current LHAASO data do not provide enough discriminating power to robustly confirm or constrain spatially-dependent CR propagation models at the moment.
The fluxes of the diffuse emission were found to be higher by a factor of than a simple reference model that assumes local values for the CR flux and gas density across the Galaxy. However, more realistic conventional models of the GDE (as, for instance, our Base models) that take into account the increase of the number of CR sources and gas densities towards the GC [81], predict significantly higher GDE fluxes which are still compatible with LHAASO results (see Fig. 4 in Ref. [30], and Fig.16 in the Appendix C, as well as the detailed study of Ref. [67].
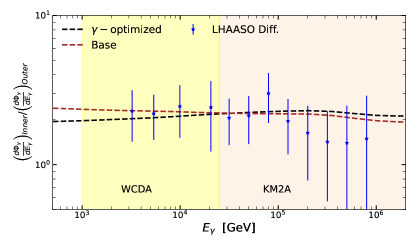
The main reason making LHAASO data still insufficient to discern between inhomogeneous and uniform models of CR propagation is the mask that they use to remove the emission from sources. Their procedure requires masking a significant area around the sources listed in the TeVCat [82] and those detected by LHAASO [83]. This results in quite a severe reduction of the portion of the GP observed (see Fig. 1 of Ref. [27]), that especially cuts away most of the inner around the GP, where the GDE flux is predicted to be higher and where the difference with non-uniform CR propagation models is expected to be most prominent. As a consequence the GDE flux measured by LHAASO along the GP is lower than the real one (see e.g. Fig.8 ) and a consistent comparison with the measurements requires applying the mask also to the predicted GDE.
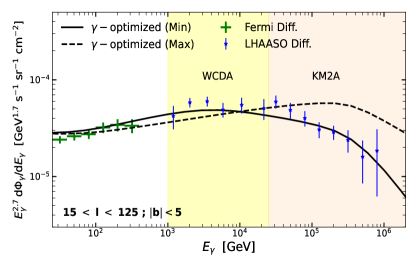
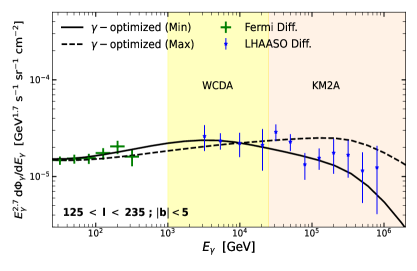
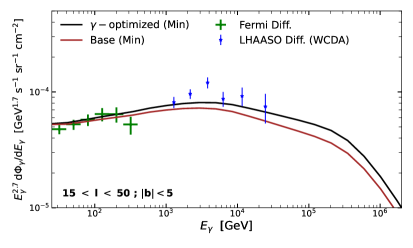
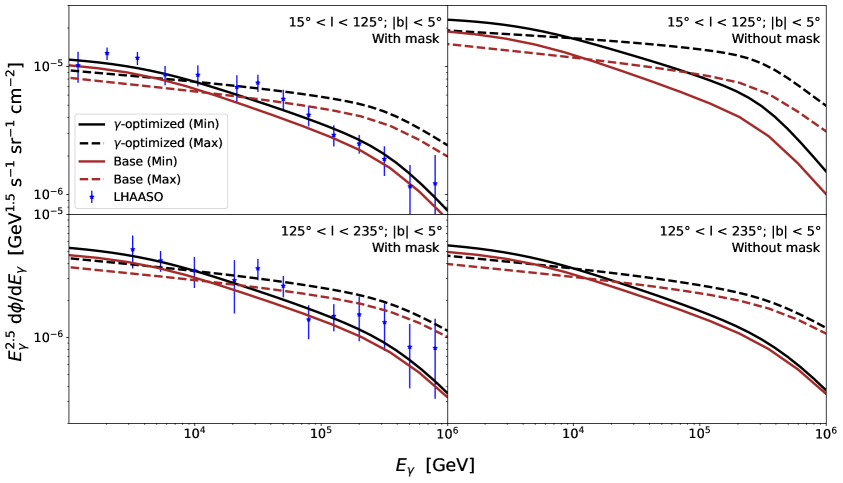
In Fig.6 we plot the wide-band spectra of the GDE predicted with the -optimized Min and Max models, in comparison the Fermi-LAT and LHAASO WCDA+KM2A data in the inner (left panel) and outer (right panel) regions. The Fermi-LAT measurements shown here are those applying the LHAASO mask and subtracting contribution from sources in the 4FGL catalog and the EGB. As we see, the agreement between the Min model predictions and the data, over more than four energy decades, is quite remarkable bearing in mind that this is not the result of a fit but is a prediction based on CR and Fermi data. In particular, the reduced value (computed as over number of LHAASO data points) is of for the Min model and 9.5 for the Max model, in the inner region, and of and for the Min and Max models, respectively, in the outer region. This means, more than evidence that the Max model is incompatible with LHAASO data. This result leads to the conclusion that the IceTop measurements of the local CR spectrum are incompatible with LHAASO-KM2A data if its shape is representative of the large scale Galactic CR population.
Moreover, the contribution from unresolved sources (which are expected to be more concentrated at low latitudes) is heavily suppressed with respect to the truly diffuse emission –arising from the interactions of the CR sea – as a consequence of the masking technique adopted by the LHAASO collaboration. There have been a few recent papers estimating the contribution from unresolved sources to the LHAASO masked data [67, 28, 72]. They all agree with the fact that the contribution from sources must be lower than , depending on the energy range. In particular, Ref. [28] claimed that a model with homogeneous diffusion could not explain the LHAASO measurements (namely, from the WCDA) in the inner Galaxy with the expected contribution of unresolved sources. Taking the most constraining data point (exactly at TeV), we estimate that the maximum contribution from unresolved sources in the inner region is of at the . However, at around TeV, this contribution can be higher than and be still compatible within with LHAASO data.
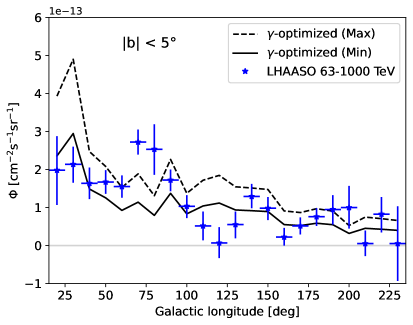
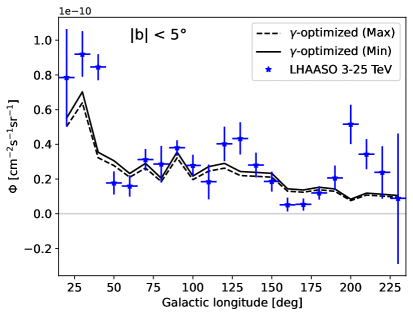
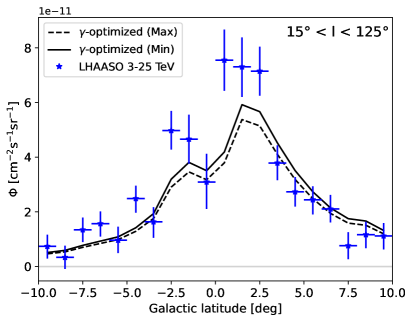
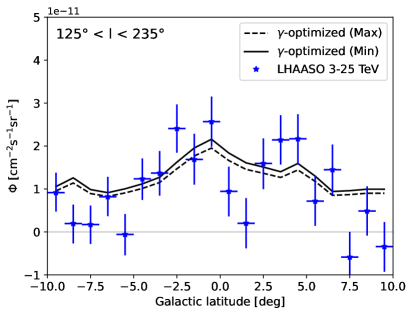
In Fig.7 we also compare the longitude and latitude emission profiles of the Min and Max models with LHAASO results in the energy bands TeV and TeV. Again here, we find that the emission measured by KM2A in the innermost region clearly favor the Min setup. We also remark here that the small underestimation of the data towards the GC in the energy range from TeV to TeV (top-right and bottom-left panels) may indicate that the contribution from unresolved sources grows as approaching the GC, which is actually expected (see, e.g. Refs.[72, 84]). Some papers have also considered the contribution from TeV halos in the diffuse TeV -ray sky. However, we note that most of these estimations assume that all middle aged pulsars in the ATNF catalog develop a TeV halo with parameters similar to describing the Geminga TeV halo. Since only a few TeV halos (only 3 clear ones) [85] have been detected, we expect this estimation to represent an overestimation, since it is possible that not all middle-aged pulsars result in TeV halos and probably taking the Geminga parameters is also an optimistic assumption (see Ref. [86]).
Turning our discussion now to the discrimination between the -optimized and Base models (i.e. inhomogeneous vs uniform CR propagation, respectively) with LHAASO data, we find (as already found in Ref. [67]) that, due to the mask, the differences between both scenarios become too low to make a clear statement only from the inner and outer regions (see Fig. 16). Interestingly, these measurements seem to hint to a different spectral index for the the power-laws describing the detected flux in each region, but with negligible significance yet. Potentially, having measurements focused on more internal regions could allow for a discrimination between both scenarios. Thanks to the large statistics collected with the WCDA, besides the inner and other regions, LHAASO was also able to measure the spectra of the GDE in three sub-regions of the inner region with , and . Again here, the LHAASO collaboration points to a mild, hint favoring a spectral index varying with the Galactic position. The two innermost among these sub-regions have the largest statistics and are most sensitive to the choice of the CR propagation setup. In Fig. 8 we compare the -optimized and Base models predictions, both in the Min setup, with LHAASO-WCDA results in the most internal of those regions. Although here we appreciate a larger difference between -optimized and Base models, their difference is still low, and the contribution from unresolved sources is difficult to be estimated. In addition, these measurements still lack systematic uncertainties. We also note that both scenarios follow very well the trend of the data, possibly pointing again to a subdominant contribution from unresolved sources.
In the left panel of this figure, we report the model predictions, compared to LHAASO and Fermi data, both obtained using the LHAASO mask. In the right panel, no mask is applied to the models and the Fermi data. It is evident that the LHAASO mask has quite an important impact on Fermi data, which significantly deviates from the truly diffuse model above GeV.
4 Galactic neutrino emission from cosmic-ray interactions
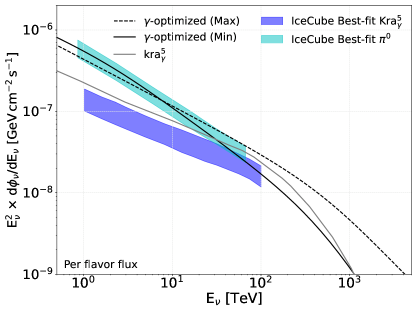
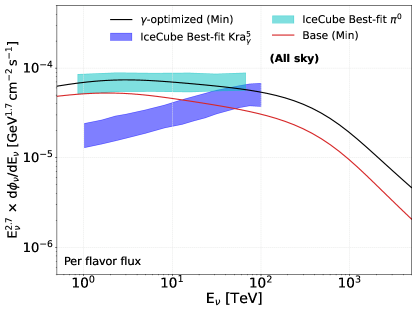
As mentioned before, the template fitting analyses conducted during the last years by ANTARES and IceCube collaborations constrain different diffuse Galactic scenarios and highlight the presence of a signal excess when observing along the whole Galactic plane through cascade events sample [19]. The most significant excesses has been obtained following the KRA and templates respectively with and of significance. Following the spatial and energy distribution of theoretical templates the analysis leave as a free parameter the normalization of the energy spectrum. The neutrino excess observed results in different best-fit values of the normalization for different templates; with the equivalent best fits for the KRAγ and templates reported in the left plot of Fig. 9 with the blue and the green bands. However, while the -optimized models (the update of the KRA model) are able to reproduce different -ray observations, as described in this over wide energy range, the cannot consistently do it. Therefore, we suggest to adopt the updated -optimized template in future template-fitting analyses in order to obtain more realistic results.
We compare our models with the best fits quoted by IceCube in the left panel of Fig. 9. Interestingly, both Min and Max setups are consistent with the the best fit model, that with the highest significance respect to IceCube neutrino data. In addition, we show the predicted flux from the KRA model, which exhibits a significant difference in its spectral shape, due to the updated CR flux measurements up to hundreds of PeV. This result highlights the fact that IceCube updated analysis would show a greater significance of detection of the GDE using the -optimized Min model as a template, in spite of the fact that the KRA and these ones are based on the assumption of inhomogeneous CR propagation. Furthermore, we note that to have consistency between neutrino and -ray observations the expected neutrino emission should have an enhanced contribution in the central part of the Galaxy (as predicted for the -optimized Min and Max models) instead of a constant flux over the whole Galactic plane (as quoted by the scenario). This can be noted by comparing the different scenarios presented in Fig. 3 and Fig. 9
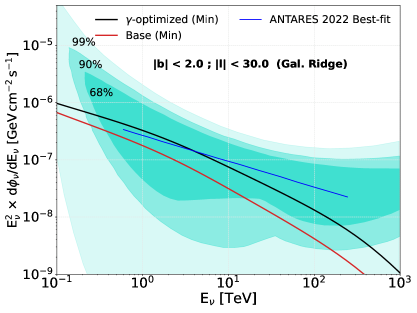
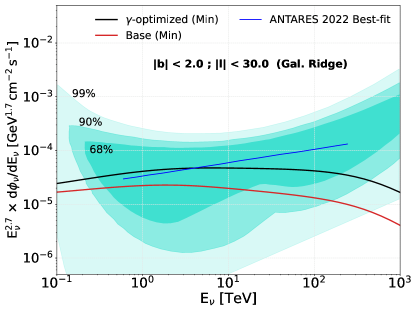
In this work we also extend the work done in Ref. [30] comparing the expected neutrino SEDs of -optimized models with the recent results obtained by the ANTARES collaboration looking at the so called Galactic Centre ridge ( and ) [87]. In that work an on/off analysis for this central part of the Galaxy was performed. The resulted best fit (under a power-law SED assumption) is here reported in the right plot of Fig. 9. As shown in that figure the -optimized models are in good agreement with the ANTARES best fit emission and inside the reported contour from 500 GeV to 500 TeV. However, we note that the uncertainties in this detection are still too high. This can be considered an important independent cross-check of the consistency of our models with neutrino data. In the left panel of Fig. 17, we show a similar comparison as in the left panel of Fig. 9 using a different scale.
We point out that the Min -optimized model that is properly tuned on both high-energy CR data and on Fermi-LAT data shows an excellent agreement with the most significant best fit provided by the IceCube collaboration. On the other hand, the Base model – which is still compatible with very-high-energy gamma-ray data because of the off-centered ROI and the effect of masking – exhibits a lower flux at high energies.
However, both estimations lead to the conclusion that the neutrino emission from CR interactions must not be a subdominant contribution, even in the case of spatial independent diffusion. Therefore, our predictions suggest that the contribution from sources must not be dominant in the Galactic Plane GDE. In the right panel of Fig. 9, we show the difference between the predicted emission in the Galactic Ridge from the -optimized and Base models (Min, in both cases). Here, the difference between both scenarios is much more significant, and future data could be able to distinguish between both scenarios.
Future observations of the KM3NeT telescope will have the capability to resolve peculiar regions of the GP – like the Central Molecular Zone – where the most massive molecular clouds are placed. The time when this extended signal will show up will eventually discriminate different diffuse scenarios with a possibility to highlight also local Pevatron-related emission component. On this regard no point-like Galactic excess was observed neither by IceCube nor by ANTARES, pointing to the fact that most of the observed TeV -ray sources release they very high energy emissions through leptonic processes. However we can expect that some of this CR accelerators can be spotted through the indirect neutrino emission by close molecular gas hadronically illuminated by CRs recently escaped from the source environments. On the other hand the comparison of the -optimized models with neutrino data analyses underline the fact that an eventual local contribution of Galactic Pevatrons is expected to be subdominant respect to the diffuse Galactic sea emission when a large enough portion of the Galaxy is considered.
5 Discussion and conclusions
In this paper we consider a set of models for the CR distribution in the Galaxy and the associated high-energy emission in the -ray and neutrino channels. These numerical models are computed numerically adopting the DRAGON and HERMES codes. The approach we follow is to tune the models on the locally measured CR data (bracketing the uncertainty in the high-energy domain by considering a Min and Max configurations), and consider different transport setups: a “conventional” one (Base) with homogeneous diffusion, and a -optimized scenario characterized by a harder spectrum in the inner Galaxy (as suggested by Fermi-LAT data).
This approach, with no further “ad hoc” tuning, provides a remarkable agreement with a wide set of data from different experiments ranging from GeV to PeV. Our analysis confirms that the GDE and GDE are mostly originated by the so-called “diffuse sea” of Galactic CRs all the way up to the largest detected energies. The agreement between the models and data is not trivial at all — especially at the high energies we consider here — given the potential role of source stochasticity and the debate about the scarcity and short duration of Galactic PeVatrons. This success confirms the viability of -ray astronomy to probe the properties of the diffuse sea of CRs across the whole Galactic plane.
We find that the spectral steepening of the LHAASO data at TeV (see Fig. 6) is well reproduced by the Min setup, which was tuned to match the steeping in the CR spectrum at PeV/n observed in the KASCADE [32, 31] dataset, as well as the data provided by DAMPE and CALET at lower energy. This supports the interpretation of the locally observed “knee” in the CR spectrum as a feature that characterizes the whole Galactic CR sea. A similar consideration holds for the steepening observed at a few TeV – more evident in the outer region – which can be associated to the feature visible in the DAMPE and CREAM CR data (see Fig. 10) slightly above TeV/n. On the other hand, the Max setup (tuned on the IceCube [33] CR dataset) is ruled out by LHAASO data by more than 10 when combining inner and outer Galaxy regions.
This conclusion is almost independent on the choice of the propagation model (Base or -optimized) since the LHAASO data cannot provide enough discriminating power to prefer a transport scenario over the other (see also Ref. [67]). We notice that the LHAASO dataset features a larger normalization (by a factor 1.52.7) compared to the predictions of toy models that naively extend the local CR spectra all over the Galaxy. However, both our realistic Base scenarios (that correctly takes into account the inhomogeneous source distribution) and our spatially-dependent “-optimized” models are compatible with the data. The reason is that the LHAASO analysis masks the regions that would be more suitable to discriminate between these scenarios, i.e. the low-longitude regions closer to the Galactic plane (see Fig.8). We notice, however, that LHAASO WCDA found anyhow a mild hint of a spatially-dependent GDE spectral index being in the inner region () and in the outer one (). Regarding the compatibility of LHAASO and Tibet-AS data, even accounting for the effect of the different masking technique and different regions of interest, the Tibet data still seem to exceed LHAASO observations. Unresolved sources can potentially explain this discrepancy, although its significance is hard to assess with the information at our disposal. Given this potential contamination, it is difficult to claim a compatibility between this dataset and the IceCube model best fit.
In the future, CTA [63, 88] data will access to the region of energy where the discrepancy between the base and -optimized model is larger, with the necessary angular resolution. Therefore, we expect that CTA may confirm or contrain the scenario of a inhomogeneous diffusion where CR confinement is larger at higher energies energies and close to the Galactic Center. Another crucial upcoming experiment for this purpose is SWGO [89], a planned next-generation wide-field -ray observatory to be built in the Southern Hemisphere. Thanks to the wide field of view and nearly continuous observation capabilities, it will be even more suitable for the study of truly diffuse emission along the Galactic plane extending the energy range currently covered by Fermi-LAT. Before these experiments will operate, the Astri Mini-Array [90] experiment, operating in the range from to TeV, can provide important details of the high-energy GDE and the search for PeVatrons, with exquisite spatial and energy resolution, and covering a wide field of view.
As far as the role of unresolved sources is concerned, we notice that HAWC and Tibet observations require to add a subdominant – but non negligible – contribution of unresolved sources, as illustrated in Figs. 4 and 5. This conclusion is also supported by recent independent analyses [72, 28, 67]. In particular, the profiles measured by the WCDA detector (Fig. 7) suggest that in regions close to the GC the truly diffuse emission (i.e. diffuse emission from CR interactions with ISM gas) needs an additional contribution. That region is exactly where the contribution from unresolved sources is expected to be higher. We suggest that our models can be used as a background template in order to characterize the very-high-energy source population (both point-like and extended) in the dataset provided by these experiments.
Turning our attention to the multi-messenger context, we remark that neutrino data provide very useful complementary information. While IceCube reported already hints of a hardening of the -GDE in the innermost region of the GP, we argue that the adoption of the -optimized Min model in future template-fitting analyses should further improve the evidence in favor of that scenario. In particular, a crucial test to validate this model would be a template-fitting analysis that combines the IceCube cascade samples and the KM3NeT and ANTARES track-like samples starting from a minimal energy of GeV.
As a final summary, we briefly recap the main findings of the present work:
-
•
We presented a class of models of the Galactic truly diffuse gamma-ray emission tuned on local CR-data that are compatible with a wide range of data from GeV to TeV.
-
•
Fermi-LAT data suggest a transport setup based on a radial dependent diffusion coefficient featuring a harder spectrum in the inner Galaxy. The very-high-energy LHAASO data cannot distinguish between these -optimized and the conventional homogeneous models.
-
•
LHAASO data, however, allow to identfy a strong preference in favour of the Min setup of both the conventional and the -optimized models, tuned on the local CR datasets provided by CALET, DAMPE and KASCADE (in the “knee” region).
-
•
Unresolved sources seem to play a relevant, but still sub-dominant, role in the interpretation of these observations.
-
•
Current IceCube and ANTARES observations are compatible with the Galactic diffuse emission to be dominated by CR emission, but cannot distinguish between different transport scenarios yet. Measurements towards the Galactic Centre are needed: KM3NeT will provide a very valuable data sample for future template analysis since 2/3 of the Galactic plane will be covered through track-like events which allow a better angular resolution.
Acknowledgments
We thanks Paolo Lipari, Giulia Pagliaroli and Silvia Vernetto for enlightening discussions. P.D.L. is supported by the Juan de la Cierva JDC2022-048916-I grant, funded by MCIU/AEI/ 10.13039/501100011033 European Union "NextGenerationEU"/PRTR. The work of P.D.L. is also supported by the grants PID2021-125331NB-I00 and CEX2020-001007-S, both funded by MCIN/AEI/10.13039/501100011033 and by “ERDF A way of making Europe”. P.D.L. also acknowledges the MultiDark Network, ref. RED2022-134411-T. This project used computing resources from the Swedish National Infrastructure for Computing (SNIC) under project No.2022/3-27 partially funded by the Swedish Research Council through grant no. 2018-05973. D.Gaggero and D. Grasso acknowledge support from the project “Theoretical Astroparticle Physics (TAsP)” funded by INFN. D. Grasso is seconded to the Embassy of Italy in the Kingdom of The Netherlands, The Hague.
Appendix A Cosmic-ray local fits
Here we report a comparison of the CR proton and helium local spectra computed with our -optimized and Base models (coincident at our local position) in the Min and Max setup with a wide set of updated experimental data (see citations in Sec. 2.1).
Appendix B Components of the diffuse emission - Comparison with Fermi-LAT data
Respect to Sec. 3.1 here we provide a more detailed comparison between the predictions of our -optimized and Base models, both in the Min setup (at energies below few hundred GeV they roughly coincide with those of the corresponding Max setups), with Fermi-LAT data. In Fig. 11 we display the different components of the GDE spectrum in the same sky windows as in Fig. 3. In Fig. 12, we compare the longitude profile and latitude profiles in a different region that the one used in Fig. 2.
Appendix C Other comparisons with high-energy gamma-ray data
Extending Secs. 3.2, 3.3, 3.4 we report additional comparisons of our -optimized Min and Max models with the GDE longitude and latitude profiles measured by HAWC [24] between 0.3 and 100 TeV integrated on and , respectively, which are shown in Fig. 13.
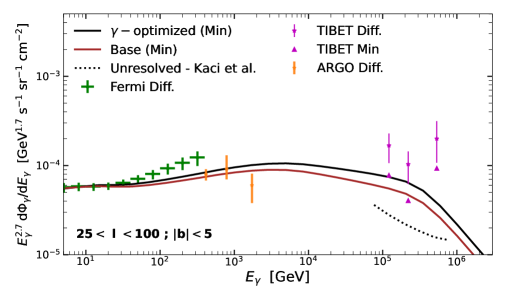
In Fig. 14 we compare the GDE spectra computed with the -optimized and Base models, both for the Min setup (favored by LHAASO results), with Tibet-AS data in Region A. This is different from Fig. 5 where -optimized Min and Max setups were rather reported. In this figure for each Tibet data point we also display (triangles) the minimal flux () obtained subtracting the contribution of extended resolved sources as estimated in [78]. The dotted line represents the estimated emission from unresolved-leptonic sources, as derived by Ref. [77]. No mask is adopted to perform this comparison.
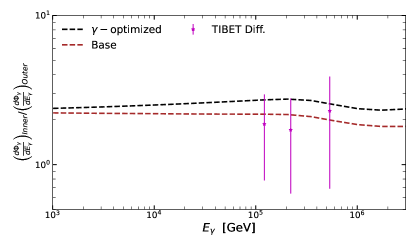
Then, in Figure 15, we show a comparison of the ratio of the flux in the inner region to the flux in the outer region, as obtained from our -optimized and Base models, compared to that measured by TIBET and LHAASO. Spectral differences between internal and external regions can hint at inhomogeneous diffusion. However, no clear variation is observed from TIBET and LHAASO data. Nevertheless, as we show, even models incorporating inhomogeneous diffusion would not exhibit a very hard trend of this ratio, at least, in comparison to the experimental error bars. In fact, we find that both, uniform and inhomogeneous propagation scenarios seem totally compatible with data. In the case of TIBET, this comparison must be taken with a grain of salt, given that the contribution from unresolved sources may be different in the inner and outer regions and affect this comparison.
Finally, in Fig. 16 we show the GDE predicted for the -optimized and Base models, both for the Min and Max setups, in the inner and outer regions computed with (left panels) and without (right panels) the mask used by the LHAASO collaboration. In the first case a comparison with LHAASO-KM2A and WCDA data is performed.
Appendix D Additional comparison with available neutrino data
Here, we provide two additional comparisons of our Base and -models (Min) models with neutrino data, similar to Fig. 9. In the left panel of Fig. 17 we compare the IceCube results for the GDE emission in the whole sky, with the one predicted by our models. We remind the reader that these models only contain the truly diffuse emission (i.e. produced from CR interactions), while a component of Galactic sources is expected to be present at some extent too. We finally present a similar comparison of our models, but with the ANTARES results of the Galactic Ridge, in the right panel of this figure.
References
- Ackermann et al. [2012] M. Ackermann et al. (Fermi-LAT), Astrophys. J. 750, 3 (2012), arXiv:1202.4039 [astro-ph.HE] .
- Berezinsky and Smirnov [1975] V. S. Berezinsky and A. Y. Smirnov, Astrophys. Space Sci. 32, 461 (1975).
- Stecker [1979] F. W. Stecker, Astrophys. J. 228, 919 (1979).
- Berezinsky et al. [1993] V. S. Berezinsky, T. K. Gaisser, F. Halzen, and T. Stanev, Astropart. Phys. 1, 281 (1993).
- Evoli et al. [2007a] C. Evoli, D. Grasso, and L. Maccione, JCAP 06, 003 (2007a), arXiv:astro-ph/0701856 .
- Ahlers et al. [2016] M. Ahlers, Y. Bai, V. Barger, and R. Lu, Phys. Rev. D 93, 013009 (2016), arXiv:1505.03156 [hep-ph] .
- Gaggero et al. [2015a] D. Gaggero, A. Urbano, M. Valli, and P. Ullio, PRD 91, 083012 (2015a), arXiv:1411.7623 .
- Gaggero et al. [2015b] D. Gaggero, D. Grasso, A. Marinelli, A. Urbano, and M. Valli, Astrophys. J. Lett. 815, L25 (2015b), arXiv:1504.00227 .
- Acero et al. [2016] F. Acero et al. (Fermi-LAT), Astrophys. J. Suppl. 223, 26 (2016), arXiv:1602.07246 .
- Yang et al. [2016] R. Yang, F. Aharonian, and C. Evoli, prd 93, 123007 (2016), arXiv:1602.04710 .
- Lipari and Vernetto [2018] P. Lipari and S. Vernetto, Phys. Rev. D 98, 043003 (2018), arXiv:1804.10116 [astro-ph.HE] .
- Pothast et al. [2018] M. Pothast, D. Gaggero, E. Storm, and C. Weniger, JCAP 10, 045 (2018), arXiv:1807.04554 [astro-ph.HE] .
- Cerri et al. [2017] S. S. Cerri et al., JCAP 2017, 019 (2017), arXiv:1707.07694 .
- Recchia et al. [2016] S. Recchia, P. Blasi, and G. Morlino, Mon. Not. Roy. Astron. Soc. 462, L88 (2016), arXiv:1604.07682 [astro-ph.HE] .
- Albert et al. [2017] A. Albert et al. (ANTARES), Phys. Rev. D 96, 062001 (2017), arXiv:1705.00497 [astro-ph.HE] .
- Aartsen et al. [2017] M. G. Aartsen et al. (IceCube), Astrophys. J. 849, 67 (2017), arXiv:1707.03416 [astro-ph.HE] .
- Albert et al. [2018] A. Albert et al. (ANTARES, IceCube), Astrophys. J. Lett. 868, L20 (2018), arXiv:1808.03531 [astro-ph.HE] .
- Aartsen et al. [2019a] M. G. Aartsen et al. (IceCube), Astrophys. J. 886, 12 (2019a), arXiv:1907.06714 .
- Abbasi et al. [2023] R. Abbasi et al. (IceCube), Science 380, adc9818 (2023), arXiv:2307.04427 [astro-ph.HE] .
- Strong and Moskalenko [1998] A. W. Strong and I. V. Moskalenko, Astrophys. J. 509, 212 (1998), arXiv:astro-ph/9807150 .
- Aiello et al. [2025] S. Aiello et al. (KM3NeT), Nature 638, 376 (2025).
- Adriani et al. [2025] O. Adriani et al. (KM3NeT), (2025), arXiv:2502.08387 [astro-ph.HE] .
- Gaggero et al. [2017] D. Gaggero, D. Grasso, A. Marinelli, M. Taoso, and A. Urbano, Phys. Rev. Lett. 119, 031101 (2017), arXiv:1702.01124 [astro-ph.HE] .
- Alfaro et al. [2024] R. Alfaro et al. (HAWC), Astrophys. J. 961, 104 (2024), arXiv:2310.09117 [astro-ph.HE] .
- Amenomori et al. [2021] M. Amenomori et al. (Tibet ASgamma), Phys. Rev. Lett. 126, 141101 (2021), arXiv:2104.05181 [astro-ph.HE] .
- Cao et al. [2023] Z. Cao et al. (LHAASO), Phys. Rev. Lett. 131, 151001 (2023), arXiv:2305.05372 [astro-ph.HE] .
- Cao et al. [2024a] Z. Cao et al. (LHAASO), (2024a), arXiv:2411.16021 [astro-ph.HE] .
- He et al. [2025] J. He, H. Zeng, Y. Zhang, Q. Yuan, R. Zhang, and J. Li, (2025), arXiv:2501.02720 [astro-ph.HE] .
- Luque et al. [2023] P. D. l. T. Luque, D. Gaggero, D. Grasso, O. Fornieri, K. Egberts, C. Steppa, and C. Evoli, Astron. Astrophys. 672, A58 (2023), arXiv:2203.15759 [astro-ph.HE] .
- De la Torre Luque and others. [2022] P. De la Torre Luque and others., Front. Astron. Space Sci. 9, 1041838 (2022), arXiv:2209.10011 [astro-ph.HE] .
- Apel et al. [2013] W. D. Apel et al., Astropart. Phys. 47, 54 (2013), arXiv:1306.6283 [astro-ph.HE] .
- Apel et al. [2012] W. D. Apel et al., Astropart. Phys. 36, 183 (2012).
- Aartsen et al. [2019b] M. G. Aartsen et al. (IceCube), Phys. Rev. D 100, 082002 (2019b), arXiv:1906.04317 [astro-ph.HE] .
- Zhao et al. [2021] S. Zhao, R. Zhang, Y. Zhang, and Q. Yuan (LHAASO), PoS ICRC2021, 859 (2021).
- Dundovic et al. [2021] A. Dundovic et al., Astron. Astrophys. 653, A18 (2021), arXiv:2105.13165 .
- Evoli et al. [2017] C. Evoli, D. Gaggero, A. Vittino, G. Di Bernardo, M. Di Mauro, A. Ligorini, P. Ullio, and D. Grasso, JCAP 02, 015 (2017), arXiv:1607.07886 [astro-ph.HE] .
- Evoli et al. [2018] C. Evoli et al., JCAP 2018, 006 (2018), arXiv:1711.09616 .
- Marinelli et al. [2018] A. Marinelli, D. Gaggero, D. Grasso, M. Taoso, A. Urbano, and S. Ventura, PoS ICRC2017, 939 (2018).
- Marinelli et al. [2019] A. Marinelli, D. Grasso, and S. Ventura, EPJ Web Conf. 209, 01003 (2019), arXiv:1901.00223 [astro-ph.HE] .
- Ventura et al. [2021] S. Ventura, D. Grasso, and A. Marinelli, PoS ICRC2019, 816 (2021).
- Adriani et al. [2014] O. Adriani et al., Phys. Rept. 544, 323 (2014).
- Aguilar et al. [2014] M. Aguilar et al. (AMS), Phys. Rev. Lett. 113, 121102 (2014).
- Aguilar et al. [2015] M. Aguilar et al. (AMS), Phys. Rev. Lett. 114, 171103 (2015).
- An et al. [2019] Q. An et al. (DAMPE), Sci. Adv. 5, eaax3793 (2019), arXiv:1909.12860 [astro-ph.HE] .
- Alemanno et al. [2021] F. Alemanno et al., Phys. Rev. Lett. 126, 201102 (2021), arXiv:2105.09073 [astro-ph.HE] .
- Ahn et al. [2009] H. S. Ahn, P. Allison, M. G. Bagliesi, L. Barbier, J. J. Beatty, G. Bigongiari, T. J. Brandt, J. T. Childers, N. B. Conklin, S. Coutu, M. A. DuVernois, O. Ganel, J. H. Han, J. A. Jeon, K. C. Kim, M. H. Lee, P. Maestro, A. Malinine, P. S. Marrocchesi, S. Minnick, S. I. Mognet, S. W. Nam, S. Nutter, I. H. Park, N. H. Park, E. S. Seo, R. Sina, P. Walpole, J. Wu, J. Yang, Y. S. Yoon, R. Zei, and S. Y. Zinn, The Astrophysical Journal 707, 593–603 (2009).
- Yoon et al. [2017] Y. S. Yoon, T. Anderson, A. Barrau, N. B. Conklin, S. Coutu, L. Derome, J. H. Han, J. A. Jeon, K. C. Kim, M. H. Kim, and et al., The Astrophysical Journal 839, 5 (2017).
- Panov et al. [2009] A. D. Panov, J. H. Adams, H. S. Ahn, G. L. Bashinzhagyan, J. W. Watts, J. P. Wefel, J. Wu, O. Ganel, T. G. Guzik, V. I. Zatsepin, and et al., Bulletin of the Russian Academy of Sciences: Physics 73, 564–567 (2009).
- Adriani et al. [2019] O. Adriani et al. (CALET), Phys. Rev. Lett. 122, 181102 (2019), arXiv:1905.04229 [astro-ph.HE] .
- Atkin et al. [2018] E. Atkin, V. Bulatov, V. Dorokhov, N. Gorbunov, S. Filippov, V. Grebenyuk, D. Karmanov, I. Kovalev, I. Kudryashov, A. Kurganov, and et al., JETP Letters 108, 5–12 (2018).
- Serpico [2018] P. D. Serpico, J. Astrophys. Astron. 39, 41 (2018).
- Ferriere [2001] K. M. Ferriere, Rev. Mod. Phys. 73, 1031 (2001), arXiv:astro-ph/0106359 .
- Ferrière et al. [2007] K. Ferrière, W. Gillard, and P. Jean, aap 467, 611 (2007), arXiv:astro-ph/0702532 [astro-ph] .
- Breuhaus et al. [2022] M. Breuhaus, J. A. Hinton, V. Joshi, B. Reville, and H. Schoorlemmer, Astron. Astrophys. 661, A72 (2022), arXiv:2201.03984 [astro-ph.HE] .
- Akaike et al. [2024] Y. Akaike et al., Adv. Space Res. 74, 4353 (2024).
- Abdalla et al. [2018] H. Abdalla et al. (HESS), Astron. Astrophys. 612, A1 (2018), arXiv:1804.02432 [astro-ph.HE] .
- Abdollahi et al. [2017] S. Abdollahi et al., Physical Review D 95 (2017), 10.1103/physrevd.95.082007.
- DAM [2017] Nature 552, 63–66 (2017).
- Steiman-Cameron et al. [2010] T. Y. Steiman-Cameron, M. Wolfire, and D. Hollenbach, The Astrophysical Journal 722, 1460 (2010).
- Evoli et al. [2021] C. Evoli, E. Amato, P. Blasi, and R. Aloisio, Phys. Rev. D 104, 123029 (2021), arXiv:2111.01171 [astro-ph.HE] .
- Marinos et al. [2024] P. D. Marinos, T. A. Porter, G. P. Rowell, G. Jóhannesson, and I. V. Moskalenko, (2024), arXiv:2411.03553 [astro-ph.HE] .
- Aharonian et al. [2024] F. Aharonian et al., Physical Review Letters 133 (2024), 10.1103/physrevlett.133.221001.
- Abe et al. [2024] S. Abe et al. (CTA Consortium), JCAP 10, 081 (2024), arXiv:2310.02828 [astro-ph.HE] .
- Kachelrieß et al. [2019] M. Kachelrieß, I. V. Moskalenko, and S. Ostapchenko, Comput. Phys. Commun. 245, 106846 (2019), arXiv:1904.05129 [hep-ph] .
- Kachelriess et al. [2023] M. Kachelriess, S. Ostapchenko, and J. Tjemsland, Comput. Phys. Commun. 287, 108698 (2023), arXiv:2206.00998 [hep-ph] .
- De la Torre Luque et al. [2023] P. De la Torre Luque, D. Gaggero, D. Grasso, and A. Marinelli, PoS ICRC2023, 563 (2023).
- Vecchiotti et al. [2024] V. Vecchiotti, G. Peron, E. Amato, S. Menchiari, G. Morlino, G. Pagliaroli, and F. L. Villante, (2024), arXiv:2411.11439 [astro-ph.HE] .
- Abdollahi et al. [2020] S. Abdollahi et al., apjs 247, 33 (2020), arXiv:1902.10045 [astro-ph.HE] .
- Steppa and Egberts [2020] C. Steppa and K. Egberts, Astronomy & Astrophysics 643, A137 (2020).
- Albert et al. [2020] A. Albert et al. (HAWC), Astrophys. J. 905, 76 (2020), arXiv:2007.08582 [astro-ph.HE] .
- Bartoli et al. [2015] B. Bartoli et al. (ARGO-YBJ), Astrophys. J. 806, 20 (2015), arXiv:1507.06758 .
- Lipari and Vernetto [2024] P. Lipari and S. Vernetto, (2024), arXiv:2412.08861 [astro-ph.HE] .
- Vecchiotti et al. [2022] V. Vecchiotti, F. Zuccarini, F. L. Villante, and G. Pagliaroli, The Astrophysical Journal 928, 19 (2022).
- Eckner and Calore [2022] C. Eckner and F. Calore, Phys. Rev. D 106, 083020 (2022).
- Kato et al. [2024a] S. Kato et al., Astrophys. J. Lett. 961, L13 (2024a), arXiv:2309.16078 [astro-ph.HE] .
- Collaboration [2024] L. Collaboration, Science Bulletin 69, 449–457 (2024).
- Kaci et al. [2024a] S. Kaci, G. Giacinti, and D. Semikoz, (2024a), arXiv:2407.20186 [astro-ph.HE] .
- Kato et al. [2024b] S. Kato et al., Astrophys. J. Lett. 977, L3 (2024b), arXiv:2411.11524 [astro-ph.HE] .
- Addazi et al. [2022] A. Addazi et al. (LHAASO), Chin. Phys. C 46, 035001 (2022), arXiv:1905.02773 [astro-ph.HE] .
- Aharonian et al. [2021] F. Aharonian et al., Chinese Physics C 45, 025002 (2021).
- Evoli et al. [2007b] C. Evoli, D. Grasso, and L. Maccione, Journal of Cosmology and Astroparticle Physics 2007, 003 (2007b).
- Wakely and Horan [2008] S. P. Wakely and D. Horan, in International Cosmic Ray Conference, International Cosmic Ray Conference, Vol. 3 (2008) pp. 1341–1344.
- Cao et al. [2024b] Z. Cao et al. (LHAASO), Astrophys. J. Suppl. 271, 25 (2024b), arXiv:2305.17030 [astro-ph.HE] .
- Kaci et al. [2024b] S. Kaci, G. Giacinti, and D. Semikoz, Astrophys. J. 975, L6 (2024b), arXiv:2407.20186 [astro-ph.HE] .
- Amato and Recchia [2024] E. Amato and S. Recchia, Riv. Nuovo Cim. 47, 399 (2024), arXiv:2409.00659 [astro-ph.HE] .
- Martin et al. [2022] P. Martin, A. Marcowith, and L. Tibaldo, Astronomy & Astrophysics 665, A132 (2022).
- Albert et al. [2023] A. Albert et al., Physics Letters B 841, 137951 (2023).
- Actis et al. [2011] M. Actis et al., Experimental Astronomy 32, 193–316 (2011).
- Albert et al. [2019] A. Albert et al., (2019), arXiv:1902.08429 [astro-ph.HE] .
- Vercellone et al. [2022] S. Vercellone et al., Journal of High Energy Astrophysics 35, 1–42 (2022).