Constraints on Lorentz invariance violation in neutrino sector from the ultra-high-energy event KM3-230213A
Abstract
Lorentz invariance is a fundamental symmetry of spacetime and serves as the cornerstone of modern physics, supporting the constancy of the speed of light. A crucial implication of this principle is that no particle can propagate faster than this universal speed limit. In this study, we present a stringent neutrino-based test of Lorentz invariance, utilizing the highest-energy neutrino ever detected, known as event KM3-230213A. The detection of this neutrino, with measured energy of approximately 220 PeV, allows us to establish a lower bound on the scale of second-order Lorentz invariance violation, quantified as GeV at 90 % confidence level.
I Introduction
Lorentz invariance, a cornerstone symmetry of Einstein’s theory of relativity, has successfully withstood rigorous experimental scrutiny for over a century [1]. Nevertheless, several quantum gravity (QG) theories — which attempt to reconcile quantum mechanics with general relativity — predict subtle departures from Lorentz invariance at energies approaching the Planck scale [2, 3, 4, 5, 6, 7, 8, 9, 10, 11, 12, 13, 14, 15, 16]. Although these Lorentz invariance violations (LIV) are anticipated to be exceedingly small at energies significantly below , their magnitude can potentially increase with energy and become detectable through cumulative effects over cosmological propagation distances. Consequently, astrophysical observations of high-energy particles emitted from distant sources offer uniquely powerful opportunities to probe Lorentz invariance at unprecedented sensitivity.
One manifestation of LIV can be characterized as the class of energy-dependent modifications to the dispersion relations in vacuum
| (1) |
where denotes the “sign” of LIV, differentiating between ”subluminal” () and ”superluminal” () cases. The parameter represents the energy scale at which Lorentz invariance is broken. At energies significantly below , the sum is dominated by its lowest-order terms; thus, only the first two leading terms ( or ) are of practical interest for independent LIV tests, commonly referred to as linear and quadratic LIV corrections, respectively.
Moreover, LIV alters reaction thresholds and modifies interaction cross-sections. Specifically, superluminal LIV typically allows new particle decay channels that are forbidden in the Lorentz-invariant scenario. As the lightest standard model particles, neutrinos offer a unique probe of LIV effects, particularly in the superluminal scenario. Specifically, superluminal neutrinos could exhibit distinct decay processes, such as neutrino splitting [17, 18, 19] and neutrino pair production [17, 20, 21].
KM3NeT [22] is a research infrastructure comprising two detector arrays deployed in the Mediterranean Sea, primarily designed to detect astrophysical neutrinos. Recently, its larger detector array, ARCA, recorded an ultra-high-energy (UHE) neutrino candidate event, designated KM3-230213A [23]. The event, characterized by a muon track, corresponds to a neutrino energy estimated at PeV, making it the highest-energy neutrino observation reported to date.
In the wake of this detection, recent analyses [24, 25] have placed stringent constraints on LIV within the neutrino sector, since neutrinos of such extreme energies would struggle to propagate significant distances to Earth if LIV effects were present. However, these studies relied on simplified assumptions, calculating only the survival probability of a single neutrino traversing a fixed propagation distance. In reality, KM3-230213A likely originates from the same diffuse neutrino background previously observed by IceCube at lower energies [26, 27], implying the necessity to consider statistical distributions of neutrino energies and propagation distances. Moreover, these earlier constraints utilized only one representative energy estimate of KM3-230213A, neglecting uncertainties in energy resolution and statistical fluctuations inherent in the measurement.
In this work, we re-evaluate constraints on LIV by adopting a comprehensive statistical framework. We begin with the diffuse astrophysical neutrino energy spectrum derived from a combined fit to KM3NeT, IceCube and Auger data. This spectrum is then coupled with a physically motivated source distribution as a function of redshift. Importantly, we incorporate the full two-dimensional posterior distribution of the neutrino flux inferred from the KM3-230213A event, rather than relying solely on a single representative energy.
II Observational data and neutrino spectrum
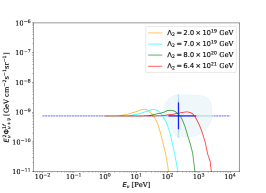
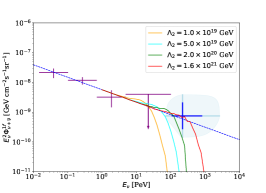
The best estimate of the energy of the ultra-high-energy (UHE) neutrino event observed by KM3NeT is 220 PeV, with a 90 % (68 %) confidence interval of [72 PeV, 2.6 EeV] ([110 PeV, 790 PeV]). Assuming an spectrum within the energy range of [72 PeV, 2.6 EeV], a joint fit using the data from this single event observed by KM3NeT, along with the non-observations by IceCube and Auger, yields a per-flavor neutrino flux of GeV cm-2 s-1 sr-1 [28]. Assuming a Gaussian distribution for the logarithm of the neutrino flux strength, we can obtain the 90 % confidence interval for the aforementioned flux. The energy of the observed ultra-high-energy neutrino, along with the 90 % (68 %) confidence interval for the flux obtained from the joint fit, is represented by the light blue (blue) crosses in Fig. 1. We take the 90 % confidence region on the plane to be the area enclosed by four quarter ellipses centered at and defined by the upper and lower limits of the corresponding confidence interval, which is illustrated in the light blue shaded area in Fig. 1 on the logarithmic coordinate plot.
For the neutrino energy spectrum in the absence of LIV, we consider three forms. The first form is the spectrum, with the specific normalization obtained from the combined fitting of KM3NeT, IceCube, and Auger UHE data as mentioned above. This normalization is taken to be the best-fit result
| (2) |
which is shown by the dashed blue line in the left panel of Fig. 1. The second form of spectrum we consider is a single power law (SPL)
| (3) |
the normalization and spectral index are obtained by combined fitting the UHE data of KM3NeT, IceCube, and Auger and the high-energy (below tens of PeV) measurements performed by IceCube. The high-energy measurements of IceCube include three samples: High-Energy Starting Events (HESE), Enhanced Starting Track Event Selection (ESTES), and Northern-Sky Tracks (NST). Each of the three samples is combined separately with the UHE data to obtain three sets of different parameters and , from which we take the best-fit parameters. In the middle panel of Fig. 1, the blue dashed line represents the fitting result corresponding to NST, while the purple crosses in this panel represent the NST data points. The third form of spectrum we consider is a broken power law (BPL)
| (4) |
The best-fit result obtained by jointly fitting the HESE and UHE data is shown using the blue dashed line in the right panel of Fig. 1, with the pink crosses representing the HESE data points. All detailed fitting results, including both SPL and BPL, can be found in [28].
III Method
In this work, the method we use to derive constraints is to consider the suppressive effect of LIV on the high-energy end of the neutrino spectrum [29, 17]. We assume that in the absence of LIV, the neutrino spectrum follows one of the aforementioned fit results, which aligns well with the UHE data. If LIV is present, the neutrino spectrum will rapidly decline at high energies, leading to a significant deviation from the UHE data. When the spectrum, considering a certain LIV energy scale, deviates from the corresponding 90 % confidence region of the UHE data (as shown by the light blue shaded area in Fig. 1), the LIV energy scale is considered inconsistent with the UHE data at the 90 % confidence level, thereby allowing us to derive a 90 % confidence limit for the LIV energy scale.
III.1 Redshift effect
In practice, for the spectrum and SPL spectrum, we extract energy values as the energies of neutrinos when they are emitted from the source, according to the energy spectrum forms given in Eqs. 2 and 3, respectively. As for the distances these neutrinos travel to Earth, we assume that their redshift distribution follows that of the star formation rate [30]. Therefore, we can obtain the initial conditions for these neutrino events .
In the absence of LIV, due to cosmological redshift, neutrinos also lose energy during their propagation. The energy loss due to redshifting can be expressed as
| (5) |
where we choose the cosmological constants to be km s-1 Mpc-1, , and . Due to the redshift effect, the observed neutrino energy is . For the or SPL spectra, the observed neutrinos still maintain the same spectral index and follow a power law distribution. Therefore, after appropriate normalization, the neutrino instances sampled from these two types of spectrum, when propagated without LIV, will match the energy spectrum shown by the blue dashed lines in the left and middle panels of Fig. 1. We have also verified this conclusion through actual simulations. However, for the BPL case, the propagated neutrinos do not follow the BPL energy distribution, because the break position of the neutrino spectrum, , varies with the redshift. Therefore, for the case of BPL, we will multiply the energy obtained from the BPL sampling by the corresponding redshift factor to obtain its initial energy . We have also verified that in the absence of LIV, the neutrinos obtained in this way indeed satisfy the energy spectrum indicated by the blue dashed line in the right panel of Fig. 1 after propagation.
III.2 Superluminal neutrino decay
In the presence of LIV, superluminal neutrinos will undergo decay, primarily through two processes, and . The threshold for is given by
| (6) |
while the threshold for is far below the range of neutrino energies we are considering, so we ignore the threshold effect of this process. The decay rate of these two processes are given by [31, 29]
| (7) |
and [17]
| (8) |
respectively. Whenever neutrinos decay during propagation, they produce lower-energy neutrinos. For the process, we take the energy lost by the neutrino to be 78 % [31], while for the process, we assume that the neutrino transforms into three new neutrinos (antineutrino), each with energy of the original. Under a certain LIV energy scale , we simulate the energy loss due to redshift and decay of the extracted neutrinos during propagation, obtaining the energy of each neutrino when it reaches the Earth. We then statistically analyze the energy distribution to study the effects of LIV on the shape of the energy spectrum.
The violation of CPT symmetry [17] in the LIV scenario implies that if neutrino (antineutrino) is superluminal, then antineutrino (neutrino) must be subluminal. Furthermore, subluminal neutrinos (antineutrinos) cannot undergo decay; the only energy loss occurs due to redshift. Therefore, in the case, the final shape of the energy spectrum will be influenced by the initial ratio of superluminal particles to subluminal particles, typically assuming a 50 % for both. Additionally, this consideration must be taken into account when simulating the energy loss of neutrinos, as the process will produce antineutrinos.
IV Results
Assuming that neutrinos are all superluminal, the constraints on the LIV energy scale are illustrated in Fig. 1. The different colored solid lines represent the neutrino energy spectra obtained at various LIV energy scales. It can be seen that in the case of the spectrum, when the LIV energy scale is lowered to GeV, the resulting neutrino energy spectrum is tangent to the 90 % credible region in the plane, allowing us to establish a lower limit for the second-order LIV energy scale at GeV at 90 % confidence level. For the SPL spectrum scenario, the fitted energy spectrum corresponding to the NST data gives a lower limit of GeV (as shown in Fig. 1) at 90 % confidence level. Additionally, the SPL spectrum fitted from the HESE data does not intersect with the 90 % credible region, while the spectrum fitted from the ESTSE data is very close to the edge of this region. Therefore, we do not use either of them to impose constraints on the LIV energy scale. For the BPL spectrum scenario, the fitted energy spectrum corresponding to the HESE data gives a lower limit of GeV (as shown in Fig. 1) at 90 % confidence level. And the lower limit obtained by using the NST and ESTSE data fitted BPL spectrum are GeV and GeV, respectively. Based on the above results, we conservatively establish the 90 % confidence lower limit for the LIV energy scale as GeV.
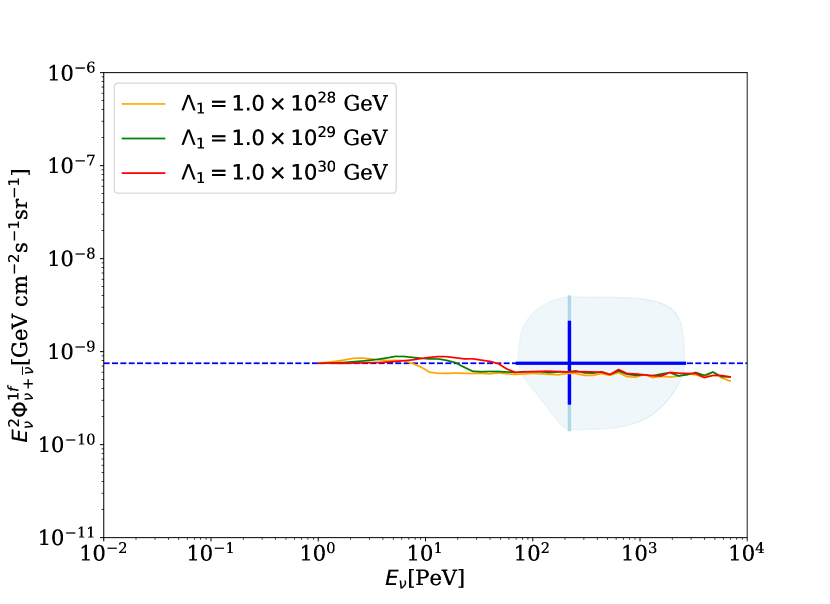
Using an spectrum as an example, the simulation results for LIV scenario are shown in Fig. 2. Different colored lines represent the final energy spectra obtained at various LIV energy scales. It can be observed that due to the presence of a significant number of subluminal particles, the energy spectrum does not show a substantial decrease at the high-energy end, consistently passing through the 90 % credible region of the UHE data. This indicates that the observational data available cannot impose strict constraints on the LIV scenario.
V Conclusions
In this work, we utilized the recently observed UHE neutrino event KM3-230213A, along with the energy spectrum obtained from the joint fitting of IceCube and Auger data, to impose constraints on the LIV energy scale. Our results indicate that the existing data do not provide a high-confidence constraint on the LIV energy scale. For the LIV energy scale, we establish a lower limit of GeV at 90 % confidence level.
Acknowledgements.
This work is supported by the National Natural Science Foundation of China under Grant No. 12175248 and No. 12447105.References
- Kostelecky and Russell [2011] V. A. Kostelecky and N. Russell, Data Tables for Lorentz and CPT Violation, Rev. Mod. Phys. 83, 11 (2011), arXiv:0801.0287 [hep-ph] .
- Kostelecky and Samuel [1989] V. A. Kostelecky and S. Samuel, Spontaneous Breaking of Lorentz Symmetry in String Theory, Phys. Rev. D 39, 683 (1989).
- Amelino-Camelia et al. [1997] G. Amelino-Camelia, J. R. Ellis, N. E. Mavromatos, and D. V. Nanopoulos, Distance measurement and wave dispersion in a Liouville string approach to quantum gravity, Int. J. Mod. Phys. A 12, 607 (1997), arXiv:hep-th/9605211 .
- Ellis et al. [1999] J. R. Ellis, N. E. Mavromatos, and D. V. Nanopoulos, Search for quantum gravity, Gen. Rel. Grav. 31, 1257 (1999), arXiv:gr-qc/9905048 .
- Amelino-Camelia [2002] G. Amelino-Camelia, Doubly special relativity, Nature 418, 34 (2002), arXiv:gr-qc/0207049 .
- Magueijo and Smolin [2002] J. Magueijo and L. Smolin, Lorentz invariance with an invariant energy scale, Phys. Rev. Lett. 88, 190403 (2002), arXiv:hep-th/0112090 .
- Alfaro et al. [2002] J. Alfaro, H. A. Morales-Tecotl, and L. F. Urrutia, Loop quantum gravity and light propagation, Phys. Rev. D 65, 103509 (2002), arXiv:hep-th/0108061 .
- Mattingly [2005] D. Mattingly, Modern tests of Lorentz invariance, Living Rev. Rel. 8, 5 (2005), arXiv:gr-qc/0502097 .
- Li et al. [2009] T. Li, N. E. Mavromatos, D. V. Nanopoulos, and D. Xie, Time Delays of Strings in D-particle Backgrounds and Vacuum Refractive Indices, Phys. Lett. B 679, 407 (2009), arXiv:0903.1303 [hep-th] .
- Amelino-Camelia [2013] G. Amelino-Camelia, Quantum-Spacetime Phenomenology, Living Rev. Rel. 16, 5 (2013), arXiv:0806.0339 [gr-qc] .
- Tasson [2014] J. D. Tasson, What Do We Know About Lorentz Invariance?, Rept. Prog. Phys. 77, 062901 (2014), arXiv:1403.7785 [hep-ph] .
- Wei and Wu [2021] J.-J. Wei and X.-F. Wu, Testing fundamental physics with astrophysical transients, Front. Phys. 16, 44300 (2021), arXiv:2102.03724 [astro-ph.HE] .
- He and Ma [2022] P. He and B.-Q. Ma, Lorentz Symmetry Violation of Cosmic Photons, Universe 8, 323 (2022), arXiv:2206.08180 [astro-ph.HE] .
- Addazi et al. [2022] A. Addazi et al., Quantum gravity phenomenology at the dawn of the multi-messenger era—A review, Prog. Part. Nucl. Phys. 125, 103948 (2022), arXiv:2111.05659 [hep-ph] .
- Yang et al. [2024] Y.-M. Yang, X.-J. Bi, and P.-F. Yin, Constraints on Lorentz invariance violation from the LHAASO observation of GRB 221009A, JCAP 04, 060, arXiv:2312.09079 [astro-ph.HE] .
- Alves Batista et al. [2025] R. Alves Batista et al., White paper and roadmap for quantum gravity phenomenology in the multi-messenger era, Class. Quant. Grav. 42, 032001 (2025), arXiv:2312.00409 [gr-qc] .
- Stecker et al. [2015] F. W. Stecker, S. T. Scully, S. Liberati, and D. Mattingly, Searching for Traces of Planck-Scale Physics with High Energy Neutrinos, Phys. Rev. D 91, 045009 (2015), arXiv:1411.5889 [hep-ph] .
- Jentschura [2020] U. D. Jentschura, Squeezing the Parameter Space for Lorentz Violation in the Neutrino Sector with Additional Decay Channels, Particles 3, 630 (2020), arXiv:2009.11947 [hep-ph] .
- Carmona et al. [2023] J. M. Carmona, J. L. Cortés, J. J. Relancio, and M. A. Reyes, Decay of superluminal neutrinos in the collinear approximation, Phys. Rev. D 107, 043001 (2023), arXiv:2210.02222 [hep-ph] .
- Cohen and Glashow [2011a] A. G. Cohen and S. L. Glashow, Pair Creation Constrains Superluminal Neutrino Propagation, Phys. Rev. Lett. 107, 181803 (2011a), arXiv:1109.6562 [hep-ph] .
- Huo et al. [2012] Y. Huo, T. Li, Y. Liao, D. V. Nanopoulos, and Y. Qi, Constraints on Neutrino Velocities Revisited, Phys. Rev. D 85, 034022 (2012), arXiv:1112.0264 [hep-ph] .
- Adrian-Martinez et al. [2016] S. Adrian-Martinez et al. (KM3Net), Letter of intent for KM3NeT 2.0, J. Phys. G 43, 084001 (2016), arXiv:1601.07459 [astro-ph.IM] .
- Aiello et al. [2025] S. Aiello et al. (KM3NeT), Observation of an ultra-high-energy cosmic neutrino with KM3NeT, Nature 638, 376 (2025).
- Adriani et al. [2025a] O. Adriani et al. (KM3NeT), KM3NeT Constraint on Lorentz-Violating Superluminal Neutrino Velocity (2025a), arXiv:2502.12070 [astro-ph.HE] .
- Satunin [2025] P. Satunin, Ultra-high-energy event KM3-230213A constraints on Lorentz Invariance Violation in neutrino sector (2025), arXiv:2502.09548 [hep-ph] .
- Abbasi et al. [2021] R. Abbasi et al. (IceCube), The IceCube high-energy starting event sample: Description and flux characterization with 7.5 years of data, Phys. Rev. D 104, 022002 (2021), arXiv:2011.03545 [astro-ph.HE] .
- Abbasi et al. [2022] R. Abbasi et al., Improved Characterization of the Astrophysical Muon–neutrino Flux with 9.5 Years of IceCube Data, Astrophys. J. 928, 50 (2022), arXiv:2111.10299 [astro-ph.HE] .
- Adriani et al. [2025b] O. Adriani et al. (KM3NeT), The ultra-high-energy event km3-230213a within the global neutrino landscape, (2025b), 2502.08173 .
- Stecker and Scully [2014] F. W. Stecker and S. T. Scully, Propagation of Superluminal PeV IceCube Neutrinos: A High Energy Spectral Cutoff or New Constraints on Lorentz Invariance Violation, Phys. Rev. D 90, 043012 (2014), arXiv:1404.7025 [astro-ph.HE] .
- Behroozi et al. [2013] P. S. Behroozi, R. H. Wechsler, and C. Conroy, The average star formation histories of galaxies in dark matter halos fromz= 0-8, The Astrophysical Journal 770, 57 (2013).
- Cohen and Glashow [2011b] A. G. Cohen and S. L. Glashow, Pair creation constrains superluminal neutrino propagation, Physical Review Letters 107, 181803 (2011b).