LAG: LLM agents for Leaderboard Auto Generation on Demanding
Abstract
This paper introduces Leaderboard Auto Generation (LAG), a novel and well-organized framework for automatic generation of leaderboards on a given research topic in rapidly evolving fields like Artificial Intelligence (AI). Faced with a large number of AI papers updated daily, it becomes difficult for researchers to track every paper’s proposed methods, experimental results, and settings, prompting the need for efficient automatic leaderboard construction. While large language models (LLMs) offer promise in automating this process, challenges such as multi-document summarization, leaderboard generation, and experiment fair comparison still remain under exploration. LAG solves these challenges through a systematic approach that involves the paper collection, experiment results extraction and integration, leaderboard generation, and quality evaluation. Our contributions include a comprehensive solution to the leaderboard construction problem, a reliable evaluation method, and experimental results showing the high quality of leaderboards.
\ul
LAG: LLM agents for Leaderboard Auto Generation on Demanding
Jian Wu1∗, Jiayu Zhang2††thanks: The authors contributed equally to this work., Dongyuan Li3, Linyi Yang4, Aoxiao Zhong5, Renhe Jiang3, Qingsong Wen5, Yue Zhang6 1 Institute of Science Tokyo 2 Peking University, China 3 University of Tokyo 4 University College London 5 AI Research Institute, Squirrel AI Learning, China 6 School of Engineering, Westlake Univeristy
1 Introduction
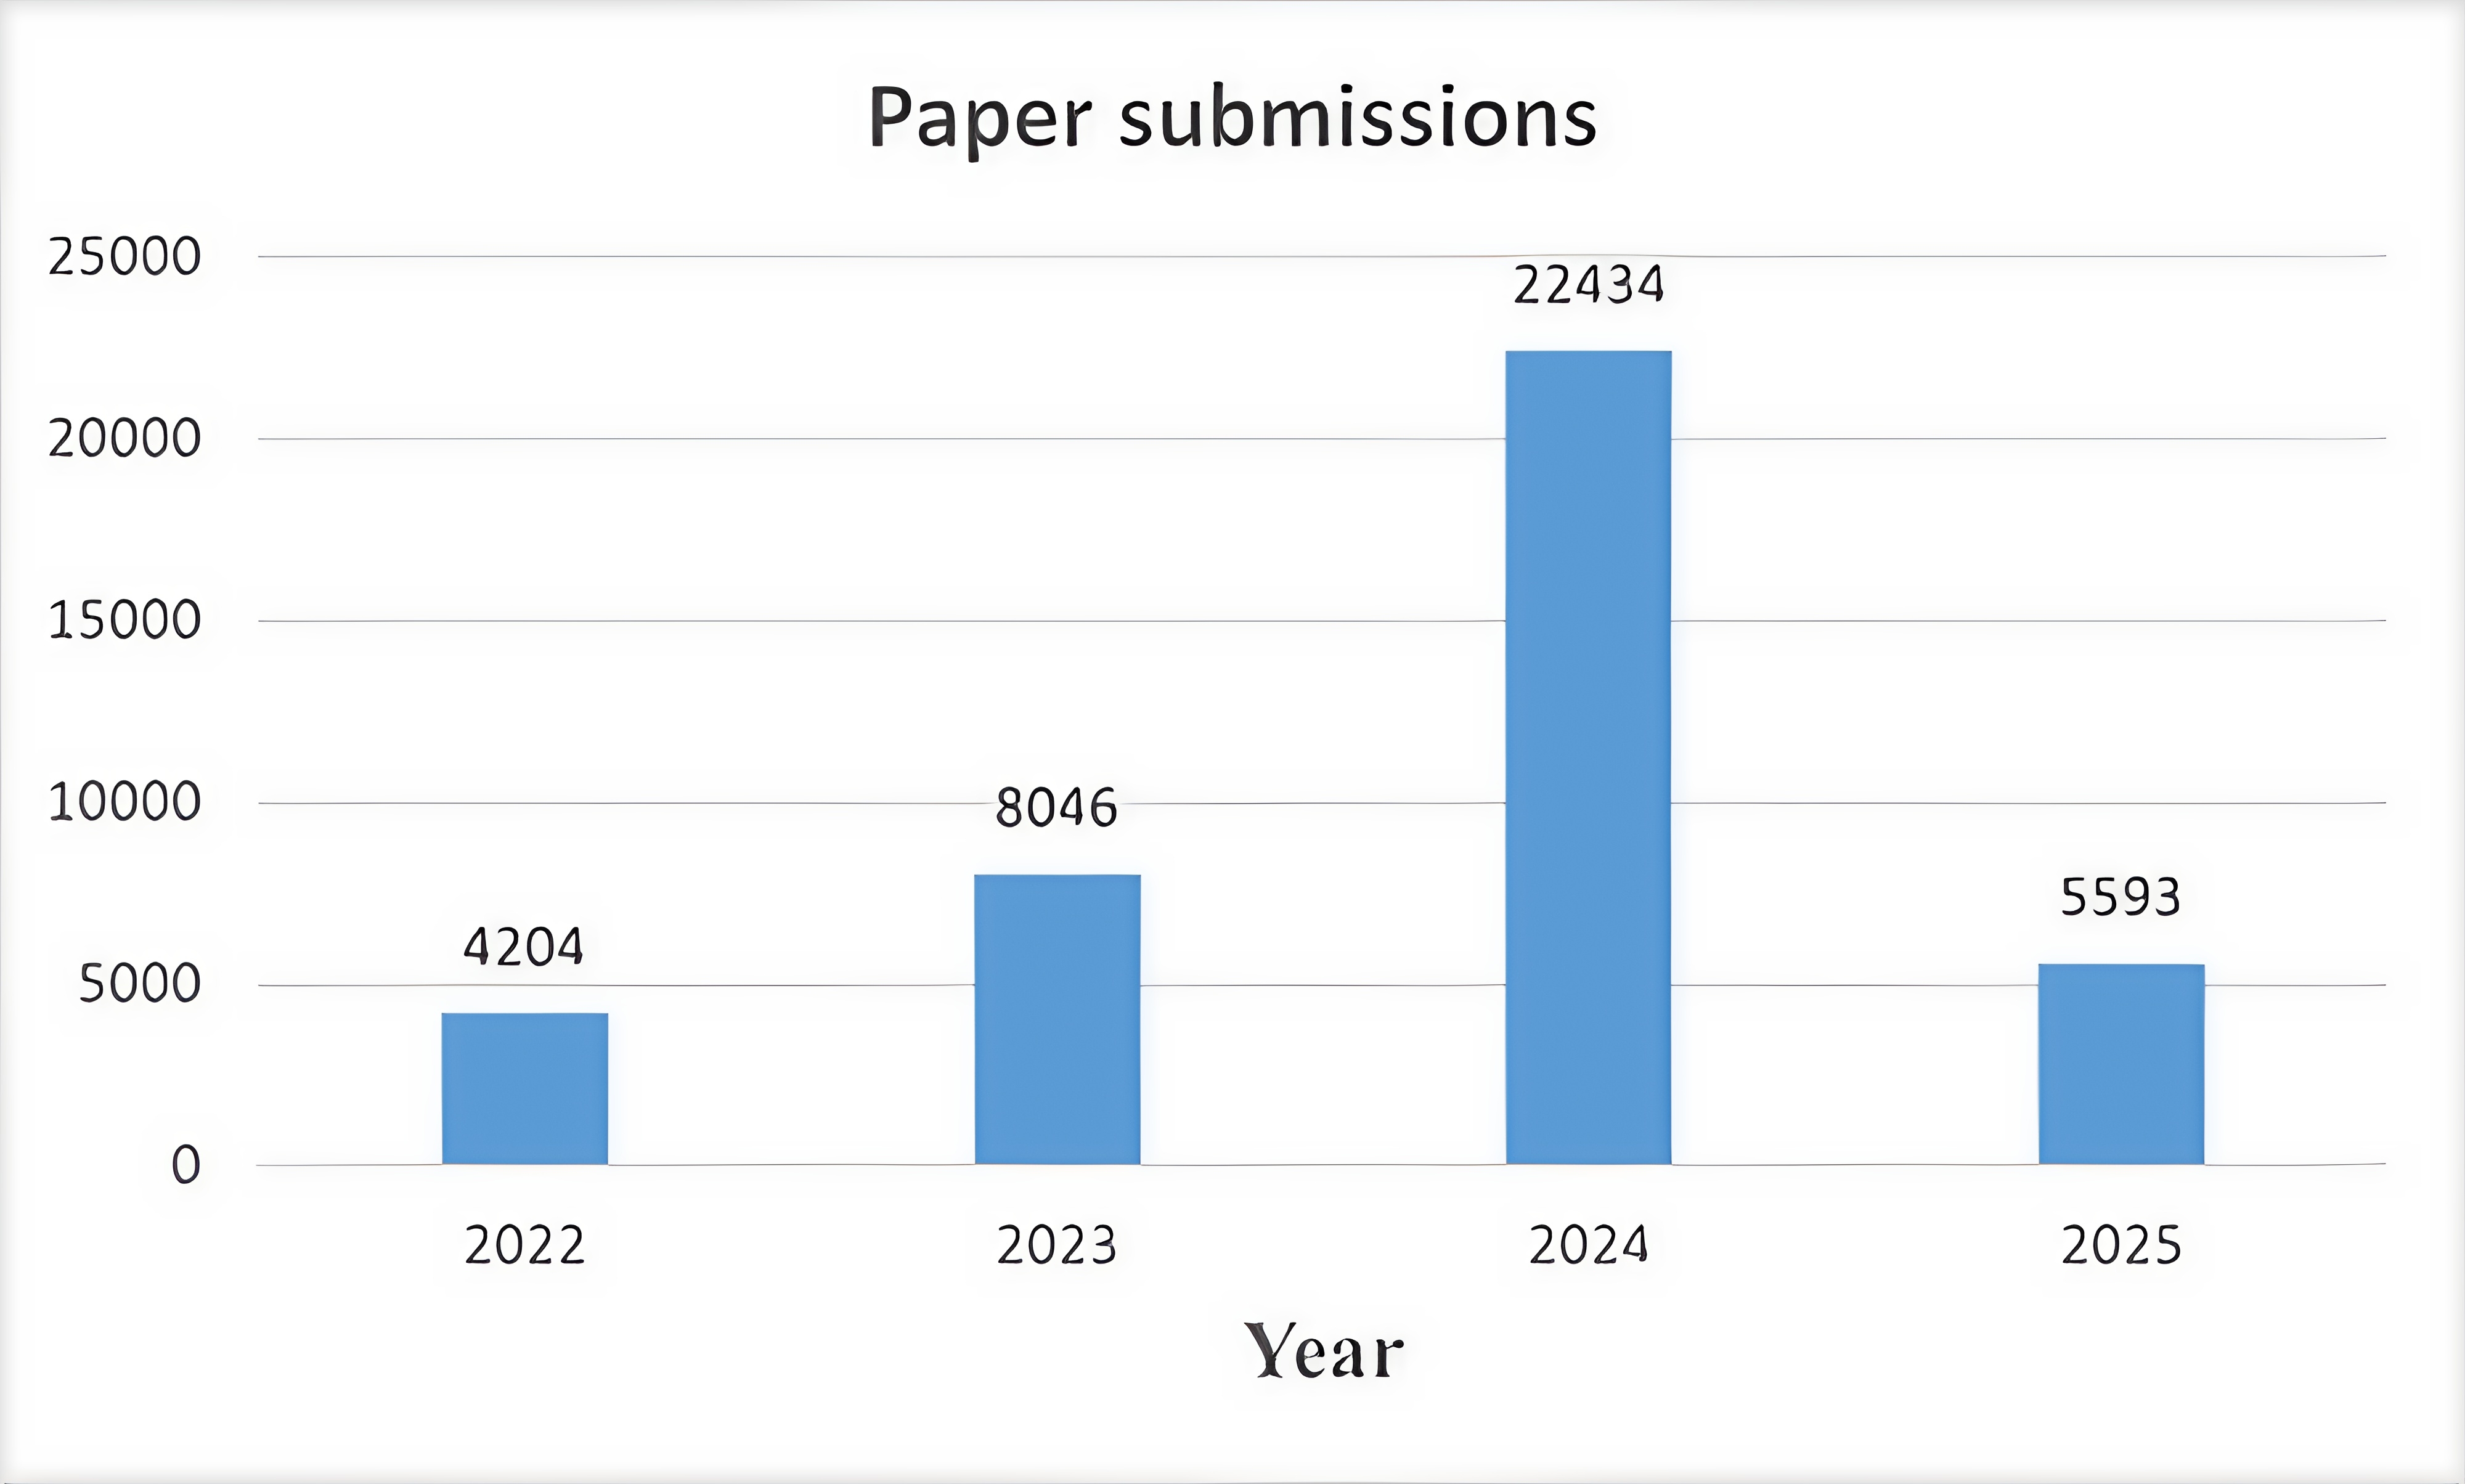
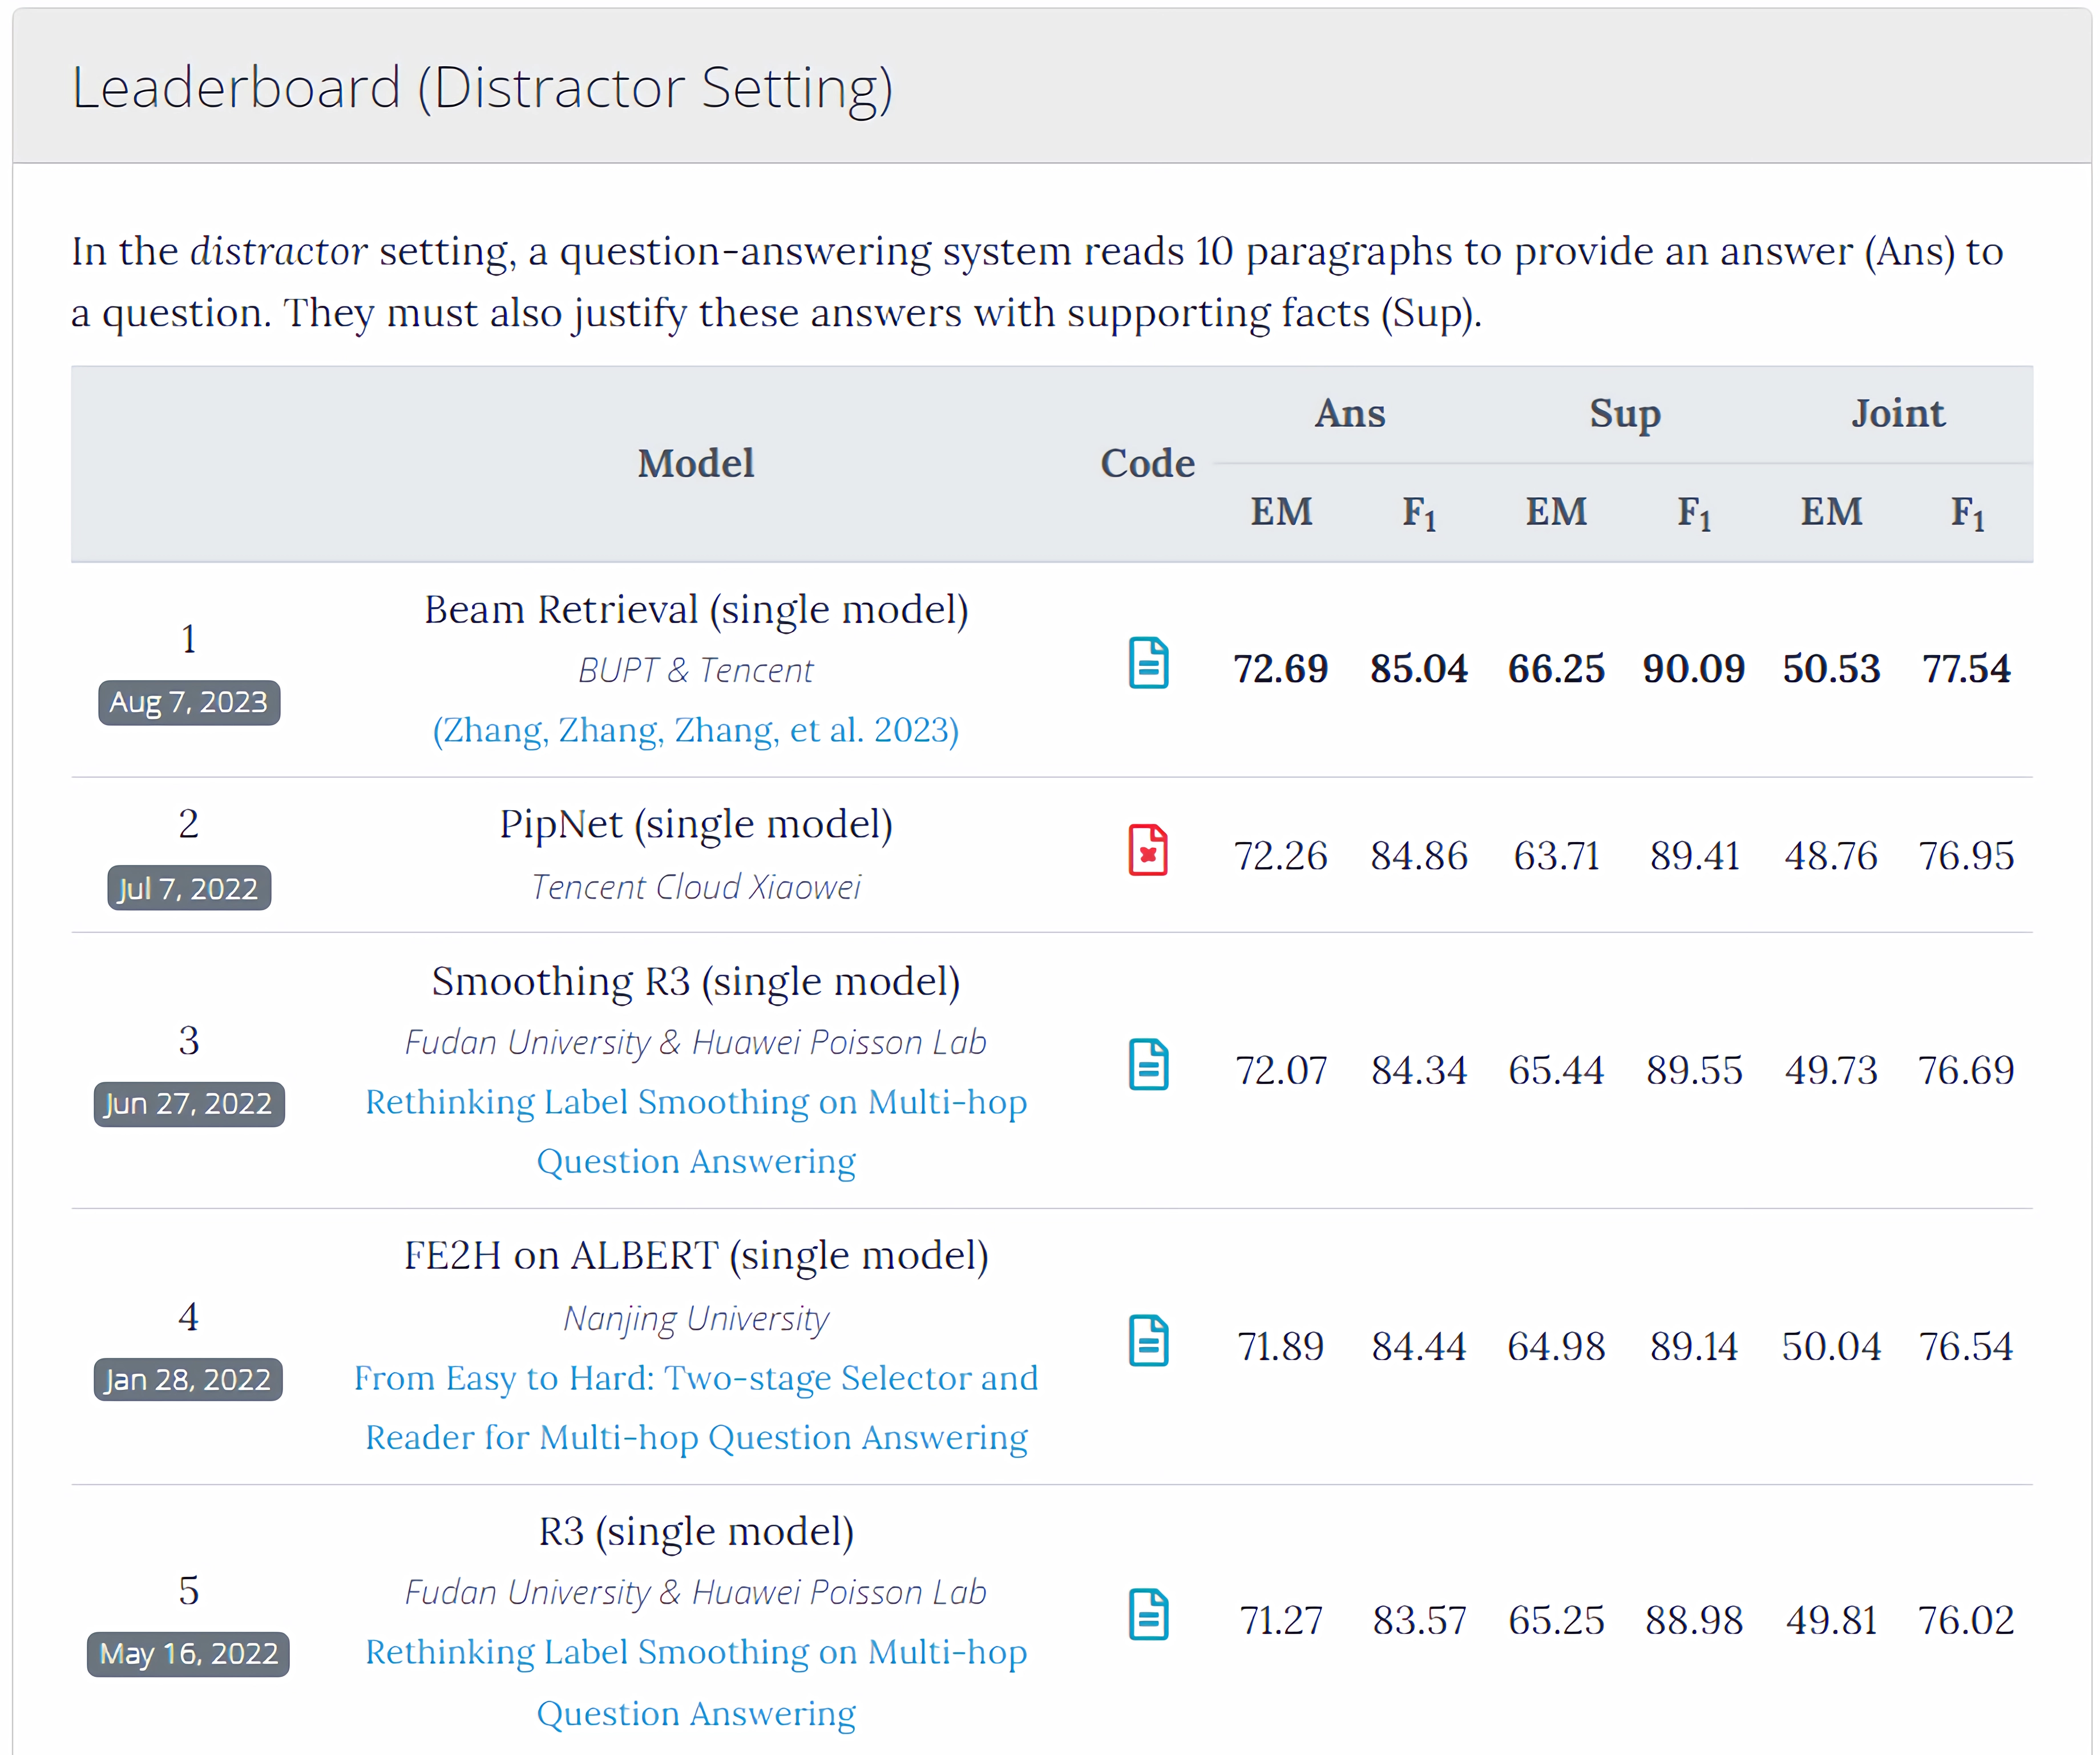
The explosive growth of scientific publications has created both unprecedented opportunities and significant challenges for researchers seeking to stay abreast of state-of-the-art methods Bornmann et al. (2020); Wang et al. (2024); Şahinuç et al. (2024). Leaderboard platforms, such as NLP-progress111https://nlpprogress.com/ and Papers-With-Code222https://paperswithcode.com/ have become invaluable by offering comprehensive overviews of recent research developments, highlighting ongoing trends, and identifying future directions. However, the large amount of daily papers makes it increasingly difficult to update these leaderboards automatically and promptly. Figure 1 illustrates two pressing issues: First, the number of LLM-related articles submitted to arXiv has surged dramatically—from 2022 to 2025, with over 20,000 submissions in 2024 alone. Second, even as new methods continuously emerge, leaderboards, such as the one for Multi-hop Question Answering on the HotpotQAYang et al. (2018) dataset, remain stagnant, with the latest method dating back to 2023. These observations highlight a serious issue: the rapid accumulation of daily scientific publications often outpaces the capability of researchers to keep up with cutting-edge research and state-of-the-art methods, emphasizing the growing need for more efficient methods to generate the latest and useful leaderboards.
Prior efforts have attempted to address this gap. A line of work (Hou et al., 2019; Kardas et al., 2020) has proposed leaderboard construction methods that directly extract scientific entities from individual NLP papers, and construct a static leaderboard without updating and maintenance. Semi-supervised scientific NER, proposed by Li et al. (2023), focuses on extracting scientific entities from both tables and text. Şahinuç et al. (2024) introduce SCILEAD, a manually-curated Scientific Leaderboard dataset, including 27 leaderboards derived from 43 NLP papers. However, all previous methods have been limited to the extracted scientific entities and only give a static snapshot after extracting information from a narrow selections.
We consider using LLMs such as GPT-4 Achiam et al. (2023), Qwen Yang et al. (2024), and O1-preview which have demonstrated exceptional performance across diverse NLP tasks, especially in the long-context scenario Chen et al. (2023a, b); Wang et al. (2023b) to automatically generate leaderboards based on given research topic.
Directly applying LLMs to this task still faces several key challenges. First, Limited Paper Coverage: It is challenging for human to search for all papers on a certain scientific topic, due to the overwhelming number of constantly emerging publications. Second, Unfair Comparison: Current studies do not consider fair experiment settings when making comparisons. For example, in NLP research, key experimental components, model size, train dataset size, and hyperparameter selection, vary significantly across publications, highlighting the need for automatic alignment. Finally, Low Timeliness: A leaderboard, which lacks regular updates and continuous maintenance, cannot provide researchers with sufficient useful information.
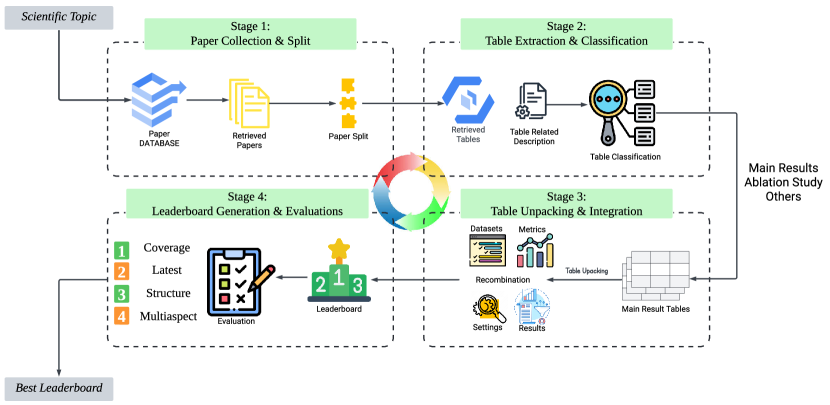
To this end, we introduce LAG, a novel agent framework for dynamically and automatically generating leaderboards. Figure 2 illustrates the framework of our method, which is organized into four stages: (1) Paper Collection and split: Initially, LAG automatically download all relevant LaTex code based on the given research topic from arXiv and filter out papers published before certain date and those unrelated to the topic, ensuring proper paper coverage and timeliness. (2) Table Extraction and Classification: We use LLMs to extract and classify experiment tables based on accompanying table descriptions. (3) Table Unpacking and Integration: LAG extracts the datasets, metrics, experiment settings, and experiment results from the tables in the form of a quintuple, including paper title. Experiment setting extraction is crucial for enabling fair comparisons across different baselines. (4) Leaderboard Generation and Evaluation: The extracted quintuples are recombined and re-ranked to form candidate leaderboards.
To evaluate the performance of LAG, we propose two key quality dimensions for assessment: (1) Topic-related Quality: paper coverage assessment, determining whether each quintuple in the LAG-generated leaderboards is related to the given topic. (2) Content Quality: We adopt the LLM-as-Judge method for leaderboard quality evaluation on four aspects, including Coverage, Structure, Latest, and Multiaspect. We also introduce human experts to manually evaluate LAG-generated leaderboards and compute the Pearson Correlation Coefficient between human- and LLMs-assigned scores.
Related Work Data Source Experiment Settings Multi Document Dynamic TDMS(Hou et al., 2019) NProg. ✗ ✗ ✗ Axcell (Kardas et al., 2020) PwC ✗ ✗ ✗ TELIN (Yang et al., 2022) PwC ✗ ✗ ✗ ORKG(KABENAMUALU et al., 2023) PwC ✗ ✗ ✗ LEGO (Singh et al., 2024) PwC ✗ ✗ ✗ SciLead (Şahinuç et al., 2024) NLP papers ✗ ✓ ✗ LAG (Ours) arXiv ✓ ✓ ✓
Extensive experiments across different leaderboard lengths (5, 10, 15, and 20 items) show that LAG consistently achieves high topic-related and content quality scores. With 20 items, a LAG-generated Leaderboard represents 20 baselines for researchers, achieving 67.58% recall and 70.33% precision scores in topic-related quality. In content quality with 20 items, LAG achieves 4.12 coverage, 3.96 latest, 4.16 structure, and 4.08 multiaspect scores, approaching human performance (4.72 coverage, 4.68 latest, 4.34 structure, and 4.58 multiaspect scores). Although the manually created leaderboard achieves higher content quality, it is much more time-consuming than LAG, deeming the efficiency. With fewer items, LAG gets even higher performance, slightly lower than human performance. These results highlight the effectiveness of LAG, providing a reliable proxy for human judgment across varying leaderboard items. Furthermore, the Pearson correlation coefficient values indicate a moderate positive correlation between the human-assigned and LLM-assigned scores.
To our best knowledge, LAG is the first method to explore the potential of LLM agents for automatic leaderboard generation, proposing evaluation criteria that align with human preferences and offering valuable reference for future related research.
2 Related Work
LLM for Scientific Research.
In the realm of LLMs, several studies have explored using LLMs for improving work efficiency in scientific research. Baek et al. (2024) and Yang et al. (2023) proposed a multi-agent-based scientific idea generation method to boost AI-related research. To evaluate the quality of LLM-generated ideas, Si et al. (2024) introduced a comprehensive human evaluation metric. Wang et al. (2023a) proposed SciMON, a method that uses LLMs for scientific literature retrieval. Wang et al. (2024) proposed an AutoSurvey to automatically generate scientific surveys based on the given research topic. The AI Scientist, Lu et al. (2024) introduced a fully automated, prompt-driven research pipeline. To make LLM-generated ideas more diverse and practical, Weng et al. (2024) proposed CycleResearcher, an iterative self-rewarding framework that allows the LLM to refine its ideas continuously, enhancing both diversity and practicality in research proposal generation. However, no previous research focused on the leaderboard generation for researchers to search, organize, and compare the state-of-the-art methods rapidly and fairly based on a certain research topic.
Leaderboard Construction.
Table 1 illustrates the differences between the previous work and LAG. First of all, previous work builds leaderboards by using data sources such as NLP-progress or Papers-With-Code. However, these sources lack rigorous quality assurance, such as standardizing scientific entities across different leaderboards and ensuring complete coverage of relevant publications. Instead, we choose arXiv, which is a free distribution service and an open-access archive for nearly 2.4 million scholarly articles in different domains, providing a large amount of publications for researchers. Similar to our work, Hou et al. (2019), Kardas et al. (2020), and Singh et al. (2024) extract “Task”, “Dataset”, “Model” along with the experiment result entities as TDM triples to build a leaderboard. Yang et al. (2022) and KABENAMUALU et al. (2023) leverage the pre-defined TDM triples in an extraction process similar to Hou et al. (2019). Since these approaches require a pre-defined taxonomy of TDM triples, they are incompatible with realistic task definitions. In short, none of the previous work is adaptable to constantly emerging benchmarks driven by new research and innovation. Moreover, none of the studies extract the experiment settings as additional information to generate leaderboards, which results in a lack of fair comparison. In scientific research, experiment settings are important for educators or users to reproduce the experimental results claimed in scientific publications. In this work, we address the aforementioned problems. Specifically, we (1) dynamically download scientific publications and generate up-to-date leaderboards based on the given scientific topic and the specific date; (2) extract experiment settings as part of leaderboards for fair comparison; (3) apply a Multi-Agent-as-Judge to evaluate leaderboard quality.
3 Methods
Figure 2 depicts LAG, which consists of four stages: Paper Collection and Split, Table Extraction and Classification, Table Unpacking and Integration, and Leaderboard Generation and Evaluation. Each stage is meticulously designed to address specific challenges associated with leaderboard generation, thereby enhancing the efficiency and quality of the resulting leaderboards. The whole process is iterated several times (e.g., five times) to generate a high-quality leaderboard.
3.1 Paper Collection and Split
Utilizing the off-the-shelf tools 333https://github.com/lukasschwab/arxiv.py, LAG first searches and retrieves a set of papers from arXiv and downloads LaTeX code files related to a specific scientific research topic . Then, we specify a certain date and filter out all papers published before the date. The filtering stage is important for ensuring that the generated leaderboards are grounded in the most relevant and recent research. Moreover, since the search tool just identifies only the keywords in the paper title and abstract, which can lead to a significant amount of noisy data, we also introduce a retrieval model to filter out papers that are irrelevant to the given topic and retrieve topic-related papers. The set of filtered papers is used to generate the leaderboards, ensuring comprehensive coverage of the topic and logical structure. Due to the extensive number of relevant papers retrieved and filtered during this stage, the total input length of often exceeds the maximum input length of LLMs. Since most of the LaTex content is unproductive for generating leaderboards, we split the LaTeX code into several sections based on the structure of each paper. Most tables, table-related descriptions, experiment results, and experiment settings are located in the “Experiment” section, which contains the key information for generating leaderboards. Consequently, we select all “Experiment” sections as well as all tables and all table-related descriptions , extracted from all papers, as input for the next stage.
3.2 Table Extraction and Classification
Typically, a scientific paper, such as those in the natural language processing domain, contains several types of tables, including “Main Results”, “Ablation Study”, and “Others”. The “Main Results” tables are the most important tables in the paper, which illustrate the novelty, contributions, and effectiveness of the proposed methods or models by comparing the experiment results of the proposed method with other baselines. We utilize these tables for leaderboard generation. The “Ablation Study” tables examine the effect of damaging or removing certain components in a controlled setting to investigate all possible outcomes of system failure. The “Others” tables are the tables that illustrate the supplementary information of the experiments. For example, some tables illustrate the dataset statistics of the benchmark used in the experiments, while other tables list the results of “Case Study” and “Error Analysis”. To address this, we propose an agent that uses the In-Context Learning method Dong et al. (2022) to manually select one table from each of the three different types. The agent then prompts LLMs to classify the table types and only keeps the “Main Experiments” tables and their descriptions as the final input. The table types can be described as: .
In practice, the most intrinsic approach is to divide Stage 2 into the following sequential steps: (1) Extract all tables and their associated captions from the LaTeX code. (2) Classify the extracted tables according to predefined table types. (3) Extract metrics, performance values, and experimental settings related to the proposed model from tables categorized as “Main Results”. Moreover, each of these three steps necessitates the use of LLM APIs, and repeated reference to certain table contents further exacerbates the substantial waste of tokens. To address this issue, we create the agent following the few-shot Chain of Thought (CoT) prompting process, enabling it to classify and extract information from identified “Main Results” tables in a single dialogue round. Specifically, in the requested JSON output, we additionally set the key points as follows: “number of tables (Int)", “classification of tables (Dict)" and “selected table’s index (Int)".
3.3 Table Unpacking and Integration
Following the table extraction and classification phase, each table is sent into the LLM to extract the core information. To build a useful and high-quality leaderboard, we define four types of scientific terms: Datasets, Metrics, Experiment Results, and Experiment Settings. For datasets, we use LLMs to count the frequency in all filtered papers of each dataset under a certain research topic and retain the top-K (K=5) datasets with the highest frequency of occurrence in scientific papers. For the rest of the three scientific terms, we utilize LLMs to extract from given with a related table description . After scientific term extraction, we recombined them into a quintuple, including the paper title as the unique identification ID. Each paper can produce one quintuple and finally we get a raw leaderboard with quintuples from filtered papers. The raw leaderboard is reranked on the basis of the experiment results.
3.4 Leaderboard Generation and Evaluation
After we obtain leaderboards based on top-K frequent datasets, the final stage involves a quality evaluation based on our pre-defined four criteria, which is shown in Table 4 in Appendix. Each leaderboard is assigned three scores based on “Coverage”, “Latest” and “Structure”. Since a research topic may contain several datasets, the “Multi-Aspect” is the average quality score that is used to evaluate the LLM-generated leaderboards for each dataset. The best leaderboard is chosen from candidates. LLMs critically examine the leaderboards in several aspects. The final output of Leaderboard is .
The methodology outlined here, from paper collection to leaderboard evaluation, ensures that LAG effectively addresses the complexities of leaderboard generation in the AI domain using advanced LLM agents. We provide Pseudo-code for easily understanding, which is shown in Algorithm 1.
Leaderboard Length (items) Topic-related Quality Model Speed/s Content Quality Recall Precision Coverage Latest Structure Multiaspect 5 Qwen2.5-7B Qwen2.5-14B GPT4-o O1-preview Human Writing 4.89 4.83 4.91 4.88 10 Qwen2.5-7B Qwen2.5-14B GPT4-o O1-preview Human Writing 15 Qwen2.5-7B Qwen2.5-14B GPT4-o O1-preview Human Writing 20 Qwen2.5-7B Qwen2.5-14B GPT4-o O1-preview Human Writing
4 Experiments
We designed experiments for LAG, aiming to answer four questions: RQ-1: Can LAG address the paper coverage issue and generate fair leaderboards by incorporating the latest baselines? RQ-2: Can LAG reduce time consumption? RQ-3: Is the evaluation consistent between LAG and human experts? RQ-4: Is each proposed component of LAG useful?
4.1 Experimental Setup
We evaluated LAG’s performance by testing its ability to generate leaderboards for specific topics across various complex settings.
4.1.1 Evaluation Metrics
We use two metrics to evaluate the quality (topic-related and leaderboard content) and speed of leaderboard generation, respectively, in response to the three challenges mentioned in the introduction.
(1) Topic-related Quality: The aforementioned arXiv crawler employs regular expression matching in the abstract section to identify papers related to specified topics. While this method is efficient, it is relatively rudimentary and cannot guarantee that all retrieved papers meet our requirements. The quality of these papers not only directly affects the final leaderboard, but low-quality candidate papers can also significantly prolong the time required for construction. Therefore, it is essential to evaluate the quality of the retrieved articles. We evaluate the quality of content from the following two aspects. (i) Recall: It measures whether all items in the generated leaderboard are related to the given research topic. (ii) Precision: It identifies irrelevant items, ensuring that the items in the generated leaderboards are pertinent and directly support the given research topic.
(2) Leaderboard Content Quality: The evaluation metric of leaderboard content quality includes four aspects. Each aspect is judged by LLMs according to a 5-point, calibrated by human experts. The evaluation criteria are listed in Table 4. (i) Coverage: Assess each paper represented on the LAG-generated leaderboards encapsulates all aspects of the topic. (ii) Latest: Test whether all papers represented on the LAG-generated leaderboards are latest. (iii) Structure: Evaluate the logical organization and determine whether LAG leaderboards are missing any items. (iv) Multiaspect: Average score of the previous three criteria for LAG-generated leaderboards.
(3) Leaderboard Construction Speed: Manually building a leaderboard is a time-consuming and laborious task. This process can be divided into the following main components: (search for papers on a specific topic), (browse all retrieved articles and develop several highly frequent datasets), (filter candidate articles based on the selected datasets), (read and extract information), and (the integration and construction time). And the total time consumption can be calculated as:
| (1) |
Given denotes the length of the leaderboard, number of retrieved articles, number of articles retained, and the proportion of valid articles with . We find that and are strongly correlated with leaderboard length and the Topic-related quality:
| (2) |
While is relatively fixed, and usually only have a positive correlation with .
For LAG, we barely account for all the invocation time of the agents’ API calls. Compared to manual work, which often takes several days, LAG reduces the total time cost in the minute level. This is largely attributed to the task decomposition conducted in this paper, the division of labor and scheduling among agents, and the superior performance of the LLMs.
4.1.2 Baselines
We employ proprietary and open-source LLMs in our experiments and set the temperature to 0.7 for proprietary models. For proprietary models, we adopt GPT-4o Achiam et al. (2023), and the O1-preview. For open-source LLMs, we adopt Qwen2.5-7B and Qwen2.5-14B Yang et al. (2024). We provide a detailed illustration of our designed prompts for different stages in Appendix A.
4.2 Experiment Results
4.2.1 Performance Comparison (RQ-1)
Topic-related Quality Evaluation: Table 2 illustrates the Topic-related Quality LAG achieved a recall of 67.58% and a precision of 70.33% with 20 items, indicating that it successfully retrieved a large proportion of relevant papers while maintaining a low rate of irrelevant ones. This performance is crucial for ensuring that the generated leaderboards are both comprehensive and accurate. The high precision and recall scores illustrate that LAG could help solve the paper coverage problem.
Fair Comparison: To ensure fair comparison, LAG extracted all experiment settings as part of the LAG-generated leaderboards. We provide a detailed case study of LAG-generated leaderboards with experiment settings in Appendix B.
Content Quality Evaluation: Table 2 presents the results of leaderboard quality generated by LAG and the baselines. LAG consistently achieved high scores across all evaluation metrics, particularly in terms of Coverage and Latest, indicating its ability to include a wide range of relevant and recent papers. For example, at a leaderboard length of 20 items, LAG achieved a Coverage score of 4.12 and a Latest score of 3.96, approaching human performance (4.72 and 4.68, respectively). While manual leaderboards scored slightly higher in content quality, LAG significantly reduced the time required for leaderboard generation, demonstrating its efficiency.
Methods Leaderboard Length (items) Speed/s Content Quality Coverage Latest Structure Multiaspect LAG w/o Table Classification 5 LAG w/o Refinement LAG LAG w/o Table Classification 10 LAG w/o Refinement LAG LAG w/o Table Classification 15 LAG w/o Refinement LAG LAG w/o Table Classification 20 LAG w/o Refinement LAG
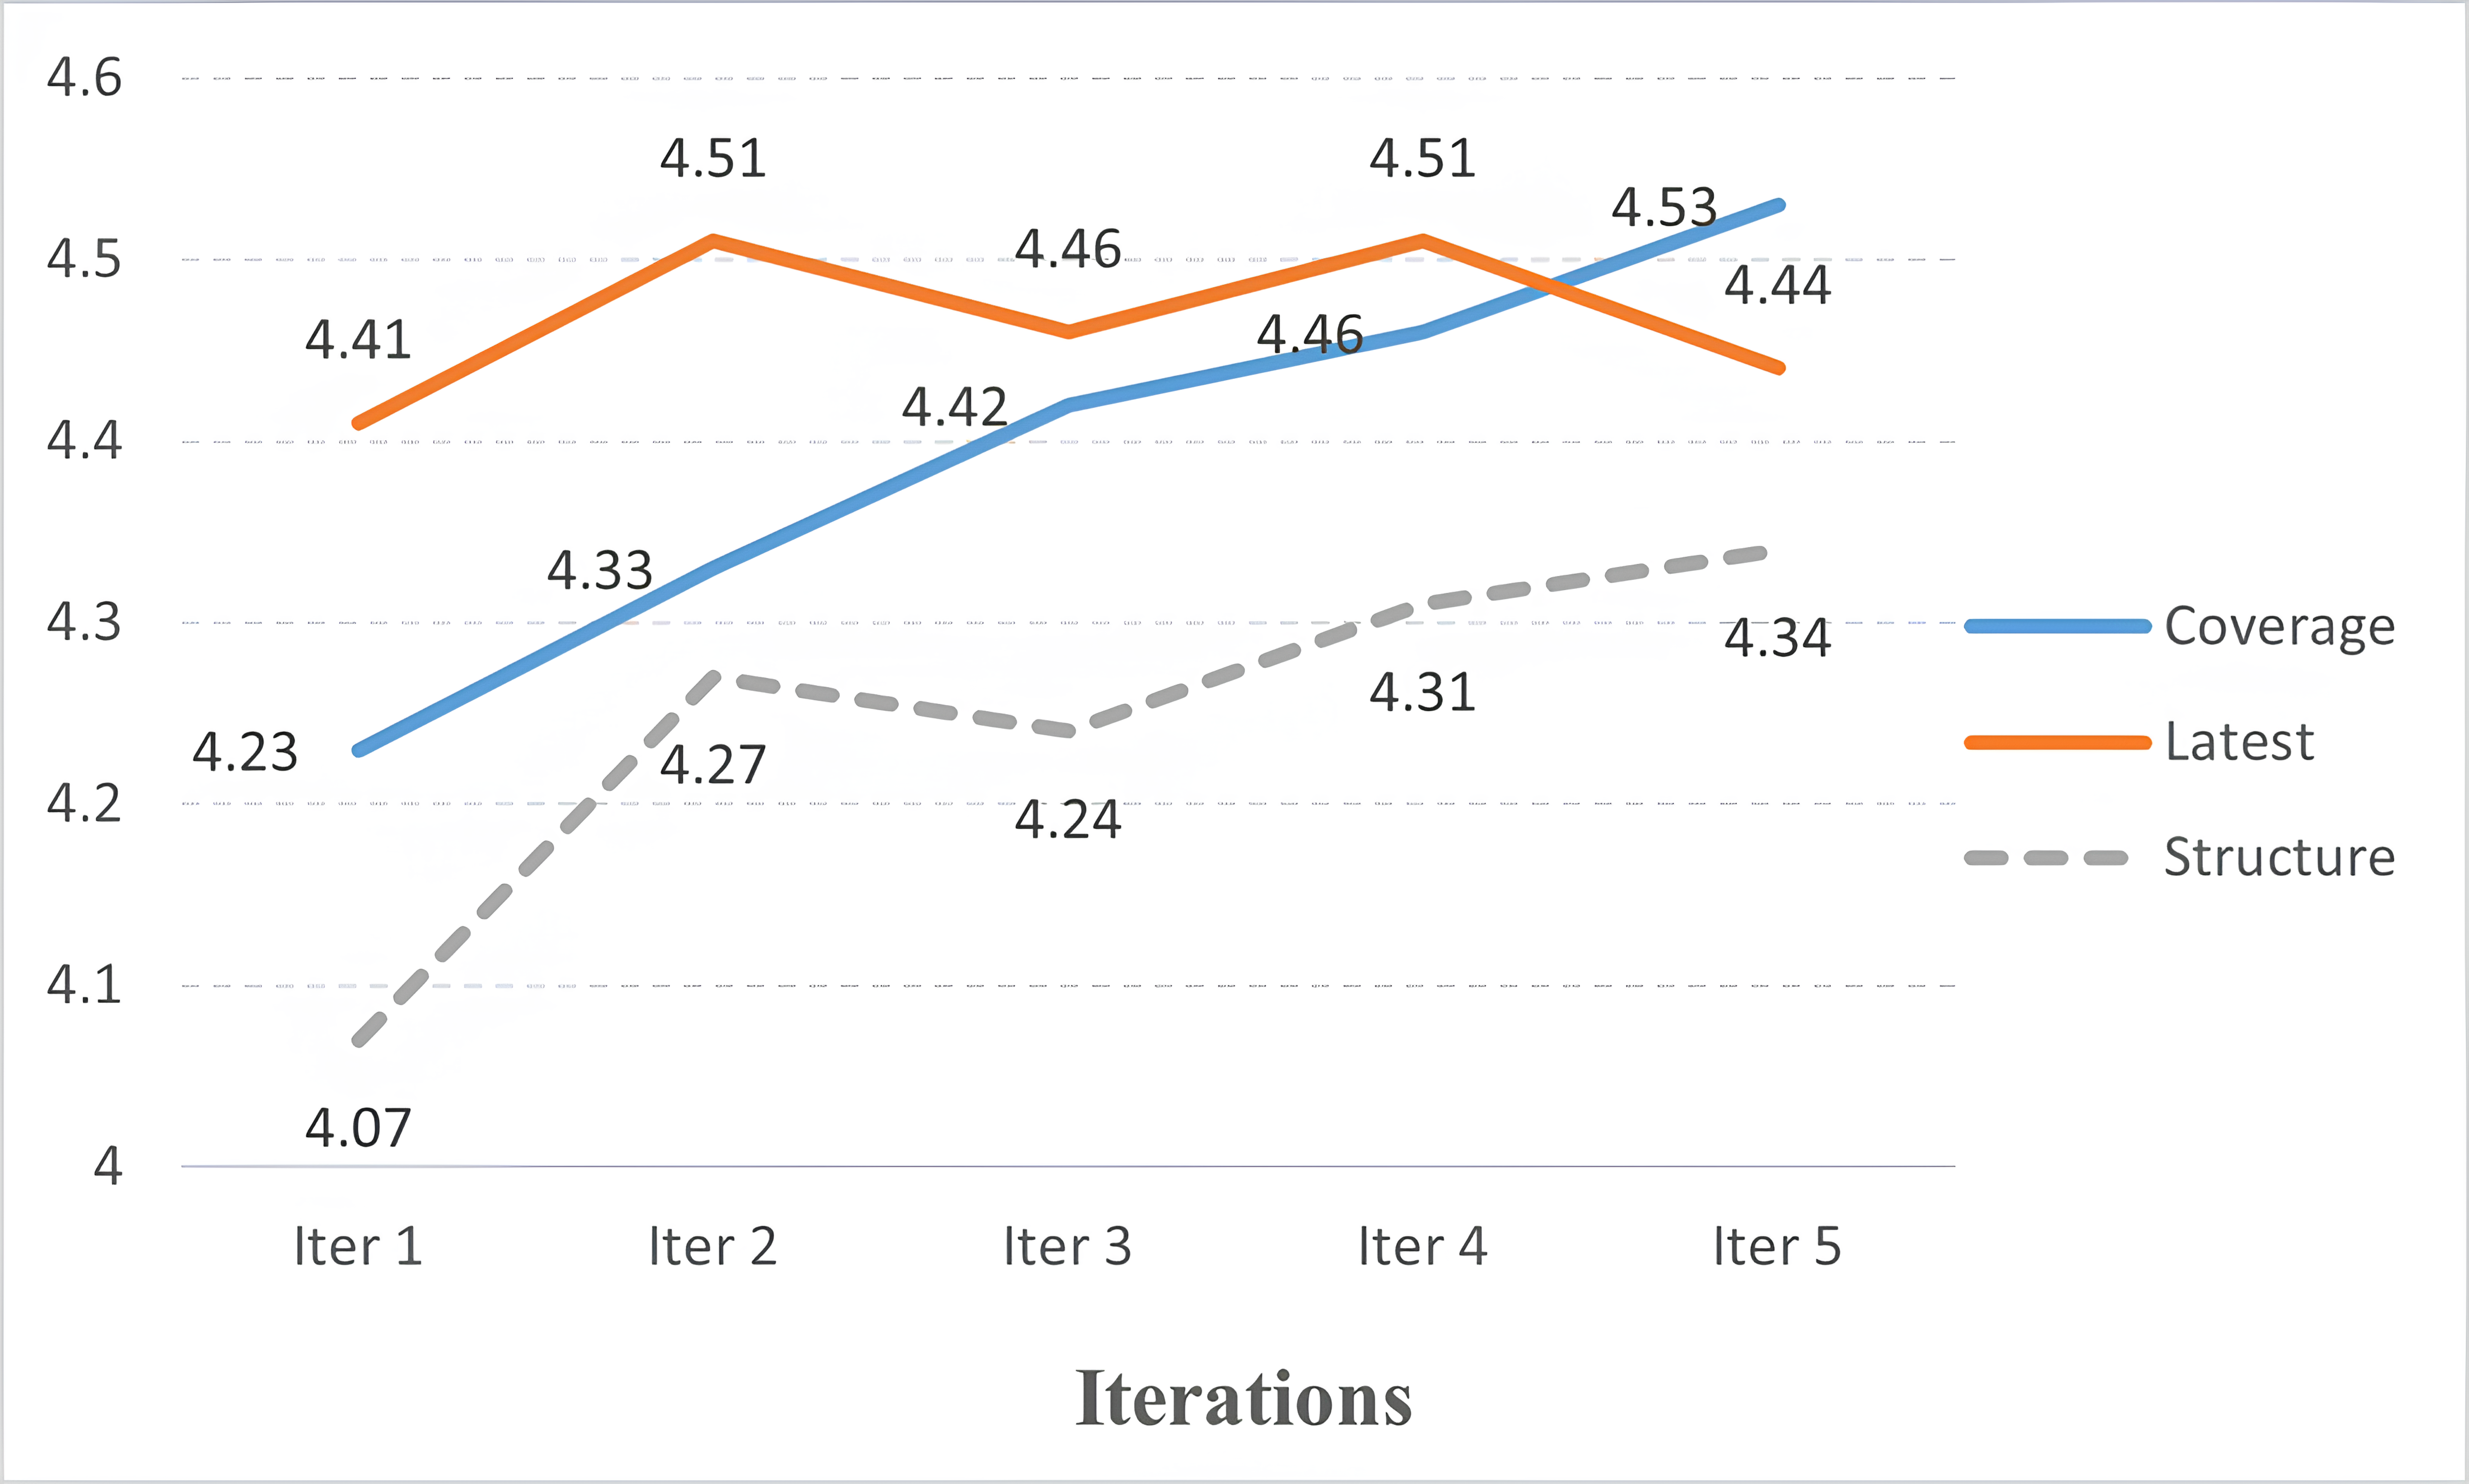
Iteration Evaluation: To ensure the high-quality of LAG-generated leaderboards, we iterated the process to evaluate the performance change during the whole iteration. Figure 3 presents the effect of different iteration counts on the performance of LAG. The results show that increasing the number of iterations from 1 to 5 provides a significant improvement in structure quality and Coverage quality scores. However, the latest score remains at a relatively high level, which is because in stage 1 of LAG, the old papers are filtered out.
Our experiments demonstrate that LAG is highly effective in generating high-quality, up-to-date leaderboards across various research topics. The framework’s ability to dynamically update leaderboards and extract detailed experiment settings ensures a fair comparison between state-of-the-art baselines. While LAG’s content quality scores are slightly lower than those of manually created leaderboards, its efficiency and scalability make it a valuable tool for researchers in rapidly evolving fields like AI and NLP.
4.2.2 Efficiency Analysis (RQ-2)
Construction Speed: LAG dramatically reduced the time required to generate leaderboards compared to manual methods. For instance, generating a 20-item leaderboard with LAG took approximately 120 seconds, while manual construction took over 18 minutes. This speed advantage makes LAG a practical tool for researchers who need up-to-date leaderboards in rapidly evolving fields. The high speed of LAG illustrates that LAG could help generate high-quality leaderboards timely.
4.2.3 Meta Evaluation (RQ-3)
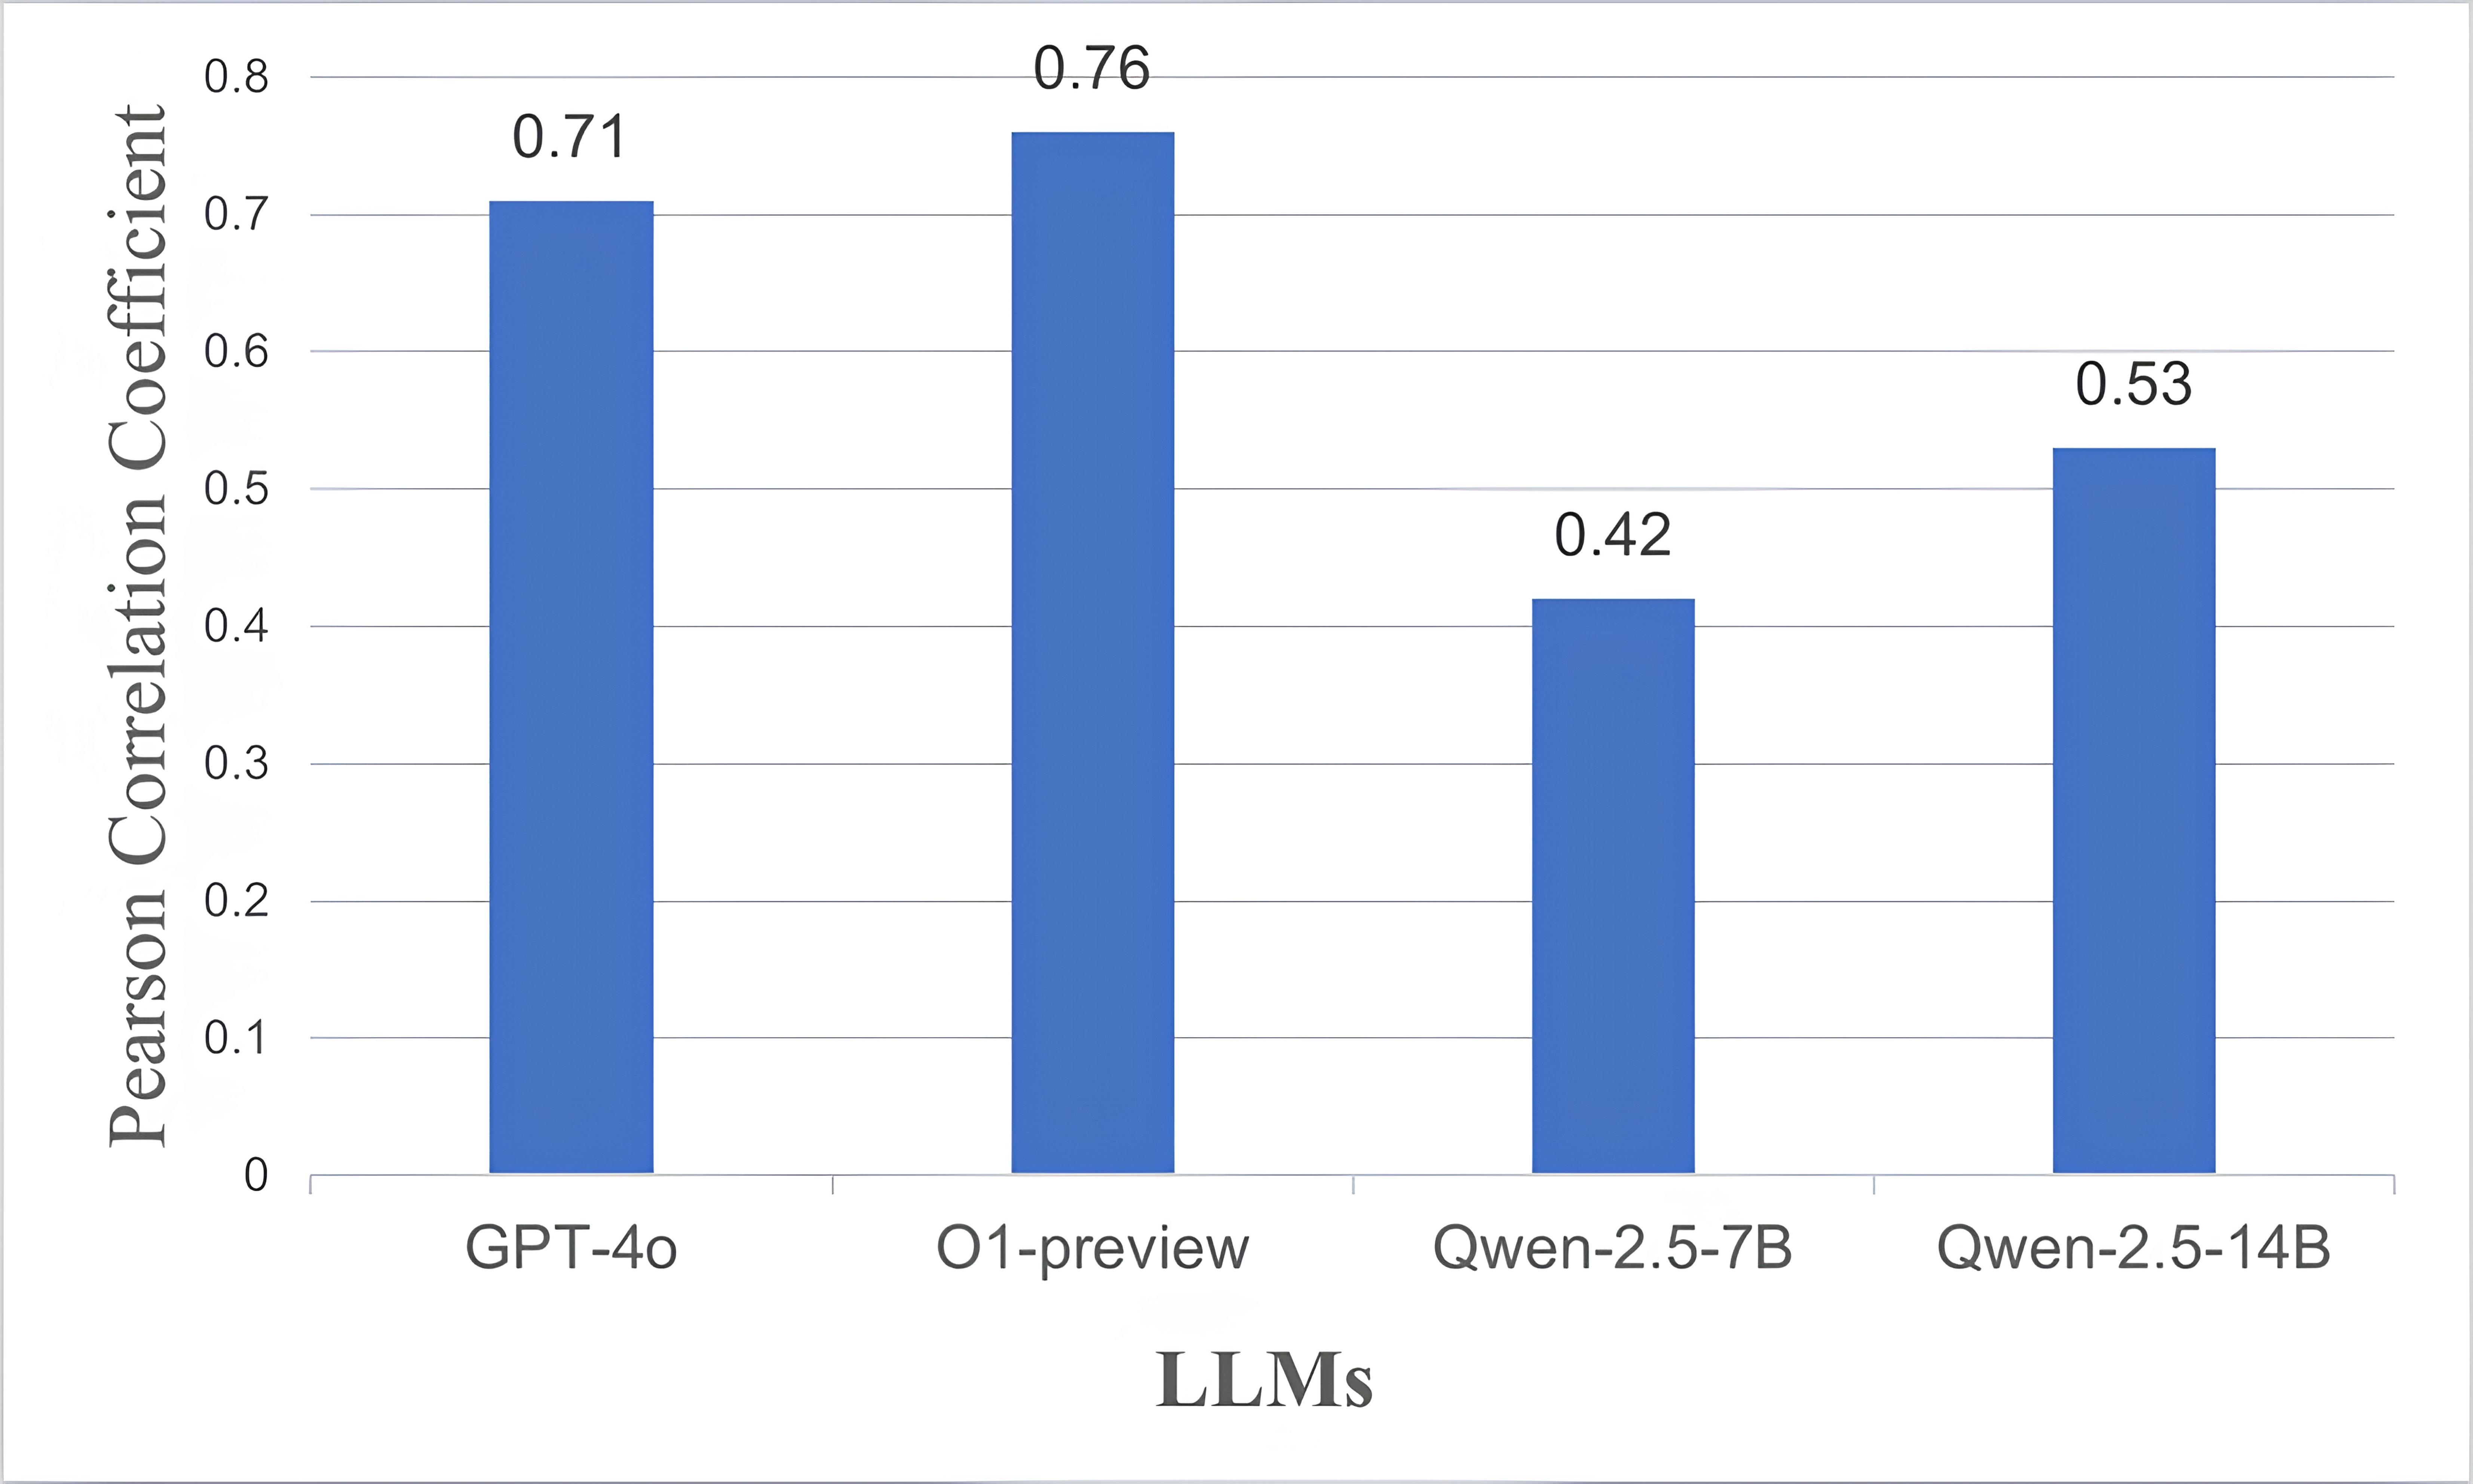
To verify the consistency between our proposed LLM evaluation strategy and human evaluation, we conduct a correlation evaluation involving human experts and our automated evaluation method. Human experts judge pairs of generated leaderboards to determine which one is superior. We compare the judgments made by our method against those made by human experts. Specifically, we provide experts with the same scoring criteria used in our evaluation for reference. The experts rank the 20 LAG-generated leaderboards, and we compare these rankings with those generated by the LLM using the Pearson Correlation Coefficient to measure consistency between human and LLM evaluations.
The results of this meta-evaluation are presented in Figure 4. The table shows the Pearson Correlation Coefficient values, indicating the degree of correlation between the rankings given by each LLM and the human experts. The Pearson correlation coefficient values indicate a strong positive correlation between the quality scores provided by the LLM and those given by human experts, with the O1-preview achieving the highest correlation at 0.76. These results suggest that our evaluation method aligns well with human preferences, providing a reliable proxy for human evaluation.
4.2.4 Ablation Study (RQ-4)
To understand the contribution of each component in LAG, we conducted an ablation study by removing key components of LAG as follows: (1) LAG w/o Table Classification: We removed the table classification step, which led to a slight decrease in Structure and Multiaspect scores, indicating that classifying tables is essential for maintaining a logical and well-organized leaderboard. (2) LAG w/o Refinement: We disabled the Refinementing step, which resulted in a minor drop in Coverage and Latest scores, suggesting that Refinementing helps refine the leaderboard by ensuring that only the most relevant and recent papers are included. As shown in Table 3, the results of the ablation study confirm that each component of the LAG plays a crucial role in achieving the generation of the high-quality leaderboard.
5 Conclusion
We introduce LAG, a novel agent framework leveraging large language models to automatically generate the latest, and high-quality leaderboards based on given research topics. LAG addresses key challenges including paper coverage, fair comparison, and timeliness through a systematic approach involving paper collection and split, table extraction and classification, table unpacking and integration, and leaderboard generation and evaluation. Experiments showed that LAG can automatically generate new, high-quality leaderboards in a relatively short time and match human performance topic-related quality and content qulaity. This advancement offers a scalable and effective solution for synthesizing the latest leaderboards, providing a valuable tool for researchers in rapidly evolving fields like artificial intelligence.
Limitations
One limitation of LAG is its reliance on the quality of the retrieved papers. While our topic-related quality metrics are strong, there is still room for improvement in ensuring that all relevant papers are included. Future work could explore more sophisticated retrieval models to further enhance the coverage of the generated leaderboards. Another limitation is, a specific dataset may contain several evaluation metrics, and different papers may use different metrics to evaluate proposed models’ performance, bringing challenges for leaderboard generation and baseline comparison.
References
- Achiam et al. (2023) Josh Achiam, Steven Adler, Sandhini Agarwal, et al. 2023. Gpt-4 technical report. arXiv preprint arXiv:2303.08774.
- Baek et al. (2024) Jinheon Baek, Sujay Kumar Jauhar, Silviu Cucerzan, and Sung Ju Hwang. 2024. Researchagent: Iterative research idea generation over scientific literature with large language models. ArXiv, abs/2404.07738.
- Bornmann et al. (2020) Lutz Bornmann, Robin Haunschild, and Ruediger Mutz. 2020. Growth rates of modern science: a latent piecewise growth curve approach to model publication numbers from established and new literature databases. Humanities and Social Sciences Communications, 8.
- Chen et al. (2023a) Shouyuan Chen, Sherman Wong, Liangjian Chen, and Yuandong Tian. 2023a. Extending context window of large language models via positional interpolation. ArXiv, abs/2306.15595.
- Chen et al. (2023b) Yukang Chen, Shengju Qian, Haotian Tang, Xin Lai, Zhijian Liu, Song Han, and Jiaya Jia. 2023b. Longlora: Efficient fine-tuning of long-context large language models. ArXiv, abs/2309.12307.
- Dong et al. (2022) Qingxiu Dong, Lei Li, Damai Dai, Ce Zheng, Zhiyong Wu, Baobao Chang, Xu Sun, Jingjing Xu, Lei Li, and Zhifang Sui. 2022. A survey on in-context learning. In Conference on Empirical Methods in Natural Language Processing.
- Hou et al. (2019) Yufang Hou, Charles Jochim, Martin Gleize, Francesca Bonin, and Debasis Ganguly. 2019. Identification of tasks, datasets, evaluation metrics, and numeric scores for scientific leaderboards construction. In Proceedings of the 57th Annual Meeting of the Association for Computational Linguistics, pages 5203–5213, Florence, Italy. Association for Computational Linguistics.
- KABENAMUALU et al. (2023) Salomon Kabongo KABENAMUALU, Jennifer D’Souza, and S. Auer. 2023. Orkg-leaderboards: a systematic workflow for mining leaderboards as a knowledge graph. International Journal on Digital Libraries, pages 1–14.
- Kardas et al. (2020) Marcin Kardas, Piotr Czapla, Pontus Stenetorp, Sebastian Ruder, Sebastian Riedel, Ross Taylor, and Robert Stojnic. 2020. AxCell: Automatic extraction of results from machine learning papers. In Proceedings of the 2020 Conference on Empirical Methods in Natural Language Processing (EMNLP), pages 8580–8594, Online. Association for Computational Linguistics.
- Li et al. (2023) Yuhan Li, Jian Wu, Zhiwei Yu, Börje F. Karlsson, Wei Shen, Manabu Okumura, and Chin-Yew Lin. 2023. All data on the table: Novel dataset and benchmark for cross-modality scientific information extraction.
- Lu et al. (2024) Chris Lu, Cong Lu, Robert Tjarko Lange, Jakob N. Foerster, Jeff Clune, and David Ha. 2024. The ai scientist: Towards fully automated open-ended scientific discovery. ArXiv, abs/2408.06292.
- Si et al. (2024) Chenglei Si, Diyi Yang, and Tatsunori Hashimoto. 2024. Can llms generate novel research ideas? a large-scale human study with 100+ nlp researchers. ArXiv, abs/2409.04109.
- Singh et al. (2024) Shruti Singh, Shoaib Alam, Husain Malwat, and Mayank Singh. 2024. Legobench: Scientific leaderboard generation benchmark. In Conference on Empirical Methods in Natural Language Processing.
- Wang et al. (2023a) Qingyun Wang, Doug Downey, Heng Ji, and Tom Hope. 2023a. Scimon: Scientific inspiration machines optimized for novelty. In Annual Meeting of the Association for Computational Linguistics.
- Wang et al. (2023b) Weizhi Wang, Li Dong, Hao Cheng, Xiaodong Liu, Xifeng Yan, Jianfeng Gao, and Furu Wei. 2023b. Augmenting language models with long-term memory. ArXiv, abs/2306.07174.
- Wang et al. (2024) Yidong Wang, Qi Guo, Wenjin Yao, Hongbo Zhang, Xin Zhang, Zhen Wu, Meishan Zhang, Xinyu Dai, Min Zhang, Qingsong Wen, Wei Ye, Shikun Zhang, and Yue Zhang. 2024. Autosurvey: Large language models can automatically write surveys. ArXiv, abs/2406.10252.
- Weng et al. (2024) Yixuan Weng, Minjun Zhu, Guangsheng Bao, Hongbo Zhang, Jindong Wang, Yue Zhang, and Linyi Yang. 2024. Cycleresearcher: Improving automated research via automated review. ArXiv, abs/2411.00816.
- Yang et al. (2024) Qwen An Yang, Baosong Yang, Beichen Zhang, Binyuan Hui, Bo Zheng, Bowen Yu, Chengyuan Li, Dayiheng Liu, Fei Huang, Haoran Wei, Huan Lin, Jian Yang, Jianhong Tu, Jianwei Zhang, Jianxin Yang, Jiaxin Yang, Jingren Zhou, Junyang Lin, Kai Dang, Keming Lu, Keqin Bao, Kexin Yang, Le Yu, Mei Li, Mingfeng Xue, Pei Zhang, Qin Zhu, Rui Men, Runji Lin, Tianhao Li, Tingyu Xia, Xingzhang Ren, Xuancheng Ren, Yang Fan, Yang Su, Yi-Chao Zhang, Yunyang Wan, Yuqi Liu, Zeyu Cui, Zhenru Zhang, Zihan Qiu, and Shanghaoran Quan. 2024. Qwen2.5 technical report.
- Yang et al. (2022) Sean Yang, Chris Tensmeyer, and Curtis Wigington. 2022. TELIN: Table entity LINker for extracting leaderboards from machine learning publications. In Proceedings of the first Workshop on Information Extraction from Scientific Publications, pages 20–25, Online. Association for Computational Linguistics.
- Yang et al. (2018) Zhilin Yang, Peng Qi, Saizheng Zhang, Yoshua Bengio, William W. Cohen, Ruslan Salakhutdinov, and Christopher D. Manning. 2018. HotpotQA: A dataset for diverse, explainable multi-hop question answering. In Conference on Empirical Methods in Natural Language Processing (EMNLP).
- Yang et al. (2023) Zonglin Yang, Xinya Du, Junxian Li, Jie Zheng, Soujanya Poria, and E. Cambria. 2023. Large language models for automated open-domain scientific hypotheses discovery. In Annual Meeting of the Association for Computational Linguistics.
- Şahinuç et al. (2024) Furkan Şahinuç, Thy Thy Tran, Yulia Grishina, Yufang Hou, Bei Chen, and Iryna Gurevych. 2024. Efficient performance tracking: Leveraging large language models for automated construction of scientific leaderboards. In Conference on Empirical Methods in Natural Language Processing.
| Criteria | Scores |
| Coverage | The ratio of the number of papers used for leaderboard generation to the total number of papers searched. |
| Latest | The ratio of the number of papers published after the certain date to the total number of papers searched. |
| Structure | Score 1: The structure of the leaderboard lacks logic, making it difficult to understand and navigate. The table header and each row are not clearly organized and connected. |
| Score 2: The structure of the leaderboard have some contents arranged in a disordered or unreasonable manner. However, the overall structure is reasonable and coherent. | |
| Score 3: The survey is generally comprehensive in coverage but still misses a few key points that are not fully discussed. | |
| Score 4: The structure of the leaderboard is generally reasonably logical, with most header items arranged orderly, though some header items may be repeated or redundant. | |
| Score 5: The structure of the leaderboard has good logical consistency, with each line strictly related to the header items and the previous line. But it can be optimized in terms of easy understanding. | |
| Multi-Aspect | The evaluation metric for multi-leaderboard. Specifically, a research topic may have different datasets, and thus we can get leaderboards, the score of the Multi-Aspect is computed based on the average of all the scores. . |
Appendix A Example Prompts
Appendix B Example LAG-generated Leaderboards
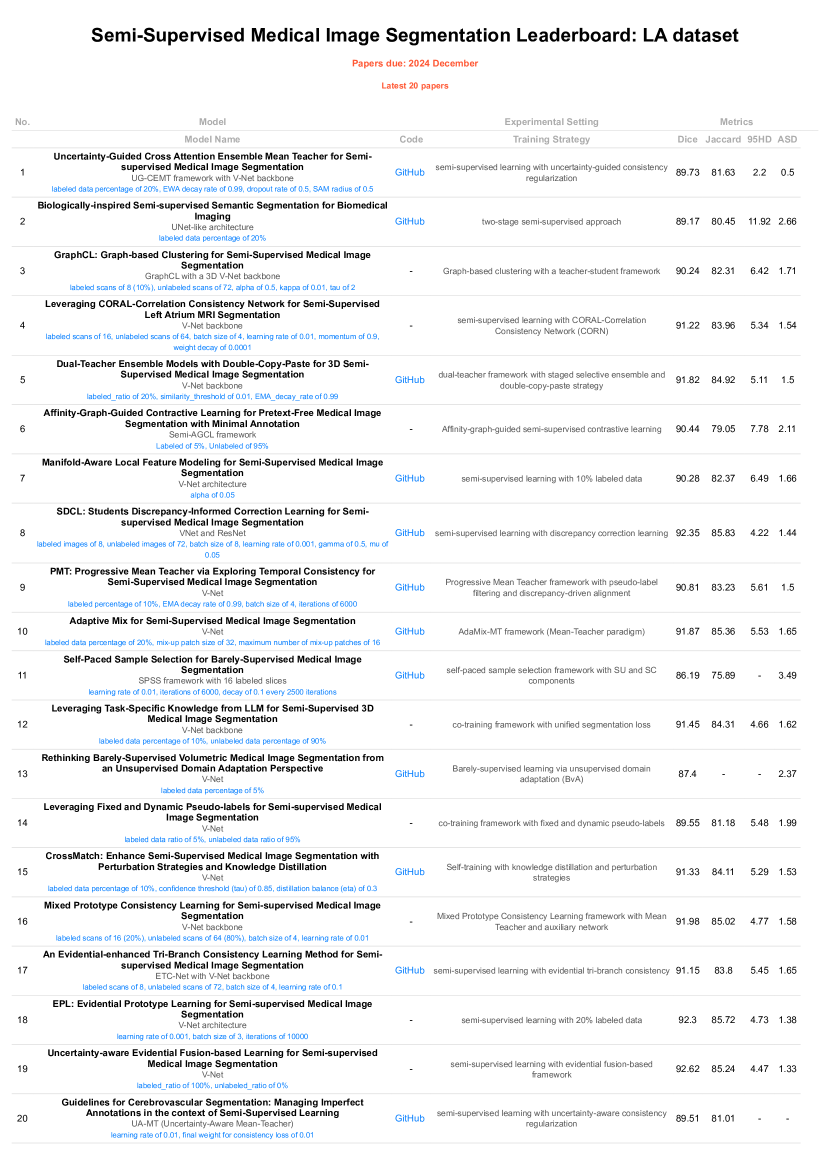
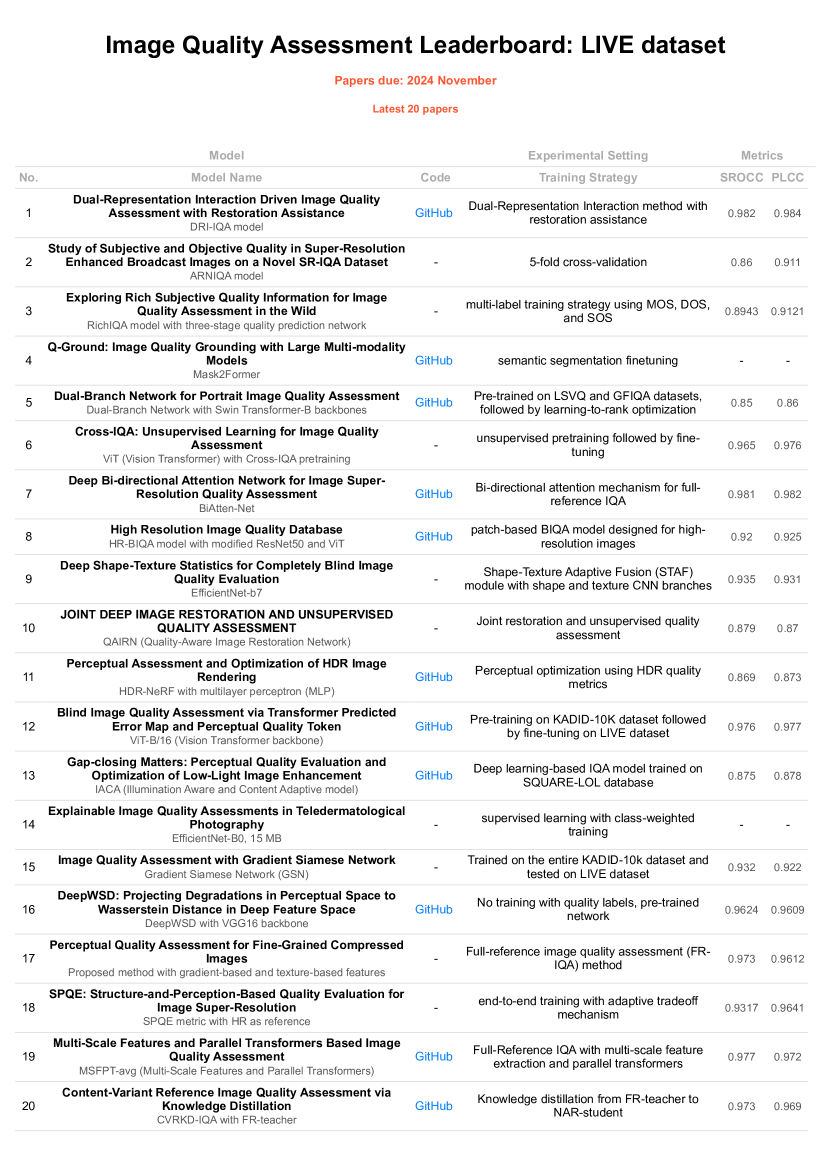
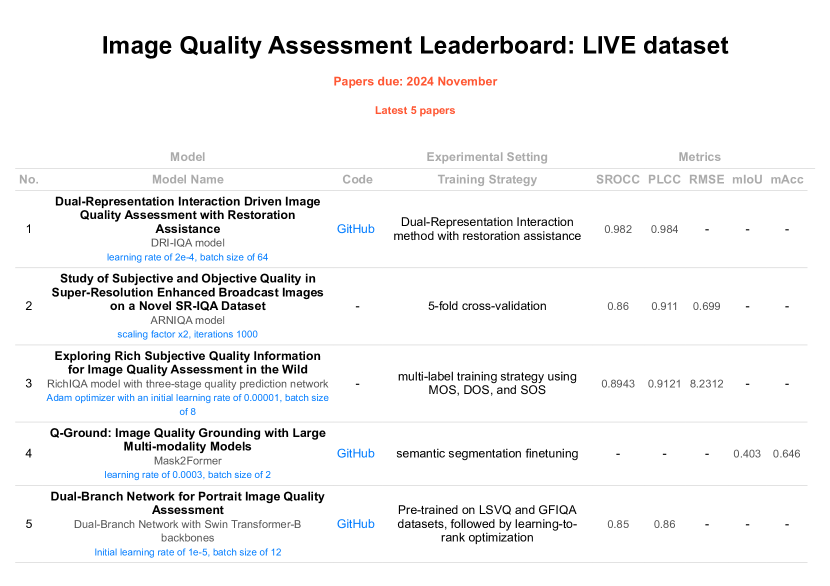
Figure 5 and 6 illustrate two examples generated by LAG. The papers in the first leaderboard are the latest methods of semi-supervised medical image segmentation on the LA dataset from March to December in 2024. The second leaderboard collects the most recent methods for image quality assessment conducted on the LIVE dataset from February 2022 to November 2024. To ensure that the table content is fully displayed, the "model & size" and "hyperparameters selection" within the experimental settings are presented beneath the paper titles.
First and foremost, when viewed holistically, both leaderboards with 20 entries, whether utilizing qwen2.5-14B or GPT-4o as the construction model, exhibit a notably high level of completeness. Upon specific analysis of the missing information, in Leaderboard 1, LAG failed to successfully extract the HD value from "Self-Paced Sample Selection for Barely-Supervised Medical Image Segmentation" (No. 11) because the metric was referred to as 95HD in the original text. Although our design accounts for such situations: our designed agent is required to extract metrics from both text and tables to avoid confusion caused by abbreviations. This design has successfully resolved most of the issues arising from abbreviations, but such errors still occur with a small probability. The absence of metrics in entries No. 13 and No. 20 is acceptable because the original text indeed lacks these metrics. The situation in Leaderboard 2 is similar; the only two missing items (No. 4 and No. 14) are also due to the absence of corresponding results in the original texts.
The higher missing rate in the 5-row leaderboard compared to the 20-row leaderboard for the LIVE dataset can be attributed to the following reasons: When only 5 papers are included, LAG extracts a larger number of metrics, including RMSE, mIoU, and mAcc. The missing values for these metrics are tolerable in a 5-row leaderboard. However, when expanding to a 20-row leaderboard, the excessive number of missing values forces LAG to discard these metrics to ensure that the leaderboard conveys meaningful information.
Secondly, regarding the experimental settings, we observe that in Leaderboard 1, the information on "model & size", "hyperparameters", and "training strategy" is both accurate and comprehensive. Notably, there is a consistent thread throughout the hyperparameters: the portion of labeled data. In contrast, Leaderboard 2 discards the hyperparameter information compared to Leaderboard 3. This is because we require LAG to extract hyperparameter information in a way that not only maintains completeness but also focuses on the intrinsic connections between different items. If the deviation is too large (i.e., if it cannot provide users with a concise and effective summary), the information should be discarded. Therefore, when the number of input papers for LAG increases from 5 to 20, the hyperparameter settings in the topic of image quality assessment do not have a clear and unified theme and thus are ultimately ignored.
Appendix C Cost Analysis
We calculate the average number of input & output tokens required to generate a 20-entry leaderboard, along with the cost analysis using different LLMs, as shown in Table 6. The computational cost of all models remains within 14$, indicating that LAG is also economically efficient. Overall, the LAG framework consumes more input tokens, while the output tokens represent only a small proportion. OpenAI prices output tokens significantly higher than input tokens, often reaching 4-5 times the cost of input tokens. However, considering the disparity in token numbers, the overall cost remains acceptable.
| Input tokens | Output tokens | Qwen2.5-7/14B | kimiAI-128k | GPT4-o | O1-preview |
| 834.7K | 8.9K | 0 | 50.616 ¥ | 2.176 $ | 13.055 $ |