Advising Agent for Supporting Human-Multi-Drone Team Collaboration
ifaamas \acmConference[AAMAS ’25]Proc. of the 24th International Conference on Autonomous Agents and Multiagent Systems (AAMAS 2025)May 19 – 23, 2025 Detroit, Michigan, USAA. El Fallah Seghrouchni, Y. Vorobeychik, S. Das, A. Nowe (eds.) \copyrightyear2025 \acmYear2025 \acmDOI \acmPrice \acmISBN \acmSubmissionID227 \affiliation \institutionBar Ilan university \cityramat gan \countryisrael
1 Appendix
1.1 The User Interface
Similar to the goal described by Chen et al. chen2022multi, our SAR system aims to provide the operator with comprehensive situational awareness while minimizing the need for low-level control of each drone. The \saytask mode includes automated allocation of the sub-areas to drones, where each drone scans its designated sub-area based on the difficulty level defined for that sub-area. The drones search for targets and alert the operator to suspected targets. In the \saycommand mode, our system offers the flexibility for the operator to manually assign sub-areas to specific drones, manually control a drone, or manually report targets as necessary.
The central part of the user interface has two modes: a map mode and a drone mode. In the map mode, the map is displayed, divided into sub-areas, showing the locations of the drones on the map. Each drone is labeled with a number, as recommended in hoang2023challenges. At the top, there are small images for each drone displaying what the drone sees (see Figure 1). In the drone mode, a specific drone’s view is shown in at the central area in a larger format, allowing the operator to manually control the drone and consider the specific details observed by the drone. For example, the operator can better handle a detected target in this mode (see Figure 2).
The left-side panel contains four tabs (see Figure 3):
-
•
Drones - This tab provides each drone a list of its assigned sub-areas, with the option to manually change it.
-
•
Areas - This tab displays all sub-areas, allowing the operator to change the probability of finding a target in a specific sub-area and amend the sub-areas difficulty levels.
-
•
Status - Controlling the simulation mode - choosing a scenario and switching between scanning and parameters phases.
-
•
Parameters - In this tab, the operator can set the parameters (altitude, velocity, and thresholds) for each area.
On the right-hand side, there is a panel containing the alerts from drones, which are displayed in light green, and other messages, such as those from the agent, which are displayed in light orange (see Figure 1).
In a preliminary experiment, we separated these messages into two different tabs: drone and agent messages. However, we noticed that this setup was less convenient for most operators given the high number of alerts from the drones. In particular, operators noted that they felt pressured to respond to them and often missed important messages from the agent. Therefore, in our ensuing human evaluation, we combined both types of messages into a single tab, but with different colors, providing the operator with a simpler way to see and distinguish the alerts and agent’s messages.
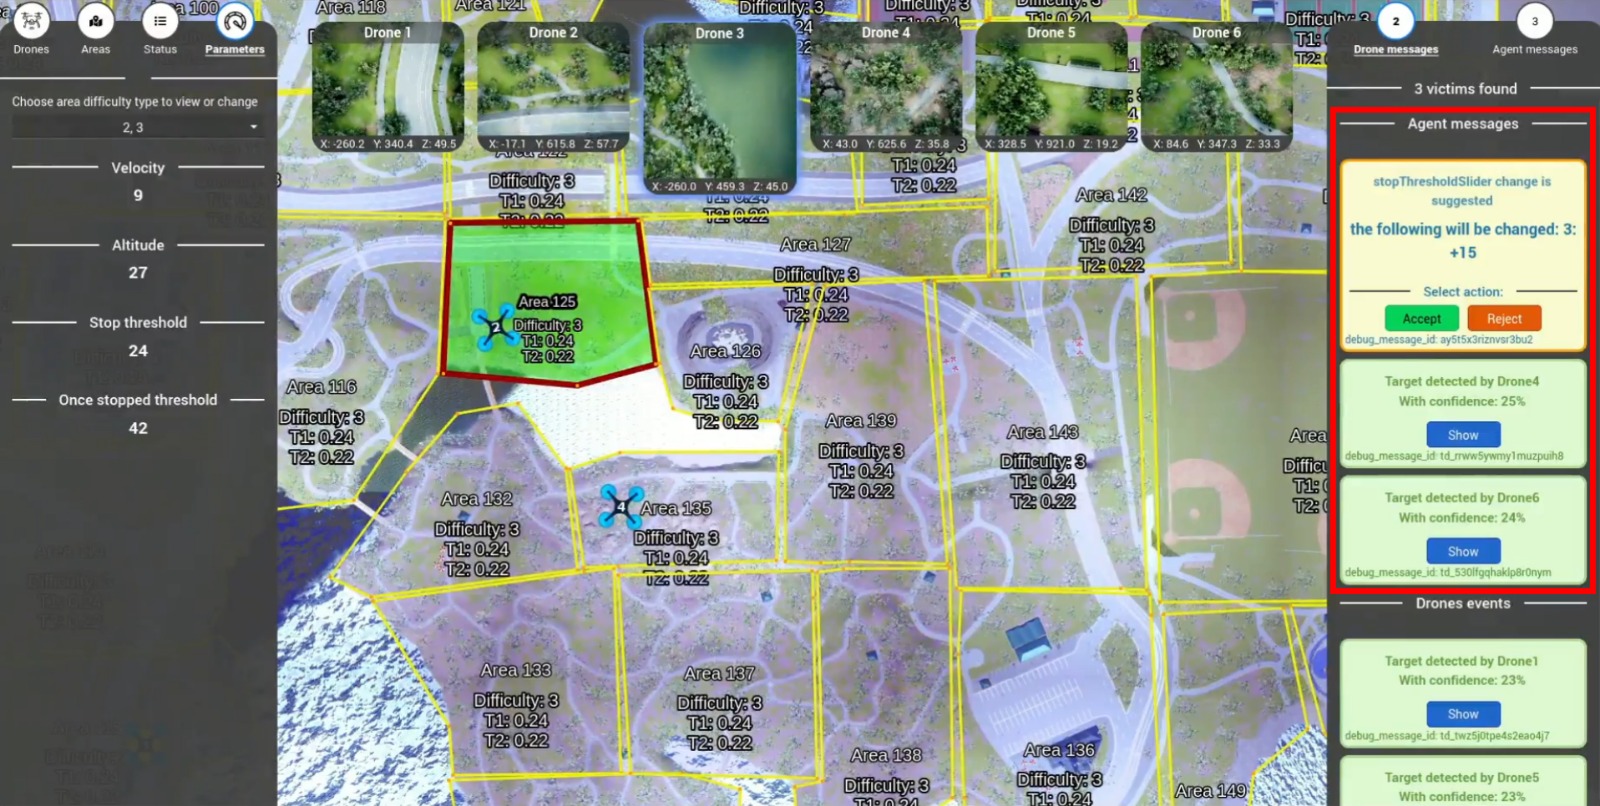
The SAR User Interface.
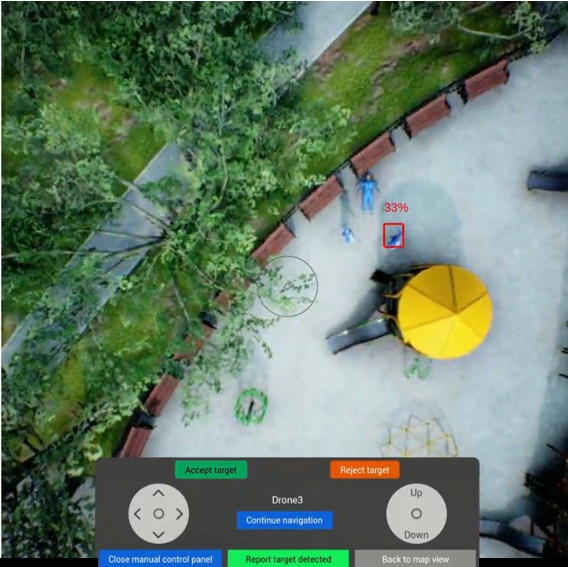
Manual control panel, during handling detection alert.

The left panel contains four tabs: Drones, Areas, Status, and Parameters.
2 Our SAR Environment - Illustration Video
Added here is a short illustration video of our SAR environment https://www.dropbox.com/scl/fi/14a9l4k4458jtwu8fswfc/Intelligent-Agent-Supporting-Human-Multi-Drone-Team-Collaboration.mp4?rlkey=9qr1vam2s131o60kjn346r7sr&st=u15skxm0
3 NASA-TLX
Considering the cognitive load, the TLX scores indicate that the overall cognitive load was not statistically different between the two setups, although it was slightly lower when the agent was present ( with the agent vs. without the agent). See Table 1 for the details.
| Agent | No agent | |
| Effort | 60.11, 3.44 | 61.35, 3.38 |
| Frustration | 46.82, 1.94 | 45.97, 1.61 |
| Mental demand | 58.23, 2.94 | 60.14, 3.02 |
| Performance | 48.67, 3.67 | 54.55, 4.41 |
| Physical demand | 28.44, 0.52 | 22.26, 0.79 |
| Temporal demand | 55.14, 2.47 | 54.94, 2.76 |
4 Data Collection with Human Operator
For the purpose of training data collection, we delineated a set of feasible tasks for human operators and extracted relevant telemetry from these simulations, to subsequently be utilized by the AA agent. The following list enumerates all potential operator tasks:
-
•
Define the area type for each sub-area.
-
•
Specify the probabilities of human presence in each area.
-
•
Adjust existing area probabilities or difficulty levels.
-
•
Prescribe altitude, velocity, thresholds: low-confidence (lc) and high-confidence (hc) corresponding to each area’s type.
-
•
Approve or reject detection alert.
-
•
Manually operate drones.
-
•
Handle malfunction alert.
-
•
Manually detect humans - press a stop buttons and enforcing target acceptance.
-
•
Manually modify the assignment of drones to sub-areas.
-
•
Direct focus to specific cameras.
From each simulation with human operator we collect the following data:
-
•
The sequence of actions performed by the operator, including their timing.
-
•
The temporal allocation of drones to specific sub-areas.
-
•
The entire world’s state each time.
-
•
The drones’ position at each time.
-
•
Dashboards’ screens, where user interaction was most pronounced.
-
•
NASA Task Load Index (TLX) assessments conducted post-experiment.
5 Mimicking Human Decision Making
As discussed in Section of the paper, acquiring a substantial amount of data is crucial for developing a action generator and a ranking model that can mimic the decision-making trajectory of a human operator. In our simulation platform, we conducted simulations involving human operators, excluding the Advising Agent, to collect all relevant information for . After analyzing the collected data, we identified several essential parameters necessary for accurately mimicking the original operator’s behavior:
-
•
Same initial probability for each search sub-area.
-
•
Same area type that the operator assigned to each search sub-area.
-
•
Scanning order of the search sub-area and allocation for each drone that followed the operator’s real simulation (if the operator did not complete scanning all search sub-areas, we allocated them according to the probability of the areas in descending order).
-
•
Adjustable parameters for each difficulty type (detection threshold, alert threshold, altitude, velocity).
-
•
Same changing parameter actions that the operator took at the same timestamp as the actual simulation.
-
•
True Positive (TP) rate - the probability of approving a detection when a target is in the drone’s camera view.
-
•
True Negative (TN) rate - the probability of rejecting a detection when a target is not in the drone’s camera view.
-
•
The average time for handling a detection alert.
-
•
The average time for handling action.
6 Operator Post-Scenarios Questionnaire
after finishing the four scenarios, each human operator filled out a detailed questionnaire. Their answers were on a scale from to . The questionnaire had four main parts, asking about different aspects of the operators’ experiences.
-
•
Personal Information -
-
–
Name
-
–
Gender
-
–
Age
-
–
Occupation
-
–
-
•
Background -
-
–
Have you flown a real drone before?
-
–
Have you photographed with a drone before?
-
–
How often do you play computer games?
-
–
Have you played a computer game that simulates flying an aircraft?
-
–
-
•
Post-Game Questions -
-
–
How comfortable was the interface for giving probability to areas?
-
–
How comfortable was the interface for selecting the parameters for each area type?
-
–
To what extent did the alerts from the drones help manage the simulation?
-
–
To what extent did you feel that her actions were consistent with finding missing persons?
-
–
How much did the experience on the simulator help you manage the simulation?
-
–
To what extent did the explanations that appeared on the alert help you manage the simulation?
-
–
How much did the manual driving option help you manage the simulation?
-
–
How many drones do you think can be managed without an agent in a good way?
-
–
-
•
Post-Game Agent Questions -
-
–
In the simulation with an agent, were you able to manage the simulation better?
-
–
In the simulation with an agent, did you experience less stress?
-
–
How many drones do you think can be managed with an agent in a good way?
-
–
In the simulation with an agent, how much did the drone alert rating help you manage the simulation?
-
–
In the simulation with an agent, how much did the recommendations from the agent for changing parameters help you manage the simulation?
-
–
In the simulation with an agent, how much did the recommendations from the agent to change the type of an area help you manage the simulation?
-
–
In the simulation with an agent, how much did the notifications about a non-advanced drone help you manage the simulation?
-
–
If you were the manager of a fleet of drones - how interested would you be in an agent?
-
–
7 Centralized Real-Time Task Allocation Algorithm
We used a genetic algorithm for path planning suggested in du2019evolutionary. The algorithm was originally used for finding lost tourists in large national parks in China. According to the suggested algorithm, a team of drones is looking for a target based on probabilities of the target location and image analysis. This strategy made the algorithm a good choice for our use.
The algorithm’s input is:
-
•
A - area
-
•
Set of n drones
-
•
sub-regions based on the topographic features.
-
•
- the initial location of
-
•
- the distance from to sub-area
-
•
- the maximum allowable time of the operation.
-
•
K - the number of search modes of the drones (the possible search altitudes)
-
•
a prior probability of target location in each sub-area at time t
-
•
- time required by drone to search sub-area with mode k
-
•
- the time for drone to fly from a sub-area to another .
The algorithm’s output is a search path of each drone such that the object can be detected as early as possible.
, where is the sequence of sub-areas to be searched by , and is the search mode used for the sub-area .
Based on the search path , the search times , and the flight times , the action of drone at each time can be determined. are used to denote that is searching in sub-area with mode k, and to denote that is flying from a sub-area to another .
The objective function for the optimizations can be calculated in the following way: Let be a hypothetical time at which the target is detected. iteratively the probability of is computed for all since the occurrences of detection by separate drones may be considered mutually exclusive.
The time complexity of the objective function .
A primary technique for growing a population of possible solutions to the problem and a sub-procedure for optimizing each drone path in the solution make up the genetic algorithm.
First, it initializes a population of solutions, including randomly generated solutions and a solution of a greedy method that selects the next step with the highest payoff (in terms of the ratio of the detection probability to the time consumed). Then do the following steps until time has terminated: For each solution and for each path in X, the sub-algorithm is used to optimize and evaluate the objective function for the solution X. After evaluating all objective functions, for each solution , which denotes the migration rate of solution X, will be calculated and then migration or mutation will be performed on the solution.
The sub-procedure mentioned above for path optimization is as follows. Suppose a set of sub-areas have been assigned to drone . The sub-procedure produces the search path of based on the NEH heuristic nawaz1983heuristic and tabu search method glover1989tabu; glover1990tabu. The ratio of the overall detection probability to the entire time spent along the path is used to assess the fitness of a path . The function is described as the probability that the drone search sub-area times probability at time , the target will be at sub-area searched by drone with mode , divided by the time required by drone to search sub-area with mode for all in path plus flying time from each sub-area. The migration algorithm is based on the BBO metaheuristic (Biogeography-Based Optimization), and it allows a solution to migrate characteristics from other solutions. For each solution in the population, a nonlinear model is used to calculate its migration rate as - and are the population’s highest and minimum objective function values. In each generation, each solution X has a probability of importing characteristics from other solutions, which are chosen from the top half of the population with probabilities proportionate to their fitness. A solution that is not migrated will be mutated by regenerating the search paths for some drones. Each solution X is assigned a mutation rate , initialized to 0.5 and updated at each generation as: . The mutation randomly assigns a sub-area to drones which are selected for mutation. If a solution has not improved after g (a control parameter commonly set to 6) generations, it will be replaced with a new solution generated randomly to increase solution variety.