Additional jamming transition in 2D bidisperse granular packings
Abstract
We present a jamming diagram for 2D bidisperse granular systems, capturing two distinct jamming transitions. The first occurs as large particles form a jammed structure, while the second, emerging at a critical small-particle concentration, , and size ratio, , involves small particles jamming into the voids of the existing large-particle structure upon further compression. Below this threshold, small particles fill voids within the large-particle network, increasing packing density. Beyond this point, excess small particles disrupt efficient packing, resulting in looser structures. The alignment of these findings with 3D results suggests a general geometric mechanism governing the second jamming transition.
The jamming transition occurs when granular materials shift from a fluid-like state, where particles can move freely, to a solid-like state, where most particles become immobilized. This phenomenon arises at a critical density, , when increasing compression or particle packing density restricts their motion, effectively freezing the system into a jammed configuration. This transition has been extensively studied in both two- and three-dimensional monodisperse and bidisperse packings [1, 2, 3, 4, 5, 6, 7, 8, 9, 10, 11, 12, 13, 14, 15]. In monodisperse sphere packings, the jamming transition occurs at [1, 4, 6, 7]. In contrast, bidisperse packings exhibit a broader range of values, increasing with lower size ratios and lower concentrations of small particles [8, 11, 12, 13, 15, 16]. Studies reveal that in asymmetric bidisperse packings, the system transitions from a small-sphere-rich to a small-sphere-poor structure. This transition is caused by an abrupt drop in the number of small particles contributing to the jammed structure at a specific , leaving the remaining small particles without contacts [8, 15]. Recent work [14] identified an additional jamming transition line in 3D bidisperse systems, arising from the jamming of small particles that were previously without contacts. An emerging point is observed at with , below which two distinct jamming transitions occur: one dominated by large particles at lower , followed by a second, discontinuous jamming of small particles at higher . This second transition not only exhibits unique mechanical properties, as demonstrated in Refs. [17, 18], but also enriches the jamming diagram for 3D bidisperse packings.
While the behavior of 3D packings reveals intricate jamming phenomena, 2D monodisperse and bidisperse systems are widely used to simplify and deepen our understanding. In polycrystalline monodisperse disk packings, the jamming transition occurs around [1, 2], whereas in disordered configurations, it drops to approximately [2, 9, 10]. In binary systems with a size ratio of and equal particle concentration (50:50), jamming occurs at [5, 4]. Systematic studies of the jamming transition have revealed a complex surface jamming diagram across the range , see Ref. [9], with a more detailed mapping provided in Ref. [3]. These works demonstrate a maximum at low and high . Notably, Ref. [3] highlights that the maximum is accompanied by a high number of small particles acting as rattlers, trapped in gaps between large particles and contributing minimally to the jammed structure. This behavior points to a decoupling in the jamming process of small and large particles, suggesting the presence of an additional transition line within the packing. In this work, we explicitly demonstrate that a second jamming transition can be rigorously identified, similar to that observed in 3D bidisperse packings [14]. This additional transition line is identified for and , distinguishing a jammed structure formed solely by large particles at low from one that incorporates both small and large particles at higher . The transition diagram for this case is illustrated in Fig. 1 and will be further discussed below.
2D bidisperse packings are simulated using the MercuryDPM software [19], which employs the discrete element method (DEM). Packings consist of particles, with a number of large, , and small, , particles and radius and , respectively. The size ratio , concentration of small particles, , and the overall packing fraction characterize the bidispersity of the system. An isotropic deformation, similar to that in Ref. [14], is applied here using the Hertzian spring dashpot contact model under the assumption of zero friction. Each bidisperse packing, defined by parameters (), is generated and subsequently compressed and decompressed following a standardized protocol, as described in Sec. I of Supplemental Material [20]. The jamming density, , at the first and second transitions is identified as the packing fraction at which a sudden increase occurs in the fraction of large and small particles contributing to the jammed structure. These fractions are defined as and , where represents the number of large and small particles in contact (see Sec. II of [20]). Fig. 1 presents the surface jamming diagram , constructed using cubic interpolation of the extracted . Our results reveal a rich surface diagram with minima at moderate and a marked enhancement at lower . As shown in Fig. 1, the additional red lines represent the second jamming transition for different values at low , while the rest of the surface corresponds to a single jamming transition. A detailed examination of the first and this second jamming transition, along with relevant characteristics of the surface is presented in Fig. 2.
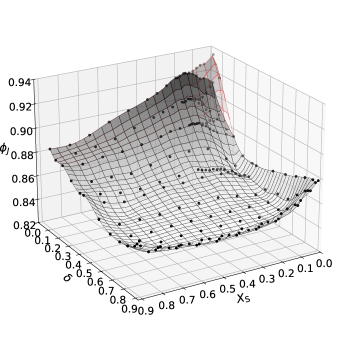
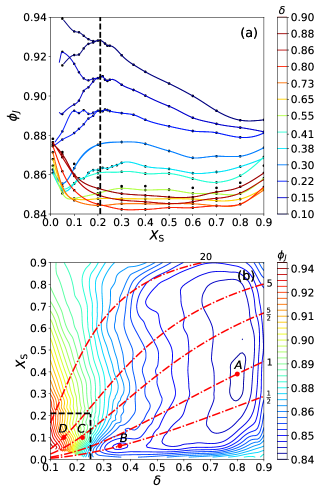
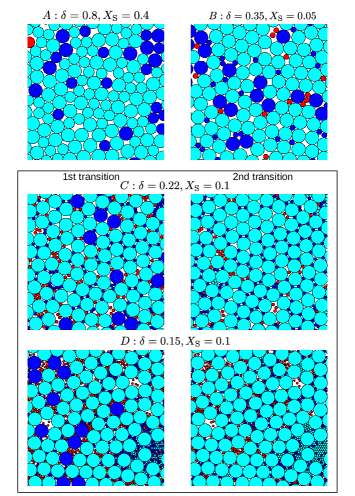
Fig. 2 (a) displays the jamming diagram, , as function of for the values used in this work. For , shows a slightly flat behavior for and a sudden increase at extreme values. For , increases exhibiting a maximum value at specific , becoming prominent for lower . For , displays an emerging point at , indicating an emergence of an additional jamming transition line between particle sizes for . At low , large particles jam first, marking the first jamming transition line, while most small particles have yet to contribute to the jammed structure. Further compression incorporates most small particles into the jammed structure with large ones, marking the second jamming transition line at low and , as shown in Figs. 1 and 2 (a). The shape of this second line depends on . For , a plateau in is observed. This plateau arises because small particles cannot fit into a triangular lattice of large particles after compression (see Fig. 4 C), resulting in a constant over a range of values. The decrease in at lower indicates that the small particle count is insufficient to significantly enhance the overall density. For , small particles can now fit into the triangular lattice of large particles (see Fig. 4 D), leading to an enhancement in , see Refs. [18, 13]. A distinct scenario emerges for , where the small particles are so small that a substantial number are needed to fill the voids within the triangular lattice formed by the large particles. The overcompression required to jam the small particles alongside the large ones, resulting in the second transition, leads to a noticeable increase in the average particle overlap compared to the first jamming transition. This behavior is detailed in Sec. III of Ref. [20], where the average overlap along the second transition is shown to remain below of the large particle diameter, decaying nearly to zero at the first transition. These overlap values provide strong evidence supporting the validity of the second jamming transition even after further compression.
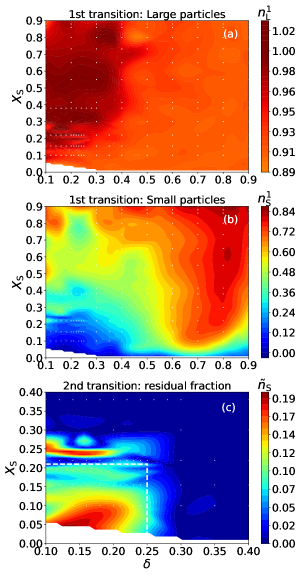
The first and second jamming transition lines are validated by analyzing the fractions of small, , and large, , particles contributing to the jammed structure with four or more contacts (non-rattlers), where the superscript indicates the respective jamming transition stage. This is illustrated in Fig. 3 in the full range of and values. For , where the flat behavior of is observed for in Fig. 2 (a), and , which means that most of the large and small particles form the jammed structure, see Fig. 3 (a)-(b). For , remains constant, while drops below . Despite this reduction, large and small particles still contribute simultaneously to the jammed structure. For and , is low, while remains high, see Fig. 3 (a)-(b). This implies that only large particles contribute to the jammed structure, while most small particles remain out of contact, see Fig. 2 (a,d) and (b,e) in Sec. II of [20]. This behavior defines the first jamming transition. With further compression, the fraction of small particles exhibits a sudden jump at higher , and after a significant incorporation into the already jammed structure of large particles defines the second jamming transition, see Fig. 2 (a) and Fig. 2 (c,f) in [20].
The fraction of small particles at the second transition, , is similar to Fig. 3 (b) except for a subtle change at low and low , see Sec. IV in [20]. To highlight this region, we quantify the difference , which captures the change in the fraction of small particles between the first and second transitions. For instance, , signifies that the fraction of small particles remains unchanged at the second transition, confirming that they become jammed together with the large particles during the first transition. Fig. 3 (c) shows the values of at the second transition. It illustrates a substantial increase of the small particles to the already jammed structure at low and low . More than of small particles are jammed, responsible for the second jamming transition shown in Fig. 1 and Fig. 2 (a). The emerging point of the second transition is identified at and (see white dashed lines), as this marks the boundary where regions with a substantial number of small particles are surrounded by low values of . This indicates that the second transition is limited to the highlighted region, further supported by the shortening of the second transition lines with increasing , see Fig. 1. The smaller red region around (see Fig. 3 (c)) might be considered as packings experiencing the second transition as well; however, this is not the case, as both large and small particles jam simultaneously in this region. This is just a continuous increase of the small particle number near the emerging point.
Fig. 1 provides additional insights that deepen our understanding of the jamming diagram, with further details illustrated in Fig. 2 (b). Two minima are observed: (A) a global minimum at and , and (B) a local minimum at and , exhibiting a similar jamming density. Interestingly, the global minimum corresponds to a 50:50 particle mixture, as shown by the dash-dotted lines in Fig. 2 (b), which represent distinct ratios of small to large particles . Fig. 4 (A) presents a close-up of the particle configuration at the global minimum, highlighting the presence of large and small particle rattlers. In contrast, the local minimum at corresponds to a packing where the number of small particles is approximately half that of the large particles, see particle configuration in Fig. 4 (B) showing more small particle rattlers. These minima correspond to loose packings characterized by the lowest jamming density in bidisperse granular systems.
A jamming diagram surface similar to Fig. 1 was previously reported in Ref. [3], identifying the same minima but at different values. This discrepancy arises from differing definitions of small particle concentration: their work uses the small particle fraction, , while we adopt the volume fraction, . These definitions are related via , allowing us to confirm consistency between our minima and theirs. A key distinction in our diagram is the presence of additional transition lines at low and , see Fig. 1 and Fig. 2 (a), absent in Ref. [3]. However, their study highlights an increase in small particle rattlers within the same and range, indicating the potential for a second transition. Fig. 2 (b) displays the values for the second transition, bounded by black dashed lines at and . The packings with and are highlighted at (see C and D), containing approximately five and five-and-a-half times as many small particles as large ones. At the second transition, exhibits a higher compared to the first transition, due to the incorporation of rattler particles into the jammed structure upon compression, see Fig. 4 (C). In contrast, represents a special size ratio where a single small particle can perfectly fill the void within a triangular lattice of large particles, satisfying . This configuration results in a denser packing and is observed in Fig. 4 (D), particularly at the second transition and occasionally at the first one. Note that the second transition can occur across a wide range of particle ratios . For the commonly studied 50:50 mixture, the onset of the second transition is observed at . Introducing particle ratios alongside the jamming diagram offers a clearer understanding of how large and small particles contribute to the jammed structure of the mixture.
In conclusion, we have constructed a detailed surface jamming diagram that presents both the first and second jamming transitions. The first transition is dominated by large particles, with small particles not contributing, while the second transition occurs as small particles jam into the already jammed structure of large particles. This second transition arises for and , a range where the size asymmetry is so pronounced that, beyond the typical configuration where a small particle fills the voids of a triangular arrangement of large particles, numerous small particles occupy interstitial spaces, leading to an increased jamming density with further compression. Outside of this range, small particles do not fit into the void of large ones leading to a looser packing. The second transition line and the emerging point values and align with 3D results obtained using the linear contact model [14]. This consistency indicates that the transition is independent of the contact model and suggests a general value governed solely by the packing geometry of the mixture.
The jamming-jamming transitions shown in Figs. 1 and 2 reveal an intriguing connection to the phenomenology of glass-glass transitions in colloidal glasses [21] and binary suspensions [22], suggesting a deeper relationship between glass and jamming transitions in both two- and three-dimensional systems [23]. Exploring multiple glass and jammed states can lead to more complex theoretical models and uncover additional structural features associated with various length scales in packings [24].
The additional transition observed has significant implications for the mechanical properties and packing density of bidisperse granular materials. This second transition could alter how systems respond to compression and deformation, impacting applications across materials science and granular flow studies. Our findings suggest that adjusting and can control both the density and stability of the packed structure, offering a new degree of freedom for designing granular materials with tailored properties. This study not only confirms the behavior seen in prior 3D research [14] but also provides a refined 2D perspective on the influence of particle ratios and size asymmetry on jamming. By linking these transitions to theoretical models and experimental observations, our work deepens the understanding of jamming phenomena in granular systems and sets the stage for future investigations into their mechanical properties and applications.
We thank T. Kranz and Th. Voigtmann for proofreading, fruitful discussions, and providing constructive criticism about the results and the paper. This work was supported by the German Academic Exchange Service (DAAD) under grant no 57424730.
References
- Donev et al. [2004] A. Donev, S. Torquato, F. H. Stillinger, and R. Connelly, J. Appl. Phys. 95, 989 (2004).
- Meyer et al. [2010] S. Meyer, C. Song, Y. Jin, K. Wang, and H. A. Makse, Phys. A: Stat. Mech. Appl 389, 5137 (2010).
- Koeze et al. [2016] D. Koeze, D. Vågberg, B. Tjoa, and B. Tighe, EPL 113, 54001 (2016).
- O’Hern et al. [2003] C. S. O’Hern, L. E. Silbert, A. J. Liu, and S. R. Nagel, Phys. Rev. E 68, 011306 (2003).
- Majmudar et al. [2007] T. S. Majmudar, M. Sperl, S. Luding, and R. P. Behringer, Phys. Rev. Lett. 98, 058001 (2007).
- van Hecke [2009] M. van Hecke, J. Phys. Condens. Matter 22, 033101 (2009).
- Behringer and Chakraborty [2018] R. P. Behringer and B. Chakraborty, Rep. Prog. Phys. 82, 012601 (2018).
- Prasad et al. [2017] I. Prasad, C. Santangelo, and G. Grason, Phys. Rev. E 96, 052905 (2017).
- Odagaki and Hoshiko [2002] T. Odagaki and A. Hoshiko, J. Phys. Soc. Jpn. 71, 2350 (2002).
- Atkinson et al. [2014] S. Atkinson, F. H. Stillinger, and S. Torquato, Proc. Natl. Acad. Sci. U. S. A. 111, 18436 (2014).
- Biazzo et al. [2009] I. Biazzo, F. Caltagirone, G. Parisi, and F. Zamponi, Phys. Rev. Lett. 102, 195701 (2009).
- Hopkins et al. [2011] A. B. Hopkins, Y. Jiao, F. H. Stillinger, and S. Torquato, Phys. Rev. Lett. 107, 125501 (2011).
- Kumar et al. [2016] N. Kumar, V. Magnanimo, M. Ramaioli, and S. Luding, Powder Technol. 293, 94 (2016).
- Petit et al. [2020] J. C. Petit, N. Kumar, S. Luding, and M. Sperl, Phys. Rev. Lett. 125, 215501 (2020).
- Hara et al. [2021] Y. Hara, H. Mizuno, and A. Ikeda, Phys. Rev. Res. 3, 023091 (2021).
- Furnas [1931] C. Furnas, Ind. Eng. Chem. Res. 23, 1052 (1931).
- Petit et al. [2022] J. C. Petit, N. Kumar, S. Luding, and M. Sperl, Phys. Rev. E 106, 054903 (2022).
- Petit and Sperl [2023] J. C. Petit and M. Sperl, Granul. Matter 25, 43 (2023).
- Weinhart et al. [2020] T. Weinhart, L. Orefice, M. Post, M. P. van Schrojenstein Lantman, I. F. Denissen, D. R. Tunuguntla, J. Tsang, H. Cheng, M. Y. Shaheen, H. Shi, P. Rapino, E. Grannonio, N. Losacco, J. Barbosa, L. Jing, J. E. Alvarez Naranjo, S. Roy, W. K. den Otter, and A. R. Thornton, Comput. Phys. Commun. 249, 107129 (2020).
- [20] See supplemental Material at ??? for details of the simulation algorithms and definitions.
- Sperl [2004] M. Sperl, Phys. Rev. E 69, 011401 (2004).
- Voigtmann [2011] T. Voigtmann, Europhys. Lett. 96, 36006 (2011).
- Charbonneau et al. [2017] P. Charbonneau, J. Kurchan, G. Parisi, P. Urbani, and F. Zamponi, Annu. Rev. Condens. Matter Phys. 8, 265 (2017).
- Hexner et al. [2018] D. Hexner, A. J. Liu, and S. R. Nagel, Phys. Rev. Lett. 121, 115501 (2018).