ENACT-Heart – ENsemble-based Assessment Using CNN and Transformer on Heart Sounds
Abstract
This study explores the application of Vision Transformer (ViT) principles in audio analysis, specifically focusing on heart sounds. This paper introduces ENACT-Heart – a novel ensemble approach that leverages the complementary strengths of Convolutional Neural Networks (CNN) and ViT through a Mixture of Experts (MoE) framework, achieving a remarkable classification accuracy of 97.52%. This outperforms the individual contributions of ViT (93.88%) and CNN (95.45%), demonstrating the potential for enhanced diagnostic accuracy in cardiovascular health monitoring. These results demonstrate the potential of ensemble methods in enhancing classification performance for cardiovascular health monitoring and diagnosis.
Index Terms:
audio visualization, cardiology, ensemble method, mixture of experts, spectrogram, transformer![[Uncaptioned image]](/html/2502.16914/assets/images/diagram_ENACT_Heart.png)
I Introduction
Cardiac diagnostics have undergone remarkable advancements over the centuries, yet the analysis of heart sounds remains a fundamental aspect of assessing cardiovascular health. These sounds, primarily associated with the closure of heart valves, offer crucial insights into cardiac function. The first heart sound (S1), produced by the closure of the atrioventricular valves, and the second heart sound (S2), associated with the closure of the semilunar valves, are commonly recognized as the characteristic ’lub’ and ’dub.’ In a healthy heart, these sounds provide clear indications of proper valve function. Over time, the practice of analyzing these sounds has become an indispensable non-invasive tool in medical diagnostics, offering a reliable means to detect abnormalities and evaluate cardiac performance.
I-A Anomalies in the Heart Sounds
Heart murmurs, extra heart sounds, and extrasystoles are common anomalies detected during cardiac auscultation. Each type of anomaly provides valuable information about potential underlying cardiac conditions.
Heart murmurs are among the most common anomalies detected through auscultation. Produced by turbulent blood flow strong enough to generate audible noise, these ”whooshing” sounds can be heard in various scenarios, including some healthy individuals. While innocent murmurs, also known as functional or benign murmurs, are typically harmless and not associated with structural heart abnormalities, pathologic murmurs indicate underlying conditions such as valve defects, congenital heart defects, or abnormal blood flow patterns.
Extra Heart Sounds refer to additional heart sounds beyond the normal ”lub-dub” pattern. These may manifest as ”lub-lub dub” or ”lub dub-dub” sequences. Extra heart sounds can sometimes indicate underlying conditions, although they may also occur in healthy individuals. Detection of these sounds is crucial as they may not be easily identified through other diagnostic tools like ultrasound.
Extrasystole involves irregular heart rhythms, typically presenting as extra or skipped heartbeats. These can be heard as sequences such as ”lub-lub dub” or ”lub dub-dub.” While extrasystoles may be benign, they can also signify underlying heart disease, making early detection important for effective treatment.
A detailed explanation of these anomalies can be found in Table I.
I-B Organization of the Paper
This paper is organized as follows: Section II covers the background of the study, providing the necessary theoretical foundation. III provides an in-depth review of related work, discussing the advancements and methodologies in cardiac sound analysis and the integration of machine learning models in cardiovascular diagnostics. Section IV details the proposed approach, including the data preprocessing techniques, the generation of audiovisual data, and the model architectures. Section V describes the experimental setup, including the dataset used, training procedures, and evaluation metrics. The results of the experiments are presented in VI, highlighting the performance of individual models and the ensemble method. Finally, Section VII concludes the paper with a summary of findings, potential implications for clinical practice, and directions for future research.
I-C Contributions
The primary impacts of the proposed experiment are the following:
-
•
We developed ENACT-Heart (See Fig. 1) – a novel transformer-based ensemble method specifically designed for diagnosing medical audio data through advanced visualization techniques. ENACT-Heart demonstrates state-of-the-art performance, surpassing other existing ensemble methods in the field.
-
•
We explored the feasibility of employing the Mixture of Experts (MoE) approach across different AI architectures, combining CNN and ViT. This integration effectively leverages multiple image modalities derived from the same input data, enhancing diagnostic accuracy.
-
•
We applied a ViT model to medical time-series sound data by converting it into audiovisual representations. This innovative approach, still an active area of research, opens new avenues for analyzing and interpreting complex medical signals.
| Category | Description |
|---|---|
| Normal | • Healthy heart sounds with a clear ”lub dub” pattern. • May contain background noises and occasional random noise. |
| Murmur | • Abnormal heart sounds with a ”whooshing, roaring, rumbling, or turbulent fluid” noise between ”lub” and ”dub”, or between ”dub” and ”lub”. • ”Lub” and ”dub” are still present. • Murmurs do not occur directly on ”lub” or ”dub”. |
| Extra Heart Sound | • Additional heart sounds such as ”lub-lub dub” or ”lub dub-dub”. • May or may not be a sign of disease. • Important to detect as it may not be detected well by ultrasound. |
| Extrasystole | • Heart sounds out of rhythm involving extra or skipped heartbeats, such as ”lub-lub dub” or ”lub dub-dub”. • May or may not be a sign of disease. • Treatment is likely to be more effective if diseases are detected earlier. |
II Historical Background
The diagnosis of heart conditions dates back to the early days of medicine, where physicians relied on palpation and pulse assessment to detect abnormalities. A significant breakthrough occurred in the 1700s when Jean Baptiste de Senac, physician to King Louis XV of France, established the connection between atrial fibrillation and mitral valve disease. Senac’s work laid the foundation for cardiology as a distinct field of study [2].
The invention of the stethoscope by René Laennec in 1816 marked a pivotal moment in cardiac diagnostics. Laennec introduced the technique of ”mediate auscultation” using his newly created paper acoustic device, allowing for more accurate detection of heart sounds and abnormalities [3]. This innovation remains a cornerstone in the history of cardiology.
These early diagnostic methods, based on manual interpretation of heart sounds, evolved significantly over the centuries. With technological advancements, traditional auscultation has been augmented by electrocardiograms (ECGs) and other imaging modalities. In recent years, the integration of artificial intelligence (AI) and machine learning has opened new avenues for the analysis of heart sounds, leading to more precise and efficient diagnostic tools [4, 5].
III Related Works
III-A Thematically Related Works
Thematically, the proposed method lies in the field of computer-assisted diagnosis (CAD) systems for heart disease. CAD systems for heart diseases utilize computation techniques such as machine learning, pattern recognition, and AI to analyze cardiac data and provide decision-support tools for healthcare providers.
There have been numerous attempts to apply CAD systems for heart diseases in diverse modalities, including but not limited to ECG, cardiac CT/MRI, etc. These systems analyze cardiac data to identify abnormalities and patterns - especially indicators of certain heart diseases. However, the direction of the majority of these researches are pointed mainly toward computer vision over audio AI, mainly due to the advanced deep learning models available.
For some researches that emphasized sound classification, its methodologies have varied slightly from the approach proposed in this study. For instance, Jumphoo et al. utilized a CNN for feature extraction and Data-efficient Image Transformer (DieT), a variant of the ViT model, for classification tasks through stacking [6]. Another heart sound classification model, proposed by Liu et al., also uses ViT for classification but employs a different image modality called bispectral patterns and relies solely on ViT without integrating other models [7]. While these studies highlight the effectiveness of ViT individually, they do not explore the potential benefits of using an ensemble approach.
Overall, the integration of multiple distinct AI models and modalities from the same sound inputs, as proposed in the ENACT-Heart using an MoE approach, has not been attempted yet. This novel methodology leverages the strengths of both ViT and CNN models, potentially offering a more robust and accurate solution for heart sound classification.
III-B Methodologically Related Works
The use of computer vision as a tool for machine hearing is an emerging approach. There have been attempts to use computer vision techniques as a method of machine hearing - analyzing audio signals by treating them as visual data.
Hsu et al. [8] presented a deep learning-based music classification through mel-spectrogram and Fourier tempogram features. Although the concept of using multiple different audiovisual modalities and models from singular sound data is there, the paper employed the short-chunk CNN + ResNet as the backbone architecture of their models.
IV Proposed Approach
The choice of heart sound analysis in this study is driven by its unique diagnostic value, which complements other modalities such as ECG. Despite the advent of modern diagnostic techniques and sophisticated imaging modalities, cardiac auscultation and heart sounds remain invaluable diagnostic tools. While ECG is widely regarded as the gold standard for diagnosing cardiac rhythm disorders and ischemic heart disease, it may not capture certain aspects of cardiac function that heart sound analysis can, such as detecting murmurs, rubs, and other abnormal heart sounds indicative of structural abnormalities like valvular heart diseases or ventricular hypertrophy. Therefore, heart sound analysis provides additional, complementary information that can enhance diagnostic accuracy.
Researches has demonstrated that it is possible to process spectrograms from audio data as images and apply computer vision algorithms such as CNN [9, 10, 11]. The core problem of the current approaches in using regular CNN-based computer vision methods on audio spectrogram representation lies in the distinctiveness of the spectrogram in comparison to other image data.
Visual transformers leverage attention mechanisms to capture dependencies between different parts of the input data. This allows them to model long-range dependencies more effectively than traditional CNNs, whose feature extraction is limited to local receptive fields. By aggregating information from across the entire spectrogram, transformers can show a global contextual understanding of the audio signal, enabling them to capture non-local dependencies and extract meaningful features from spectrograms.
IV-A Spectral Data Visualization & Analysis
In spectral visualization and analysis, researchers employ various techniques to gain insights into the frequency content of signals. These methodologies enable the examination of how frequencies evolve over time, providing valuable information for tasks such as audio processing, speech recognition, and biomedical signal analysis.
Spectrogram. Spectrograms stand as one of the primary tools in spectral visualization. They offer detailed representations of frequency spectra over time, revealing how the frequency composition of a signal changes temporally. By plotting frequency on the vertical axis, time on the horizontal axis, and intensity or magnitude using color or brightness, spectrograms provide a comprehensive view of signal dynamics. This detailed visualization allows analysts to identify specific features, patterns, and transient events within the signal, making spectrograms invaluable for tasks requiring fine-grained temporal frequency analysis.
Spectral Centroid. In contrast to the detailed temporal-frequency mapping provided by spectrograms, spectral centroids offer a simplified summary of a signal’s frequency content. The spectral centroid indicates the ”center of mass” or average frequency of a signal within each time frame. This single-value representation reduces the complexity of the data while still providing a concise summary of the signal’s frequency characteristics. Spectral centroids are particularly useful for enhancing computational efficiency and maintaining robustness against noise and variations in the signal. However, they lack the detailed temporal information that spectrograms provide.
The synergy in using spectrograms and spectral centroids with different models lies in their ability to capture distinct and complementary features of audio signals. Spectrograms provide a comprehensive visualization of the frequency content over time, highlighting complex, high-dimensional patterns. In contrast, spectral centroids and waveforms represent simpler, more repetitive features, which are well-suited to the strengths of CNNs in learning local patterns through convolution and pooling operations.
By employing a MoE approach, the proposed model effectively combines these diverse representations. The spectrograms allow the model to capture detailed, global time-frequency information, while the spectral centroids and waveforms facilitate the extraction of robust, localized features. This integration leverages the strengths of both ViT and CNNs, resulting in a more accurate and holistic analysis of heart sounds.
IV-B MoE
MoE is a powerful ensemble learning methodology used in machine learning and statistical modeling. Within ensemble methods, multiple models are combined to improve predictive performance compared to any individual model. MoE takes this concept a step further by combining various models and adjusting the weight of their contributions adaptively per the input data.
In MoE, the ”experts” are individual models or learners, each specializing in a particular region of the input space or addressing specific patterns in the data. These experts make predictions independently based on their specialized knowledge. The key innovation of MoE lies in the gating network, which dynamically selects the most relevant expert or combination of experts for each input instance.
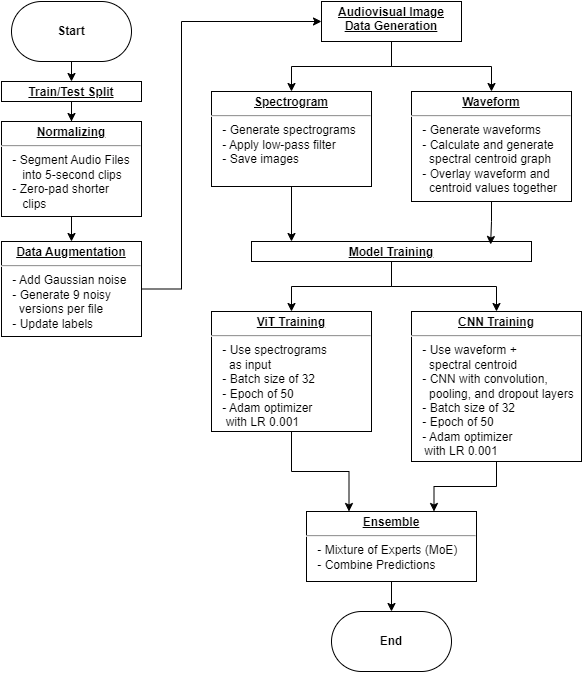
The gating network, often implemented as a neural network, learns to assign weights to the experts based on the input data. These weights determine the contribution of each expert to the final prediction. By adaptively combining the predictions of multiple experts, MoE can capture complex relationships in the data and achieve superior predictive performance compared to traditional ensemble methods. The flowchart of the proposed experiment, depicted in Figure 2, illustrates the entire process, from input data processing to the final output generated by the MoE.
V Experiments
In this section, we detail the experimental setup used to evaluate the performance of the ENACT-Heart. The overall workflow of this process is summarized in Fig. 2, which outlines the key steps from data preparation to the final ensemble prediction.
V-A Dataset Used
The heart sound dataset provided in the PASCAL Classifying Heart Sounds Challenge was used for training and testing the models [12]. The audio files in the dataset vary in length, ranging from 1 second to 30 seconds.
V-B Data Preprocessing
Creating Dataframe. The PASCAL dataset consists of two main folders, each containing labeled audio files. These folders were combined into a single dataframe, which includes the file paths and corresponding labels. An exploratory data analysis (EDA) was performed to understand the distribution of classes and identify any potential issues such as missing or mislabeled data.
Normalizing. To address the inconsistent length of audio recordings, a preprocessing step was implemented. Each audio file was segmented into 5-second clips. If an audio file was shorter than 5 seconds, it was zero-padded to meet the required input length.
Data Augmentation. To increase the dataset size and introduce variability, Gaussian noise was added to the audio files, generating 9 additional noisy versions for each original file. Gaussian noise with a mean of 0 and a standard deviation of 0.1 was added to the audio files to generate augmented data. Each audio file was segmented into 5-second clips to standardize the input length for model training. This resulted in a total of 10 versions per audio file (1 original + 9 augmented). The augmented audio data was included in the dataframe, and corresponding labels were updated to reflect the augmentation process.
V-C Audiovisual Image Data Generation
Two types of visual representations were generated for each audio file: spectrograms and centroid graphs.
Spectrogram. Spectrograms were generated to visualize the frequency content of the audio files over time. Given the presence of various background noises in real-world conditions, a low-pass filter set at 195 Hz was applied. This filter helps to emphasize the cardiac sounds, which predominantly occur in the lower frequency range, while reducing noise from higher frequencies. The spectrogram images were saved with dimensions that matched the input requirements of the models.
Centroid of Amplitude Visualization. The spectral centroid, representing the ”center of mass” of the spectrum, was calculated for each audio file. This metric provides a concise representation of where the majority of the spectral energy is concentrated. A centroid graph was generated, overlaying the normalized waveform and centroid values. This combined visualization provided a robust input for the CNN model. The purpose of this approach was twofold:
-
1.
The waveform contains all the detailed information of the audio signal, capturing every nuance and variation.
-
2.
The spectral centroid highlights the important features of the signal by indicating where the audio information is concentrated (i.e., beats). This simplification helps the CNN model to more easily pick out relevant patterns, enhancing its ability to classify the recordings accurately.
V-D Model Training
ViT. The ViT model was trained using the generated spectrogram images. The training process involved splitting the data into training and validation sets, followed by model training with appropriate hyperparameters such as batch size of 32 and 50 epochs, using an Adam optimizer with a learning rate of 0.001. Data augmentation techniques, such as random noise addition, were applied to improve model robustness.
CNN. The CNN model was trained using the centroid graphs. The CNN model architecture included three convolutional layers followed by max-pooling and dropout layers. The data was split into training and validation sets, and the model was trained with optimized hyperparameters, including a batch size of 32 and 50 epochs, using an Adam optimizer with a learning rate of 0.001. The CNN model also benefited from the data augmentation techniques applied during preprocessing.
V-E Ensemble Method
To leverage the strengths of both the ViT and CNN models, the MoE ensemble method was employed. The ensemble model combined the predictions from both models by assigning different weights, and , to each model’s predictions. Specifically, weight combinations were systematically tested, with ranging from 0 to 1 in increments of 0.05, and .
The ensemble prediction was calculated using the following equation:
| (1) |
VI Results
VI-A Individual Model Performance
In this study, we evaluated the performance of two state-of-the-art models, ViT and CNN, on a dataset of heart sound recordings. The goal was to classify the recordings into five categories: artifact, extrahls, extrastole, murmur, and normal.
ViT. Although the ViT model demonstrated strong performance across most classes, it was outperformed by the CNN in several key areas. This discrepancy is primarily due to the repetitive nature of heart sounds, which consist of recurring local patterns that CNNs are particularly adept at capturing and analyzing. Consequently, CNN’s ability to effectively recognize these local patterns contributed to its superior performance in this context. This, however, doesn’t mean the usage of ViT model is futile, as ViT might have identified characteristics that is not evident through the CNN model.
CNN. The CNN model, on the other hand, achieved higher overall precision and demonstrated more balanced performance across all classes. This proves the point mentioned earlier: CNN on centroids can provide a more robust model in comparison to ViT.
VI-B Ensemble Model Performance
To leverage the strengths of both models, we implemented an ensemble method by combining the predictions of the ViT and CNN models using a Mixture of Experts approach. The ensemble was created using an additive weighted approach, where different weights were tested to find the optimal combination.
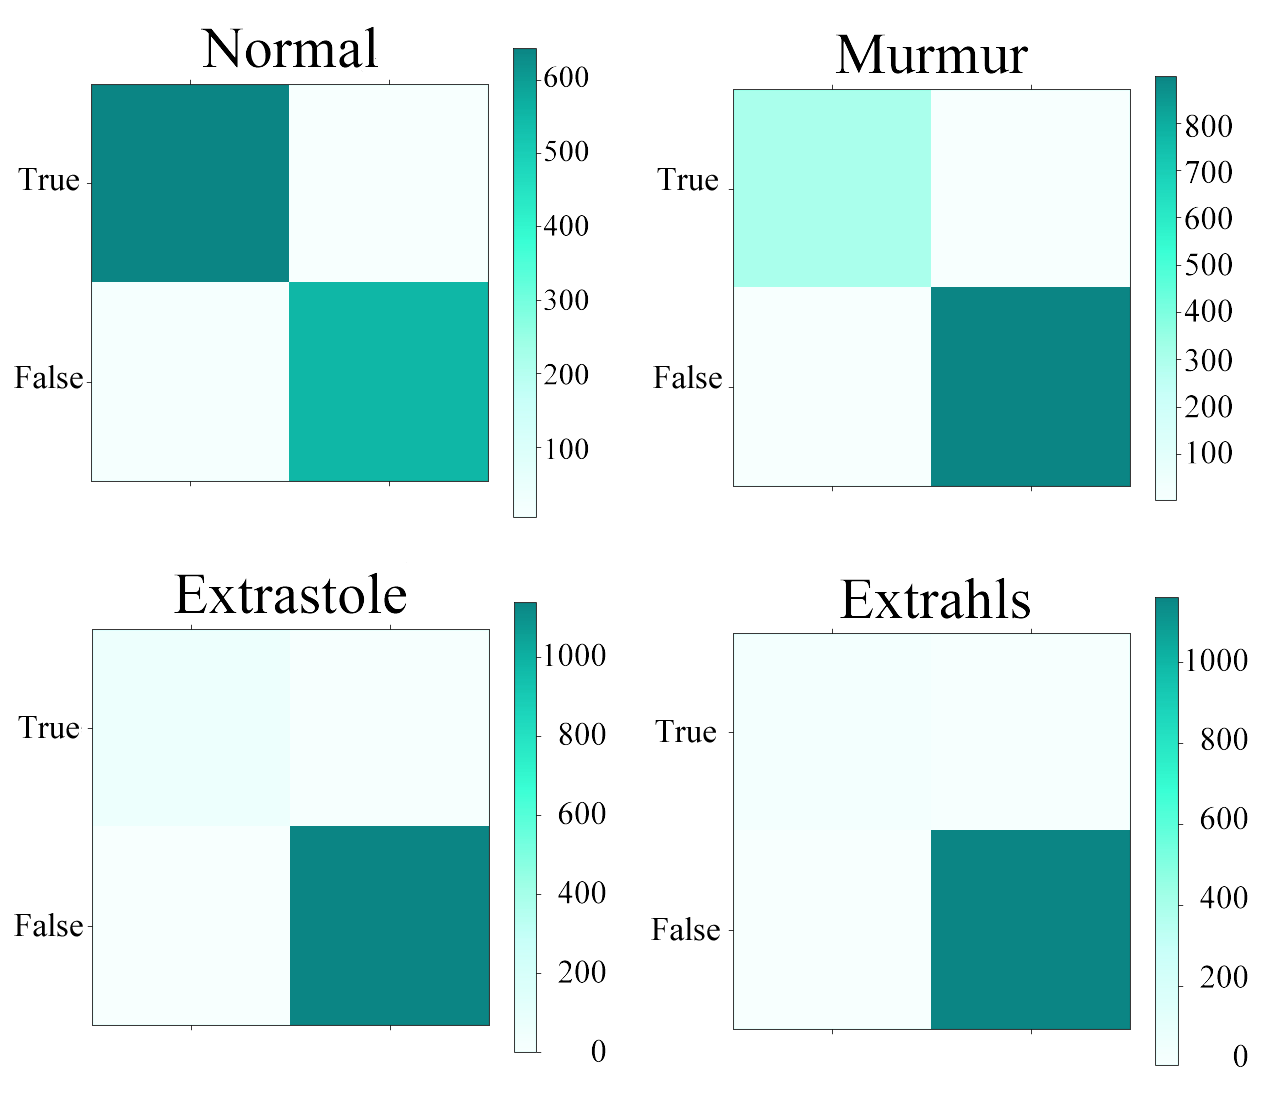
ENACT-Heart achieved the highest accuracy of 97.52%, significantly outperforming both individual models. The improvement in accuracy demonstrates the effectiveness of the ensemble approach, particularly in enhancing the model’s robustness and generalization capabilities. The ensemble method effectively combined the strengths of both ViT and CNN. The effectiveness of the ENACT-Heart compared to the individual ViT and CNN models is illustrated in Table II. Additionally, the performance of the ENACT-Heart , as illustrated by its confusion matrix in Fig. 3, further demonstrates its statistics over different types of diseases.
| Class | ViT | CNN | ENACT-Heart | ||||||
|---|---|---|---|---|---|---|---|---|---|
| Precision | Recall | F1-Score | Precision | Recall | F1-Score | Precision | Recall | F1-Score | |
| artifact | 0.80 | 0.96 | 0.87 | 0.92 | 0.93 | 0.92 | 0.93 | 0.97 | 0.95 |
| extrahls | 0.73 | 0.65 | 0.69 | 0.86 | 0.67 | 0.76 | 0.89 | 0.74 | 0.81 |
| extrastole | 0.98 | 0.84 | 0.91 | 0.98 | 0.87 | 0.92 | 1.00 | 0.91 | 0.96 |
| murmur | 0.94 | 0.97 | 0.96 | 0.95 | 0.97 | 0.96 | 0.98 | 0.99 | 0.99 |
| normal | 0.99 | 0.95 | 0.97 | 0.97 | 0.98 | 0.98 | 0.98 | 0.99 | 0.99 |
| accuracy | 0.94 | 0.95 | 0.98 | ||||||
| macro avg | 0.89 | 0.88 | 0.88 | 0.94 | 0.89 | 0.91 | 0.96 | 0.92 | 0.94 |
| weighted avg | 0.94 | 0.94 | 0.94 | 0.95 | 0.95 | 0.95 | 0.97 | 0.98 | 0.97 |
VI-C Comparison with State-of-the-Art
The proposed ENACT-Heart demonstrates competitive performance when compared to other state-of-the-art models in heart sound classification. Utilizing a MoE ensemble approach that integrates ViT and CNN, the ENACT-Heart achieves an impressive accuracy of 97.52%. This surpasses the accuracy of individual ViT (93.88%) and CNN (95.45%) models. Additionally, the ENACT-Heart maintains high precision (0.98), recall (0.97), and F1-score (0.98), indicating a balanced performance across various metrics.
In comparison, other notable studies in the field exhibit slightly different accuracies. For instance, the work by Liu et al. [7] utilizing bispectrum features and ViT reported an accuracy of 91%, while Yang et al. [13] achieved an accuracy of 98.74% using a combination of Transformer and CNN models. Similarly, Wang et al. [14] presented the PCTMF-Net model, which recorded an accuracy of 99.36% on the Yansen dataset but only 93% on the PhysioNet Challenge dataset, highlighting variability across different datasets. Furthermore, Jumphoo et al. [6] reported an accuracy of 99.44% with Conv-DeiT, and their precision, recall, and F1-score metrics are comparable to those of the ENACT-Heart.
As summarized in Table III, while some studies report higher accuracies, the balanced performance of ENACT-Heart across multiple metrics underscores its reliability and robustness in heart sound classification tasks. The high accuracy and comprehensive performance metrics indicate the potential of the MoE ensemble method in enhancing diagnostic accuracy and reliability in cardiovascular health monitoring.
| Study | Authors | Model(s) Used | Metrics |
|---|---|---|---|
|
ENACT-Heart
(Proposed Model) |
J. Han,
A. Shaout |
MoE
(Ensemble of ViT & CNN) |
Accuracy: 0.9752
(PASCAL DB) Precision: 0.98 Recall: 0.97 F1-Score : 0.98 |
| Heart sound classification based on bispectrum features and Vision Transformer model (Nov. 2023) [7] |
Z. Liu, H. Jiang,
F. Zhang, W. Ouyang, X. Li |
ViT, CNN |
Accuracy: 0.91
AUC: 0.98 |
|
Assisting Heart Valve Diseases Diagnosis via Transformer-Based Classification
(May. 2023) [13] |
D. Yang, Y. Lin,
J. Wei, X. Lin, X. Zhao, Y. Yao |
Transformer, CNN |
Accuracy: 0.9874
AUC: 0.99 |
|
PCTMF-Net: heart sound classification with parallel CNNs-transformer and spectral analysis
(Jul. 2023) [14] |
R. Wang,
Y. Duan, Y. Li, D. Zheng, X. Liu, C.T. Lam |
CNN, Transformer |
Accuracy: 0.9936
(Yansen Dataset) 0.93 (PhysioNet Challenge) |
|
Exploring Data-Efficient Image Transformer-based Transfer Learning
(Jan. 2024) [6] |
T. Jumphoo,
K. Phapatanaburi, W. Pathonsuwan |
Conv-DeiT |
Accuracy: 0.9944
Precision: 0.9852 Recall: 0.9854 F1-Score: 0.9851 |
| Heart Sound Classification Network Based on Convolution and Transformer (Aug. 2023) [15] |
J. Cheng,
K. Sun |
CNN, Transformer |
Accuracy: 0.964
0.997 0.957 (3 distinct dataset) |
|
Multi-classification neural network model for detection of abnormal heartbeat audio signals
(Jul. 2022) [1] |
H. Malik,
U. Bashir, A. Ahmad |
RNN
LSTM |
Accuracy: 0.99771 (PASCAL DB)
0.9870 (PhysioNet Challenge) |
VII Conclusion and Discussion
In conclusion, the combination of ViT and CNN models using an ensemble method improved the classification performance in every aspect in general. This study highlights the importance of evaluating individual models to identify their strengths and the potential benefits of using ensemble methods to achieve superior results.
The data augmentation techniques employed also played a key role in enhancing model robustness and performance. These findings can inform future research and development of advanced classification systems in the medical field.
The proposed ENACT-Heart model demonstrates significant promise in the field of heart sound classification, particularly when considered alongside the advancements in smart wearable devices. With the proliferation of wearable technology, the collection and analysis of audio data have become more accessible and widespread. This is especially pertinent in the medical field, where heart sound data can be continuously monitored and analyzed in real-time, offering invaluable insights into a patient’s cardiovascular health.
Moreover, from a practical point of view, the advancement of smart wearable devices presents a significant opportunity for improving healthcare accessibility, especially in low-resource settings. In many developing countries, access to advanced medical diagnostics is limited due to the lack of infrastructure and trained healthcare professionals. Wearable devices equipped with advanced models like ENACT-Heart can bridge this gap by enabling non-invasive, continuous monitoring of heart health, thus providing timely and accurate diagnostics without the need for expensive and bulky equipment.
This technology can revolutionize the practice of medicine in poorer regions, making high-quality healthcare more approachable and affordable. The ability to monitor and analyze heart sounds continuously can lead to early detection of cardiovascular issues, prompt intervention, and ultimately, better health outcomes. As wearable devices become more affordable and their usage more prevalent, the integration of sophisticated models like ENACT-Heart can play a crucial role in democratizing access to advanced medical diagnostics globally.
In summary, the synergy between the ENACT-Heart model and smart wearable technology holds great potential for enhancing healthcare delivery, particularly in underserved regions. By providing a reliable and efficient means of heart sound classification, this approach not only advances the field of medical diagnostics but also contributes to the broader goal of equitable healthcare access.
References
- [1] H. Malik, U. Bashir, and A. Ahmad, “Multi-classification neural network model for detection of abnormal heartbeat audio signals,” Biomedical Engineering Advances, vol. 4, p. 100048, Dec. 2022. [Online]. Available: https://www.sciencedirect.com/science/article/pii/S266709922200024X
- [2] J. McMichael, “History of atrial fibrillation 1628-1819 Harvey - de Senac - Laënnec,” Br Heart J, vol. 48, no. 3, pp. 193–197, Sep. 1982.
- [3] R. T. H. Laennec, A Treatise on the Diseases of the Chest and on Mediate Auscultation.
- [4] M. N. Esbin, O. N. Whitney, S. Chong, A. Maurer, X. Darzacq, and R. Tjian, “Overcoming the bottleneck to widespread testing: a rapid review of nucleic acid testing approaches for COVID-19 detection,” RNA, vol. 26, no. 7, pp. 771–783, Jul. 2020, company: Cold Spring Harbor Laboratory Press Distributor: Cold Spring Harbor Laboratory Press Institution: Cold Spring Harbor Laboratory Press Label: Cold Spring Harbor Laboratory Press Publisher: Cold Spring Harbor Lab. [Online]. Available: http://rnajournal.cshlp.org/content/26/7/771
- [5] S.-C. Huang, A. Pareek, S. Seyyedi, I. Banerjee, and M. P. Lungren, “Fusion of medical imaging and electronic health records using deep learning: a systematic review and implementation guidelines,” npj Digit. Med., vol. 3, no. 1, pp. 1–9, Oct. 2020, publisher: Nature Publishing Group. [Online]. Available: https://www.nature.com/articles/s41746-020-00341-z
- [6] T. Jumphoo, K. Phapatanaburi, W. Pathonsuwan, P. Anchuen, M. Uthansakul, and P. Uthansakul, “Exploiting Data-Efficient Image Transformer-Based Transfer Learning for Valvular Heart Diseases Detection,” IEEE Access, vol. 12, pp. 15 845–15 855, 2024, conference Name: IEEE Access. [Online]. Available: https://ieeexplore.ieee.org/abstract/document/10413456
- [7] Z. Liu, H. Jiang, F. Zhang, W. Ouyang, X. Li, and X. Pan, “Heart sound classification based on bispectrum features and Vision Transformer mode,” Alexandria Engineering Journal, vol. 85, pp. 49–59, Dec. 2023. [Online]. Available: https://www.sciencedirect.com/science/article/pii/S1110016823010128
- [8] W.-H. Hsu, B.-Y. Chen, and Y.-H. Yang, “Deep Learning Based EDM Subgenre Classification using Mel-Spectrogram and Tempogram Features,” Oct. 2021, arXiv:2110.08862 [cs, eess]. [Online]. Available: http://arxiv.org/abs/2110.08862
- [9] P. Verma and J. O. Smith, “Neural Style Transfer for Audio Spectograms,” Jan. 2018, arXiv:1801.01589 [cs, eess]. [Online]. Available: http://arxiv.org/abs/1801.01589
- [10] A. A. Cabrera-Ponce, J. Martinez-Carranza, and C. Rascon, “Detection of nearby UAVs using a multi-microphone array on board a UAV,” International Journal of Micro Air Vehicles, vol. 12, p. 175682932092574, Jan. 2020. [Online]. Available: http://journals.sagepub.com/doi/10.1177/1756829320925748
- [11] R. Hyder, S. Ghaffarzadegan, Z. Feng, J. Hansen, and T. Hasan, “Acoustic Scene Classification Using a CNN-SuperVector System Trained with Auditory and Spectrogram Image Features,” Aug. 2017, pp. 3073–3077.
- [12] P. Bentley, G. Nordehn, M. Coimbra, and S. Mannor, “The PASCAL Classifying Heart Sounds Challenge 2011 (CHSC2011) Results.” [Online]. Available: http://www.peterjbentley.com/heartchallenge/index.html
- [13] D. Yang, Y. Lin, J. Wei, X. Lin, X. Zhao, Y. Yao, T. Tao, B. Liang, and S.-G. Lu, “Assisting Heart Valve Diseases Diagnosis via Transformer-Based Classification of Heart Sound Signals,” Electronics, vol. 12, no. 10, p. 2221, May 2023. [Online]. Available: https://www.mdpi.com/2079-9292/12/10/2221
- [14] R. Wang, Y. Duan, Y. Li, D. Zheng, X. Liu, C. T. Lam, and T. Tan, “PCTMF-Net: heart sound classification with parallel CNNs-transformer and second-order spectral analysis,” Vis Comput, vol. 39, no. 8, pp. 3811–3822, Aug. 2023. [Online]. Available: https://doi.org/10.1007/s00371-023-03031-5
- [15] J. Cheng and K. Sun, “Heart Sound Classification Network Based on Convolution and Transformer,” Sensors, vol. 23, no. 19, p. 8168, Sep. 2023. [Online]. Available: https://www.mdpi.com/1424-8220/23/19/8168