math \addtocategorymathabreu2004beija,arroyo1982community,baird1980selection,barrett1987reproductive,bartomeus2008contrasting,beehler1983frugivory,bek2006pollination,bezerra2009pollination,bluthgen2004bottom, clements1923experimental, dicks2002compartmentalization, dupont2003structure, elberling1999structure, olesen2002invasion, ollerton2003pollination, hocking1968insect, petanidou1991pollination, herrera1988pollination, memmott1999structure, inouye1988pollination, kevan1970high, kato1990insect, medan2002plant, mosquin1967observations, motten1982pollination, primack1983insect, ramirez1992pollination, ramirez1989biologia, schemske1978flowering, small1976insect, smith2005diversity, percival1974floral, ingversen2006plant, philipp2006structure, montero2005ecology, kato2000anthophilous, lundgren2005dense, bundgaard2003tidslig, dupont2009ecological, stald2003struktur, vazquez2002interactions, yamazaki2003flowering, kakutani1990insect, kato1996flowering, kato1993flowering, inoue1990insect, kaiser2010robustness, kaiser2014determinants, robertson1929flowers, vizentin2016influences, del1990hummingbirds, canela2006interaccoes, las2012community, gutierrez2004dinamica, kohler2011redes, lara2006temporal, lasprilla2004interacciones, sabatino2010direct, oppenheimer2021plant, walther2001hummingbird, snow1972feeding, graham2018towards, cotton1998coevolution, buzato2000hummingbird, gonzalez2016species, partida2018pollination, dalsgaard2021influence, rodrigues2014flowers, maruyama2015nectar, carlo2003avian, crome1975ecology, frost1980fruit, snow1971feeding, snow2010birds, galetti2013fruit, hamann1999interactions, jordano1985ciclo, kantak1979observations, lambert1989fig, tutin1997primate, mack1996notes, wheelwright1984tropical, jordano2003invariant, silva2002patterns, guitian1983relaciones, sorensen1981interactions, jordano1993geographical, heleno2013integration, poulin1999interspecific, schleuning2011specialization, davidson1989competition, davidson1991symbiosis, fonseca1996asymmetries, emer2013effects, hadfield2014tale
The Robustness of Structural Features in Species Interaction Networks
Abstract
Species interaction networks are a powerful tool for describing ecological communities; they typically contain nodes representing species, and edges representing interactions between those species. For the purposes of drawing abstract inferences about groups of similar networks, ecologists often use graph topology metrics to summarize structural features. However, gathering the data that underlies these networks is challenging, which can lead to some interactions being missed. Thus, it is important to understand how much different structural metrics are affected by missing data. To address this question, we analyzed a database of 148 real-world bipartite networks representing four different types of species interactions (pollination, host-parasite, plant-ant, and seed-dispersal). For each network, we measured six different topological properties: number of connected components, variance in node betweenness, variance in node PageRank, largest Eigenvalue, the number of non-zero Eigenvalues, and community detection as determined by four different algorithms. We then tested how these properties change as additional edges – representing data that may have been missed – are added to the networks. We found substantial variation in how robust different properties were to the missing data. For example, the Clauset-Newman-Moore and Louvain community detection algorithms showed much more gradual change as edges were added than the label propagation and Girvan-Newman algorithms did, suggesting that the former are more robust. Robustness also varied for some metrics based on interaction type. These results provide a foundation for selecting network properties to use when analyzing messy ecological network data.
1 Introduction
Graphs are a powerful tool for representing species interactions in community ecology. Species are represented as nodes, while their interactions are represented as edges between nodes. This abstraction is powerful, because it allows graph theory to be harnessed for the purposes of understanding the structure of ecological communities [8, 101, 35]. In particular, it is often helpful to calculate graph topology metrics as a way of quantifying the structure of the graph. These quantifications facilitate answering questions such as 1) what structural patterns a given type of ecological process tends to produce in a species interaction network?, and 2) what ecological processes are predicted by different structural patterns?.
A major obstacle to these approaches, however, is the measurement error inherent in observing real-world species interaction networks [26]. It is effectively impossible to exhaustively sample most real-world species interaction networks; some edges are bound to be missed. Too much missing data can render any network topology metric inaccurate. Moreover, systematic bias can be introduced via choice of sampling strategy and techniques for network construction. Likely as a consequence, there is tremendous heterogeneity in the topology of ecological networks [19].
Confronting this problem requires a diversity of approaches. Sampling sufficiency analysis can be conducted to determine how much data is required to get an acceptably high confidence estimate of a given graph topology metric [25]. Machine-learning based link-prediction techniques [78, 43] can be used to infer missing edges in graphs [121]. Sensitivity analysis can be conducted to infer the severity of the consequences of error in topological metric inference [4]. Lastly, new graph metics can be developed that are more robust to common sources of noise in species interaction networks (e.g. network size) [15].
This last option suggests another possible approach: identify existing graph metrics that are less impacted by missing data than others. Prior research in computer science has shown that some graph topology metrics are more robust than others in this respect [128]. Similarly, the aforementioned work on sampling sufficiency revealed that some topological properties require more data to accurately measure than others [25]. Thus, we propose that there may be substantial variation in robustness to missing data among graph topology metrics commonly used in ecology, and that it may be possible to exploit this variation to draw more robust conclusions from noisy datasets. Here, we set out to 1) quantify this robustness across a variety of graph topology metrics and 2) propose a technique that others can use to analyze the robustness of their own interaction network topology analysis.
Importantly, how robust a given feature is to missing data will depend on the structure of a network. As an extreme example, imagine that we observe a linear chain network. If we were missing some edges from our sample, we might measure a wildly different distribution of node centrality metrics than we would have on the ground truth network. If, instead, we observe a network with fairly evenly distributed edges, it is less likely that any missing edges will dramatically change the value of centrality metrics. Thus, analysis on the robustness of different graph metrics must be carried out in the context of the network topologies in which we are most interested.
Here, we perform this analysis for bipartite species interaction networks. The rest of this paper is organized as follows: section discusses different network properties we evaluated: centrality measures, eigenvalue-related concepts, and community detection algorithms. Section describes our methods for analyzing the robustness of these measures. Section brings the results. Section elaborates on the findings and the last section concludes the paper by future work ideas.
2 Network Features
A wide variety of topological features/properties/metrics are used to quantify species interaction network structure. We ultimately chose to analyze the following set: node centrality (as measured by betweenness and PageRank), community detection (as measured by the Clauset-Newman-Moore, Louvain, Girvan-Newman, and Label Propagation algorithms), number of non-zero eigenvalues, number of components, and the largest eigenvalue. Note that we also considered a number of other metrics and chose not to focus on them. Most importantly, Connectance and Linkage Density are both ecologically meaningful properties. However, because they are directly proportional to the number of edges, their robustness to missing edges is entirely predictable from simple math. Another interesting metric, Clustering Coefficient, is only useful on non-bipartite networks. It would be worthwhile to include in follow-up research on food web properties.
2.1 Centrality Measures
Centrality indices rank entities according to their position and importance in the network [16, 80, 108, 22, 52]. Importance can be defined for nodes, links, groups of nodes, and sub-graphs of the network. Here, we focus on node centrality measures. Specifically, we analyze betweenness centrality and PageRank centrality, as these are particularly common approaches. We define these metrics below. It should be mentioned that in this paper, we discuss properties in the case of a simple graph unless otherwise stated.
2.1.1 Betweenness Centrality
In graph theory, the shortest path is defined between a pair of nodes and consists of the smallest number of links that it takes to go from one node to another. The shortest path has applications in ecology, such as predicting how much loss of one species from a community will affect another. Betweenness centrality is a centrality measure defined on the basis of the shortest path. Consider nodes and in graph . The shortest path between and is the smallest number of links we can trace to go from to and vice versa. Betweenness centrality of node is the number of all pairs of nodes’ shortest paths that go through node . Equation 1 shows the betweenness formula.
| (1) |
2.1.2 PageRank Centrality
Defined simply, the PageRank algorithm [11] determines the importance of a node by counting the number of links to that node. A key underlying assumption is that the more important nodes have more connections. We will provide a quick overview of this algorithm, but note that its details depend heavily on probability theory. We recommend that unfamiliar readers see [39, 106] for an overview.
Given a node of degree (i.e. neighboring nodes), the PageRank algorithm seeks to find the probability of visiting each of these neighbors, given that we are currently at node . More formally, given a node, the output of the PageRank algorithm is a probability distribution representing the likelihood of visiting one of its neighbors randomly. In the first step of the PageRank algorithm, all nodes in the graph get the same probability summing up to .
After visiting a node as the first node (initialization step of the algorithm), in the second step, we can calculate the PageRank of any node , by Equation 2.
| (2) |
In Equation 2, is the set of all connected nodes to node , and is the number of links having node as one of their endpoints.
In the PageRank algorithm, we can set a limit for iterations to control the approximation level and time efficiency.
Here, we use an example to explain how the PageRank algorithm works. Figure 1 represents a graph with nodes. Figure 1 (left) represents the initialization step where all nodes, , get the same PageRank, summing up to . In this example, there are nodes, so the initial PageRank value for each node is .
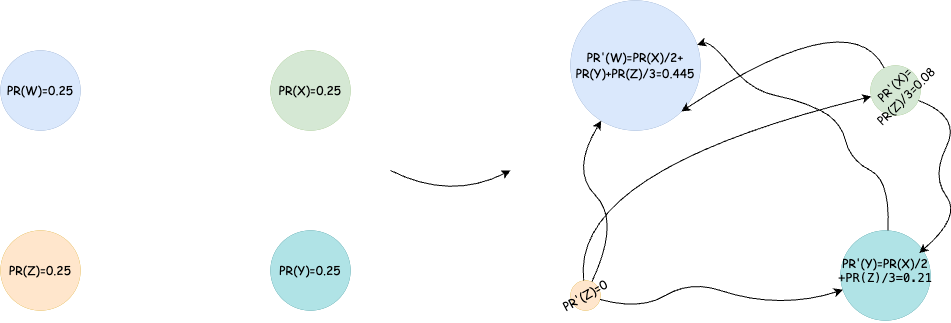
Figure 1 (right) represents that node has links to and ; has a link to ; and has links to , and . The initial PageRank value for all nodes is . In the next iteration, node ’s PageRank gets divided between and equally (each one gets ). Node ’s PageRank gets transferred to (). Node ’s PageRank gets divided between , and . As mentioned in Equation 2, the amount of PageRank value that some node transfers to some node , where has a link to , is equal to ’s PageRank divided by the number of nodes that has links to them. The final PageRank values are given in Figure 1 (right).
2.2 Community Detection
Real-world networks, including biological networks [50, 2], ecological networks [61, 8], and social networks [18, 42], often have community structure [93]. Communities are groups of nodes that are more densely connected to each other than to the rest of the network [46]. Detecting these communities [46, 47] is one of the most important problems in the study of networks due to their ubiquity, the information they provide about processes that shape a network, and their implications for how future processes will play out on the network. For example, in an ecological context, community detection can reveal groups of species that interact primarily with each other, facilitating abstraction; analysis can then focus on these sub-communities or treat them as higher-level units where appropriate for improved computational tractability. Due to the importance of community detection, a variety of algorithms exist to solve this problem. These algorithms focus on different objectives. For example, some perform better on large networks, others emphasize efficiency over accuracy, and yet others prioritize consistently returning the same result for the same network.
In this research, we used four different community detection algorithms. The first two, Clauset-Newman-Moore Community Detection and Louvain Community Detection, are greedy algorithms that detect communities through modularity maximization. The other two algorithms are Girvan-Newman Community Detection and Label Propagation Community Detection. The Girvan-Newman algorithm is a centrality-based approach and Label Propagation, as implied by its name, finds communities by propagating labels. More detailed summaries of these community detection algorithms can be found in the following sections. All these algorithms solve the problem of assigning nodes to communities.
2.2.1 Clauset-Newman-Moore Community Detection
Clauset-Newman-Moore community detection algorithm seeks to maximize the modularity of assigned communities. Modularity is a measure of the quality of a division of a network into communities; community assignments that produce a structure with more links within each community and fewer links between communities have higher modularity. To quantify this property, we will need to perform a few calculations. First, consider as the adjacency matrix of graph . is an element of matrix which is if there is a link between and , and otherwise. Also, indicates that node belongs to community . When considering communities in a graph, there are two types of edges: edges that connect two nodes from the same community, and edges that connect two nodes from two different communities. Equation 3 reproduced from [27], counts the number of edges in the first category.
| (3) |
where
| (4) |
The number of all links in the graph can be calculated using Equation 5:
| (5) |
Using Equations 4 and 5 we compute the fraction of all edges that fall into communities as in Equation 6.
| (6) |
This value can be large when there are many within-community links; but due to the most extreme case, when all nodes and links belong to one community, this value alone cannot be deterministic of the quality of communities. To address this issue, [27] proposed calculating the difference between the value of Equation 6 for a particular network and the expected value of Equation 6 for a random graph.
If connections in a graph are made randomly, the probability of a link existing between and , of degrees and , is equal to . Having the above definitions and formulas, [27] defined the modularity measure by Equation 7
| (7) |
Having the concept and mathematical definition of modularity, we can explain how greedy community detection algorithms mentioned earlier work. The first greedy algorithm we study uses the Clauset-Newman-Moore greedy [27] modularity maximization approach to find the community structure that results in the largest modularity. This algorithm starts by considering each node as one community. In the second step, the algorithm repeatedly merges pairs of communities where this operation results in higher modularity. The algorithm repeats this step until there is no further increase in the modularity.
2.2.2 Louvain Community Detection
We can categorize the Louvain community detection algorithm [13] as a greedy, modularity-based community detection algorithm. It is a heuristic algorithm that tries to find the best partitions of the graph by heuristically optimizing modularity. Similar to the greedy community detection algorithm, the Louvain algorithm starts by assigning each node to be in its own community. Then, the algorithm iterates over the existing communities. For each community, the algorithm tests the effect of joining that community with each of its neighboring communities on modularity. If none of these options increases the overall modularity score, the community is left as it is. Otherwise, it gets joined with the neighboring community which increases the modularity score the most. This process continues until there is no individual move left that can increase the modularity.
In the second step, a new graph is built. The nodes of this graph are the communities we found in the first step. The process of building a new graph (steps and ) continues until no further increase in modularity is possible.
2.2.3 Girvan-Newman Community Detection
Girvan-Newman [50] is another community detection algorithm. This algorithm is fundamentally different from greedy community detection algorithms. Greedy community detection algorithms function based on modularity maximization while the Girvan-Newman algorithm is a centrality-based algorithm. At each step, the edge with the highest betweenness centrality is removed, partitioning the community into two sub-communities. This process is repeated until modularity stops increasing.
2.2.4 Label Propagation Community Detection
Label propagation is a semi-supervised machine-learning algorithm for clustering. In the case of community detection, this algorithm assigns labels to nodes.
Similarly to the formerly mentioned algorithms, label propagation starts by labeling each node as its own community. In the next step, the label of each node is updated to be the label most common among its immediate neighbors. The label propagation algorithm has the advantage of being fast. One drawback of this algorithm is that it is not guaranteed to always produce the same solution.
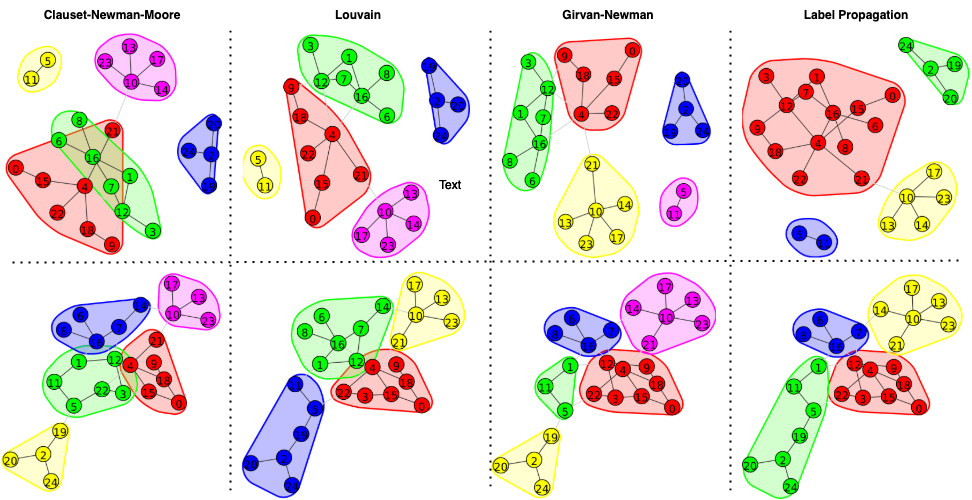
Figure 2 represents the output of each community detection algorithm on the same graph.
2.3 Eigenvalues
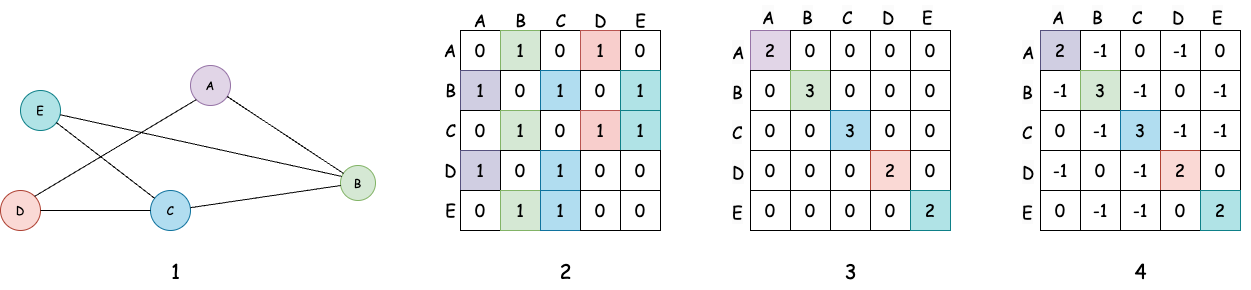
Eigenvalues are a powerful tool for analyzing graphs that provide information based on solid mathematical proof. In order to explain eigenvalue-based analysis, we must first introduce the concepts of adjacency matrices, degree matrices, and graph Laplacians. Adjacency matrices are a common way to represent graphs in computers. The adjacency matrix is a matrix with a row and column for each node in the graph. In the case of a simple graph, the adjacency matrix is symmetric. Consider a graph , where is the set of nodes and is the set of links of the network (see Figure 3 (1)). Matrix (see Figure 3 (2)) is the adjacency matrix of graph . The entry at row and column where is (or the edges’ weight if the graph is weighted) if there is a link between and , and otherwise it is .
The degree matrix, (see Figure 3 (3)), has the same dimension as the adjacency matrix. All the entries of are except for the diagonal ones. In the degree matrix the entry where is equal to ’s degree.
We represent the Laplacian of the graph as , shown in Figure 3 (4). The Laplacian of is the difference between the degree matrix and the adjacency matrix [89]. This matrix is the one that we will actually calculate its eigenvalues for the purposes of graph analysis. In particular, the Laplacian can be used to study the behavior of the network when links get added or deleted or nodes get merged [89].
In this research, we studied the number of ’s non-zero eigenvalues, the largest eigenvalue, and the number of zero eigenvalues, which indicates the number of connected components of the graph.
3 Experiments
We seek to quantify the response of network properties to varied levels of missing data. To do so, we first identified a set of ecological interaction networks measured in the real world. We then simulated potential ground truth networks that these measured networks could potentially have been sampled from.
To reduce the effect of randomness on results, we analyzed 148 networks from the Web of Life project [45]. These networks are gathered from the literature. Table 1 represents the statistics of the networks analyzed here (see Appendix LABEL:A for the related resources).
| DATABASE STATISTICS | |
|---|---|
| # Networks | 148 |
| # Species | 6 - 1,500 |
| # Interactions | 6 - 15,255 |
| Connectance | 0.017 - 0.688 |
| Type of Interactions | Pollination, Host-Parasite, Plant-Ant, Seed-Dispersal |
It is possible that different types of interaction network may behave differently from each other in a systematic way. To determine whether this is happening, we selected four types of interaction network from the Web of Life database to analyze: pollination, plant-ant, host-parasite, and seed-dispersal.
We selected these types because they represented substantial diversity in ecological interactions while 1) being bipartite, 2) being large enough for our analysis to be possible, and 3) having enough networks to potentially be able to make useful generalizations. All graphs were bipartite, meaning that each had partitions of nodes, where nodes in one partition have no interactions and every interaction occurs between two nodes from different partitions (e.g. pollinators only interact with plants, not with other pollinators). Because most graphs in the dataset were unweighted, we did not consider edge weight in our analysis.
Any time a species interaction network is measured in nature, there is a chance of failing to detect an interaction that is present. Consequently, missing edges may or may not indicate a true of lack of interaction. Thus, we can assume that any observed network contains a set of real interactions. However, it also is missing some edges relative to the theoretical “ground truth” network, which we define as the true set of all interactions between species in the network. While we can never know what the ground truth network looked like, we can simulate possible sets of additional edges that it may contain relative to the observed graph. Graph properties that are more robust to missing interactions will be more similar between these simulated ground truth networks and observed graphs. To test whether features are robust, then, we can randomly generate graphs that the observed networks could have been sampled from and compare the values of graph properties between them.
We generated simulated ground truth graphs based on the observed graphs in the Web of Life datasets using the following process. Consider a graph G, with a set of vertices , and a set of edges E, where . We generate candidate ground truth graphs , with the same set of vertices as () and a set of edges equal to plus randomly generated added edges. The maximum number of missing edges we consider is , meaning that in the most extreme case, g’ has edges. For each observed graph and number of added edges, we generate 10 candidate graphs representing possible ground truths. We then conduct our analyses over this collection of graphs.
4 Results
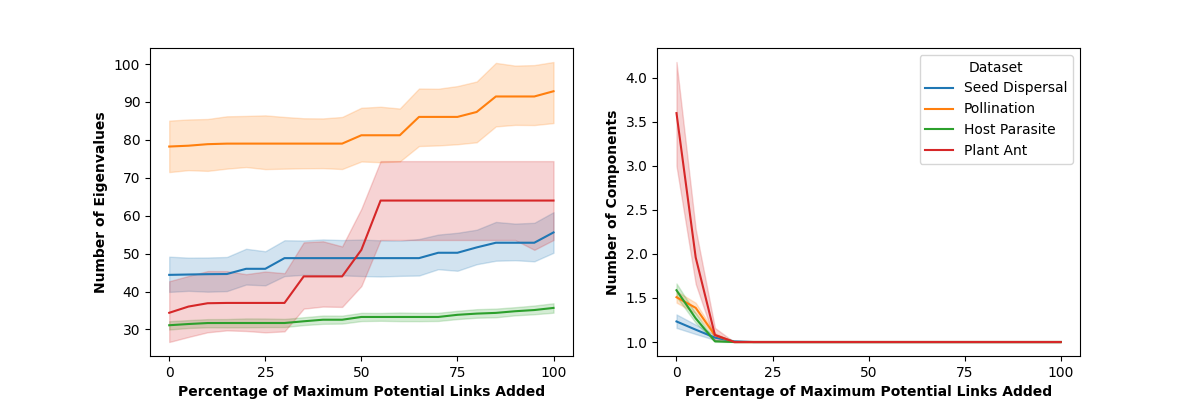
Figure 4 (left) shows the results for the number of non-zero eigenvalues. Generally, dense graphs have more non-zero eigenvalues than sparse ones with the same number of nodes. Thus, we would expect the number of non-zero eigenvalues to increase as we add edges. Indeed, as shown in Figure 4 (left), this value is strictly increasing from left to right. Figure 4 (right) represents the number of components in terms of the number of zero eigenvalues; we can see in Figure 4 (right) by moving toward the right side of the plot and having more links in the graphs, the number of components decreases.
The central question, then, is what the pattern of increase in the number of non-zero eigenvalues as we add edges looks like. In general, the number of non-zero eigenvalues is a fairly robust measure across all four types of networks that we examined (see Figure 4 (left)). In particular, for host-parasite and seed-dispersal networks, adding edges only slightly increases the value of this metric. This metric is also robust for pollination and plant-ant networks up to a point; when we add fewer than a quarter of the possible missing edges, the number of non-zero eigenvalues stays very consistent. Past that point, however, it does change more dramatically, particularly for plant-ant networks.
Figure 4 (right) shows the results for the number of connected components in the graph. Adding edges to a graph can only decrease the number of connected components, and the minimum number of connected components in a graph is one. These constraints are born out in the data. For all datasets, the number of components converges to one after adding even a few edges. This discrepancy is particularly large for the plant-ant dataset, as the observed networks in it had a relatively large number of connected components on average. For other network types, converging to a single connected component represents a smaller change. Thus, for plant-ant networks, there is a high risk that missing data could dramatically change the value of this metric.
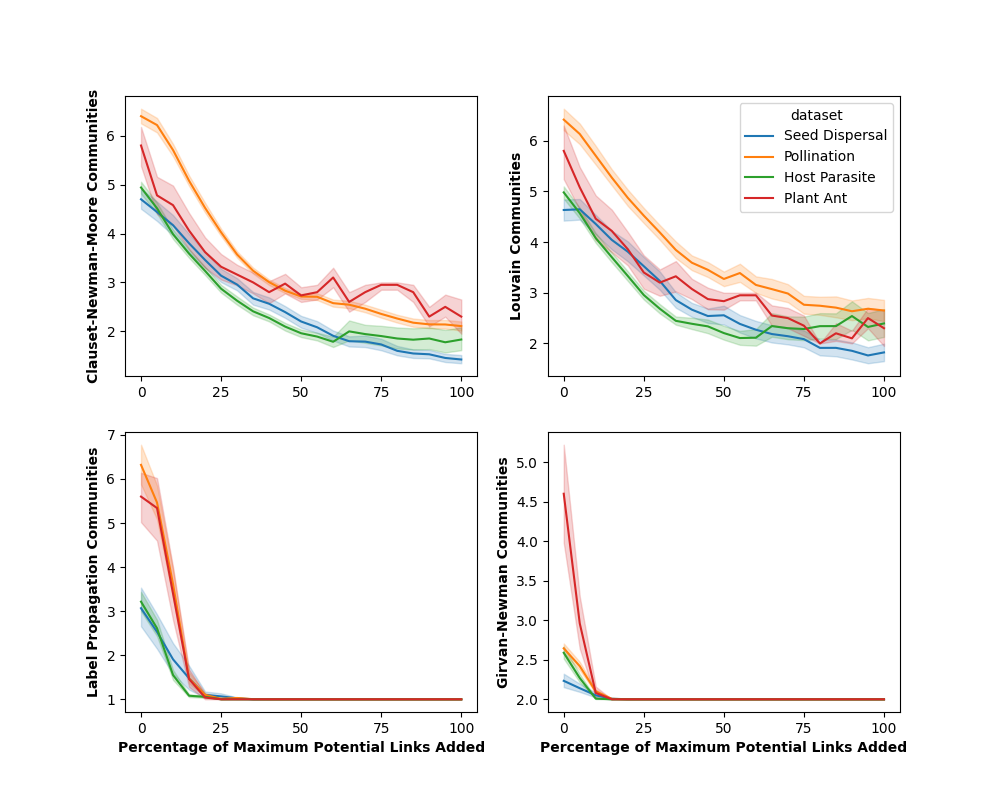
The number of communities detected by community detection algorithms is, in general, a less robust metric than the number of non-zero eigenvalues. Among community detection algorithms however, the Clauset-Newman-Moore and Louvain algorithms produce a relatively robust measure of the number of communities (see Figure 5 (top-right) and (top-left)). As expected, across all community detection algorithms, adding links usually resulted in a smaller number of communities detected. In the Label Propagation algorithm, this drop occurs rapidly, even at a small number of added edges (see Figure 5 (bottom-left)). Indeed, with only a few additional edges, the Label Propagation count of communities drops all the way to one. In contrast, the Clauset-Newman-Moore and Louvain community counts drop more gradually as edges are added. For the most part, there is not a dramatic qualitative difference across network types.
The Girvan-Newman community detection algorithm is somewhat hard to classify in terms of robustness (see Figure 5 (bottom-right)). In general, it detects fewer communities in the observed graphs than the other algorithms. Moreover, adding even a small number of edges consistently causes the number of detected communities to drop to two. In some sense, this behavior could be considered robust (for network types other than Plant-Ant), because there is relatively little change as edges are added. However, the discrepancy in the results of the other algorithms is concerning.
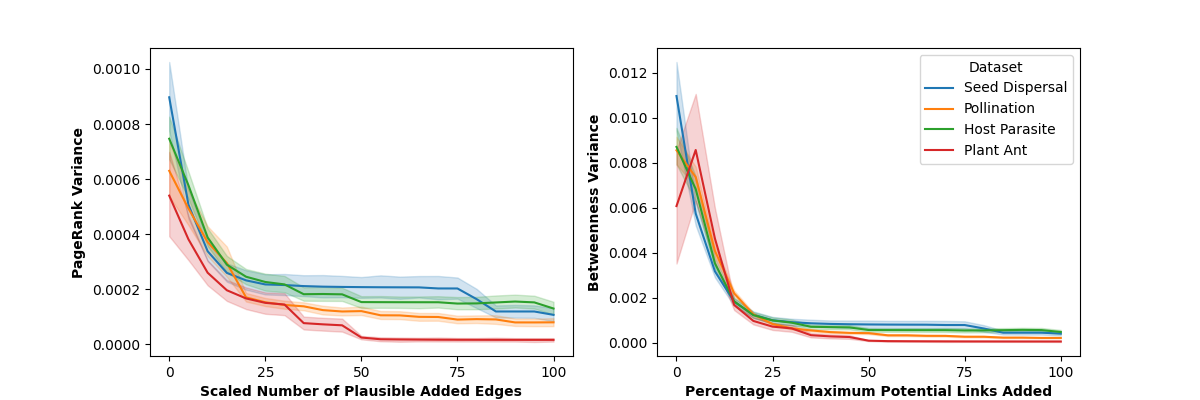
Figure 6 shows the results from two centrality measures: betweenness and PageRank variance. Once a relatively small number of edges have been added, these measures show similar behavior and the only difference is for the plant-ant network. Once we’ve added a quarter or more of the possible missing edges, values of both betweenness and PageRank variance fall to a consistent low level. This behavior makes sense, as adding edges will generally reduce the variance in centrality.
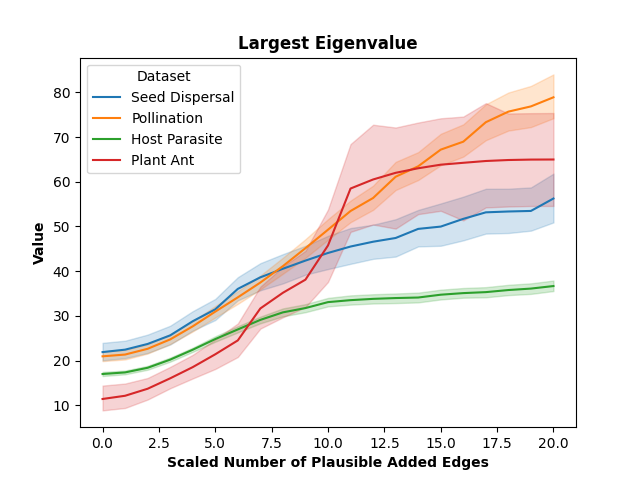
The largest eigenvalue, as shown in Figure 7 consistently changes linearly until we have added half of the possible missing edges. From there, for most network types, it levels off and stays fairly constant. The one exception is pollination networks, which keep changing mostly linearly.
5 Discussion
The results presented here are a tool for researchers to use in selecting network features to measure. The properties we analyzed exhibited a diversity of patterns of response to added edges. Some of these patterns showed consistent gradual change, indicating that the amount of inaccuracy in the metric would likely be proportional to the amount of edges incorrectly missing from the graph. Other metrics exhibited immediate dramatic change. Using these metrics in cases where there is a risk of much error in network topology should only be done with great caution, as small errors in underlying data could produce large errors in resulting measurements. Finally, same patterns were in between; using them on networks with a small number of missing edges should not produce serious inaccuracies in the final results, but using them with networks missing more edges could. In general, researchers should consider both the amount of error in their data and the robustness profile of the metrics they are interested in when making experimental design choices.
Among the features we studied, based on the results, the number of non-zero eigenvalues (see Figure 4 (left)) is the most reliable measure in the presence of missing data. Across network types, this value stays fairly constant as we add edges. It is important as we can infer many facts about the network by transforming it into Laplacian space; knowing the network features remain robust in this space can help with a range of analysis.
The robustness of community detection algorithms varied substantially. The Clauset-Newman-Moore and Louvain algorithms both showed fairly gentle and continuous change as edges were added, meaning they are fairly robust to missing data. In contrast, the label propagation and Girvan-Newman showed dramatic change in response to the addition of a relatively small number of edges.
This lack of robustness may be due to the size of the networks, as some community detection algorithms are designed for very large networks and do not perform well on smaller networks.
These results illustrate the fact that there can be substantial variation in robustness to missing data across techniques for measuring the same graph property. Researchers should consider the expected amount of error in their data when selecting an algorithm. In particular, these results suggest favoring the Clauset-Newman-Moore and Louvain algorithms in cases where there is a high risk of failing to detect edges.
6 Conclusion and Future Work
In this study, we have proposed a new approach to strengthening the analysis of species interaction network structure in light of the potential for missing data. We analyzed a range of network features under varied levels of simulated missing data and found substantial variation in their robustness. Some properties changed dramatically when even a small number of edges were added, while others changed more gradually. This effect varied by network type in some cases, supporting our expectation that metric robustness varies based on graph topology. Indeed, while we expect many of our results to generalize across bipartite species interaction networks, we also see our methodology as a key contribution of this work. Given the uncertainty inherent in most observed interaction network data, researchers quantifying network topology could consider performing sensitivity analyses by testing the impact of adding or removing edges.
There are of course some important limitations to this work. This technique will not account for systematic bias in the data collected, although it could be adjusted to do so by simulating potential biases in the edge addition process. Similarly, the assumption that all edges are equally likely is an oversimplification; fortunately, though, it should mostly bias graph metrics towards looking less robust than they really are. This oversimplification could be corrected with more sophisticated link prediction algorithms. Lastly, there are many additional types of network and graph property that this analysis could be extended to. It would be interesting to see how different these results are in non-bipartite networks, such as food webs.
Overall, this work adds another tool to our toolbox for doing robust analysis of species interaction networks, despite the messiness of the underlying data. Given recent concerns about the utility of analyzing the topology of networks in large databases [19], we hope this technique can provide a path forward for conducting large scale network ecology research.
References
- [1] Carlos RM Abreu and Milene F Vieira “Os beija-flores e seus recursos florais em um fragmento florestal de Viçosa, sudeste brasileiro” In Lundiana: International Journal of Biodiversity 5.2, 2004, pp. 129–134
- [2] Eric Alm and Adam P Arkin “Biological networks” In Current opinion in structural biology 13.2 Elsevier, 2003, pp. 193–202
- [3] Mary T Kalin Arroyo, Richard Primack and Juan Armesto “Community studies in pollination ecology in the high temperate Andes of central Chile. I. Pollination mechanisms and altitudinal variation” In American journal of botany 69.1 Wiley Online Library, 1982, pp. 82–97
- [4] Ann C. Babtie, Paul Kirk and Michael P.. Stumpf “Topological sensitivity analysis for systems biology” Publisher: Proceedings of the National Academy of Sciences In Proceedings of the National Academy of Sciences 111.52, 2014, pp. 18507–18512 DOI: 10.1073/pnas.1414026112
- [5] John W Baird “The selection and use of fruit by birds in an eastern forest” In The Wilson Bulletin JSTOR, 1980, pp. 63–73
- [6] Spencer CH Barrett and Kaius Helenurm “The reproductive biology of boreal forest herbs. I. Breeding systems and pollination” In Canadian Journal of Botany 65.10 NRC Research Press Ottawa, Canada, 1987, pp. 2036–2046
- [7] Ignasi Bartomeus, Montserrat Vilà and Luís Santamaría “Contrasting effects of invasive plants in plant–pollinator networks” In Oecologia 155 Springer, 2008, pp. 761–770
- [8] Jordi Bascompte “Structure and dynamics of ecological networks” In Science 329.5993 American Association for the Advancement of Science, 2010, pp. 765–766
- [9] Bruce Beehler “Frugivory and polygamy in birds of paradise” In The Auk 100.1 Oxford University Press, 1983, pp. 1–12
- [10] S Bek “A pollination network from a Danish forest meadow”, 2006
- [11] Pavel Berkhin “A survey on PageRank computing” In Internet mathematics 2.1 Taylor & Francis, 2005, pp. 73–120
- [12] Elisângela LS Bezerra, Isabel C Machado and Marco AR Mello “Pollination networks of oil-flowers: a tiny world within the smallest of all worlds” In Journal of Animal Ecology 78.5 Wiley Online Library, 2009, pp. 1096–1101
- [13] Vincent D Blondel, Jean-Loup Guillaume, Renaud Lambiotte and Etienne Lefebvre “Fast unfolding of communities in large networks” In Journal of statistical mechanics: theory and experiment 2008.10 IOP Publishing, 2008, pp. P10008
- [14] Nico Blüthgen, Nigel E. and Konrad Fiedler “Bottom-up control and co-occurrence in complex communities: honeydew and nectar determine a rainforest ant mosaic” In Oikos 106.2 Wiley Online Library, 2004, pp. 344–358
- [15] Christophe Botella et al. “An appraisal of graph embeddings for comparing trophic network architectures” _eprint: https://onlinelibrary.wiley.com/doi/pdf/10.1111/2041-210X.13738 In Methods in Ecology and Evolution 13.1, 2022, pp. 203–216 DOI: 10.1111/2041-210X.13738
- [16] Ulrik Brandes “A faster algorithm for betweenness centrality” In Journal of mathematical sociology 25.2 Taylor & Francis, 2001, pp. 163–177
- [17] Ulrik Brandes “On variants of shortest-path betweenness centrality and their generic computation” In Social networks 30.2 Elsevier, 2008, pp. 136–145
- [18] Ulrik Brandes, Linton C Freeman and Dorothea Wagner “Social networks”, 2013
- [19] Chris Brimacombe et al. “Shortcomings of reusing species interaction networks created by different sets of researchers” Publisher: Public Library of Science In PLOS Biology 21.4, 2023, pp. e3002068 DOI: 10.1371/journal.pbio.3002068
- [20] M Bundgaard “Tidslig og rumlig variation i et plante-bestøvernetværk” In University of Aarhus, 2003
- [21] Silvana Buzato, Marlies Sazima and Ivan Sazima “Hummingbird-pollinated floras at three Atlantic Forest sites 1” In Biotropica 32.4b Wiley Online Library, 2000, pp. 824–841
- [22] Edgar Fernando Cagua, Kate L Wootton and Daniel B Stouffer “Keystoneness, centrality, and the structural controllability of ecological networks” In Journal of Ecology 107.4 Wiley Online Library, 2019, pp. 1779–1790
- [23] Maria Bernadete Ferreira Canela “Interações entre plantas e beija-flores numa comunidade de Floresta Atlântica Montana em Itatiaia, RJ” In Universidade Estadual de Campinas, Campinas, Sao Paulo, Brazil, 2006
- [24] Tomás A Carlo, Jaime A Collazo and Martha J Groom “Avian fruit preferences across a Puerto Rican forested landscape: pattern consistency and implications for seed removal” In Oecologia 134 Springer, 2003, pp. 119–131
- [25] Grasiela Casas, Vinicius A.. Bastazini, Vanderlei J. Debastiani and Valério D. Pillar “Assessing sampling sufficiency of network metrics using bootstrap” In Ecological Complexity 36, 2018, pp. 268–275 DOI: 10.1016/j.ecocom.2018.09.005
- [26] Michael D. Catchen, Timothée Poisot, Laura J. Pollock and Andrew Gonzalez “The missing link: discerning true from false negatives when sampling species interaction networks” Publisher: EcoEvoRxiv, 2023 URL: https://ecoevorxiv.org/repository/view/4929/
- [27] Aaron Clauset, Mark EJ Newman and Cristopher Moore “Finding community structure in very large networks” In Physical review E 70.6 APS, 2004, pp. 066111
- [28] Frederic Edward Clements and Frances Louise Long “Experimental pollination: an outline of the ecology of flowers and insects” Carnegie institution of Washington, 1923
- [29] Ma Coro Arizmendi and Juan Francisco Ornelas “Hummingbirds and their floral resources in a tropical dry forest in Mexico” In Biotropica JSTOR, 1990, pp. 172–180
- [30] Peter A Cotton “Coevolution in an Amazonian hummingbird-plant community” In Ibis 140.4 Wiley Online Library, 1998, pp. 639–646
- [31] FHJ Crome “The ecology of fruit pigeons in tropical Northern Queensland.” In Wildlife Research 2.2 CSIRO Publishing, 1975, pp. 155–185
- [32] Bo Dalsgaard et al. “The influence of biogeographical and evolutionary histories on morphological trait-matching and resource specialization in mutualistic hummingbird–plant networks” In Functional Ecology 35.5 Wiley Online Library, 2021, pp. 1120–1133
- [33] Diane W Davidson and Brian L Fisher “Symbiosis of ants with Cecropia as a function of light regime” In Ant-plant interactions Oxford University PressOxford, 1991, pp. 289–309
- [34] Diane W Davidson, Roy R Snelling and John T Longino “Competition among ants for myrmecophytes and the significance of plant trichomes” In Biotropica JSTOR, 1989, pp. 64–73
- [35] Eva Delmas et al. “Analysing ecological networks of species interactions” In Biological Reviews 94.1, 2019, pp. 16–36 DOI: 10.1111/brv.12433
- [36] LV Dicks, SA Corbet and RF Pywell “Compartmentalization in plant-insect flower visitor webs” In Journal of Animal Ecology JSTOR, 2002, pp. 32–43
- [37] Yoko L Dupont, Dennis M Hansen and Jens M Olesen “Structure of a plant–flower-visitor network in the high-altitude sub-alpine desert of Tenerife, Canary Islands” In Ecography 26.3 Wiley Online Library, 2003, pp. 301–310
- [38] Yoko L Dupont and Jens M Olesen “Ecological modules and roles of species in heathland plant-insect flower visitor networks” In Journal of Animal Ecology JSTOR, 2009, pp. 346–353
- [39] Rick Durrett “Probability: theory and examples” Cambridge university press, 2019
- [40] Heidi Elberling and Jens M Olesen “The structure of a high latitude plant-flower visitor system: the dominance of flies” In Ecography 22.3 Wiley Online Library, 1999, pp. 314–323
- [41] Carine Emer, Eduardo Martins Venticinque and Carlos Roberto Fonseca “Effects of dam-induced landscape fragmentation on Amazonian ant–plant mutualistic networks” In Conservation Biology 27.4 Wiley Online Library, 2013, pp. 763–773
- [42] Sanaz Hasanzadeh Fard “Machine Learning on Dynamic Graphs: A Survey on Applications” In 2023 IEEE Ninth Multimedia Big Data (BigMM) IEEE, 2023, pp. 32–39
- [43] Sanaz Hasanzadeh Fard and Mohammad Ghassemi “Temporal Link Prediction Using Graph Embedding Dynamics” In 2023 IEEE Ninth Multimedia Big Data (BigMM), 2023, pp. 48–55 IEEE
- [44] Carlos Roberto Fonseca and Gislene Ganade “Asymmetries, compartments and null interactions in an Amazonian ant-plant community” In Journal of Animal Ecology JSTOR, 1996, pp. 339–347
- [45] Miguel A Fortuna, Raul Ortega and Jordi Bascompte “The web of life” In arXiv preprint arXiv:1403.2575, 2014
- [46] Santo Fortunato “Community detection in graphs” In Physics reports 486.3-5 Elsevier, 2010, pp. 75–174
- [47] Santo Fortunato and Darko Hric “Community detection in networks: A user guide” In Physics reports 659 Elsevier, 2016, pp. 1–44
- [48] PGH Frost “Fruit-frugivore interactions in a South African coastal dune forest” In Acta XVII Congressus Internationalis Ornithologici 2, 1980, pp. 1179–1184
- [49] Mauro Galetti and Marco Aurélio Pizo “Fruit eating by birds in a forest fragment in southeastern Brazil.” In Revista Brasileira de Ornitologia-Brazilian Journal of Ornithology 4.5, 2013, pp. 9
- [50] Michelle Girvan and Mark EJ Newman “Community structure in social and biological networks” In Proceedings of the national academy of sciences 99.12 National Acad Sciences, 2002, pp. 7821–7826
- [51] Oscar Gonzalez and Bette A Loiselle “Species interactions in an Andean bird–flowering plant network: phenology is more important than abundance or morphology” In PeerJ 4 PeerJ Inc., 2016, pp. e2789
- [52] Ana M Martín González, Bo Dalsgaard and Jens M Olesen “Centrality measures and the importance of generalist species in pollination networks” In Ecological complexity 7.1 Elsevier, 2010, pp. 36–43
- [53] Catherine H Graham and Ben G Weinstein “Towards a predictive model of species interaction beta diversity” In Ecology letters 21.9 Wiley Online Library, 2018, pp. 1299–1310
- [54] J Guitián “Relaciones entre los frutos y los passeriformes en un bosque montano de la cordillera cantábrica occidental” In Univ. Santiago, Spain, 1983
- [55] Aquiles Gutiérrez, Sandra Victoria Rojas-Nossa and F Gary Stiles “Dinámica anual de la interacción colibrí-flor en ecosistemas altoandinos” In Ornitología neotropical 15.sSuppl, 2004
- [56] Jarrod D Hadfield, Boris R Krasnov, Robert Poulin and Shinichi Nakagawa “A tale of two phylogenies: comparative analyses of ecological interactions” In The American Naturalist 183.2 University of Chicago Press Chicago, IL, 2014, pp. 174–187
- [57] Andreas Hamann and Eberhard Curio “Interactions among frugivores and fleshy fruit trees in a Philippine submontane rainforest” In Conservation Biology 13.4 Wiley Online Library, 1999, pp. 766–773
- [58] Ruben H Heleno, Jaime A Ramos and Jane Memmott “Integration of exotic seeds into an Azorean seed dispersal network” In Biological Invasions 15 Springer, 2013, pp. 1143–1154
- [59] Javier Herrera “Pollination relationships in southern Spanish Mediterranean shrublands” In The Journal of Ecology JSTOR, 1988, pp. 274–287
- [60] Brian Hocking “Insect-flower associations in the high Arctic with special reference to nectar” In Oikos JSTOR, 1968, pp. 359–387
- [61] Thomas C Ings et al. “Ecological networks–beyond food webs” In Journal of animal ecology 78.1 Wiley Online Library, 2009, pp. 253–269
- [62] TT Ingversen “Plant-pollinator interactions on Jamaica and Dominica: the centrality, asymmetry and modularity of networks”, 2006
- [63] Tamiji Inoue et al. “Insect-flower relationship in the temperate deciduous forest of Kibune, Kyoto: an overview of the flowering phenology and the seasonal pattern of insect visits” In Contributions from the Biological Laboratory, Kyoto University 27.4 京都大学教養部生物学教室, 1990, pp. 377–464
- [64] David W Inouye and Graham H Pyke “Pollination biology in the Snowy Mountains of Australia: comparisons with montane Colorado, USA” In Australian Journal of Ecology 13.2 Wiley Online Library, 1988, pp. 191–205
- [65] Pedro Jordano “El ciclo anual de los paseriformes frugívoros en el matorral mediterráneo del sur de España: importancia de su invernada y variaciones interanuales” Sociedad Española de Ornitología, 1985
- [66] Pedro Jordano “Geographical ecology and variation of plant-seed disperser interactions: southern Spanish junipers and frugivorous thrushes” In Vegetatio 107 Springer, 1993, pp. 85–104
- [67] Pedro Jordano, Jordi Bascompte and Jens M Olesen “Invariant properties in coevolutionary networks of plant–animal interactions” In Ecology letters 6.1 Wiley Online Library, 2003, pp. 69–81
- [68] Christopher N Kaiser-Bunbury, Diego P Vázquez, Martina Stang and Jaboury Ghazoul “Determinants of the microstructure of plant–pollinator networks” In Ecology 95.12 Wiley Online Library, 2014, pp. 3314–3324
- [69] Christopher N Kaiser-Bunbury et al. “The robustness of pollination networks to the loss of species and interactions: a quantitative approach incorporating pollinator behaviour” In Ecology letters 13.4 Wiley Online Library, 2010, pp. 442–452
- [70] Takehiko Kakutani, Tamiji Inoue, Makoto Kato and Hideyuki Ichihashi “Insect-flower relationship in the campus of Kyoto University, Kyoto: an overview of the flowering phenology and the seasonal pattern of insect visits” In Contributions from the Biological Laboratory, Kyoto University 27.4 京都大学教養部生物学教室, 1990, pp. 465–522
- [71] Gail E Kantak “Observations on some fruit-eating birds in Mexico” In The Auk 96.1 JSTOR, 1979, pp. 183–186
- [72] Makoto KATO “Anthophilous insect community and plant-pollinator interactions on Amami Islands in the Ryukyu Archipelago, Japan” In Contributions from the Biological Laboratory, Kyoto University 29.2 京都大学大学院人間・環境学研究科, 2000, pp. 157–254
- [73] Makoto KATO, Masamichi MATSUMOTO and Tôru KATO “Flowering phenology and anthophilous insect community in the cool-temperate subalpine forests and meadows at Mt. Kushigata in the central part of Japan” In Contributions from the Biological Laboratory, Kyoto University 28.2 京都大学総合人間学部自然環境学科, 1993, pp. 119–172
- [74] Makoto KATo and Reiichi MiuRA “Flowering phenology and anthophilous insect community at a threatened natural lowland marsh at Nakaikemi in Tsuruga, Japan” In Contributions from the Biological Laboratory, Kyoto University 29.1 京都大学総合人間学部自然環境学科, 1996, pp. 1
- [75] Makoto Kato, Takehiko Kakutani, Tamiji Inoue and Takao Itino “Insect-flower relationship in the primary beech forest of Ashu, Kyoto: an overview of the flowering phenology and the seasonal pattern of insect visits” In Contributions from the biological laboratory, Kyoto University 27.4 京都大学教養部生物学教室, 1990, pp. 309–376
- [76] Peter G Kevan “High arctic insect-flower relations: the inter-relationships of arthropods and flowers at Lake Hazen, Ellesmere Island, NWT, Canada”, 1970
- [77] Glauco Ubiratan Kohler “Redes de interação Planta Beija-Flor em um Gradiente Altitudinal de Floresta Atlântica no Sul do Brasil.”, 2011
- [78] Ajay Kumar, Shashank Sheshar Singh, Kuldeep Singh and Bhaskar Biswas “Link prediction techniques, applications, and performance: A survey” In Physica A: Statistical Mechanics and its Applications 553 Elsevier, 2020, pp. 124289
- [79] Frank Lambert “Fig-eating by birds in a Malaysian lowland rain forest” In Journal of Tropical Ecology 5.4 Cambridge University Press, 1989, pp. 401–412
- [80] Andrea Landherr, Bettina Friedl and Julia Heidemann “A critical review of centrality measures in social networks” In Business & Information Systems Engineering 2 Springer, 2010, pp. 371–385
- [81] Carlos Lara “Temporal dynamics of flower use by hummingbirds in a highland temperate forest in Mexico” In Ecoscience 13.1 Taylor & Francis, 2006, pp. 23–29
- [82] Flor Maria Guedes Las-Casas, SM Azevedo Júnior and MM Dias Filho “The community of hummingbirds (Aves: Trochilidae) and the assemblage of flowers in a Caatinga vegetation” In Brazilian Journal of Biology 72 SciELO Brasil, 2012, pp. 51–58
- [83] Liliana Rosero Lasprilla and Marlies Sazima “Interacciones planta-colibrí en tres comunidades vegetales de la parte suroriental del Parque Nacional Natural Chiribiquete, Colombia” In Ornitologia Neotropical 15, 2004, pp. 183–190
- [84] Rebekka Lundgren and Jens M Olesen “The dense and highly connected world of Greenland’s plants and their pollinators” In Arctic, Antarctic, and Alpine Research 37.4 Taylor & Francis, 2005, pp. 514–520
- [85] Andrew L Mack and Debra D Wright “Notes on occurrence and feeding of birds at Crater Mountain biological research station, Papua New Guinea” In Emu 96.2 CSIRO Publishing, 1996, pp. 89–101
- [86] Pietro Kiyoshi Maruyama et al. “Nectar robbery by a hermit hummingbird: association to floral phenotype and its influence on flowers and network structure” In Oecologia 178 Springer, 2015, pp. 783–793
- [87] Diego Medan et al. “Plant-pollinator relationships at two altitudes in the Andes of Mendoza, Argentina” In Arctic, Antarctic, and Alpine Research 34.3 Taylor & Francis, 2002, pp. 233–241
- [88] Jane Memmott “The structure of a plant-pollinator food web” In Ecology letters 2.5 Wiley Online Library, 1999, pp. 276–280
- [89] Russell Merris “Laplacian graph eigenvectors” In Linear algebra and its applications 278.1-3 Elsevier, 1998, pp. 221–236
- [90] A Montero “The ecology of three pollination networks”, 2005
- [91] Theodore Mosquin and JEH Martin “Observations on the pollination biology of plants on Melville Island, NWT, Canada.”, 1967
- [92] ALEXANDER FEWELL MOTTEN “POLLINATION ECOLOGY OF THE SPRING WILDFLOWER COMMUNITY IN THE DECIDUOUS FORESTS OF PIEDMONT NORTH CAROLINA (HEPATICA, ERYTHRONIUM, CLAYTONIA)” Duke University, 1982
- [93] Mark EJ Newman and Michelle Girvan “Finding and evaluating community structure in networks” In Physical review E 69.2 APS, 2004, pp. 026113
- [94] Jens M Olesen, Louise I Eskildsen and Shadila Venkatasamy “Invasion of pollination networks on oceanic islands: importance of invader complexes and endemic super generalists” In Diversity and distributions 8.3 Wiley Online Library, 2002, pp. 181–192
- [95] Jeff Ollerton, Steven D Johnson, Louise Cranmer and SAM Kellie “The pollination ecology of an assemblage of grassland asclepiads in South Africa” In Annals of Botany 92.6 Oxford University Press, 2003, pp. 807–834
- [96] Robert L Oppenheimer and John T Lill “A Plant-Bee Visitation Network for Plummers Island, MD” In Proceedings of the Entomological Society of Washington 123.2 BioOne, 2021, pp. 365–381
- [97] Ruth Partida-Lara et al. “Pollination syndromes and interaction networks in hummingbird assemblages in El Triunfo Biosphere Reserve, Chiapas, Mexico” In Journal of Tropical Ecology 34.5 Cambridge University Press, 2018, pp. 293–307
- [98] Mary Percival “Floral ecology of coastal scrub in southeast Jamaica” In Biotropica JSTOR, 1974, pp. 104–129
- [99] T Petanidou “Pollination ecology in a phryganic ecosystem” In Thessaloniki: Aristotle University of Thessaloniki, 1991
- [100] Marianne Philipp, Jens Böcher, Hans R. and Lene R. “Structure of a plant-pollinator network on a pahoehoe lava desert of the Galápagos Islands” In Ecography 29.4 Wiley Online Library, 2006, pp. 531–540
- [101] Timothée Poisot, Daniel B. Stouffer and Sonia Kéfi “Describe, understand and predict: why do we need networks in ecology?” Publisher: [British Ecological Society, Wiley] In Functional Ecology 30.12, 2016, pp. 1878–1882 URL: https://www.jstor.org/stable/48582345
- [102] Brigitte Poulin, S Joseph Wright, Gaetan Lefebvre and Osvaldo Calderon “Interspecific synchrony and asynchrony in the fruiting phenologies of congeneric bird-dispersed plants in Panama” In Journal of Tropical Ecology 15.2 Cambridge University Press, 1999, pp. 213–227
- [103] Richard B Primack “Insect pollination in the New Zealand mountain flora” In New Zealand Journal of Botany 21.3 Taylor & Francis, 1983, pp. 317–333
- [104] Nelson Ramirez “Biología de polinización en una comunidad arbustiva tropical de la alta Guayana Venezolana” In Biotropica JSTOR, 1989, pp. 319–330
- [105] Nelson Ramirez and Ysaleny Brito “Pollination biology in a palm swamp community in the Venezuelan Central Plains” In Botanical Journal of the Linnean Society 110.4 Oxford University Press, 1992, pp. 277–302
- [106] Alfréd Rényi “Probability theory” Courier Corporation, 2007
- [107] Charles Robertson “Flowers and insects: lists of visitors of four hundred and fifty-three flowers” s. éd., 1929
- [108] Francisco Aparecido Rodrigues “Network centrality: an introduction” In A mathematical modeling approach from nonlinear dynamics to complex systems Springer, 2019, pp. 177–196
- [109] L da C Rodrigues and M Rodrigues “Flowers visited by hummingbirds in the open habitats of the southeastern brazilian mountaintops: species composition and seasonality” In Brazilian Journal of Biology 74 SciELO Brasil, 2014, pp. 659–676
- [110] Malena Sabatino, Néstor Maceira and Marcelo A Aizen “Direct effects of habitat area on interaction diversity in pollination webs” In Ecological Applications 20.6 Wiley Online Library, 2010, pp. 1491–1497
- [111] Douglas W Schemske et al. “Flowering ecology of some spring woodland herbs” In Ecology 59.2 Wiley Online Library, 1978, pp. 351–366
- [112] Matthias Schleuning et al. “Specialization and interaction strength in a tropical plant–frugivore network differ among forest strata” In Ecology 92.1 Wiley Online Library, 2011, pp. 26–36
- [113] Wesley R Silva, P de Marco Júnior, Érica Hasui and Verônica SM Gomes “Patterns of fruit-frugivore interactions in two Atlantic Forest bird communities of South-eastern Brazil: implications for conservation.” In Seed dispersal and frugivory: ecology, evolution and conservation. Third International Symposium-Workshop on Frugivores and Seed Dispersal, São Pedro, Brazil, 6-11 August 2000, 2002, pp. 423–435 CABI publishing Wallingford UK
- [114] Ernest Small “Insect pollinators of the Mer Bleue peat bog of Ottawa”, 1976
- [115] Cecilia Smith-Ramírez et al. “Diversity, flower visitation frequency and generalism of pollinators in temperate rain forests of Chiloé Island, Chile” In Botanical Journal of the Linnean Society 147.4 Oxford University Press, 2005, pp. 399–416
- [116] Barbara Snow and David Snow “Birds and berries” A&C Black, 2010
- [117] Barbara K Snow and DW Snow “Feeding niches of hummingbirds in a Trinidad valley” In The Journal of Animal Ecology JSTOR, 1972, pp. 471–485
- [118] Barbara K Snow and DW Snow “The feeding ecology of tanagers and honeycreepers in Trinidad” In The Auk 88.2 JSTOR, 1971, pp. 291–322
- [119] AE Sorensen “Interactions between birds and fruit in a temperate woodland” In Oecologia 50.2 Springer, 1981, pp. 242–249
- [120] L Stald, A Valido and J Olesen “Struktur og dynamik i rum og tid at et bestøvningsnetværk på Tenerife, De Kanariske Øer”, 2003
- [121] Tanya Strydom et al. “A roadmap towards predicting species interaction networks (across space and time)” Publisher: Royal Society In Philosophical Transactions of the Royal Society B: Biological Sciences 376.1837, 2021, pp. 20210063 DOI: 10.1098/rstb.2021.0063
- [122] Caroline EG Tutin, Rebecca M Ham, Lee JT White and Michael JS Harrison “The primate community of the Lopé Reserve, Gabon: diets, responses to fruit scarcity, and effects on biomass” In American journal of primatology 42.1 Wiley Online Library, 1997, pp. 1–24
- [123] Diego P Vázquez “Interactions among introduced ungulates, plants, and pollinators: a field study in the temperate forest of the southern Andes”, 2002
- [124] Jeferson Vizentin-Bugoni et al. “Influences of sampling effort on detected patterns and structuring processes of a Neotropical plant–hummingbird network” In Journal of Animal Ecology 85.1 Wiley Online Library, 2016, pp. 262–272
- [125] BA Walther and H Brieschke “Hummingbird-flower relationships in a mid-elevation rainforest near Mindo, northwestern Ecuador.”, 2001
- [126] Nathaniel T Wheelwright, William A Haber, K Greg Murray and Carlos Guindon “Tropical fruit-eating birds and their food plants: a survey of a Costa Rican lower montane forest” In Biotropica JSTOR, 1984, pp. 173–192
- [127] Kyoko YAMAZAKI and Makoto KATO “Flowering phenology and anthophilous insect community in a grassland ecosystem at Mt. Yufu, Western Japan” In Contributions from the Biological Laboratory, Kyoto University 29.3 京都大学大学院人間・環境学研究科, 2003, pp. 255
- [128] Anita Zakrzewska and David A. Bader “Measuring the Sensitivity of Graph Metrics to Missing Data” In Parallel Processing and Applied Mathematics Berlin, Heidelberg: Springer, 2014, pp. 783–792 DOI: 10.1007/978-3-642-55224-3˙73
The networks we used for this study are sourced from [1, 3, 5, 6, 7, 9, 10, 12, 14, 28, 36, 37, 40, 94, 95, 60, 99, 59, 88, 64, 76, 75, 87, 91, 92, 103, 105, 104, 111, 114, 115, 98, 62, 100, 90, 72, 84, 20, 38, 120, 123, 127, 70, 74, 73, 63, 69, 68, 107, 124, 29, 23, 82, 55, 77, 81, 83, 110, 96, 125, 117, 53, 30, 21, 51, 97, 32, 109, 86, 24, 31, 48, 118, 116, 49, 57, 65, 71, 79, 122, 85, 126, 67, 113, 54, 119, 66, 58, 102, 112, 34, 33, 44, 41, 56].