Field Aligned Currents and Aurora During the Terrestrial Alfvén Wing State
Abstract
When sub-Alfvénic (Alfvén Mach number M 1) plasmas impact Earth, the magnetosphere develops Alfvén wings. A Multiscale Atmosphere Geospace Environment (MAGE) global simulation of the April 2023 geomagnetic storm, validated against Active Magnetosphere and Planetary Electrodynamics Response Experiment (AMPERE), reveals the mechanism of field-aligned current (FAC) generation and resulting aurora for the terrestrial Alfvén wings. Simulation and observations show northern hemisphere planetward flowing auroral electrons (negative FAC) are dominantly at magnetic local times (MLTs) 5-11. Just before the wings formed, solar wind conditions were similar and M, yet negative FAC extended across the entire day-side and night-side dusk sectors. Flow vorticity drives FACs at the boundary of the Alfvén wings and unshocked solar wind. The Alfvén wing shape presents a different obstacle to the solar wind compared to typical lobe fluxes, producing the unique FAC and auroral patterns. New insights about Alfvén wing FACs will generate new understanding of aurora for exoplanets inside their host star’s Alfvén zone.
Geophysical Research Letters
Goddard Planetary Heliophysics Insitute, University of Maryland Baltimore County, Baltimore, MD, USA Heliophysics Science Division, NASA Goddard Space Flight Center, Greenbelt, MD, USA The Johns Hopkins University Applied Physics Laboratory, Laurel, MD, USA High Altitude Observatory, National Center for Atmospheric Research, Boulder, CO, USA Southwest Research Institute, San Antonio, TX, USA School of Cosmic Physics, DIAS Dunsink Observatory, Dublin Institute for Advanced Studies, Dublin, Ireland
Brandon Burkholderburkbran@umbc.edu
April 2023 storm observations and simulation show northern polar field-aligned current flows at local times 5-11 from Earth’s Alfvén wings.
Northern hemisphere Alfvén wing aurora likely occurred in the dawn day-side sector under dawn-northward IMF dominated by By.
The driver of the Alfvén wing field aligned currents is localized flow shear at the edge of the wings.
Plain Language Summary
The Earth is typically enveloped in a flow of plasma emanating from the sun that is traveling faster than the local Alfvén speed, a case similar to a supersonic jet flying through the atmosphere. In rare instances where the local Alfvén speed increases and the flow is actually sub-Alfvénic, Earth’s magnetosphere transforms into an Alfvén wing configuration. When the Alfvén wings form, the cross section of Earth’s magnetosphere interacting with the solar wind takes on a different shape compared to the super-Alfvénic scenario. The Earth’s aurora is a product of electric currents that flow into the upper atmosphere, and they are generated where the magnetosphere interacts with the solar wind and interplanetary magnetic field. Thus, the Alfvén wing interval associated with the April 2023 geomagnetic storm presents a unique opportunity to examine global electric current generation in an extreme regime, and better understand the structure and evolution of planetary and exoplanetary magnetospheres. By comparing simulations and observations of Earth’s Alfvén wings, it is demonstrated that the Alfvén wing aurora occurred on the day-side during the April 2023 geomagnetic storm, where it could potentially have been observed with sensitive cameras, even though it may have been outshone by sunlight and not visible to human eyes.
1 Introduction
Field-aligned currents (FACs) are generated in different magnetospheric regions and flow along magnetic field lines into the polar caps as Birkeland currents [Birkeland (\APACyear1908), Birkeland (\APACyear1913), Zmuda \BOthers. (\APACyear1966)]. These close via Hall and Pederson currents flowing in Earth’s polar ionosphere, which are associated with atmospheric joule heating [Crowley (\APACyear1991)]. FACs provide charge carriers to enhance ionospheric conductivity, and planetward flowing electrons can be accelerated by double layers to produce aurora [Andersson \BBA Ergun (\APACyear2012)]. Earth’s global current system carries MA (millions of Amperes) during quiet times and 10s of MA during geomagnetic storms [Pedersen \BOthers. (\APACyear2021)]. These produce magnetic perturbations on the ground and in space, which are hazardous to vital technologies if sufficiently intense [Pilipenko (\APACyear2021)].
The morphology and evolution of FACs is linked to the solar wind-magnetosphere interaction [Sato \BBA Iijima (\APACyear1979)]. FACs connecting Earth’s magnetosphere and ionosphere are classified into Region I and II current systems [Iijima \BBA Potemra (\APACyear1976), Iijima \BBA Potemra (\APACyear1978)], which map to currents originating on the magnetopause and in the ring current, respectively. Geomagnetic storms and substorms produce the strongest and most variable FACs [Coxon \BOthers. (\APACyear2023)]. Geomagnetic storms are associated with extreme variations of solar wind driving, from the interplanetary coronal mass ejection (CME) shock impact to rarefied plasma in the magnetic cloud. Sustained intervals of sub-Alfvénic (Alfvén Mach number M 1, where MA is the ratio of solar wind velocity to local Alfvén speed) solar wind are often associated with rarefied CME magnetic clouds that follow fast and dense CME sheath material [Lavraud \BOthers. (\APACyear2002), Hajra \BBA Tsurutani (\APACyear2022)]. During a sustained sub-Alfvénic solar wind interval, lack of a bow shock exposes the magnetopause to unshocked solar wind [Chen \BOthers. (\APACyear2024)], a flow that is faster than typical magnetosheath plasma. Along with the transformation of the magnetosphere into an Alfvén wing configuration [Ridley (\APACyear2007)], this direct exposure of the magnetopause leads to a unique behavior of magnetic reconnection and FAC generation.
Recent interest in the April 2023 geomagnetic storm has demonstrated both day-side and night-side magnetic reconnection processes are altered during the Alfvén wing transformation [Chen \BOthers. (\APACyear2024), Burkholder \BOthers. (\APACyear2024), Gurram \BOthers. (\APACyear2025)]. This study examines the unique FAC generation mechanism and auroral signatures during the same event. By combining Multiscale Atmosphere Geospace Environment (MAGE) simulations and Active Magnetosphere and Planetary Electrodynamics Response Experiment (AMPERE) observations during the 23-24 April 2023 storm, we demonstrate that during this event, the Alfvén wing aurora is a dominantly day-side phenomena. This is due to the less flattened shape of the Alfvén wings compared to typical lobe fluxes and because Alfvén wing structures are more inclined to the oncoming solar wind flow compared to magnetotail lobes.
2 MAGE and AMPERE
The global geospace simulation is similar to that described in \citeASorathia2023 and \citeASorathia2024. The MAGE configuration includes: the global magnetohydrodynamic (MHD) model Grid Agnostic MHD for Extended Research Applications (GAMERA, \citeAZhang2019,Sorathia2020); the Rice Convection Model (RCM; \citeAToffoletto2003); and the RE-developed Magnetosphere-Ionosphere Coupler/Solver (REMIX; \citeAMerkin2010). The simulation uses Solar Magnetospheric (SM) coordinates, with z-axis aligned to Earth’s northern magnetic dipole and y-axis perpendicular to the Earth-Sun line towards dusk. GAMERA integrates the equations of ideal MHD driven by time-dependent solar wind parameters reported by OMNIWeb (see Figures 1a and b). The simulation covers 00:00 April 23 - 23:58 April 24, which includes a preconditioning period of pre-storm driving. The highest MHD grid resolution is 1200 km in the near-Earth plasma sheet. The version of MAGE used in this study considers mono-energetic and diffuse electron precipitation [Lin \BOthers. (\APACyear2021)]. Once electron precipitation fluxes are derived, the Pedersen conductance is evaluated using the \citeARobinson1987 formula and Hall conductance is derived from Pedersen conductance using the empirical ratio from \citeAKaeppler2015. During the transition from super-Alfvénic to sub-Alfvénic solar wind, the bow shock retreats upstream and eventually interacts with the boundary. To isolate the magnetosphere from waves reflected at the upstream boundary, the boundary was moved from it’s typical location at 30 RE to 120 RE [Ridley (\APACyear2007), Chané \BOthers. (\APACyear2015), Wilder \BOthers. (\APACyear2019), Burkholder \BOthers. (\APACyear2024)]. MAGE is developed by the NASA DRIVE Science Center for Geospace Storms.
AMPERE provides continuous global estimates of radial current in the high-latitude ionosphere [Anderson \BOthers. (\APACyear2002), Anderson \BOthers. (\APACyear2014), Anderson \BOthers. (\APACyear2021)], which will be used to validate MAGE polar FAC profiles. The small difference between radial current and FAC is neglected because the Alfvén wing FAC structures are at arctic magnetic latitudes (MLat 60 degrees). AMPERE data assimilation takes 10 minutes for sufficient global coverage, introducing an observational time aliasing. We will directly compare AMPERE observations to individual MAGE timesteps, rather than averaging over 10 minutes, since there are no significant global dynamics on shorter time scales than 10 minutes during the Alfvén wing interval. The system is in a quasi-steady state because the sub-Alfvénic solar wind was steady and sustained for 2 hours. The AMPERE grid has 24 MLT sectors and extends 50 degrees MLat from the pole while MAGE FAC output has 1 degree azimuthal resolution (360 MLT sectors) and extends 45 degrees MLat from the pole. In the northern hemisphere, a negative sign is applied to facililate direct comparison of AMPERE and MAGE. We will hereafter refer to the AMPERE radial current as FAC for simplicity’s sake. This study focuses on the northern hemisphere due to observational constraints of AMPERE in the southern hemisphere [Coxon \BOthers. (\APACyear2016), Anderson \BOthers. (\APACyear2017), Anderson \BOthers. (\APACyear2018), Waters \BOthers. (\APACyear2020)].
3 April 2023 Geomagnetic Storm
Simulations and observations of the April 2023 geomagnetic storm have revealed the dynamic transformation of Earth’s magnetotail into Alfvén wings [Burkholder \BOthers. (\APACyear2024), Chen \BOthers. (\APACyear2024), Gurram \BOthers. (\APACyear2025), Beedle \BOthers. (\APACyear2024)]. During the April 2023 geomagnetic storm, the solar wind was sub-Alfvénic (M) for 2 hours continuously. Figures 1a-b show the interplanetary magnetic field (IMF), solar wind velocity (left side blue axis), and MA (right side orange axis). These data are from NASA OMNIWeb, which predicts the IMF and solar wind parameters impacting Earth’s bow shock nose. The sub-Alfvénic interval begins at 12:30 UT and ends at 14:30 UT. During the Alfvén wing interval, the IMF is primarily oriented along -By (-30 nT) with Bz changing sign at the beginning then growing to about +10 nT before the solar wind returned to a super-Alfvénic state. Figure 1c is the SYM-H index which has a peak main phase value -230 nT. The sub-Alfvénic interval occurs about 8 hours later during the recovery phase, corresponding to a plateau in the SYM-H index [Chen \BOthers. (\APACyear2024)].
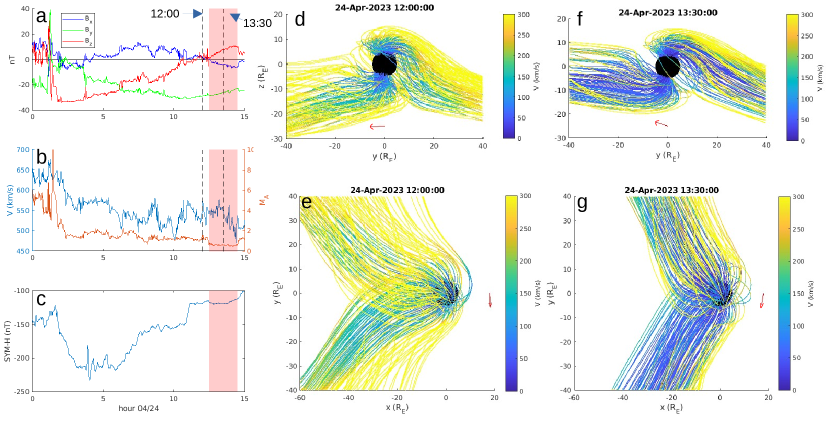
Figures 1d-g show three dimensional magnetic field lines from the simulation at two selected times (vertical dashed lines in Figures 1a-b). These correspond to 12:00 UT (before the Alfvén wing interval M) and 13:30 UT (in the middle of the Alfvén wing interval M). The y-z views in Figures 1d and f show northern polar cap field lines map to the dusk and southern polar cap field lines map to the dawn (due to -By dominant IMF). Field line colors represent local plasma flow speed, showing many Alfvén wing field lines have plasma moving significantly slower than their super-Alfvénic counterpart (lobe magnetic field lines). Notice, solar wind speed (Figure 1b) is the same at the two selected times, indicating the flow disturbance results from Alfvén wing physics [Ridley (\APACyear2007)]. Faster flows (200 km/s) are limited to the Alfvén wing edges, which has been shown in simulations and observations [Chané \BOthers. (\APACyear2012), Chané \BOthers. (\APACyear2015)]. Also note MA at 12:00 is only marginally super-Alfvénic (see Figure 1b). Some studies have suggested the Alfvén wings form at marginally super-Alfvénic MA [Ridley (\APACyear2007)], but Figure 1 shows a clear difference between marginally super-Alfvénic and sub-Alfvénic scenarios. Figures 1e and g show the same magnetic field lines viewed from above the x-y plane. This highlights the large scale topological evolution of the magnetosphere under a transformation to the Alfvén wing state. The Alfvén wing field lines (Figure 1e) map immediately in the IMF direction (more accurately, they are tilted with respect to the upstream IMF by an angle (MA), the point being they map immediately in that direction once coming out of the polar cap), while during the super-Alfvénic period (Figure 1f), polar cap field lines closer to the planet have a significant Bx component. Only after mapping 10s of RE downtail do those lobe field lines bend towards the IMF direction.
4 Alfvén Wing Field Aligned Currents and Aurora
Figure 2a compares northern hemisphere total current ( with and representing integration over MLat and MLT, respectively) from MAGE (blue) and AMPERE (orange) for the entire storm interval. The CME impact occurred around 17:45 UT on April 23. The main features of the observations are remarkably well reproduced by the simulation, including the quiet period before the storm, sharp increase of total current at the time of CME impact, and maxima around 21:00 UT April 23 and 3:00 UT April 24. The simulated is overall slightly larger than the observed total current during the storm main phase, but decreases at a similar rate during the storm recovery phase, which began at about 6:00 UT April 24. The vertical dashed lines mark the times 12:00 and 13:30 UT April 24, as in Figure 1. Examining closely the profiles around 12:00-15:00 UT April 24, the simulated and observed total currents have the same magnitude and vary little compared to the rest of the storm, providing a first point of validation that simulated FAC profiles are physically realistic just before and during the Alfvén wing interval.
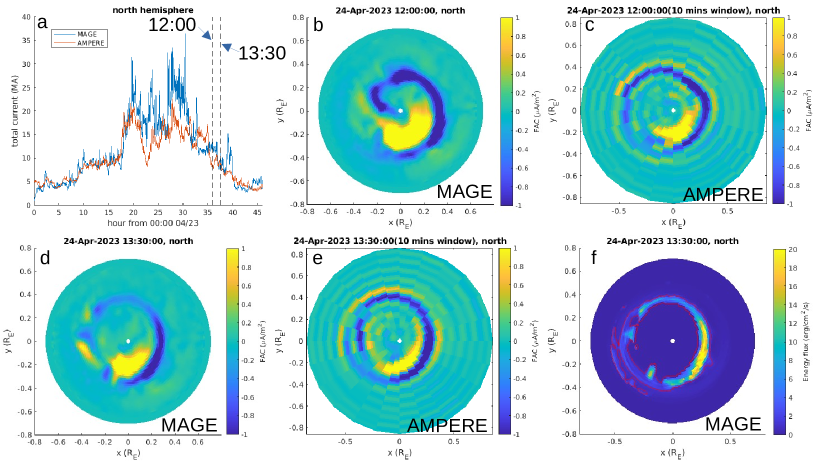
Figures 2b and c show MAGE and AMPERE northern hemisphere FAC, respectively, at 12:00 UT April 24 (sun to the right). MAGE FAC is plotted on a sphere at 2.1 RE from 90 to 45 degrees MLat, while AMPERE FAC is plotted on a sphere at 1.12 RE from 90 to 40 degrees MLat. Positive FAC (yellow) is strongly localized in the day-side dawn sector (LTs 5-11). Negative FAC (blue) forms a crescent along most day-side LTs and extending through the dusk night-side sector to midnight. In the simulation, the greatest concentration of negative FAC is at MLT 18 while the observed is at MLT 15. Figures 2d and e show simulated and observed northern hemisphere FAC, respectively, at 13:30 UT April 24. Positive FAC is similar to the pre-Alfvén wing interval, but further localized. The main difference is the negative FAC. The simulation and observation both show the greatest concentration of negative FAC is shifted to MLT 9 during the Alfvén wing interval. Negative FACs in the midnight and dusk MLT sectors are suppressed at 13:30 UT compared to 12:00 UT. Figure 2f shows MAGE precipitating electron energy flux at 13:30 UT. The auroral oval in this study is identified based on precipitating electron energy flux, specifically 1 erg/cm2/s [Sorathia \BOthers. (\APACyear2024)], which is indicated by the red contour. The auroral oval corresponds to enhanced negative FAC (compare Figures 2d and f), which indicates electrons moving toward the ionosphere in the northern hemisphere. Greater electron energy flux roughly corresponds to greater auroral brightness, neglecting the atmospheric chemistry. Thus, the northern hemisphere Alfvén wing aurora was likely most intense in the dawn day-side sector during this event.
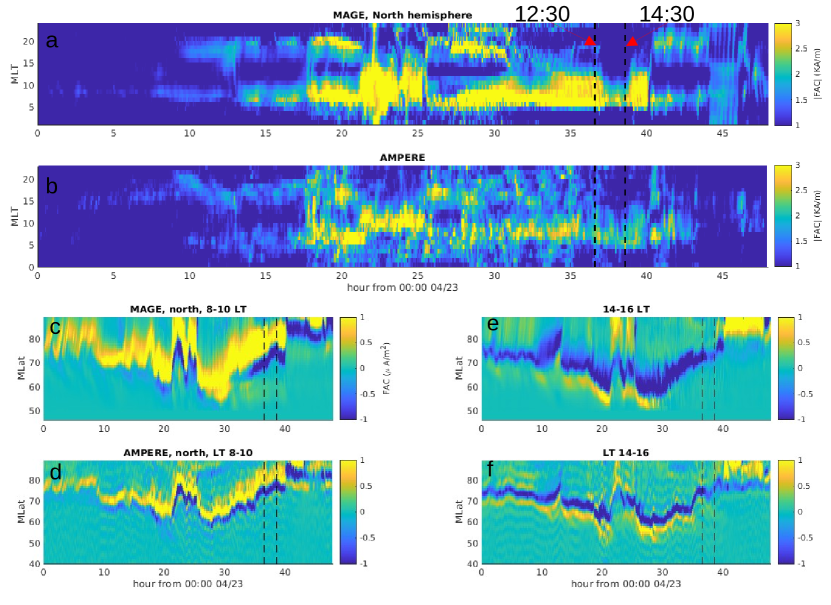
Figure 3 compares simulated and observed FAC for the entire storm. Total current as a function of MLT ( integrated over MLat in 1 hour local time bins) is shown in Figures 3a (MAGE) and b (AMPERE). The radius is 2.1 RE for MAGE and 1.12 RE for AMPERE. Vertical dashed lines represent the start (12:30) and beginning (14:30) of sub-Alfvénic solar wind. Over the course of the storm, the simulation is in remarkable agreement with the observations. In particular, the Alfvén wing transformation is characterized a localized FAC in the MLT sector 5-11. Figures 3c (MAGE) and d (AMPERE) show MLat keogram representations (a constant slice of MLT for the entire storm) of FAC integrated over the MLT sector 8-10 (day-side dawn sector, the location where Figures 2d and e show strongest negative FAC). During the Alfvén wing interval, the negative FAC enhancement in the 8-10 MLT sector is localized around 70 degrees MLat and stronger than any point during the storm. Figures 3e (MAGE) and f (AMPERE) show MLat keogram representations of FAC integrated over the MLT sector 14-16 (day-side dusk sector). During the Alfvén wing interval, negative FACs in the 14-16 MLT sector are weaker than any point during the storm. Both simulation and observations agree, during the Alfvén wing interval, negative FACs are intense in the MLT sector 8-10 and suppressed in the MLT sector 14-16. Thus, simulated FAC profiles during the Alfvén wing interval are validated by the observation, in terms of both magnitude (Figure 2a) and morphology (Figure 3).
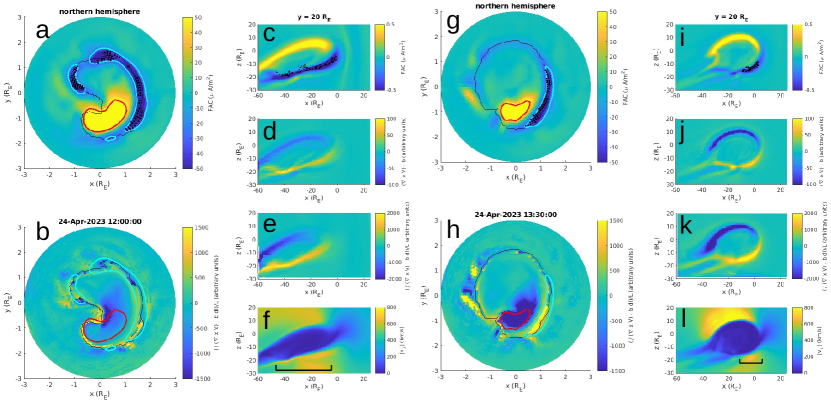
Figure 4 illustrates the formation mechanism for the unique properties of Alfvén wing FACs. Figure 4a shows northern hemisphere FAC pre-Alfvén wing (12:00 UT), the same as Figure 2b except on a sphere of radius 3 RE (to facilitate field line tracing away from the inner boundary). The strong positive and negative FAC are been outlined with red (FAC 50 ) and cyan (FAC -30 ), respectively. The thin black contour is the open-closed magnetic field boundary, showing the positive FAC enhancement lies mostly on polar cap fluxes, while negative FAC enhancement straddles the day-side open-closed boundary.
Equations 1 and 2 from \citeALiu2022 describe FAC contributions from the diamagnetic current and change in magnetic field-aligned flow vorticity . In this event pressure gradients contribute an order of magnitude less FAC than velocity shear, so the diamagnetic component of parallel current is neglected here. The inertial component is:
where represents integration along a magnetic field line. The inertial component is a FAC driven by [Hasegawa \BOthers. (\APACyear1979)]. To isolate the vorticity contribution to FAC generation, Figure 4b shows integrated along field lines from r = 3 RE to the edge of a 60 RE cube, during the pre-Alfvén wing interval (the factor normalizes the integral by the field line length). Within magenta and cyan contours, is enhanced above the background but the greatest values of are in the midnight MLT sector, associated with the “bite-out” that gives the polar cap a kidney bean shape. This feature of the open-closed boundary is due to Dungey-type magnetotail reconnection that removes flux from the lobes and adds it to the magnetosphere.
Figures 4c-f are 2D simulation cuts at y = 20 RE. Figure 4c shows FAC, with black dots indicating magnetic connection to the same black dots in Figure 4a (showing where large negative FAC in the northern polar cap maps to the y = 20 RE plane). Negative FAC in the northern polar cap maps to the southern edge of the dusk lobe. Correspondingly, positive FAC maps to the northern edge. Figure 4d shows , which is localized to the same locations as FAC (positive FAC corresponds to negative and negative FAC to positive ). Given the relatively stable solar wind driving before (and during) the Alfvén wing interval, the portion of is contributing relatively little to FAC generation. The spatial gradient of , which is large because of strong localization at the boundary, is driving the FACs. Figure 4e shows integrated from y = 20 RE to y = 60 RE. Enhancements of are similar to the local value of (Figure 4d). Peak positive is at x RE and extends from RE to -60 RE. Figure 4f shows the magnetic field perpendicular velocity (), demonstrating there is a large velocity shear between tailward moving magnetosheath magnetic field and slower convecting lobe fluxes. The sharp boundary of localizes .
Figures 4g-l show the same panels as Figures 4a-f, but for the Alfvén wings (13:30 UT). Figure 4g shows the open-closed boundary “bite-out,” associated with night-side Alfvén wing reconnection, is localized to the night-side dawn MLT sector (at about 3-4 LT, see \citeABurkholder2024). Similar to Figure 4a, the positive FAC enhancement in Figure 4g lies adjacent to the bite-out and negative FAC lies on the day-side open-closed boundary. Figure 4h demonstrates the Alfvén wing FAC structures (red and cyan contours) are spatially co-located with strong enhancements of , different than the pre-Alfvén wing interval. Positive FAC corresponds to large negative and negative FAC to large positive .
Figure 4i shows magnetic field lines seeded at the black points in Figure 4g map to a relatively localized (compared to Figure 4c) portion of the southern edge of the dusk Alfvén wing. The cross-sectional shape of the Alfvén wing is significantly different than the pre-Alfvén wing interval. The “wing” is more circular compared to lobe fluxes, which actually resemble an aerodynamic wing. Figure 4j shows negative FAC on the southern edge of the dusk Alfvén wing is associated with strong positive . Compared to pre-Alfvén wing, local values of are significantly stronger, especially at the northern edge of the wing. When is integrated along the Alfvén wings (Figure 4k), there are layers of strong vorticity along the northern and southern edges of the wing. Peak positive is at x RE and strong negative extends from x to 0 RE. Figure 4l shows velocity shear on the northern part of the wing is greater at 13:30 compared to 12:00, supposedly due to lack of a bow shock during the sub-Alfvénic solar wind, and because Alfvén wing structures are more inclined to the oncoming solar wind flow compared to typical magnetotail lobes. The southern edge of the Alfvén wing has only a small region extending about 10 RE along the x-direction where there is a significant velocity shear and corresponding negative FAC generation (compare black bar in Figures 4f and l), which is ultimately the reason the Alfvén wing aurora is localized in the dawn day-side sector (see Figure 2f).
5 Summary and Conclusions
Alfvén wings are a unique configuration of Earth’s magnetosphere where the bow shock disappears and night-side lobe fluxes separate. Unshocked solar wind impinging directly on Earth’s magnetic field leads to a greater intensity of velocity shear between the IMF and relatively stationary Alfvén wing fluxes. Localized vorticity drives FACs at the Alfvén wing edges which flow towards the ionosphere as Birkeland currents. The main feature of northern hemisphere Alfvén wing aurora with dawnward IMF orientation is localization in the MLT sector 5-11. Just before the Alfvén wings formed, the IMF orientation was also dawnward and M, but northern hemisphere negative FAC extended across the entire day-side and night-side dusk sectors. The different extent of these negative FAC regions corresponds to the different shape of the southern edge of the dusk Alfvén wing versus the corresponding lobe fluxes. During the sub-Alfvénic driving, a cross section of the Alfvén wing is roughly circular, whereas the equivalent shape is flattened for the lobe fluxes during super-Alfvénic solar wind. Flow vorticity at the dusk Alfvén wing southern edge is localized between x = -15 and 5 RE, which maps to the relatively small region of MLT 5-11 in the northern polar cap. The velocity shear at the southern edge of the magnetospheric lobe fluxes extends from x = -50 to -10 RE, and correspondingly maps to the much larger MLT sector 5-23. These patterns of negative FAC represent the auroral morphology, occurring dominantly in the dawn day-side MLT sector (for the northern hemisphere) during the Alfvén wing interval.
MAGE reproduces northern hemisphere FAC observed by AMPERE remarkably well over the entire April 2023 storm (see Figures 2a and 3). Yet, the simulated northern and southern hemisphere FACs are relatively (mirror) symmetric (although weaker in the south), while the southern hemisphere is significantly different as observed by AMPERE (the reader is referred to AMPERE quicklook plots for comparison https://ampere.jhuapl.edu/products/), indicating a stronger response to night-side dynamics. As mentioned in Section 2, this discrepancy could be a data processing artifact, but the simulation also indicates cusp reconnection is less active in the southern hemisphere. Why the interhemispheric asymmetry is stronger in the observations remains to be understood.
Unraveling unique behavior of Earth’s Alfvén wings can help better understand analogous systems. Many plasma experiments operate in the sub-Alfvénic flow regime. Many outer planet moons are embedded either intermittently or continuously in sub-Alfvénic plasma flow. Europa, soon to be visited by JUICE and Europa Clipper, is the highest priority science target of such moons. The size and location of the polar cap, which is intimately connected with the Alfvén wing morphology, affects how energetic particles bombard the surface, which might be a key ingredient in the search for signs of life. Simulations and observations of Earth’s Alfvén wings can help to understand the possible signatures of Europa’s Alfvén wings before those missions arrive in the 2030s. In addition, some exoplanets orbit within the Alfvén zone of their host star, leaving them in a perpetual state of Alfvén wings. The aurora on such worlds may be similar to the Earth’s Alfvén wings.
6 Open Research
The MAGE simulation outputs are archived on the NCAR Derecho system. AMPERE data are available from JHU/APL https://ampere.jhuapl.edu/.
Acknowledgements.
We acknowledge high-performance computing support from the Derecho system (doi:10.5065/qx9a-pg09) provided by the NSF National Center for Atmospheric Research (NCAR), sponsored by the National Science Foundation. We acknowledge use of NASA/GSFC’s Space Physics Data Facility’s OMNIWeb (https://omniweb.gsfc.nasa.gov/). We thank the team of the Center for Geospace Storms for providing the MAGE model. We thank the AMPERE team and the AMPERE Science Data Center for providing data products derived from the Iridium Communications constellation, enabled by support from the National Science Foundation. Funding for this work is provided by the Partnership for Heliospheric and Space Environment Research (PHaSER) and MMS Early Career Grant 80NSSC25K7352. Work at DIAS was supported by Taighde Éireann - Research Ireland Laureate Consolidator award SOLMEX (CFB).References
- Anderson \BOthers. (\APACyear2021) \APACinsertmetastarAnderson2021{APACrefauthors}Anderson, B\BPBIJ., Angappan, R., Barik, A., Vines, S\BPBIK., Stanley, S., Bernasconi, P\BPBIN.\BDBLBarnes, R\BPBIJ. \APACrefYearMonthDay2021. \BBOQ\APACrefatitleIridium Communications Satellite Constellation Data for Study of Earth’s Magnetic Field Iridium communications satellite constellation data for study of earth’s magnetic field.\BBCQ \APACjournalVolNumPagesGeochemistry, Geophysics, Geosystems228e2020GC009515. {APACrefDOI} https://doi.org/10.1029/2020GC009515 \PrintBackRefs\CurrentBib
- Anderson \BOthers. (\APACyear2014) \APACinsertmetastarAnderson2014{APACrefauthors}Anderson, B\BPBIJ., Korth, H., Waters, C\BPBIL., Green, D\BPBIL., Merkin, V\BPBIG., Barnes, R\BPBIJ.\BCBL \BBA Dyrud, L\BPBIP. \APACrefYearMonthDay2014. \BBOQ\APACrefatitleDevelopment of large-scale Birkeland currents determined from the Active Magnetosphere and Planetary Electrodynamics Response Experiment Development of large-scale birkeland currents determined from the active magnetosphere and planetary electrodynamics response experiment.\BBCQ \APACjournalVolNumPagesGeophysical Research Letters4193017-3025. {APACrefDOI} https://doi.org/10.1002/2014GL059941 \PrintBackRefs\CurrentBib
- Anderson \BOthers. (\APACyear2017) \APACinsertmetastarAnderson2017{APACrefauthors}Anderson, B\BPBIJ., Korth, H., Welling, D\BPBIT., Merkin, V\BPBIG., Wiltberger, M\BPBIJ., Raeder, J.\BDBLRastaetter, L. \APACrefYearMonthDay2017. \BBOQ\APACrefatitleComparison of predictive estimates of high-latitude electrodynamics with observations of global-scale Birkeland currents Comparison of predictive estimates of high-latitude electrodynamics with observations of global-scale birkeland currents.\BBCQ \APACjournalVolNumPagesSpace Weather152352-373. {APACrefDOI} https://doi.org/10.1002/2016SW001529 \PrintBackRefs\CurrentBib
- Anderson \BOthers. (\APACyear2018) \APACinsertmetastarAnderson2018{APACrefauthors}Anderson, B\BPBIJ., Olson, C\BPBIN., Korth, H., Barnes, R\BPBIJ., Waters, C\BPBIL.\BCBL \BBA Vines, S\BPBIK. \APACrefYearMonthDay2018. \BBOQ\APACrefatitleTemporal and Spatial Development of Global Birkeland Currents Temporal and spatial development of global birkeland currents.\BBCQ \APACjournalVolNumPagesJournal of Geophysical Research: Space Physics12364785-4808. {APACrefDOI} https://doi.org/10.1029/2018JA025254 \PrintBackRefs\CurrentBib
- Anderson \BOthers. (\APACyear2002) \APACinsertmetastarAnderson2002{APACrefauthors}Anderson, B\BPBIJ., Takahashi, K., Kamei, T., Waters, C\BPBIL.\BCBL \BBA Toth, B\BPBIA. \APACrefYearMonthDay2002. \BBOQ\APACrefatitleBirkeland current system key parameters derived from Iridium observations: Method and initial validation results Birkeland current system key parameters derived from iridium observations: Method and initial validation results.\BBCQ \APACjournalVolNumPagesJournal of Geophysical Research: Space Physics107A6SMP 11-1-SMP 11-13. {APACrefDOI} https://doi.org/10.1029/2001JA000080 \PrintBackRefs\CurrentBib
- Andersson \BBA Ergun (\APACyear2012) \APACinsertmetastarAndersson2012{APACrefauthors}Andersson, L.\BCBT \BBA Ergun, R. \APACrefYearMonthDay2012. \BBOQ\APACrefatitleThe search for double layers in space plasmas The search for double layers in space plasmas.\BBCQ \APACjournalVolNumPagesAuroral phenomenology and magnetospheric processes: Earth And other planets197241–250. \PrintBackRefs\CurrentBib
- Beedle \BOthers. (\APACyear2024) \APACinsertmetastarBeedle2024{APACrefauthors}Beedle, J\BPBIM\BPBIH., Chen, L\BHBIJ., Shuster, J\BPBIR., Gurram, H., Gershman, D\BPBIJ., Chen, Y.\BDBLTorbert, R\BPBIB. \APACrefYearMonthDay2024. \BBOQ\APACrefatitleField-Aligned Current Structures During the Terrestrial Magnetosphere’s Transformation Into Alfvén Wings and Recovery Field-aligned current structures during the terrestrial magnetosphere’s transformation into alfvén wings and recovery.\BBCQ \APACjournalVolNumPagesGeophysical Research Letters5113e2024GL108839. {APACrefDOI} https://doi.org/10.1029/2024GL108839 \PrintBackRefs\CurrentBib
- Birkeland (\APACyear1908) \APACinsertmetastarBirkeland1908{APACrefauthors}Birkeland, K. \APACrefYear1908. \APACrefbtitleThe Norwegian aurora polaris expedition, 1902-1903 The norwegian aurora polaris expedition, 1902-1903 (\BVOL 1). \APACaddressPublisherChristiania, H. Aschelhoug. \PrintBackRefs\CurrentBib
- Birkeland (\APACyear1913) \APACinsertmetastarBirkeland1913{APACrefauthors}Birkeland, K. \APACrefYear1913. \APACrefbtitleThe Norwegian aurora polaris expedition, 1902-1903 The norwegian aurora polaris expedition, 1902-1903 (\BVOL 2). \APACaddressPublisherChristiania, H. Aschelhoug. \PrintBackRefs\CurrentBib
- Burkholder \BOthers. (\APACyear2024) \APACinsertmetastarBurkholder2024{APACrefauthors}Burkholder, B\BPBIL., Chen, L\BHBIJ., Sarantos, M., Gershman, D\BPBIJ., Argall, M\BPBIR., Chen, Y.\BDBLGurram, H. \APACrefYearMonthDay2024. \BBOQ\APACrefatitleGlobal Magnetic Reconnection During Sustained Sub-Alfvénic Solar Wind Driving Global magnetic reconnection during sustained sub-alfvénic solar wind driving.\BBCQ \APACjournalVolNumPagesGeophysical Research Letters516e2024GL108311. {APACrefDOI} https://doi.org/10.1029/2024GL108311 \PrintBackRefs\CurrentBib
- Chané \BOthers. (\APACyear2015) \APACinsertmetastarChane2015{APACrefauthors}Chané, E., Raeder, J., Saur, J., Neubauer, F\BPBIM., Maynard, K\BPBIM.\BCBL \BBA Poedts, S. \APACrefYearMonthDay2015. \BBOQ\APACrefatitleSimulations of the Earth’s magnetosphere embedded in sub-Alfvénic solar wind on 24 and 25 May 2002 Simulations of the earth’s magnetosphere embedded in sub-alfvénic solar wind on 24 and 25 may 2002.\BBCQ \APACjournalVolNumPagesJournal of Geophysical Research: Space Physics120108517-8528. {APACrefDOI} https://doi.org/10.1002/2015JA021515 \PrintBackRefs\CurrentBib
- Chané \BOthers. (\APACyear2012) \APACinsertmetastarChane2012{APACrefauthors}Chané, E., Saur, J., Neubauer, F\BPBIM., Raeder, J.\BCBL \BBA Poedts, S. \APACrefYearMonthDay2012. \BBOQ\APACrefatitleObservational evidence of Alfvén wings at the Earth Observational evidence of alfvén wings at the earth.\BBCQ \APACjournalVolNumPagesJournal of Geophysical Research: Space Physics117A9. {APACrefDOI} https://doi.org/10.1029/2012JA017628 \PrintBackRefs\CurrentBib
- Chen \BOthers. (\APACyear2024) \APACinsertmetastarChen2024{APACrefauthors}Chen, L\BHBIJ., Gershman, D., Burkholder, B., Chen, Y., Sarantos, M., Jian, L.\BDBLBurch, J. \APACrefYearMonthDay2024. \BBOQ\APACrefatitleEarth’s Alfvén Wings Driven by the April 2023 Coronal Mass Ejection Earth’s alfvén wings driven by the april 2023 coronal mass ejection.\BBCQ \APACjournalVolNumPagesGeophysical Research Letters5114e2024GL108894. {APACrefDOI} https://doi.org/10.1029/2024GL108894 \PrintBackRefs\CurrentBib
- Coxon \BOthers. (\APACyear2023) \APACinsertmetastarCoxon2023{APACrefauthors}Coxon, J\BPBIC., Chisham, G., Freeman, M\BPBIP., Forsyth, C., Walach, M\BHBIT., Murphy, K\BPBIR.\BDBLFogg, A\BPBIR. \APACrefYearMonthDay2023. \BBOQ\APACrefatitleExtreme Birkeland Currents Are More Likely During Geomagnetic Storms on the Dayside of the Earth Extreme birkeland currents are more likely during geomagnetic storms on the dayside of the earth.\BBCQ \APACjournalVolNumPagesJournal of Geophysical Research: Space Physics12812e2023JA031946. {APACrefDOI} https://doi.org/10.1029/2023JA031946 \PrintBackRefs\CurrentBib
- Coxon \BOthers. (\APACyear2016) \APACinsertmetastarCoxon2016{APACrefauthors}Coxon, J\BPBIC., Milan, S\BPBIE., Carter, J\BPBIA., Clausen, L\BPBIB\BPBIN., Anderson, B\BPBIJ.\BCBL \BBA Korth, H. \APACrefYearMonthDay2016. \BBOQ\APACrefatitleSeasonal and diurnal variations in AMPERE observations of the Birkeland currents compared to modeled results Seasonal and diurnal variations in ampere observations of the birkeland currents compared to modeled results.\BBCQ \APACjournalVolNumPagesJournal of Geophysical Research: Space Physics12154027-4040. {APACrefDOI} https://doi.org/10.1002/2015JA022050 \PrintBackRefs\CurrentBib
- Crowley (\APACyear1991) \APACinsertmetastarCrowley1991{APACrefauthors}Crowley, G. \APACrefYearMonthDay1991. \BBOQ\APACrefatitleDynamics of the Earth’s Thermosphere: A Review Dynamics of the earth’s thermosphere: A review.\BBCQ \APACjournalVolNumPagesReviews of Geophysics29S21143-1165. {APACrefURL} https://agupubs.onlinelibrary.wiley.com/doi/abs/10.1002/rog.1991.29.s2.1143 {APACrefDOI} https://doi.org/10.1002/rog.1991.29.s2.1143 \PrintBackRefs\CurrentBib
- Gurram \BOthers. (\APACyear2025) \APACinsertmetastarGurram2025{APACrefauthors}Gurram, H., Shuster, J\BPBIR., Chen, L\BHBIJ., Hasegawa, H., Denton, R\BPBIE., Burkholder, B\BPBIL.\BDBLBurch, J. \APACrefYearMonthDay2025. \BBOQ\APACrefatitleEarth’s Alfvén Wings: Unveiling Dynamic Variations of Field-Line Topologies With Electron Distributions Earth’s alfvén wings: Unveiling dynamic variations of field-line topologies with electron distributions.\BBCQ \APACjournalVolNumPagesGeophysical Research Letters523e2024GL111931. {APACrefDOI} https://doi.org/10.1029/2024GL111931 \PrintBackRefs\CurrentBib
- Hajra \BBA Tsurutani (\APACyear2022) \APACinsertmetastarHajra2022{APACrefauthors}Hajra, R.\BCBT \BBA Tsurutani, B\BPBIT. \APACrefYearMonthDay2022feb. \BBOQ\APACrefatitleNear-Earth Sub-Alfvénic Solar Winds: Interplanetary Origins and Geomagnetic Impacts Near-earth sub-alfvénic solar winds: Interplanetary origins and geomagnetic impacts.\BBCQ \APACjournalVolNumPagesThe Astrophysical Journal9262135. {APACrefURL} https://dx.doi.org/10.3847/1538-4357/ac4471 {APACrefDOI} 10.3847/1538-4357/ac4471 \PrintBackRefs\CurrentBib
- Hasegawa \BOthers. (\APACyear1979) \APACinsertmetastarHasegawa1979{APACrefauthors}Hasegawa, A., Sato, T.\BCBL \BBA Akasofu, S. \APACrefYearMonthDay1979. \BBOQ\APACrefatitleDynamics of the Magnetosphere Dynamics of the magnetosphere.\BBCQ \APACjournalVolNumPagesEdited by S.-l. Akasofu. Highham, Mass.: D. Reidel. \PrintBackRefs\CurrentBib
- Iijima \BBA Potemra (\APACyear1976) \APACinsertmetastarIijima1976{APACrefauthors}Iijima, T.\BCBT \BBA Potemra, T\BPBIA. \APACrefYearMonthDay1976. \BBOQ\APACrefatitleThe amplitude distribution of field-aligned currents at northern high latitudes observed by Triad The amplitude distribution of field-aligned currents at northern high latitudes observed by triad.\BBCQ \APACjournalVolNumPagesJournal of Geophysical Research (1896-1977)81132165-2174. {APACrefDOI} https://doi.org/10.1029/JA081i013p02165 \PrintBackRefs\CurrentBib
- Iijima \BBA Potemra (\APACyear1978) \APACinsertmetastarIijima1978{APACrefauthors}Iijima, T.\BCBT \BBA Potemra, T\BPBIA. \APACrefYearMonthDay1978. \BBOQ\APACrefatitleLarge-scale characteristics of field-aligned currents associated with substorms Large-scale characteristics of field-aligned currents associated with substorms.\BBCQ \APACjournalVolNumPagesJournal of Geophysical Research: Space Physics83A2599-615. {APACrefDOI} https://doi.org/10.1029/JA083iA02p00599 \PrintBackRefs\CurrentBib
- Kaeppler \BOthers. (\APACyear2015) \APACinsertmetastarKaeppler2015{APACrefauthors}Kaeppler, S\BPBIR., Hampton, D\BPBIL., Nicolls, M\BPBIJ., Strømme, A., Solomon, S\BPBIC., Hecht, J\BPBIH.\BCBL \BBA Conde, M\BPBIG. \APACrefYearMonthDay2015. \BBOQ\APACrefatitleAn investigation comparing ground-based techniques that quantify auroral electron flux and conductance An investigation comparing ground-based techniques that quantify auroral electron flux and conductance.\BBCQ \APACjournalVolNumPagesJournal of Geophysical Research: Space Physics120109038-9056. {APACrefDOI} https://doi.org/10.1002/2015JA021396 \PrintBackRefs\CurrentBib
- Lavraud \BOthers. (\APACyear2002) \APACinsertmetastarLavraud2002{APACrefauthors}Lavraud, B., Dunlop, M., Phan, T., Rème, H., Bosqued, J., Dandouras, I.\BDBLBalogh, A. \APACrefYearMonthDay200210. \BBOQ\APACrefatitleCluster observations of the exterior cusp and its surrounding boundaries under northward IMF Cluster observations of the exterior cusp and its surrounding boundaries under northward imf.\BBCQ \APACjournalVolNumPagesGeophysical Research Letters, v.29 (2002)29. {APACrefDOI} 10.1029/2002GL015464 \PrintBackRefs\CurrentBib
- Lin \BOthers. (\APACyear2021) \APACinsertmetastarLin2021{APACrefauthors}Lin, D., Sorathia, K., Wang, W., Merkin, V., Bao, S., Pham, K.\BDBLAnderson, B. \APACrefYearMonthDay2021. \BBOQ\APACrefatitleThe Role of Diffuse Electron Precipitation in the Formation of Subauroral Polarization Streams The role of diffuse electron precipitation in the formation of subauroral polarization streams.\BBCQ \APACjournalVolNumPagesJournal of Geophysical Research: Space Physics12612e2021JA029792. {APACrefDOI} https://doi.org/10.1029/2021JA029792 \PrintBackRefs\CurrentBib
- Liu \BOthers. (\APACyear2022) \APACinsertmetastarLiu2022{APACrefauthors}Liu, T\BPBIZ., Wang, C\BHBIP., Wang, X., Angelopoulos, V., Zhang, H., Lu, X.\BCBL \BBA Lin, Y. \APACrefYearMonthDay2022. \BBOQ\APACrefatitleMagnetospheric Field-Aligned Current Generation by Foreshock Transients: Contribution by Flow Vortices and Pressure Gradients Magnetospheric field-aligned current generation by foreshock transients: Contribution by flow vortices and pressure gradients.\BBCQ \APACjournalVolNumPagesJournal of Geophysical Research: Space Physics12711e2022JA030700. {APACrefDOI} https://doi.org/10.1029/2022JA030700 \PrintBackRefs\CurrentBib
- Merkin \BBA Lyon (\APACyear2010) \APACinsertmetastarMerkin2010{APACrefauthors}Merkin, V\BPBIG.\BCBT \BBA Lyon, J\BPBIG. \APACrefYearMonthDay2010. \BBOQ\APACrefatitleEffects of the low-latitude ionospheric boundary condition on the global magnetosphere Effects of the low-latitude ionospheric boundary condition on the global magnetosphere.\BBCQ \APACjournalVolNumPagesJournal of Geophysical Research: Space Physics115A10. {APACrefDOI} https://doi.org/10.1029/2010JA015461 \PrintBackRefs\CurrentBib
- Papitashvili \BBA King (\APACyear2020) \APACinsertmetastaromni1min{APACrefauthors}Papitashvili, N\BPBIE.\BCBT \BBA King, J\BPBIH. \APACrefYearMonthDay2020. \APACrefbtitleOMNI 1-min Data, NASA Space Physics Data Facility. Omni 1-min data, nasa space physics data facility. \APACrefnoteAccessed: 2025-02-21 {APACrefDOI} https://doi.org/10.48322/45bb-8792 \PrintBackRefs\CurrentBib
- Pedersen \BOthers. (\APACyear2021) \APACinsertmetastarPederson2021{APACrefauthors}Pedersen, M\BPBIN., Vanhamäki, H., Aikio, A\BPBIT., Käki, S., Workayehu, A\BPBIB., Waters, C\BPBIL.\BCBL \BBA Gjerloev, J\BPBIW. \APACrefYearMonthDay2021. \BBOQ\APACrefatitleField-Aligned and Ionospheric Currents by AMPERE and SuperMAG During HSS/SIR-Driven Storms Field-aligned and ionospheric currents by ampere and supermag during hss/sir-driven storms.\BBCQ \APACjournalVolNumPagesJournal of Geophysical Research: Space Physics12611e2021JA029437. {APACrefDOI} https://doi.org/10.1029/2021JA029437 \PrintBackRefs\CurrentBib
- Pilipenko (\APACyear2021) \APACinsertmetastarPilipenko2021{APACrefauthors}Pilipenko, V\BPBIA. \APACrefYearMonthDay2021. \BBOQ\APACrefatitleSpace weather impact on ground-based technological systems Space weather impact on ground-based technological systems.\BBCQ \APACjournalVolNumPagesSolar-Terrestrial Physics7368–104. \PrintBackRefs\CurrentBib
- Ridley (\APACyear2007) \APACinsertmetastarRidley2007{APACrefauthors}Ridley, A\BPBIJ. \APACrefYearMonthDay2007. \BBOQ\APACrefatitleAlfvén wings at Earth’s magnetosphere under strong interplanetary magnetic fields Alfvén wings at earth’s magnetosphere under strong interplanetary magnetic fields.\BBCQ \APACjournalVolNumPagesAnnales Geophysicae252533–542. {APACrefURL} https://angeo.copernicus.org/articles/25/533/2007/ {APACrefDOI} 10.5194/angeo-25-533-2007 \PrintBackRefs\CurrentBib
- Robinson \BOthers. (\APACyear1987) \APACinsertmetastarRobinson1987{APACrefauthors}Robinson, R\BPBIM., Vondrak, R\BPBIR., Miller, K., Dabbs, T.\BCBL \BBA Hardy, D. \APACrefYearMonthDay1987. \BBOQ\APACrefatitleOn calculating ionospheric conductances from the flux and energy of precipitating electrons On calculating ionospheric conductances from the flux and energy of precipitating electrons.\BBCQ \APACjournalVolNumPagesJournal of Geophysical Research: Space Physics92A32565-2569. {APACrefDOI} https://doi.org/10.1029/JA092iA03p02565 \PrintBackRefs\CurrentBib
- Sato \BBA Iijima (\APACyear1979) \APACinsertmetastarSato1979{APACrefauthors}Sato, T.\BCBT \BBA Iijima, T. \APACrefYearMonthDay1979. \BBOQ\APACrefatitlePrimary sources of large-scale Birkeland currents Primary sources of large-scale birkeland currents.\BBCQ \APACjournalVolNumPagesSpace Science Reviews243347–366. \PrintBackRefs\CurrentBib
- Sorathia \BOthers. (\APACyear2020) \APACinsertmetastarSorathia2020{APACrefauthors}Sorathia, K\BPBIA., Merkin, V\BPBIG., Panov, E\BPBIV., Zhang, B., Lyon, J\BPBIG., Garretson, J.\BDBLWiltberger, M. \APACrefYearMonthDay2020. \BBOQ\APACrefatitleBallooning-Interchange Instability in the Near-Earth Plasma Sheet and Auroral Beads: Global Magnetospheric Modeling at the Limit of the MHD Approximation Ballooning-interchange instability in the near-earth plasma sheet and auroral beads: Global magnetospheric modeling at the limit of the mhd approximation.\BBCQ \APACjournalVolNumPagesGeophysical Research Letters4714e2020GL088227. {APACrefDOI} https://doi.org/10.1029/2020GL088227 \PrintBackRefs\CurrentBib
- Sorathia \BOthers. (\APACyear2023) \APACinsertmetastarSorathia2023{APACrefauthors}Sorathia, K\BPBIA., Michael, A., Merkin, V\BPBIG., Ohtani, S., Keesee, A\BPBIM., Sciola, A.\BDBLPulkkinen, A. \APACrefYearMonthDay2023. \BBOQ\APACrefatitleMultiscale Magnetosphere-Ionosphere Coupling During Stormtime: A Case Study of the Dawnside Current Wedge Multiscale magnetosphere-ionosphere coupling during stormtime: A case study of the dawnside current wedge.\BBCQ \APACjournalVolNumPagesJournal of Geophysical Research: Space Physics12811e2023JA031594. {APACrefDOI} https://doi.org/10.1029/2023JA031594 \PrintBackRefs\CurrentBib
- Sorathia \BOthers. (\APACyear2024) \APACinsertmetastarSorathia2024{APACrefauthors}Sorathia, K\BPBIA., Shumko, M., Sciola, A., Michael, A., Merkin, V\BPBIG., Gallardo-Lacourt, B.\BDBLUkhorskiy, A\BPBIY. \APACrefYearMonthDay2024. \BBOQ\APACrefatitleIdentifying the Magnetospheric Drivers of Giant Undulations: Global Modeling of the Evolving Inner Magnetosphere and Its Auroral Manifestations Identifying the magnetospheric drivers of giant undulations: Global modeling of the evolving inner magnetosphere and its auroral manifestations.\BBCQ \APACjournalVolNumPagesGeophysical Research Letters5116e2024GL110772. {APACrefDOI} https://doi.org/10.1029/2024GL110772 \PrintBackRefs\CurrentBib
- Toffoletto \BOthers. (\APACyear2003) \APACinsertmetastarToffoletto2003{APACrefauthors}Toffoletto, F., Sazykin, S., Spiro, R.\BCBL \BBA Wolf, R. \APACrefYearMonthDay2003. \BBOQ\APACrefatitleInner magnetospheric modeling with the Rice Convection Model Inner magnetospheric modeling with the rice convection model.\BBCQ \APACjournalVolNumPagesSpace science reviews107175–196. \PrintBackRefs\CurrentBib
- Waters \BOthers. (\APACyear2020) \APACinsertmetastarWaters2020{APACrefauthors}Waters, C\BPBIL., Anderson, B\BPBIJ., Green, D\BPBIL., Korth, H., Barnes, R\BPBIJ.\BCBL \BBA Vanhamäki, H. \APACrefYearMonthDay2020. \BBOQ\APACrefatitleScience Data Products for AMPERE Science data products for ampere.\BBCQ \BIn M\BPBIW. Dunlop \BBA H. Lühr (\BEDS), \APACrefbtitleIonospheric Multi-Spacecraft Analysis Tools: Approaches for Deriving Ionospheric Parameters Ionospheric multi-spacecraft analysis tools: Approaches for deriving ionospheric parameters (\BPGS 141–165). \APACaddressPublisherChamSpringer International Publishing. {APACrefURL} https://doi.org/10.1007/978-3-030-26732-2_7 {APACrefDOI} 10.1007/978-3-030-26732-2_7 \PrintBackRefs\CurrentBib
- Wilder \BOthers. (\APACyear2019) \APACinsertmetastarWilder2019{APACrefauthors}Wilder, F\BPBID., Lopez, R\BPBIE., Eriksson, S., Pham, K.\BCBL \BBA Lin, D. \APACrefYearMonthDay2019. \BBOQ\APACrefatitleThe Relative Importance of Geoeffective Length Versus Alfvén Wing Formation in the Saturation of the Ionospheric Reverse Convection Potential The relative importance of geoeffective length versus alfvén wing formation in the saturation of the ionospheric reverse convection potential.\BBCQ \APACjournalVolNumPagesGeophysical Research Letters4631126-1131. {APACrefDOI} https://doi.org/10.1029/2018GL080639 \PrintBackRefs\CurrentBib
- Zhang \BOthers. (\APACyear2019) \APACinsertmetastarZhang2019{APACrefauthors}Zhang, B., Sorathia, K\BPBIA., Lyon, J\BPBIG., Merkin, V\BPBIG., Garretson, J\BPBIS.\BCBL \BBA Wiltberger, M. \APACrefYearMonthDay2019sep. \BBOQ\APACrefatitleGAMERA: A Three-dimensional Finite-volume MHD Solver for Non-orthogonal Curvilinear Geometries GAMERA: A three-dimensional finite-volume MHD solver for non-orthogonal curvilinear geometries.\BBCQ \APACjournalVolNumPagesThe Astrophysical Journal Supplement Series244120. {APACrefURL} https://doi.org/10.3847/1538-4365/ab3a4c {APACrefDOI} 10.3847/1538-4365/ab3a4c \PrintBackRefs\CurrentBib
- Zmuda \BOthers. (\APACyear1966) \APACinsertmetastarZmuda1966{APACrefauthors}Zmuda, A\BPBIJ., Martin, J\BPBIH.\BCBL \BBA Heuring, F\BPBIT. \APACrefYearMonthDay1966. \BBOQ\APACrefatitleTransverse magnetic disturbances at 1100 kilometers in the auroral region Transverse magnetic disturbances at 1100 kilometers in the auroral region.\BBCQ \APACjournalVolNumPagesJournal of Geophysical Research (1896-1977)71215033-5045. {APACrefDOI} https://doi.org/10.1029/JZ071i021p05033 \PrintBackRefs\CurrentBib