Quantum critical electro-optic and piezo-electric nonlinearities
Abstract
Electro-optics, the tuning of optical properties of materials with electric fields, is key to a multitude of quantum and classical photonics applications45. However, a major obstacle preventing many emerging use cases is inefficient modulation in cryogenic environments, as traditional tuning mechanisms degrade at low temperatures38, 8. Guided by the connection between phase transitions and nonlinearity, we identify the quantum paraelectric perovskite SrTiO3 (STO) as the strongest cryogenic electro-optic photonic material. As a result of the unique quantum paraelectric phase of STO, we demonstrate a dynamically tunable linear Pockels coefficient () exceeding 500 pm/V at K, and study its full temperature and bias dependence. We also measure an enhanced piezo-electric coefficient () above 90 pC/N. Both of these coefficients exceed all previously reported values for cryogenic materials, including lithium niobate ( pm/V) and barium titanate ( pm/V)56, 8, 21. Furthermore, by tuning STO towards quantum criticality with oxygen isotope substitution24 we more than double the optical and piezo-electric nonlinearities, demonstrating a linear Pockels coefficient above 1100 pm/V. Our results probe the link between quantum phase transitions, dielectric susceptibility, and optical nonlinearities, unlocking opportunities in cryogenic optical and mechanical systems, and provide a framework for discovering new nonlinear materials.
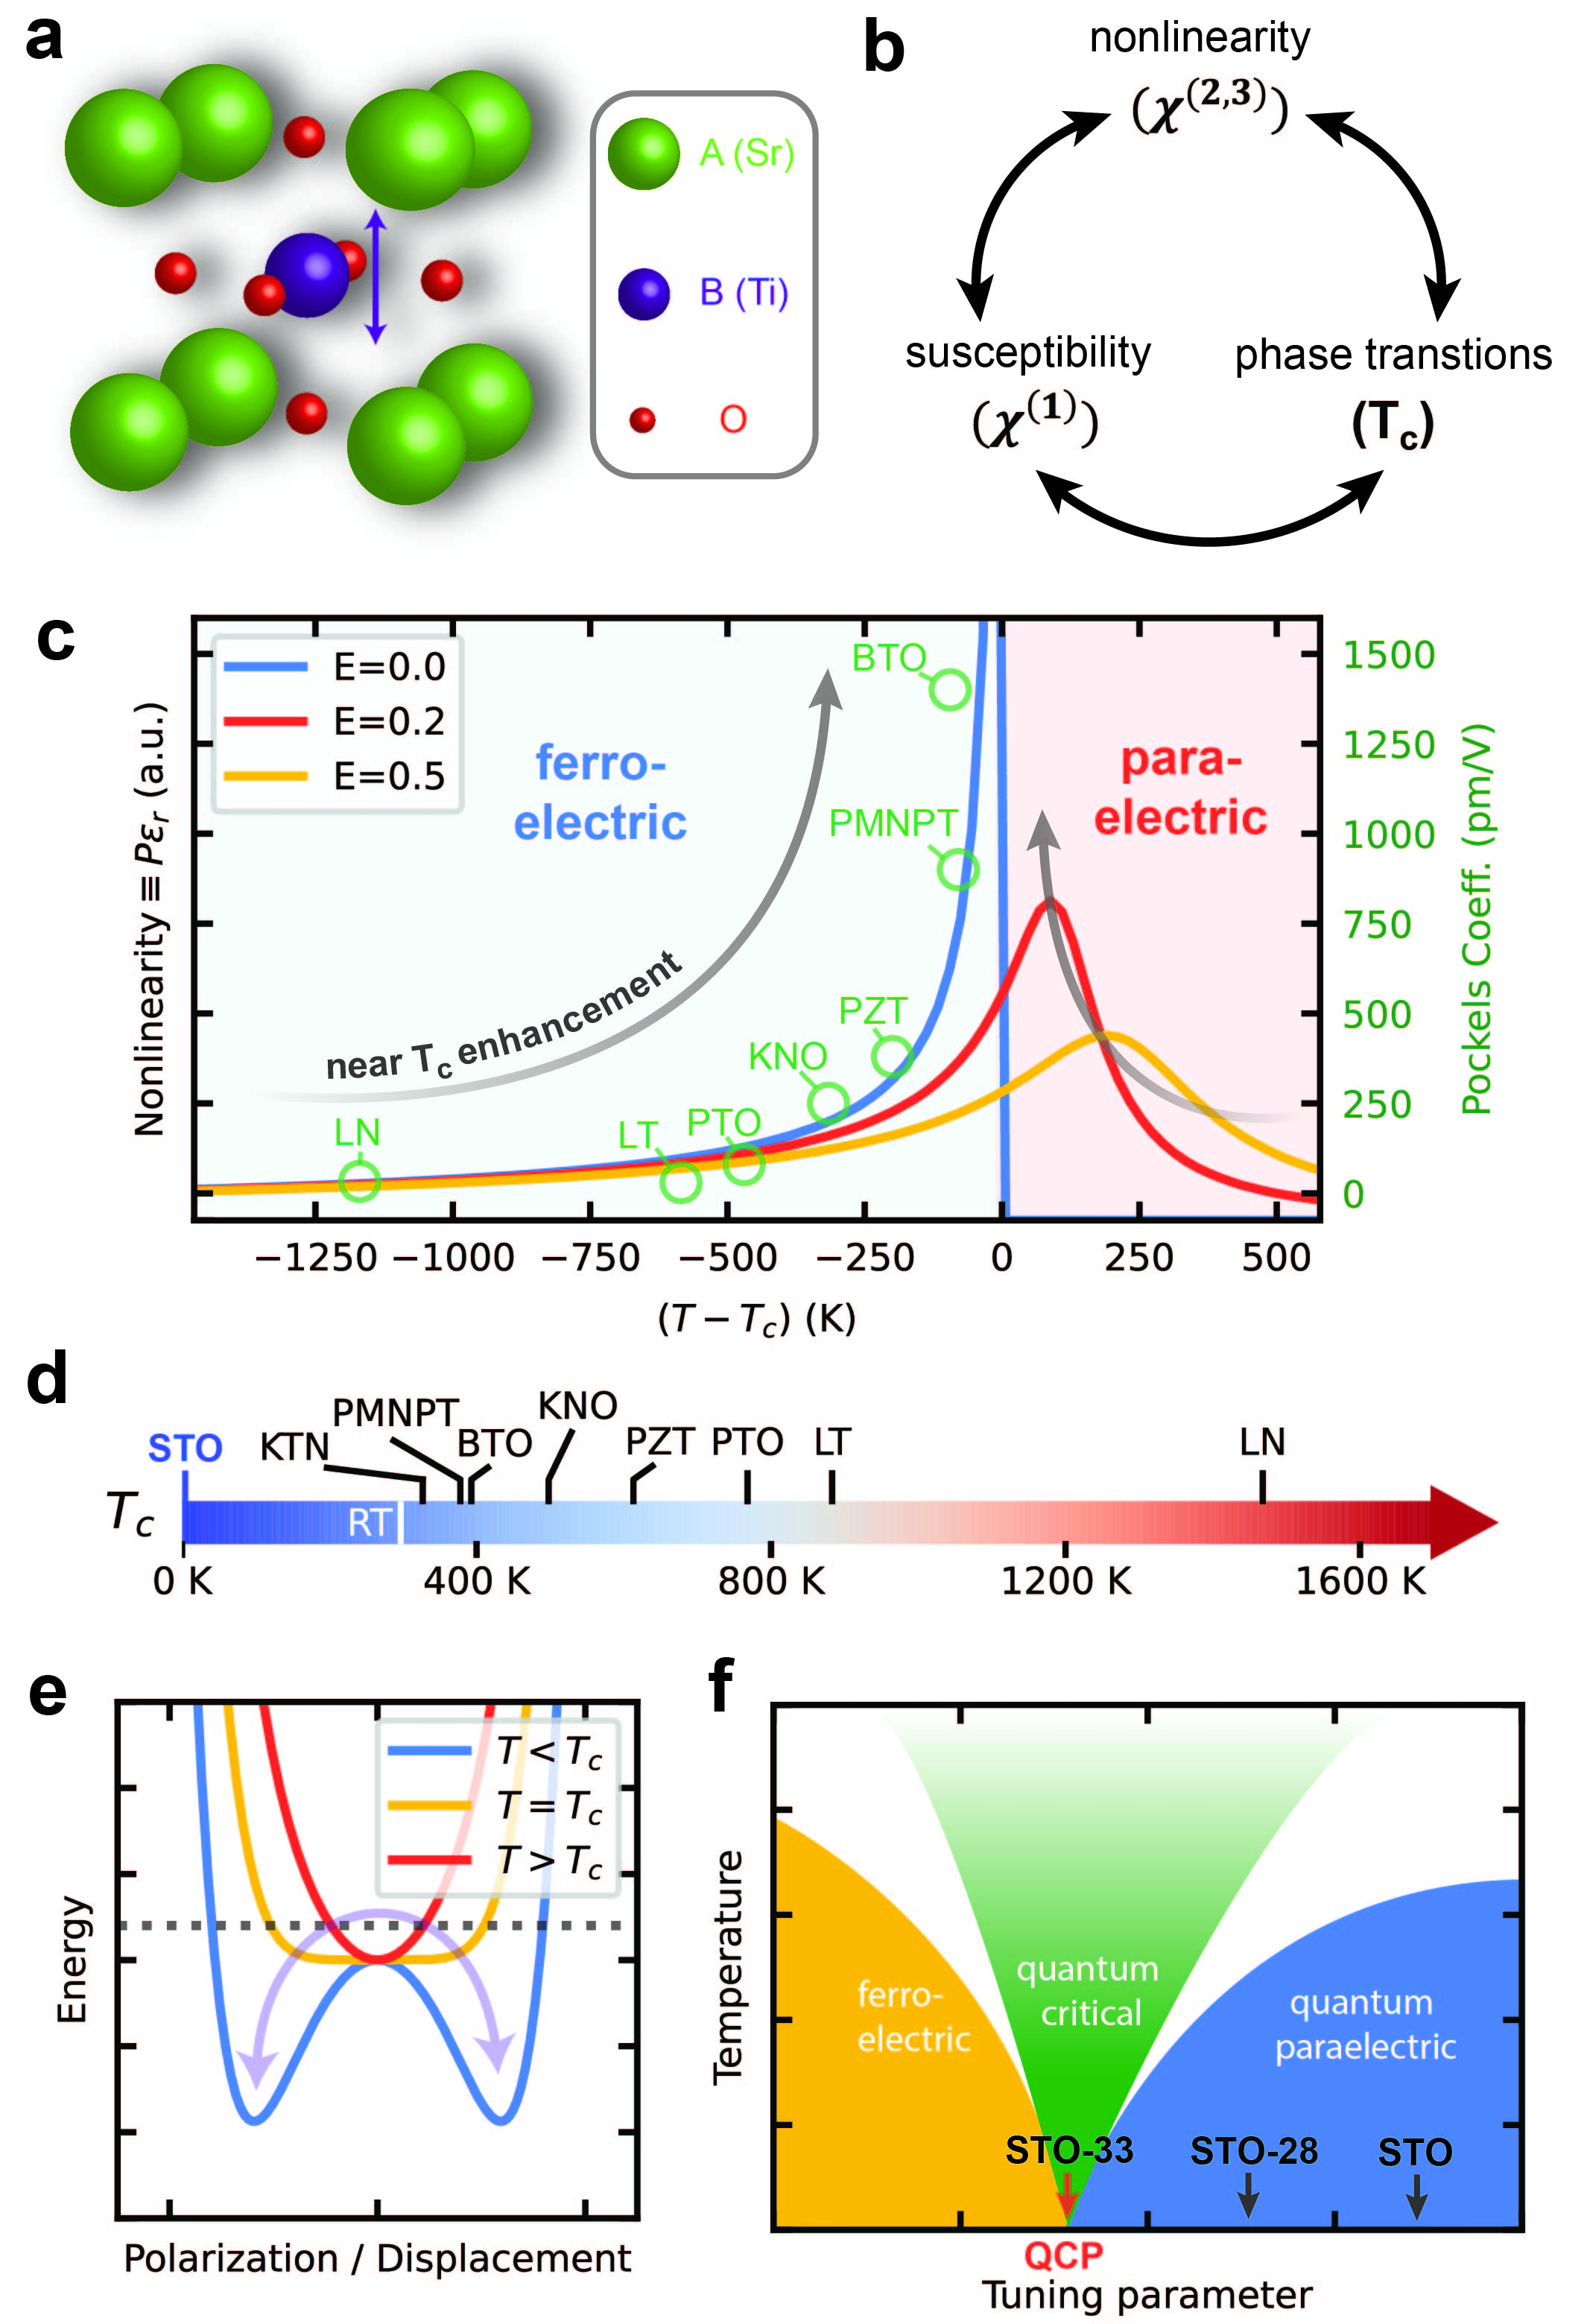
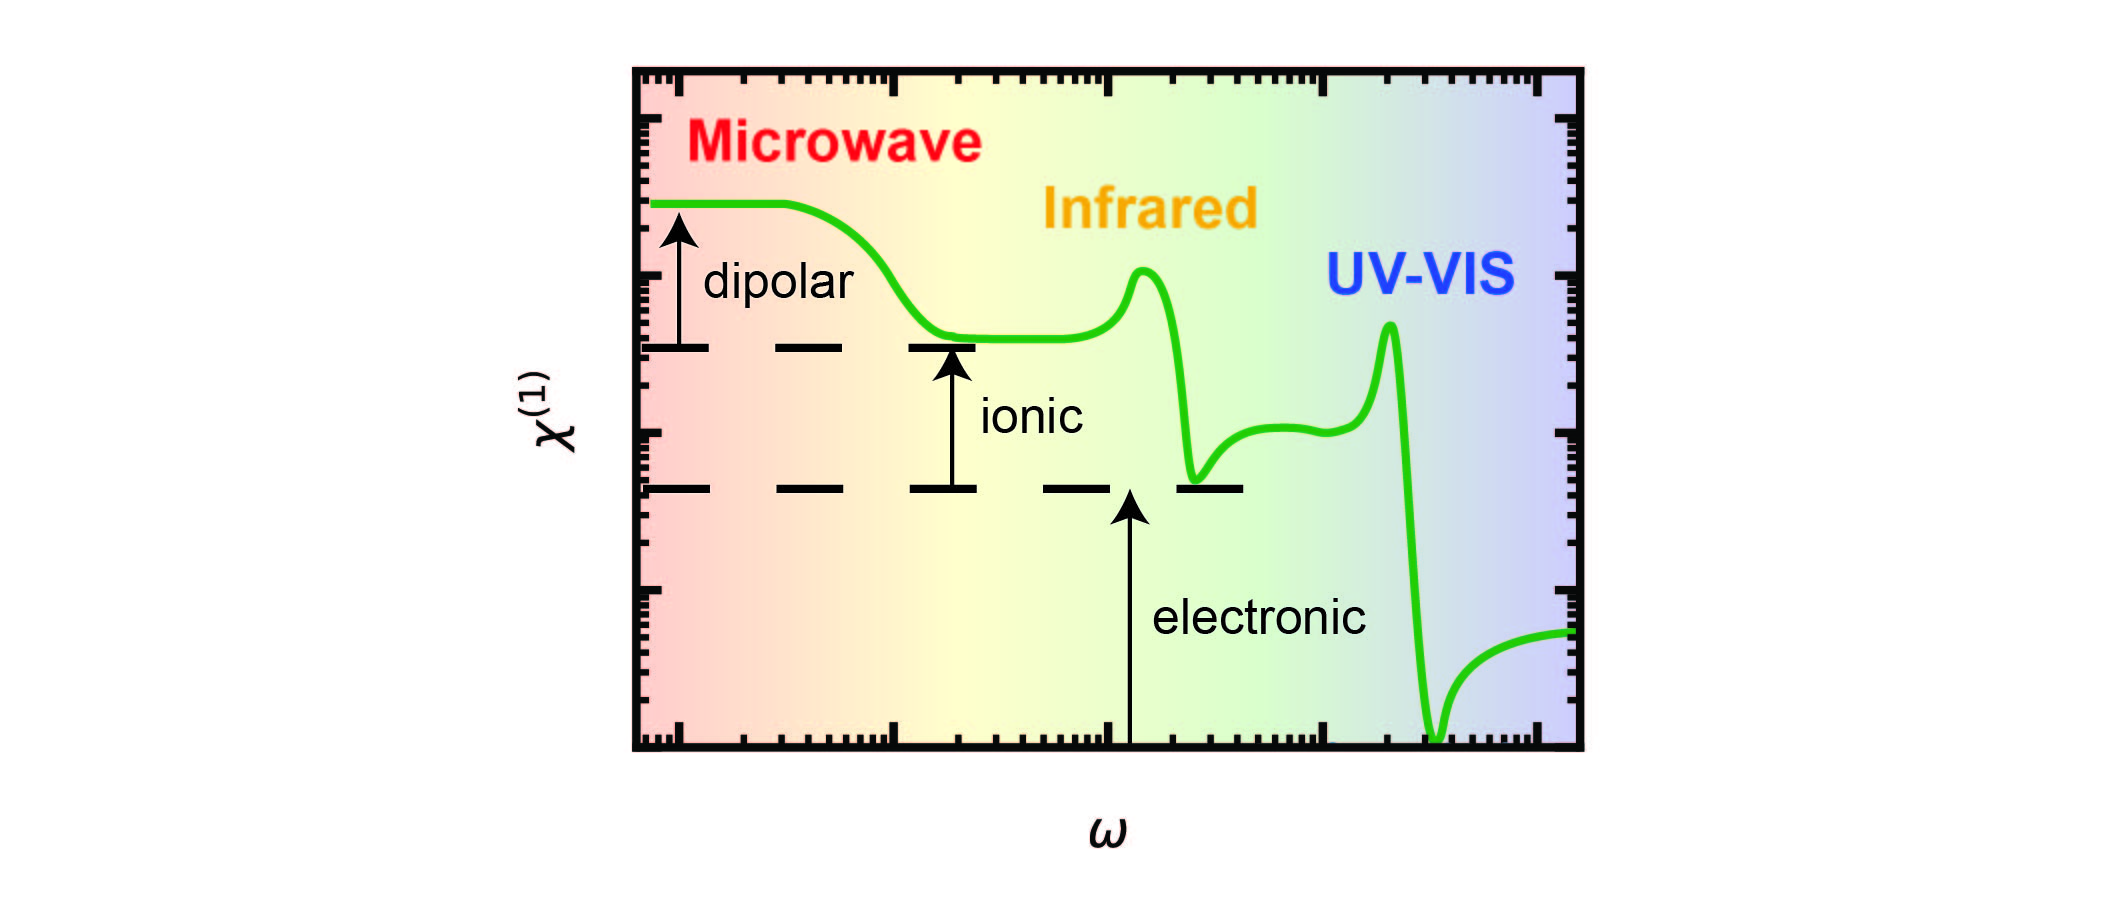
Developments in nonlinear optical materials underpin a wide range of scientific and technical advances, from driving communications worldwide to the creation of entangled photons 7, 45. On the other hand, piezo-electric materials find use in energy harvesting, actuators, medical devices, and beyond 46. To date, the leading materials for both of these applications are largely ferroelectrics, commonly of the perovskite structure ABO3 (Fig. 1a). While this class of materials share a crystal structure, different materials, such as lithium niobate (LN), lithium tantalate (LT), barium titanate (BTO) and lead zirconate titanate (PZT) have drastically different strengths of these nonlinearities56, 53, 8, 52, 11. In fact, the strongest nonlinear materials only show a narrow temperature range where the piezo-electric and electro-optic effects are maximized. This is a critical problem for cryogenic and quantum applications, which commonly desire operation temperatures at or below K to match cryostat technology based on liquid helium.
For example, quantum transducers between the microwave and optical domains require strong nonlinearity in both the optical and/or mechanical domain to create scalable modular quantum computers10, 25. With high nonlinearity, such systems would also enable high speed, low power interconnects for low-temperature applications in high energy physics and superconducting classical computing– mitigating the wiring and heating problems with microwave cryogenic control and readout 57, 43. Optimized cryogenic electro-optic optical switches would also form the backbone of photonic-based quantum computing2, 1 and provide the needed cryogenic photonic controls for defect centers, trapped atoms, and ions 30, 42, 44. For mechanical systems, strong cryogenic piezo-electric effects are also desired in space-based missions for adaptive optics, actuators, and cryogen fuel transfer, for example60.
Unfortunately, ferroelectric nonlinearities, plasma dispersion and thermo-optic tuning mechanisms usually decrease dramatically at cryogenic temperatures8, 38. Therefore, there is a distinct need for nonlinear materials optimized for low temperatures.
Linking nonlinearity and phase transitions
We begin with a theoretical understanding of the origin of both piezo-electric and electro-optic nonlinearities in paraelectric and ferroelectric systems, and use this understanding to guide and optimize the identification of new materials for cryogenic operation (Fig. 1b). To start, Miller’s rule in optics is an empirical relationship linking nonlinear and linear optical susceptibilities, applicable to a wide range of materials15, 41, 3. It can be directly linked to a classical Lorentz model under the assumption of weak anharmonic perturbation31. Miller’s rules state that the nonlinear susceptibilities (such as , three-wave mixing) are proportional to the product of the linear susceptibilities () at the frequencies that describe the nonlinearity. Here, the proportionality constant, , is related to the electrical polarization, . As a result of Miller’s rules, for the electro-optic effect, we find (details in SI Section S1):
| (1) |
, are the index of refraction and quasi-static relative dielectric constant, respectively. With the electro-optic Pockels coefficient , then, for most optical materials. Beyond this heuristic, there is an even deeper link between the dielectric behavior and the nonlinearity of paraelectric and ferroelectric perovskites. Surprisingly, the linear electro-optic effect and the linear piezo-electric effect can be directly linked to the corresponding quadratic nonlinearities: the Kerr12, 6 and electrostrictive effects5, 35. These have a common form across materials. For example, electrostriction is the basis of electromechanical coupling in all insulators 35. Valid for both the paraelectric and ferroelectric state, the response of either an electrically biased system or a system with a spontaneous or remnant polarization can be framed as the result of a biasing polarization (). As a result, we find the Pockels coefficient and the piezo-electric coefficient , in Voigt notation (SI Section S2):
| (2) |
| (3) |
The result is that both Pockels and piezo-electric nonlinearities are proportional to the product of the dielectric constant and the bias polarization, the same as the treatment by Miller for optics (Equation 1). We therefore propose this new, general metric for piezo-electricity and electro-optic effects: . Surprisingly, both Miller’s and the coefficients , have been found to remain within approximately a factor of two for all materials 3, 47. This is also why the best piezo-electric materials are often the best electro-optic materials. As most ferroelectrics and paraelectrics have similar maximum polarization, the main determination of nonlinearity in ferroelectric materials is the dielectric constant.
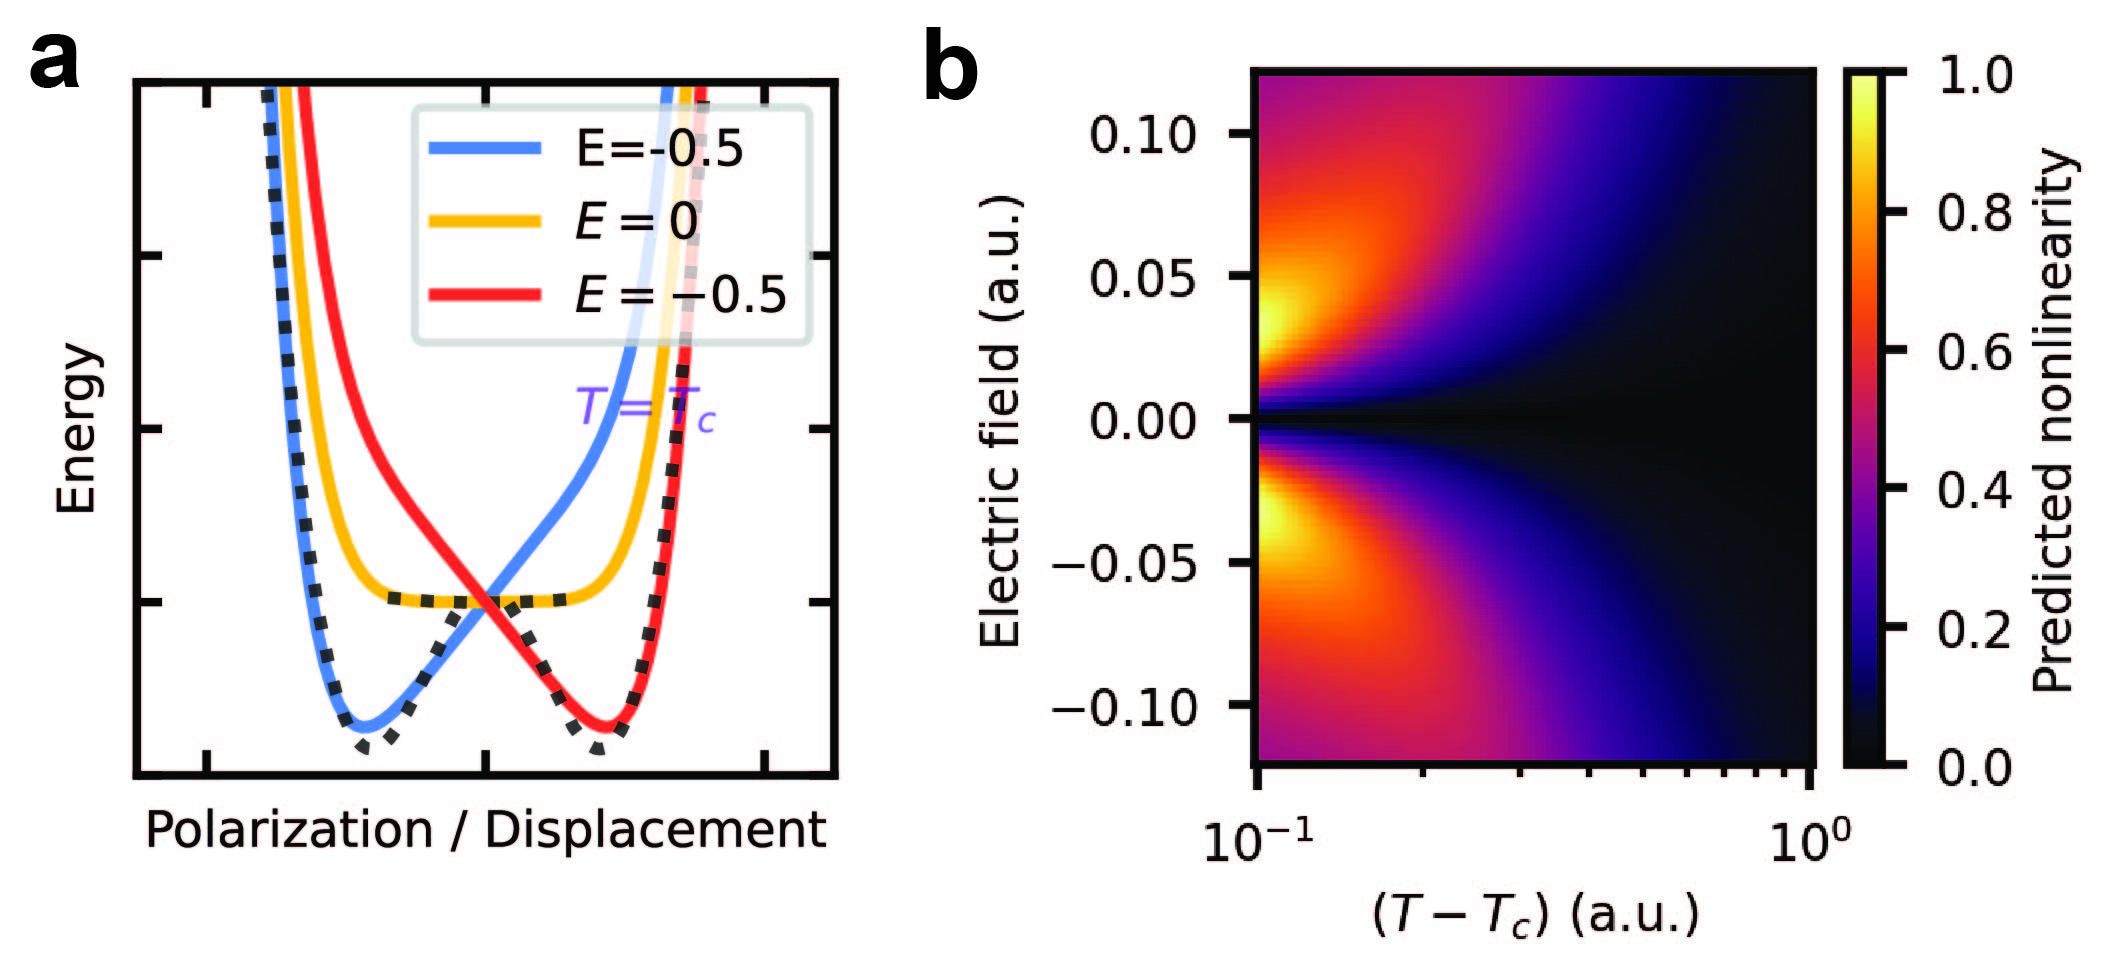
can be computed directly as a function of temperature and electric field using a simplified Landau-Ginzburg-Devonshire (LGD) model for the ferroelectric-paraelectric phase transition at Curie temperature (Methods). This results in a deep link between nonlinearity and phase transitions (Fig. 1b,c). At zero bias, we see in Fig. 1c that no Pockels or piezo-electric nonlinearity will exist above in the nonpolar paraelectric state, as expected. Below , we observe a sharp diverging structure that decreases as becomes lower than . Surprisingly, this simple model can fairly well predict the expected nonlinearity of leading electro-optic crystals, shown in Fig. 1c and d. Materials that operate near have enhanced nonlinearity, largely due to a greatly increased dielectric constant, related to the Curie-Weiss law. Intuitively, the increase in dielectric constant near the phase transition can be understood by considering a plot of the Gibbs free energy as a function of electrical polarization (Fig. 1e). As the temperature approaches from above, the energy curve flattens around zero polarization, indicating a low energy cost for a large change in polarization: in other words, an increase in linear susceptibility and dielectric constant. Below , the dielectric constant decreases again as the system relaxes into one of two (non-zero) polarization states at the minimum of the Gibbs free energy.
On the other hand, materials in the paraelectric state but still near display large quadratic and induced nonlinearity with an electric field. This result is consistent with reports of giant electro-optic Kerr and electrostrictive effects of paraelectric materials near at room temperature59, 22. In fact, upon biasing, in Fig. 1c we see that the maximum performance can be pushed into the paraelectric state.
This simplified treatment solidifies the connection of nonlinearity to phase transitions, providing a framework for the discovery of new nonlinear materials. Specifically, nonlinear materials should be chosen largely by the operating temperature of the application. The strongest room temperature piezo-electric and electro-optic active crystals have a near room temperature by design (Fig. 1d). However, no existing materials discovered and optimized for room temperature will be optimal for cryogenic applications. Instead, materials with K phase transitions are desired.
Optical and mechanical nonlinearity in SrTiO3
The perovskite strontium titanate (SrTiO3, STO) is exactly such a material (Fig. 1a). STO displays a high index (2.284 at 1550 nm), wide transparency between 400 nm and 2000 nm owing to a wide bandgap (3.25 eV) and is thus suitable for photonics applications36. In addition, the low temperature phase transition of STO is unique. As STO cools, it never undergoes a paraelectric-to-ferroelectric phase transition, entering instead a new state of “quantum paraelectricity” where quantum fluctuations suppress the crystallization of a ferroelectric state33, 28 (Fig. 1e). This behavior is intrinsically linked to the existence of a quantum critical point at zero temperature (Fig. 1f). As a result, it has been subject of extensive studies in condensed matter physics, displaying superconductivity, magnetoelectricity, quantum phase transitions, and floquet driven transient phases26, 39, 28.
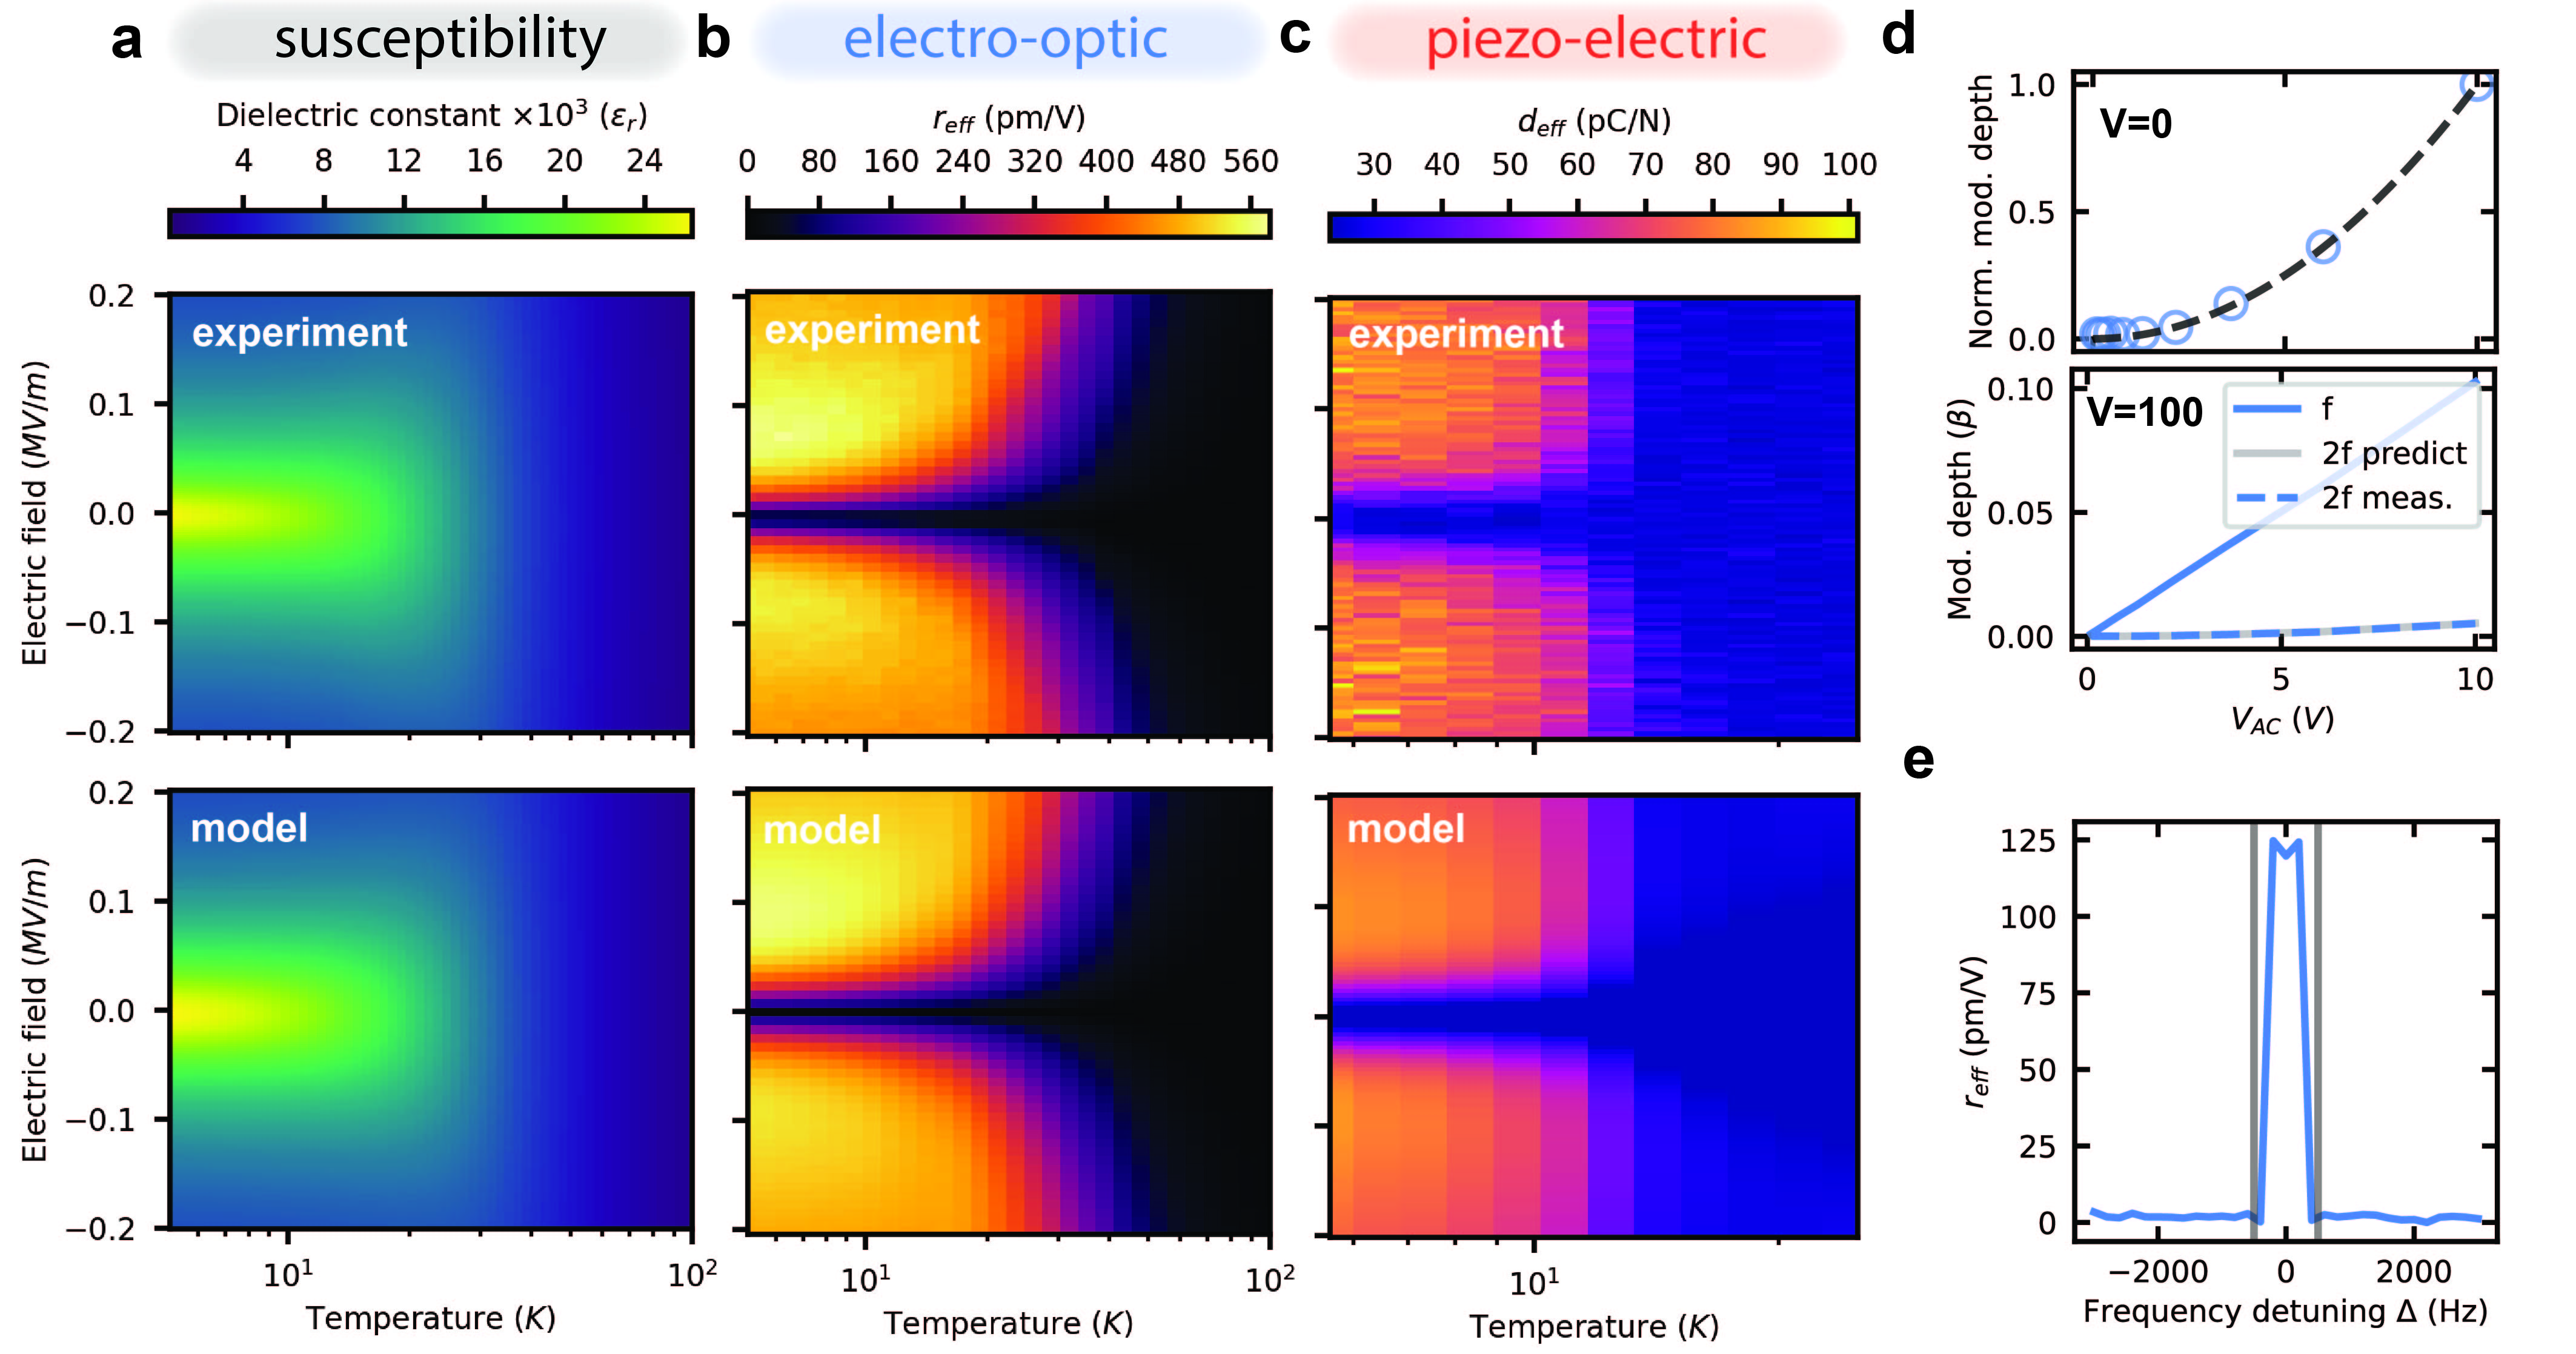
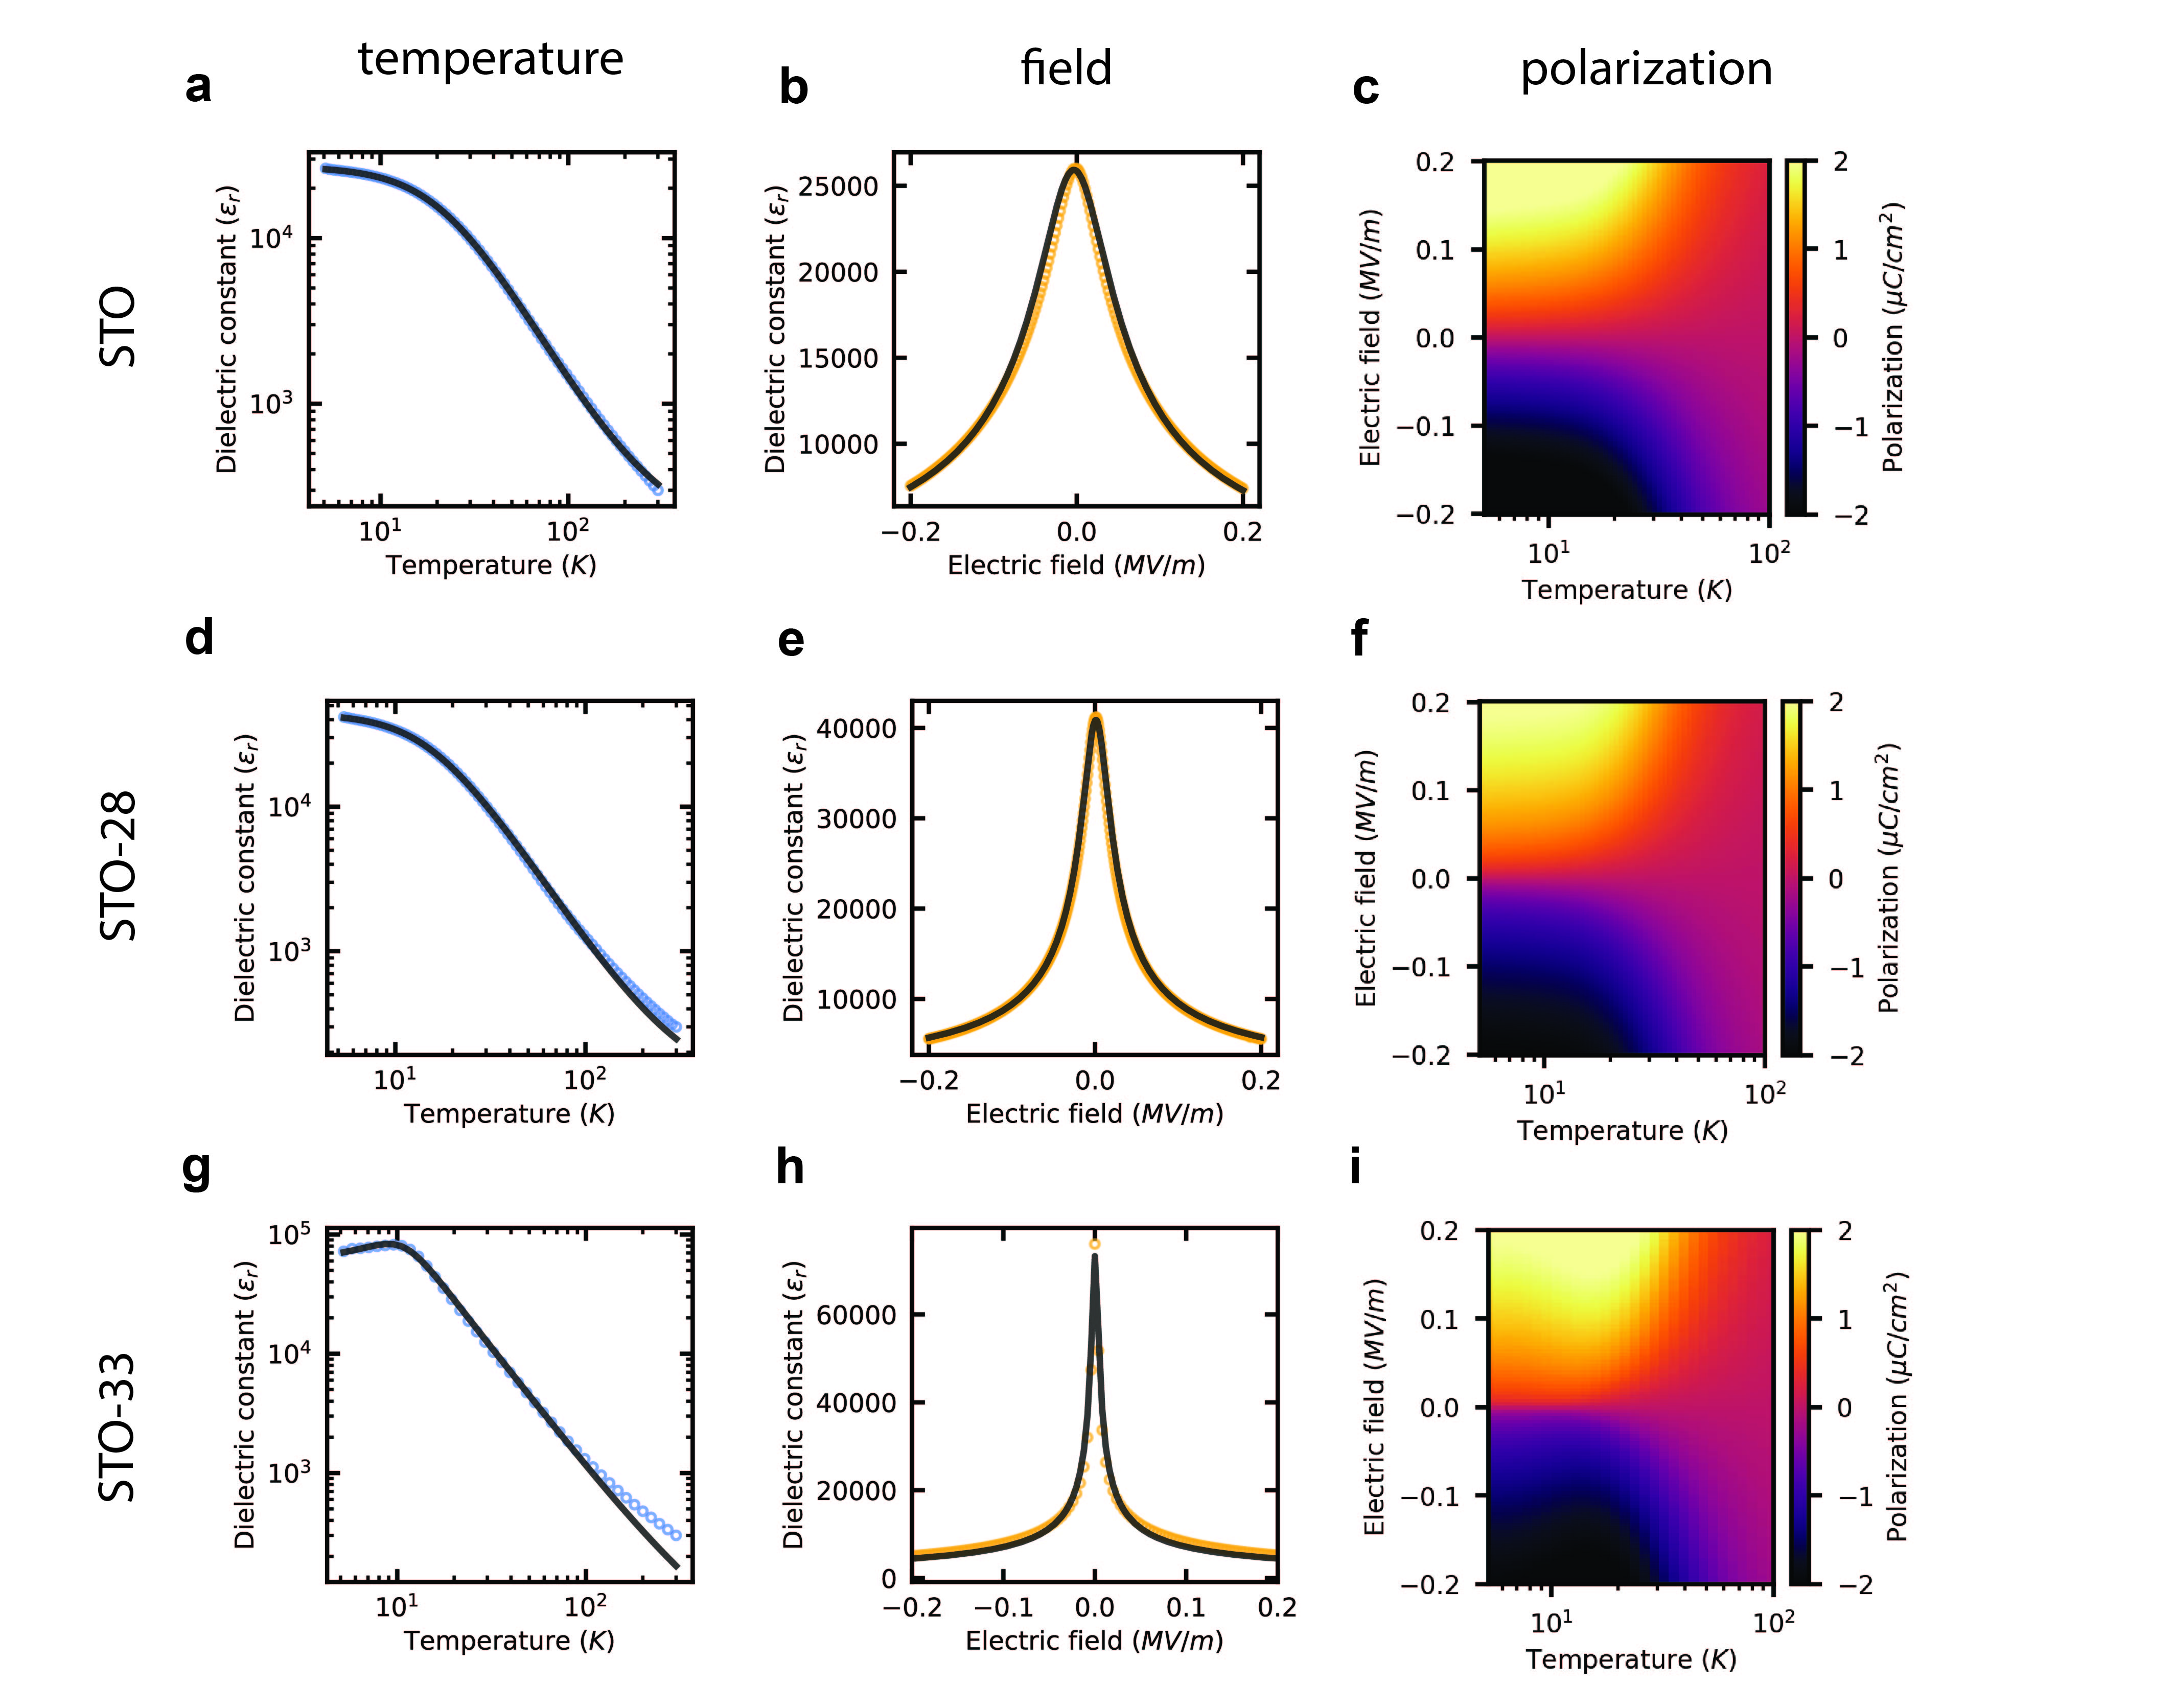
As STO cools, its low-frequency dielectric constant rises, and becomes one of the largest reported for any crystal at any temperature at over 25,000 (Fig. 2a). However, its quantum paraelectric nature causes a saturation of the dielectric response at 10 K and lower, deviating from the traditional Curie-Weiss law. Therefore, this material on the verge of ferroelectric instability results in a massive but stable electrical susceptibility. In this work, we probe the link of this unique quantum phase to optical and mechanical nonlinearities for the first time.
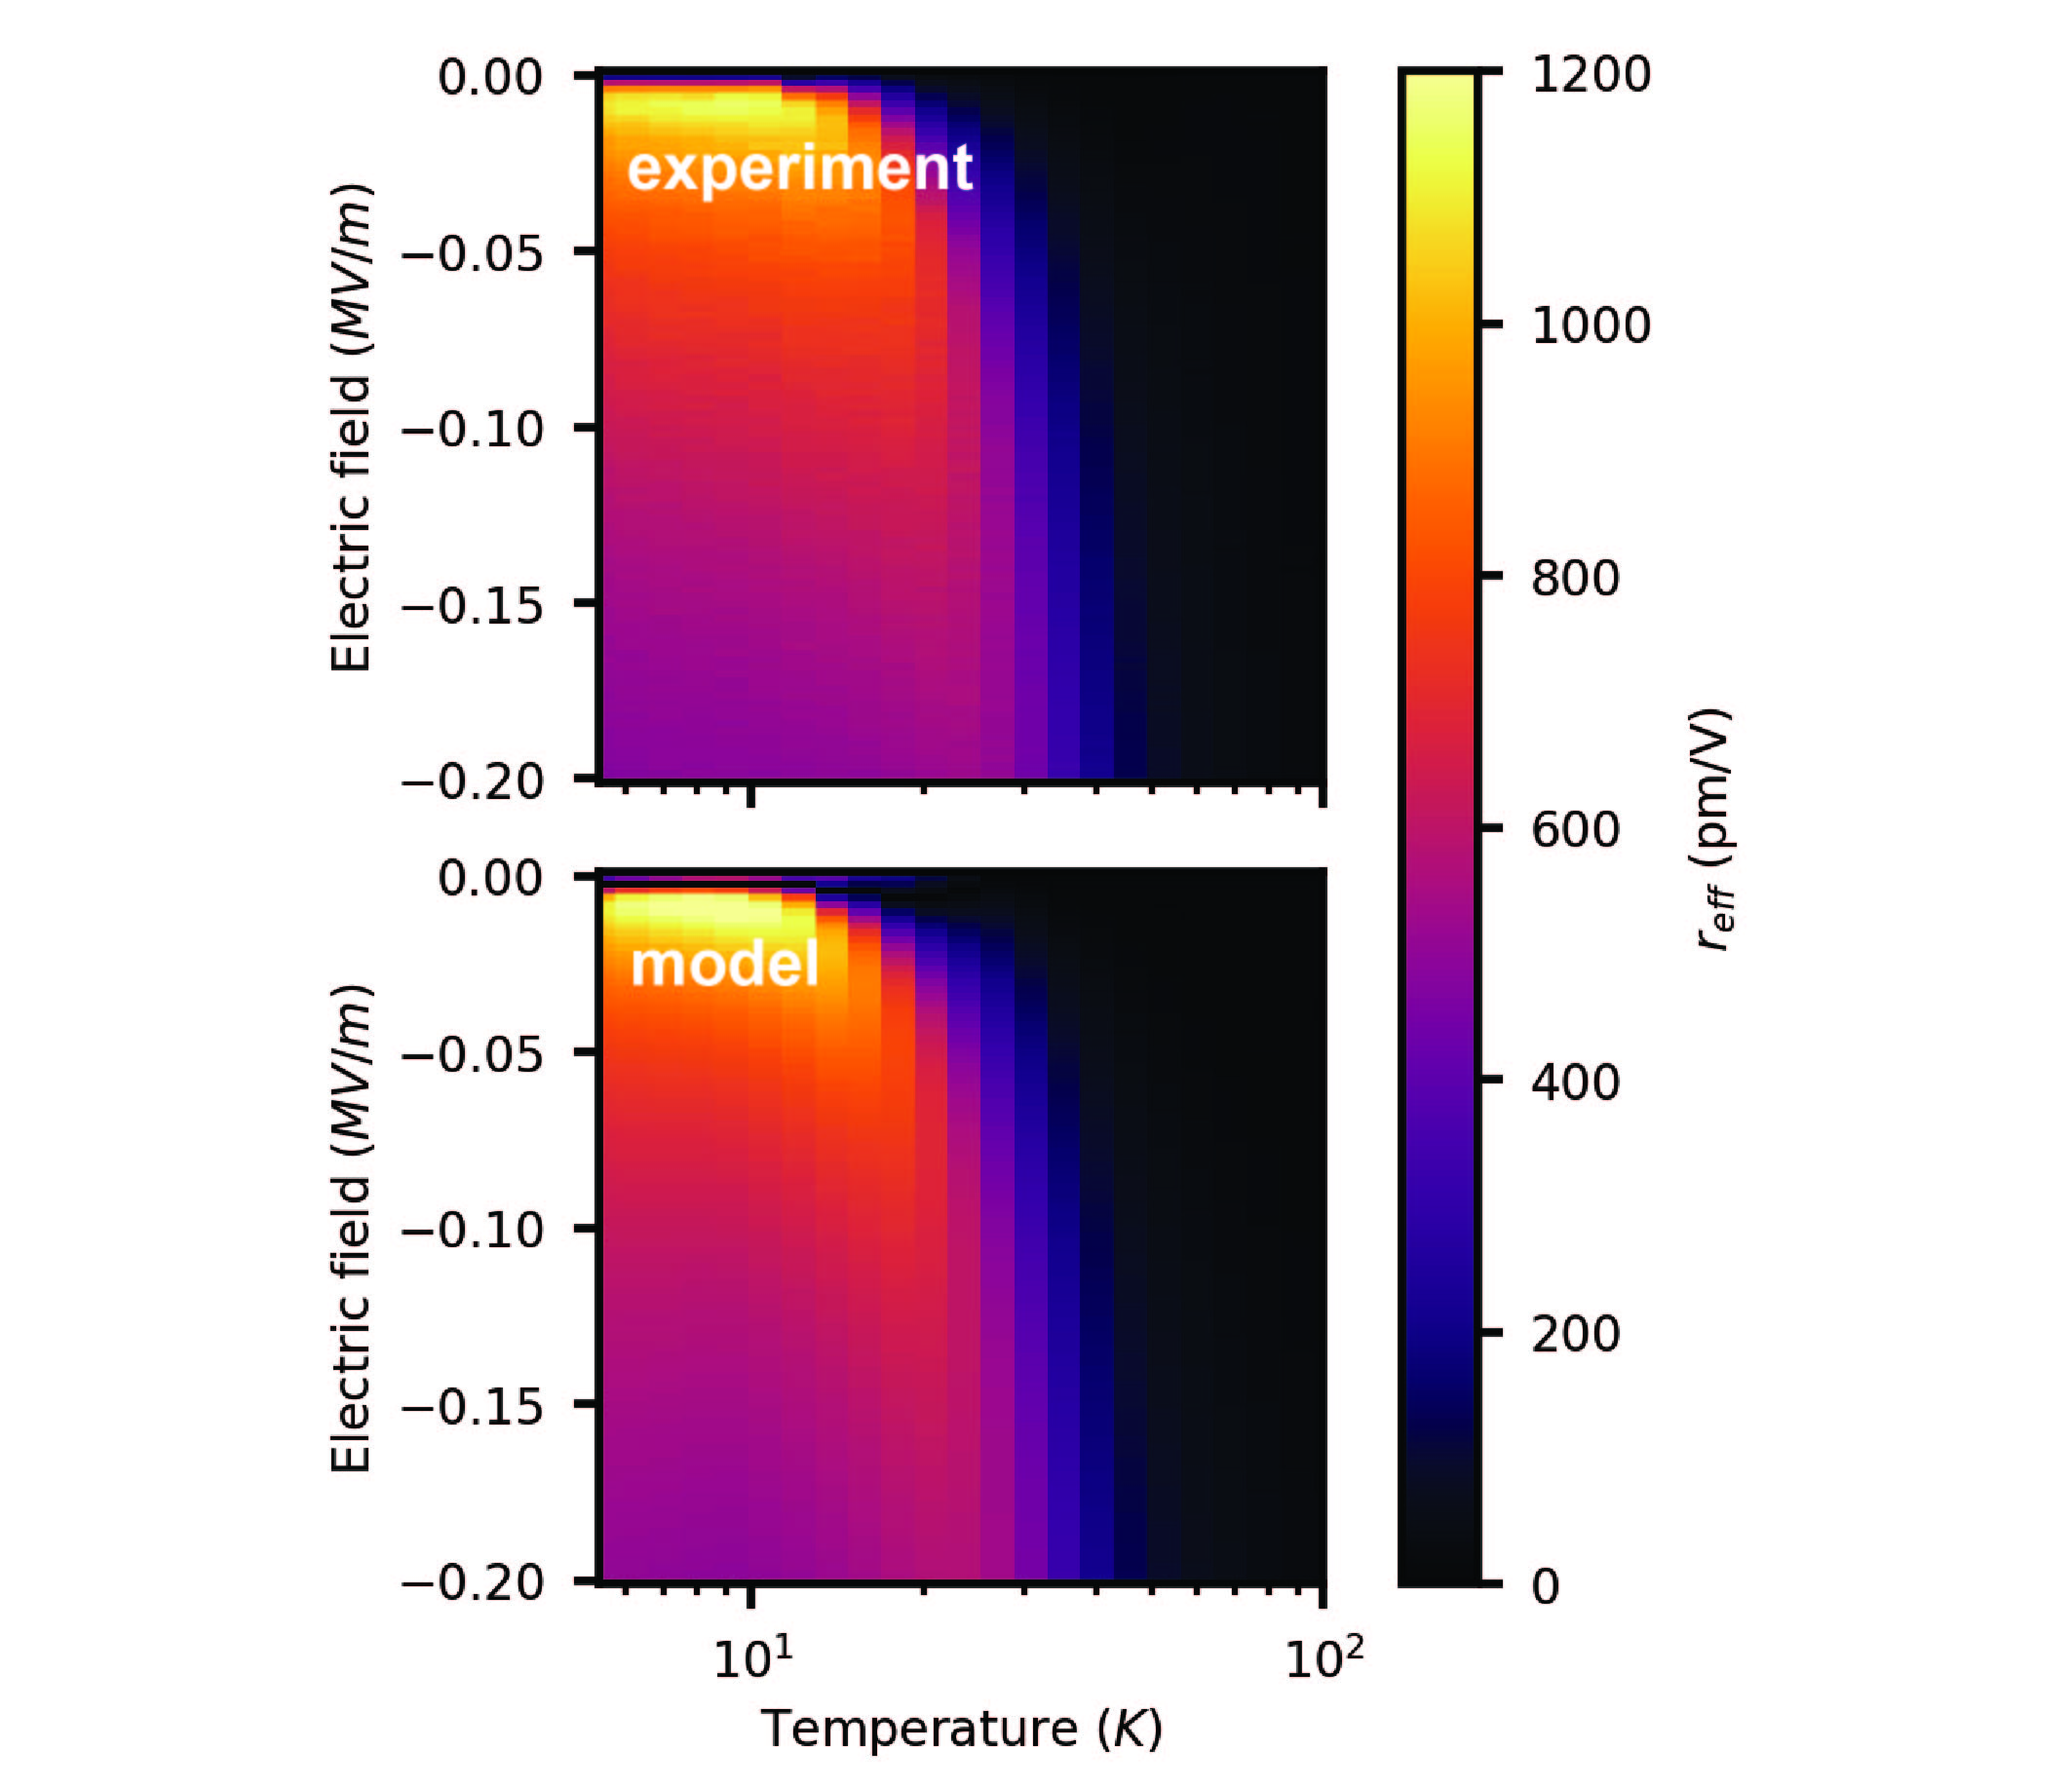
We first plot the bias field and temperature dependence of the dielectric response of natural STO (Fig. 2a). Using a modified LGD model with a quantum paraelectric correction following Zubko and Vendik50, 49 (Methods and SI Section S3), we are able to show remarkable agreement with the observed data. From the measured dielectric response as a function of bias field, we calculate the polarization, and therefore , directly from our experimental data.
We then measure the effective Pockels nonlinearity of STO using a cryogenic Mach-Zehnder-Interferometer (MZI), which extracts the phase shift from the index modulation of the STO crystal as a function of electrical bias (Methods and SI Section S4). The measured Pockels coefficient () induced by the applied bias to the sample is shown in Fig. 2b. We observe pm/V for a wide range of voltages at cryogenic temperatures. This is the largest measured Pockels coefficient at these temperatures, outperforming cryogenic BTO (170 pm/V)8 and electro-optic polymers (150 pm/V)37. In addition, it is more than a factor of 20 greater than commonly used LN (24 pm/V)21.
The observed strength and shape of our observed data are fit with a single free parameter, , and the measured extracted from Fig. 2a. There is a remarkable match with our model, once again verifying the link between dielectric and nonlinear optical properties. We fit at 5 K, which is close to the previously reported value at room temperature of 12. We note that the required field to bias to maximum nonlinearity is only 0.1 MV/m, such that 1 V across 10 m is more than sufficient for biased operation in integrated waveguides.
Next, we focus on the bias-induced linear (converse) piezo-electric effect in STO utilizing the same MZI in a modified configuration (SI Section S4 and Fig. S\fpeval8-4b) to infer the phase shift from the moving boundary of the STO as function of bias (Fig. 2c). We measure = 90(6) pC/N, which is over an order of magnitude greater than LN, and exceeds all known piezo-electric coefficients at low temperature. Similarly, this response is very well modeled through the observed and fitting at 5 K, which falls within the range of related ferroelectric materials 27. Crucially, the electrostrictive nature of STO may result in advantages over traditional piezo-electrics, thanks to low hysteresis, low creep or aging effects, fast response, and no traditional poling requirement47.
Our extracted value is also consistent with density functional theory predictions of ferroelectric STO9. We note that other previous work has reported extremely large effective cryogenic piezo-electric coefficients on electrically biased STO of 1600 17. However, follow-up measurements revealed calibration issues with a contact strain sensor, which caused an incorrect estimation of the piezoelectric coefficient18. Our measurements are instead interferometric (independent of detector response) and non-contact, bringing clarity to this longstanding result.
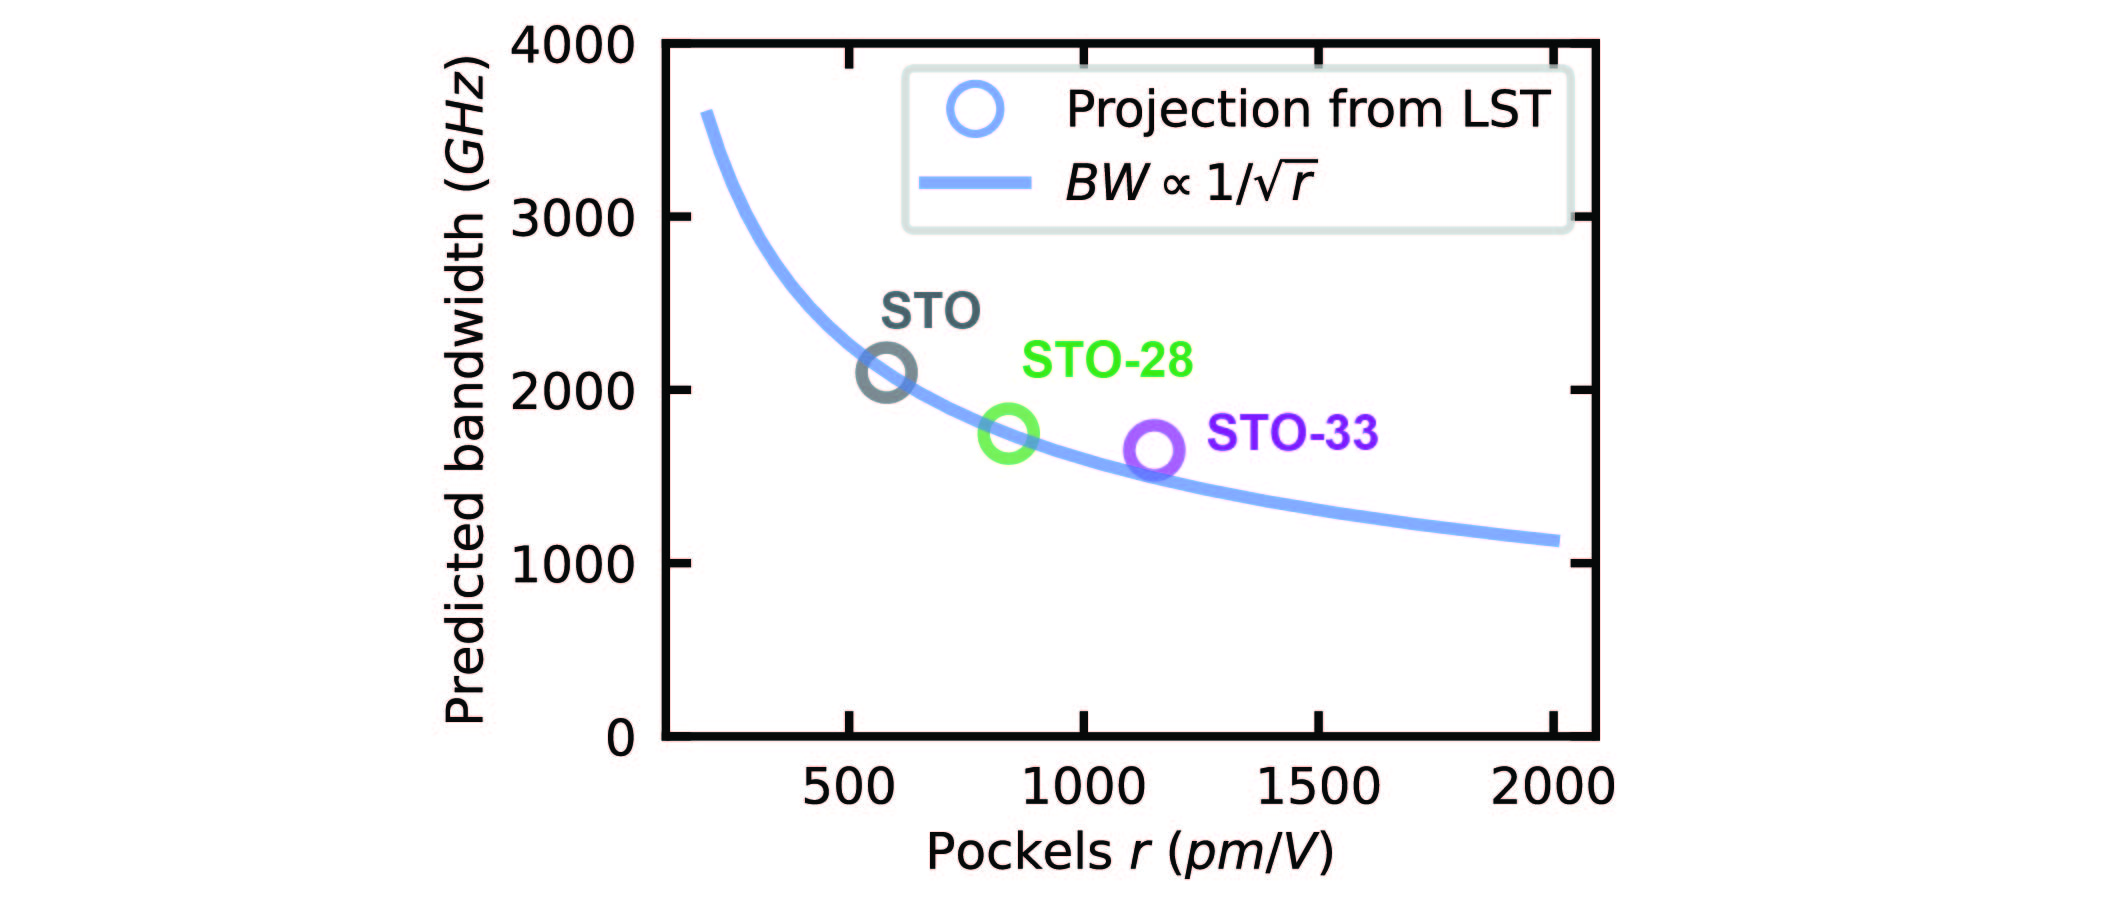
Our data is taken at a lower frequency (100 kHz) than many applications require, which are typically in the MHz to GHz regime. This is to avoid a RC cutoff at about 1 MHz, entirely limited by the sample capacitance of our large device (SI Section S5). As the dielectric response remains strong to GHz frequencies 34, 16, 48, the nonlinearity should still be similarly strong. Using the Lyddane-Sachs-Teller relation, we predict a fundamental electro-optic bandwidth above 1 THz for all samples (SI Section S6 and Fig. S\fpeval11-4). This indicates that the strong, fast, electro-optic response can be preserved in properly designed nanophotonic devices with reduced dimensions.
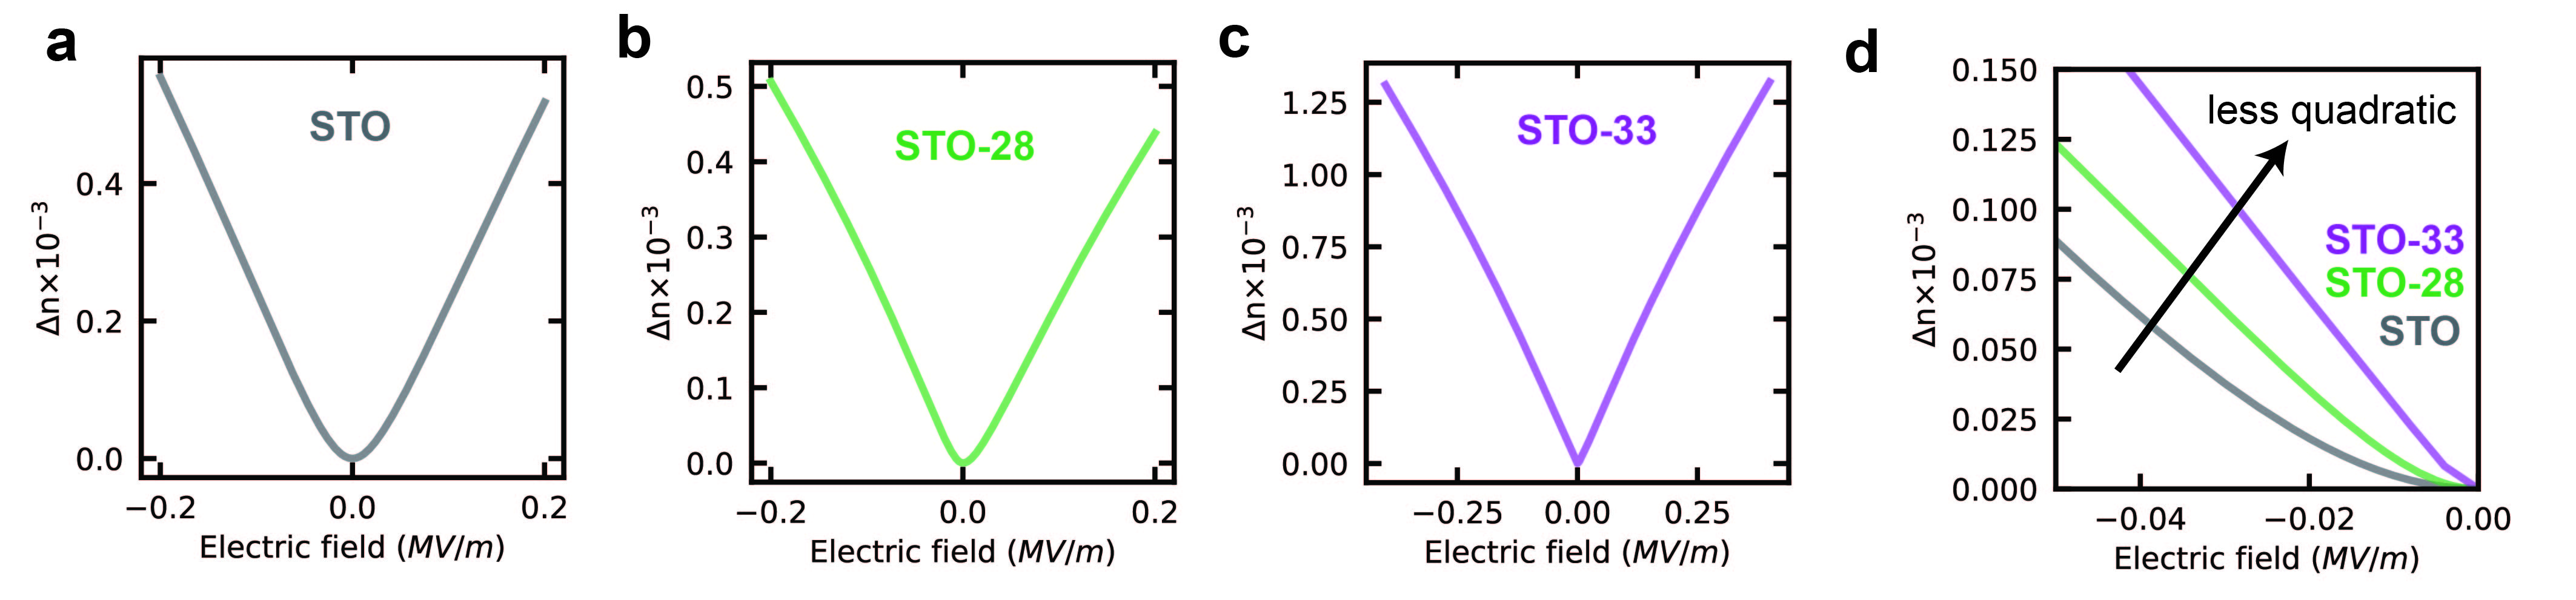
Without a DC bias field, STO is a quadratic electro-optic material, with a large , where is an optical frequency (SI Section S7). Therefore, a quasi-static electrical modulation at can produce optical phase modulation at , a form of frequency doubling. We measure this second-harmonic modulation at zero bias as a function of drive voltage, shown in Fig. 2d. The strength of the modulation is quadratic in voltage, as expected. In Fig. 2d, we also show that when an electrical bias is applied, the modulation at from the linear electro-optic effect becomes dominant, and the residual modulation arises purely from higher harmonics of the strong drive. The quadratic electro optic and biased linear coefficient can be related by . From this, we calculate to be at least 510-15 m2/V2 or higher for natural STO. This is on par or higher than even the best potassium tantalate niobate (KTN) quadratic EO devices14, which display the largest EO Kerr effect found among all known materials.
For traditional quadratic electro-optic materials such as KTN, optimal performance requires stabilization of the composition on the order of 1%, and an optimal operation temperature range only a few C wide 14, 55. In contrast, because of the quantum paraelectric phase, the electro-optic response of STO is stable over a wide range of temperatures and requires no compositional tuning. These results may also be extended to higher temperature in strained films, which have already been tuned to ferroelectricity at ambient temperatures19. In fact, STO has a predicted Pockels elements as large as 500 pm/V if strained 20, a close match to the observed data here.
Because the linear Pockels effect in quantum paraelectric STO is induced via a bias field, there are opportunities to dynamically tune the nonlinearity. For example, in Fig. 2f we demonstrate strong modulation occurs only with the signal frequency is matched with the modulation frequency. This capability can be engineered spatially and in time, enabling dynamic periodic poling and bipolar temporal biasing which can inhibit photorefractive optical damage and charge buildup22. Finally, STO also avoids some of the difficulties with ferroelectric BTO. For example, STO is paraelectric, so there is no multi-domain complexity or potential scattering loss from domain boundaries (SI Section S8). Moreover, it is not necessary to orient an optical device with respect to a specific crystal axis in STO. These geometric considerations, combined with the ability to use the same electrodes to apply both the signal tone and “poling” field, ensure a maximal utilization of the full strength of the Pockels tensor element, a difficulty with BTO.
Enhancing nonlinearity near quantum criticality
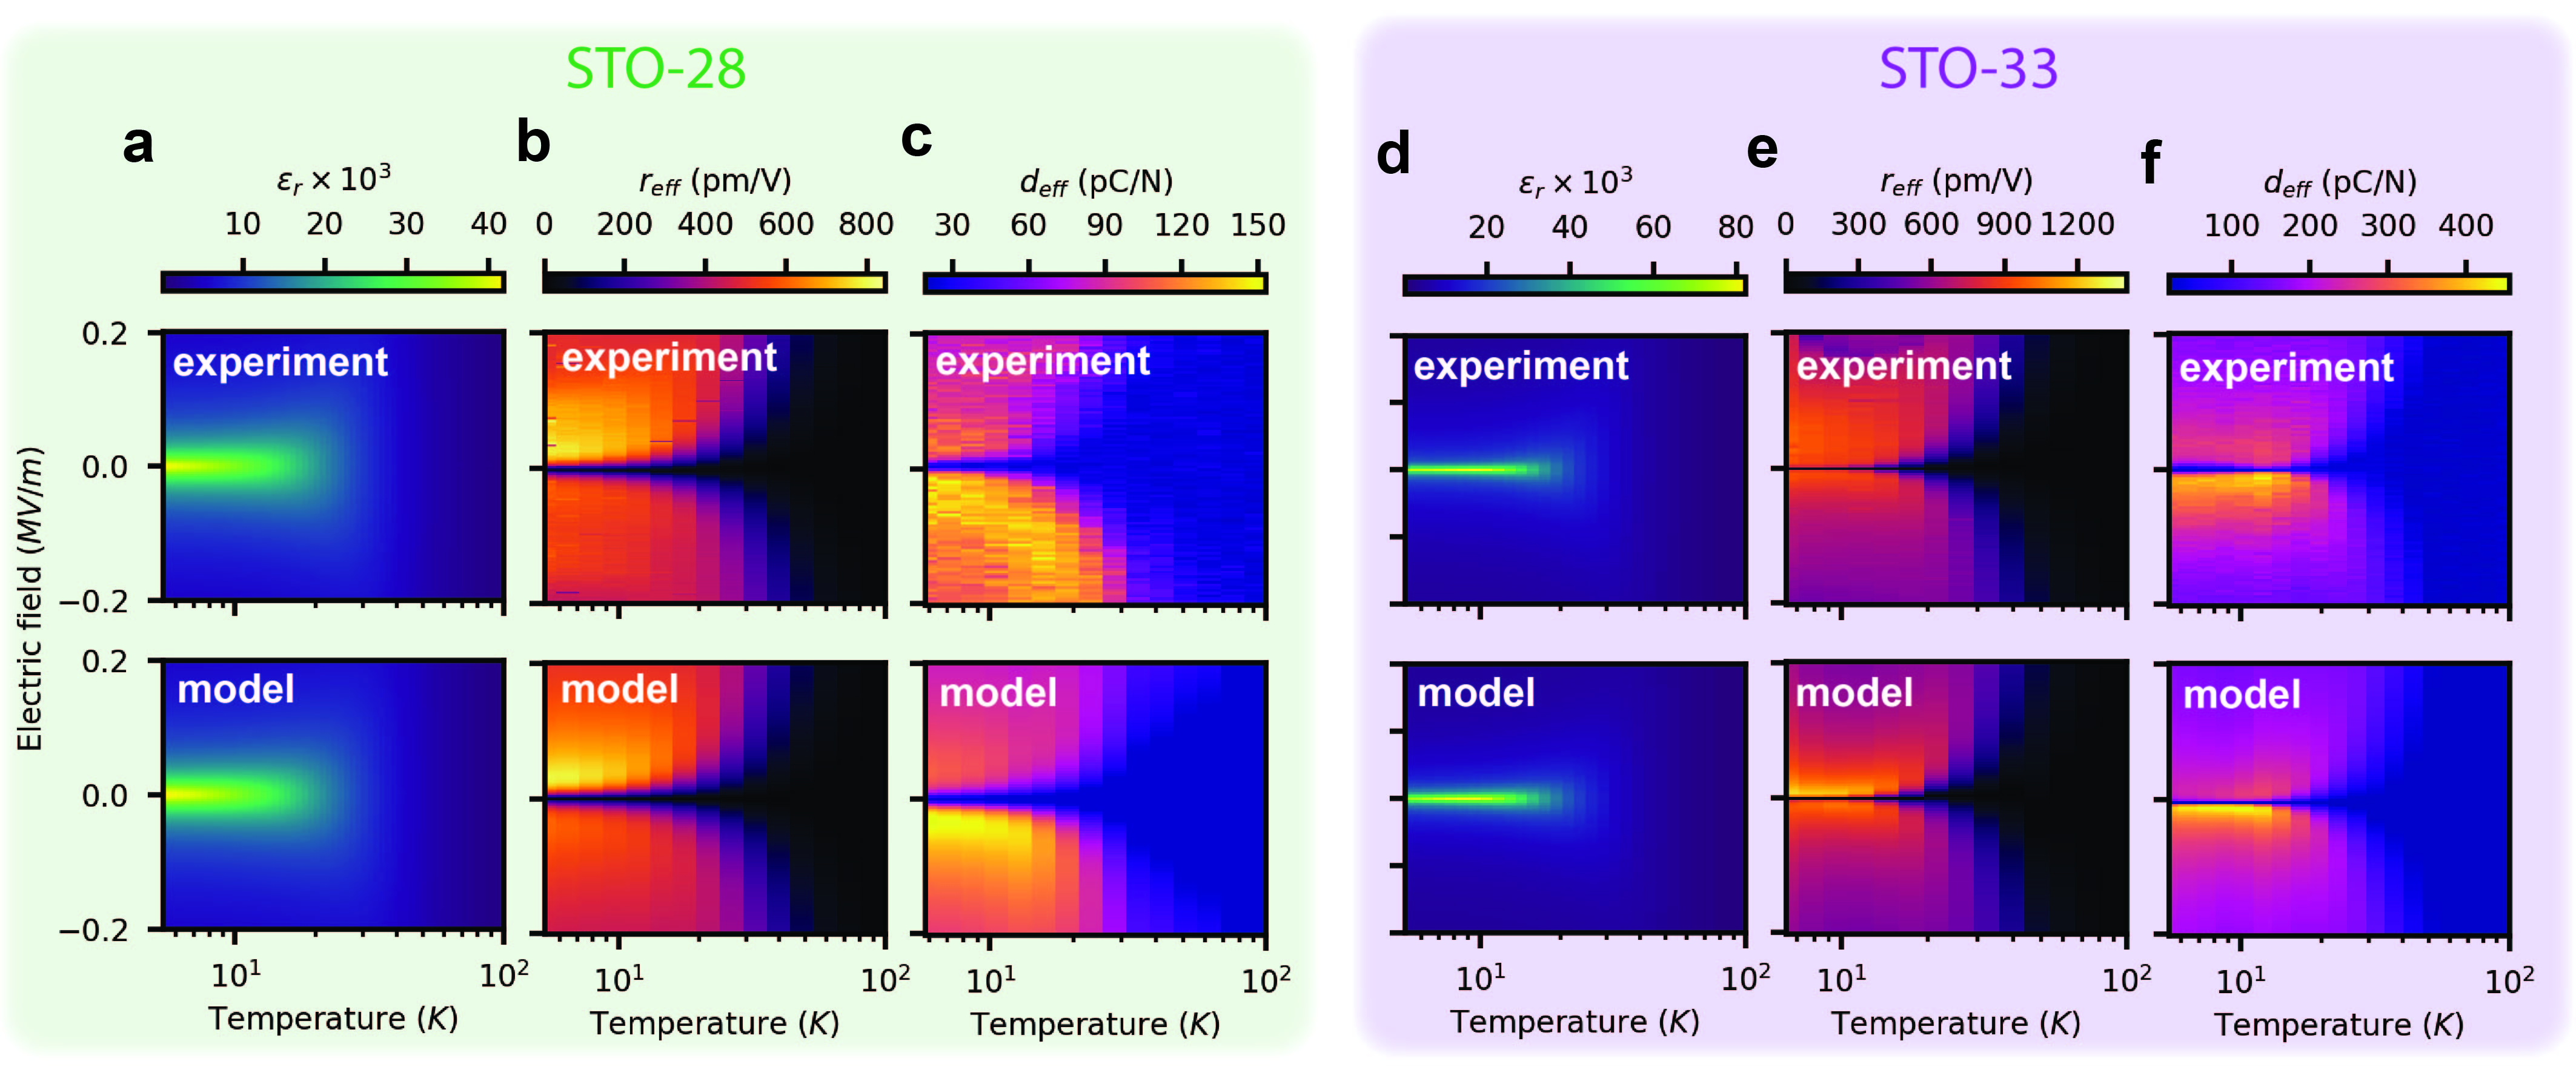
Previous works have shown that substituting 18O for naturally occurring 16O tunes the system towards and through quantum criticality (Fig. 1f)24, 40. At about 33% concentration of 18O, the quantum critical point (QCP) is reached where the dielectric properties are further enhanced near , no longer suppressed by quantum fluctuations. We therefore hypothesize that the cryogenic piezo-electric and electro-optic nonlinearities will grow as well, and study them for the first time.
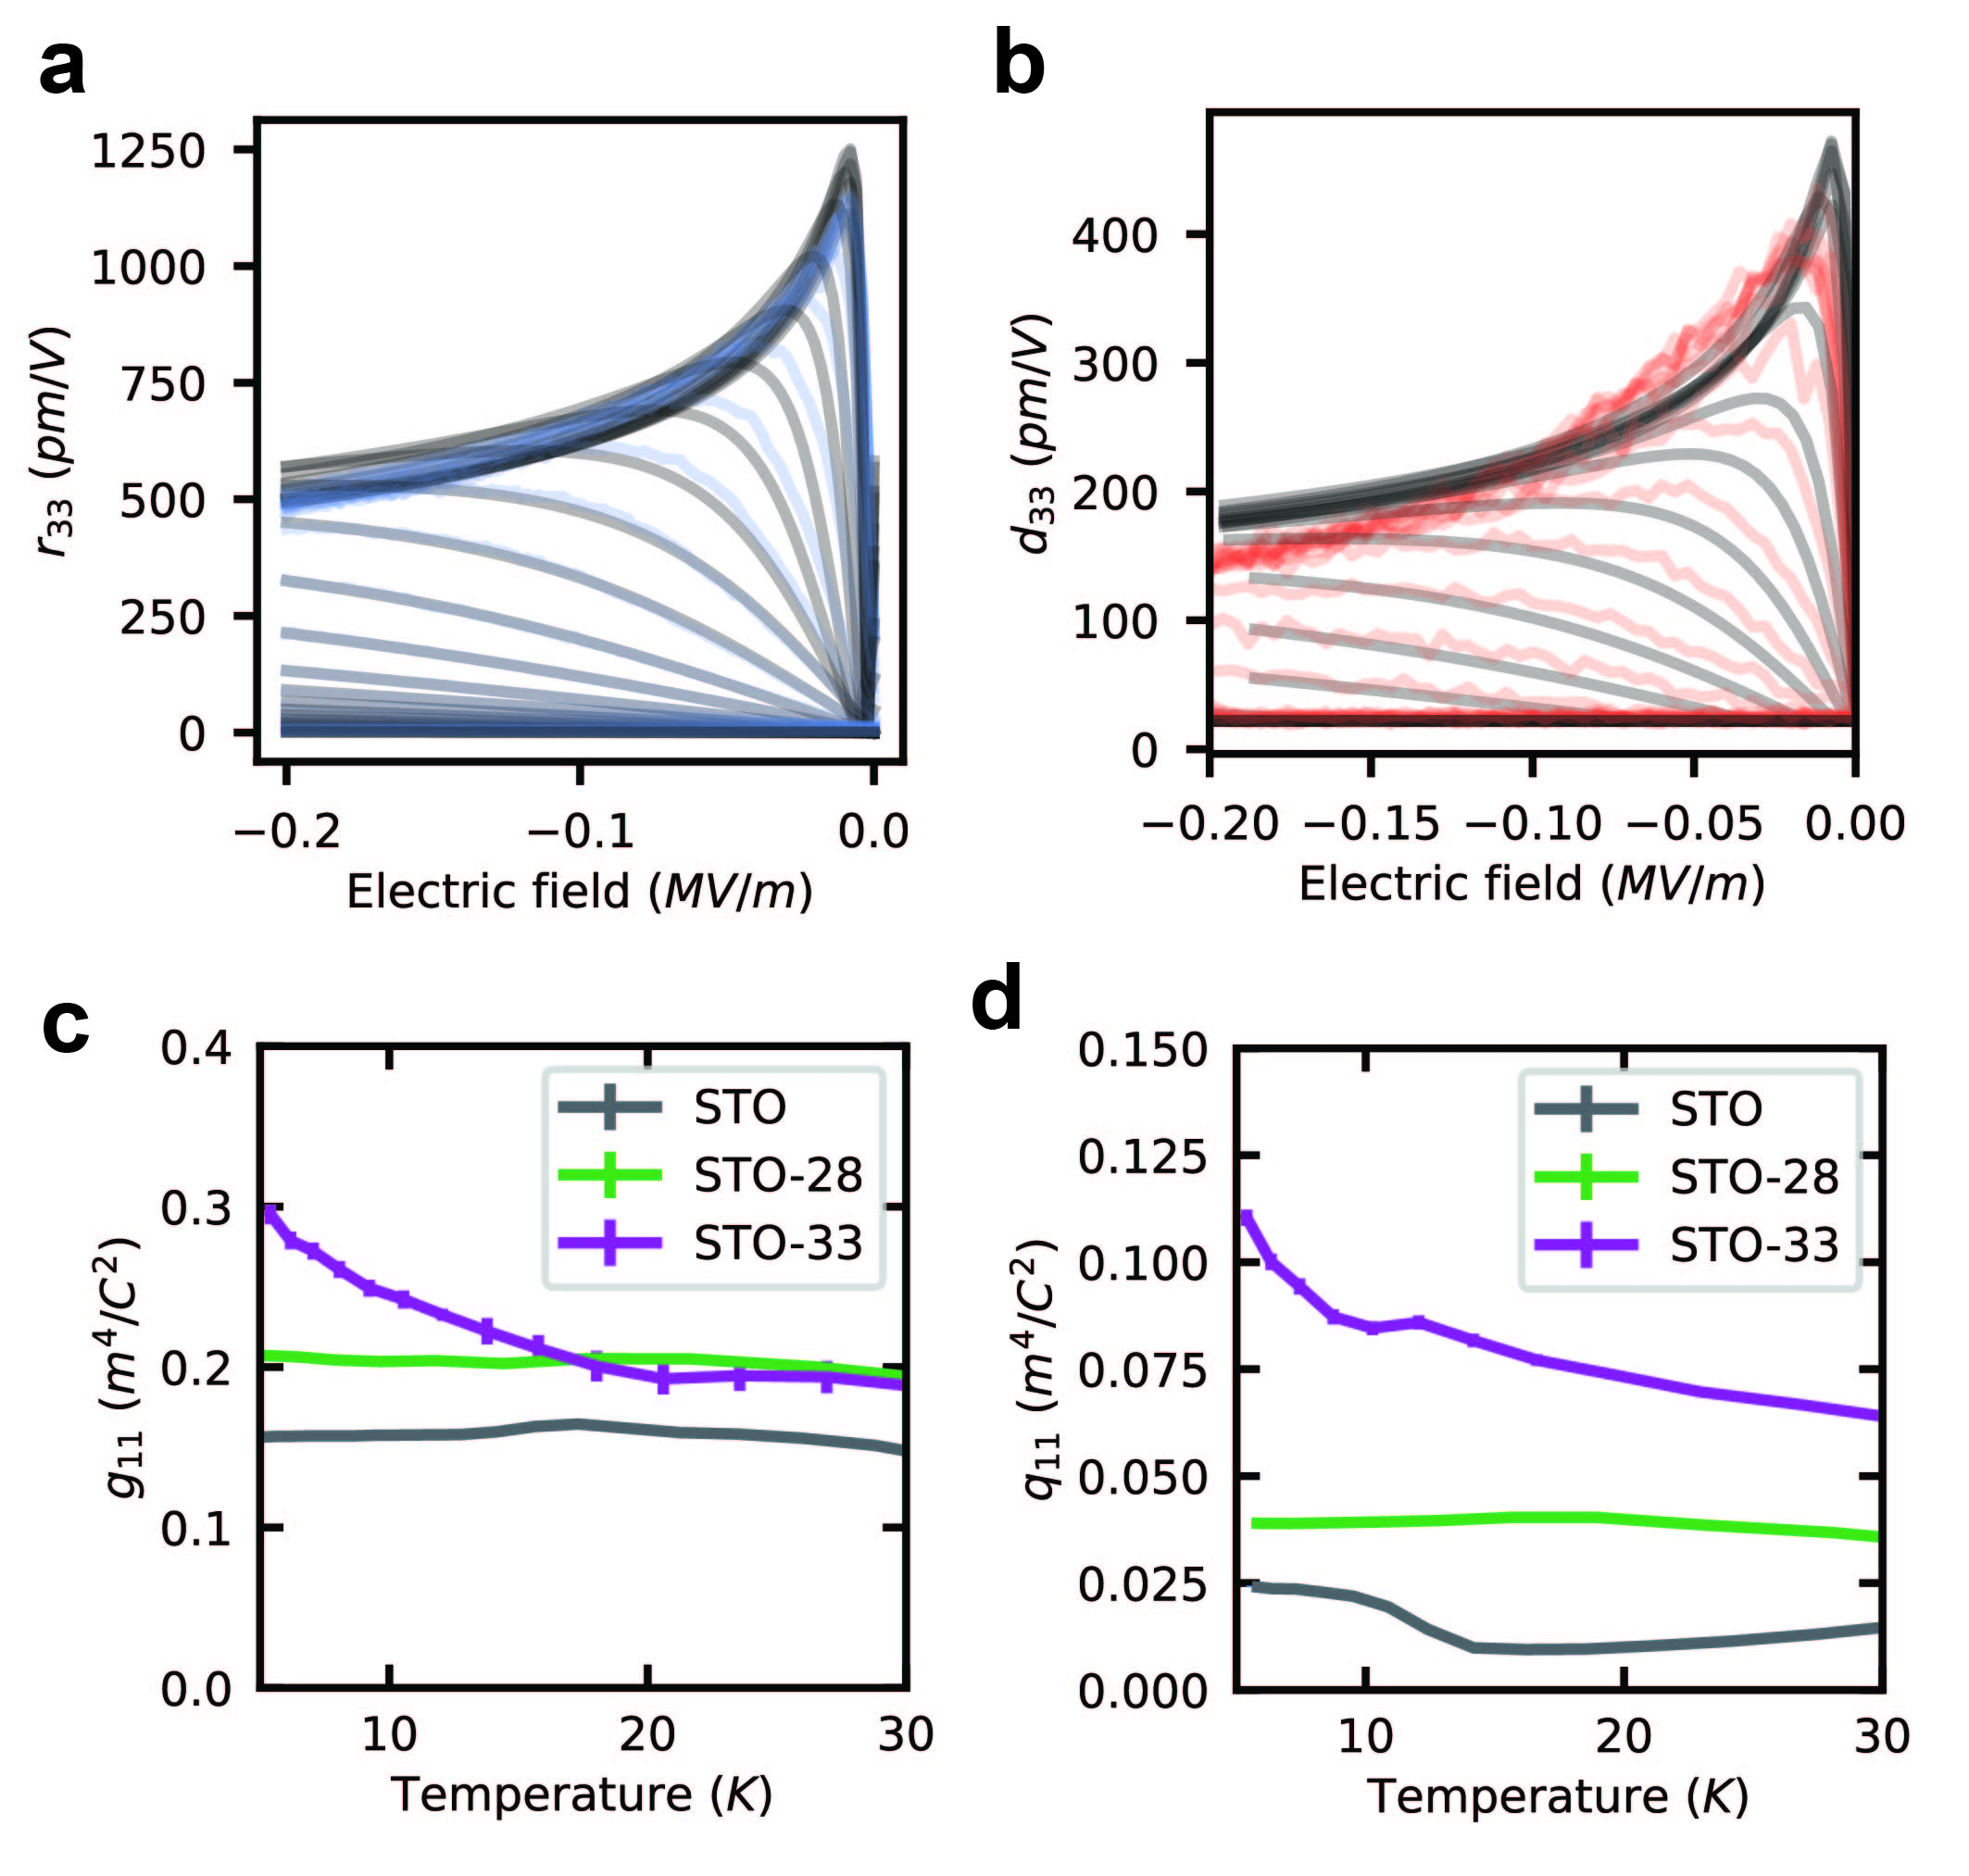
We first measure the dielectric properties of SrTi (“STO-28”) and SrTi (“STO-33”), prepared by annealing natural STO (“STO”) in isotopically purified oxygen gas (Methods), shown in Fig. 3a,d. The same modified LGD model for natural STO fits the response in these samples. We notice a sharper dependence of the dielectric constant with respect to the electric field, with a corresponding higher peak value, of around 42,000 and 82,000 for STO-28 and STO-33, respectively (see Table 1). Interestingly, despite the large zero-bias dielectric constant, the achievable electrical polarization is quite similar at about 2 C/cm2 among all samples (Fig. S\fpeval7-4).
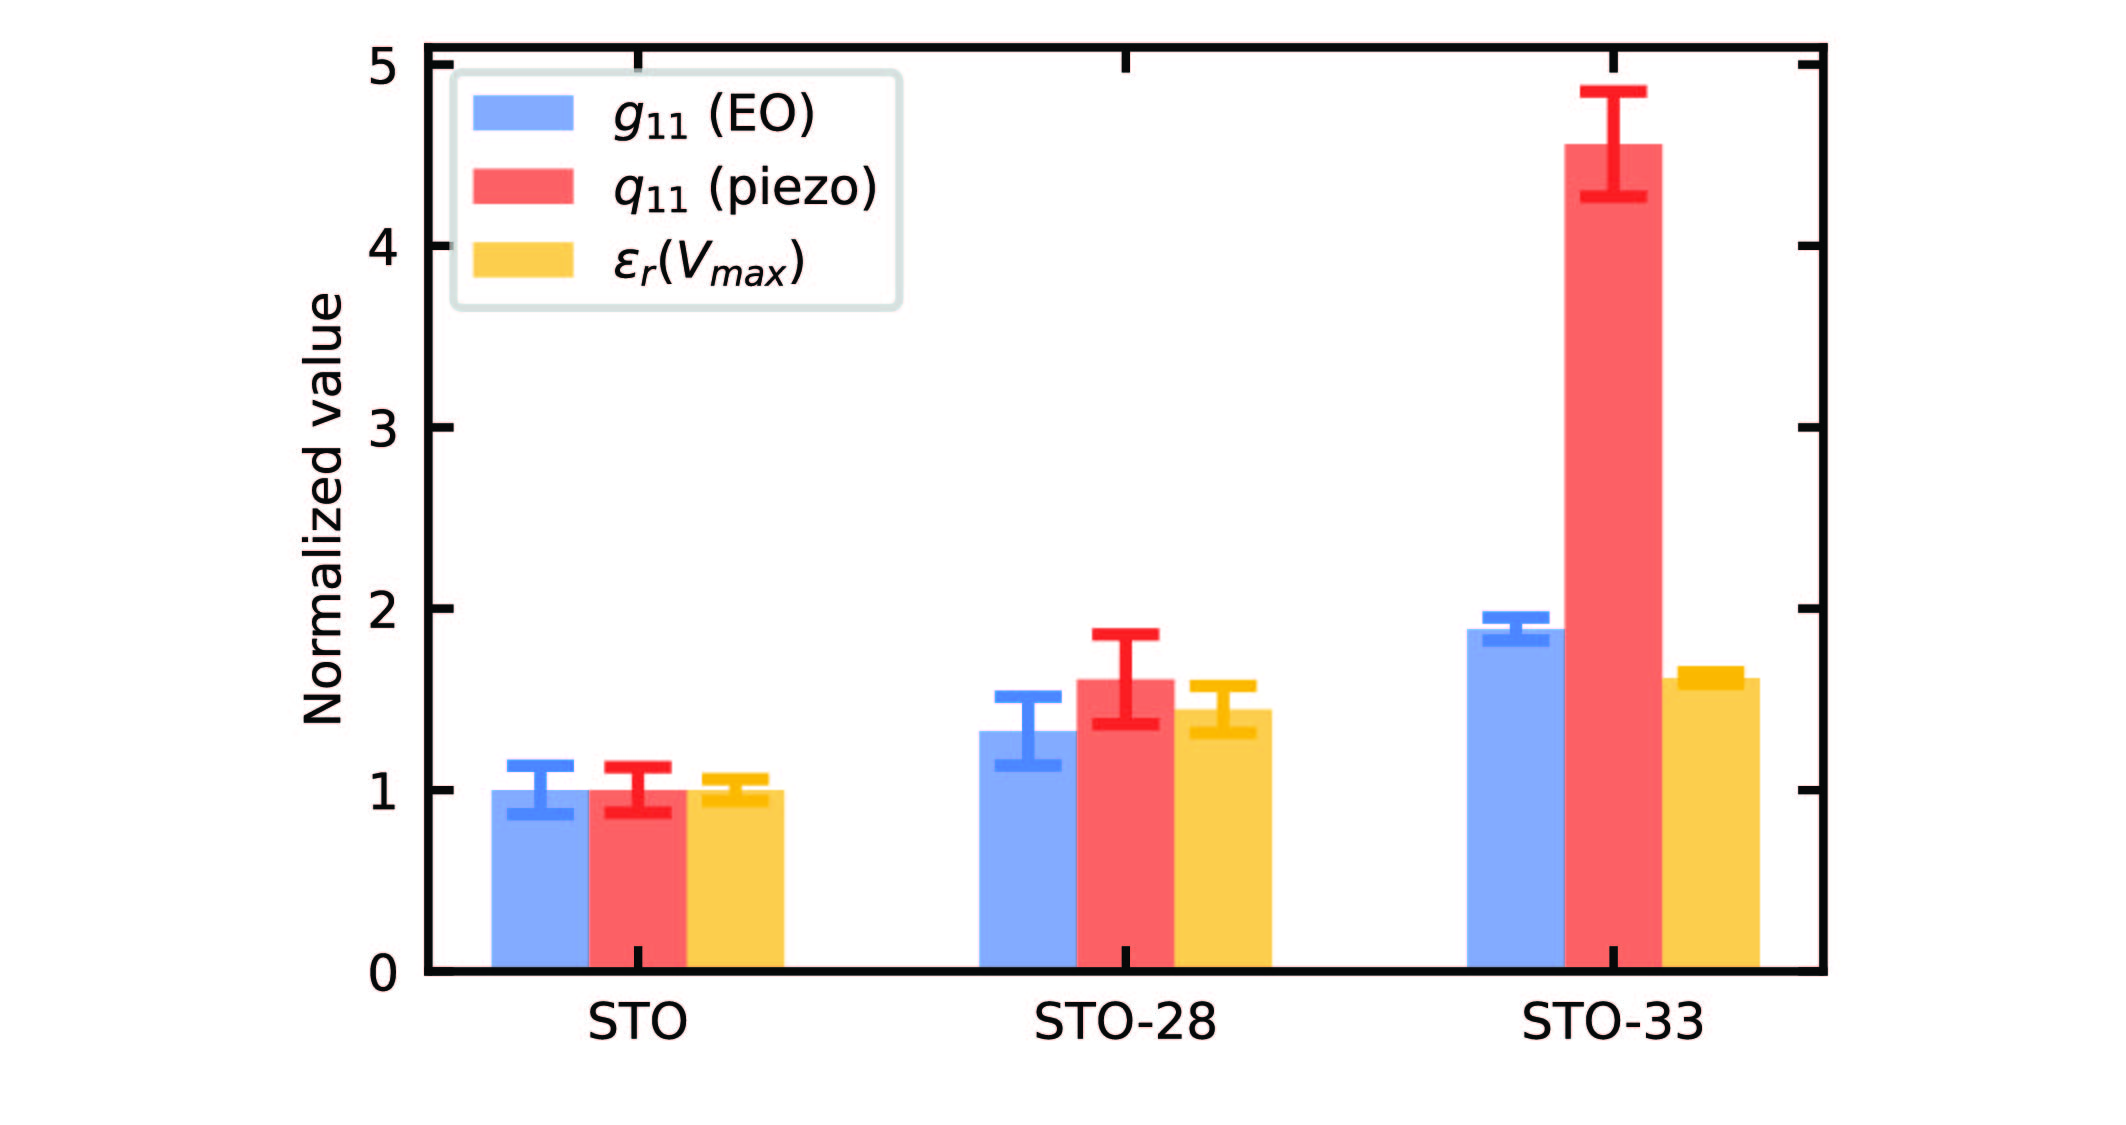
We perform measurements of the bias-induced electro-optic and piezo-electric nonlinearities in the same way as natural STO, shown in Fig. 3, alongside the model from the measured dielectric data. Once again, there is a remarkable match between the intuition from the “” rule and the link between quadratic and linear nonlinearities. This includes a replication of the slight asymmetry, which is also present in the dielectric data. For STO-28, we report maximal values of and pC/N. For STO-33, we measure pm/V and pC/N at their peak (SI Section S9). As STO approaches the QCP, we therefore observe an almost doubling of the Pockels effect and over a four-time improvement in the piezo-electric effect, approaching the values of even the strongest room temperature electro-optic and piezo-electric crystals. We also show a line cut of the K dependence of the the nonlinearity with applied bias for natural and isotope-exchanged STO in Fig. 4a. The required bias fields for maximum nonlinearity decrease at the system is tuned to criticality, while surprisingly, the “high bias” electro-optic coefficient is almost identical between the samples.
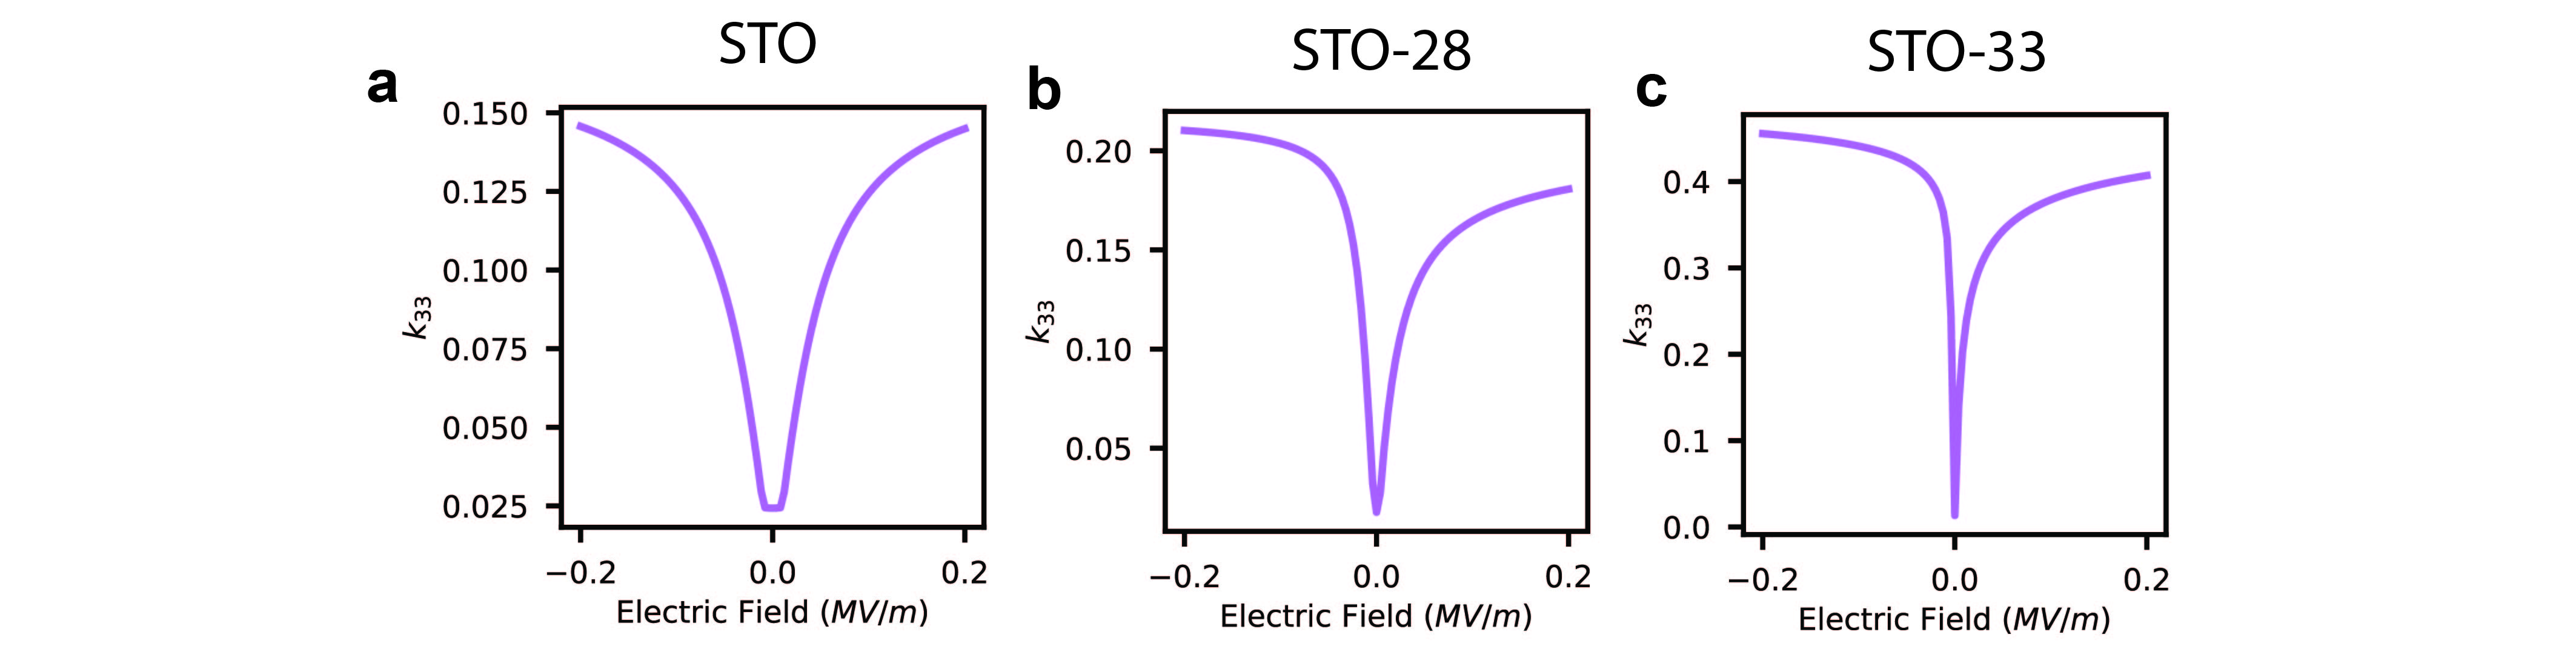
We also report the electromechanical coupling factor, among all samples (SI Section S10 and Fig. S\fpeval15-4), which more accurately describes the figure of merit for converting electrical energy to mechanical energy at cryogenic temperatures, roughly triples between STO and STO-33, and is only limited by the strength of the bias field.
Finally, we utilize the large quadratic electro-optic effect in isotopically exchanged STO to make a highly efficient cryogenic beam steering device that deflects a laser by 10 mrad at a field of 0.2 MV/m, (Fig. S\fpeval16-4 and SI Section S11). This is on par with the best room temperature KTN beam deflectors, and could find use in space communications or efficient cryogenic varifocal lenses 23.
| STO | STO-28 | STO-33 | |
|---|---|---|---|
| (pm/V) | 580(60) | 840(50) | 1150(30) |
| (pC/N) | 91(6) | 150(9) | 435(25) |
| 26.0(1.5) k | 42.0(3.7) k | 82.0(1.6) k | |
| (C/m2) | 200(20) | 145(20) | 164(5) |
| (MV/m) | 0.080 | 0.036 | 0.008 |
| (m4/C2) | 0.15(2) | 0.21(3) | 0.30(1) |
| (m4/C2) | 0.024(3) | 0.039(6) | 0.110(7) |
| 0.15(1) | 0.21(2) | 0.46(3) |
Trends in nonlinear materials
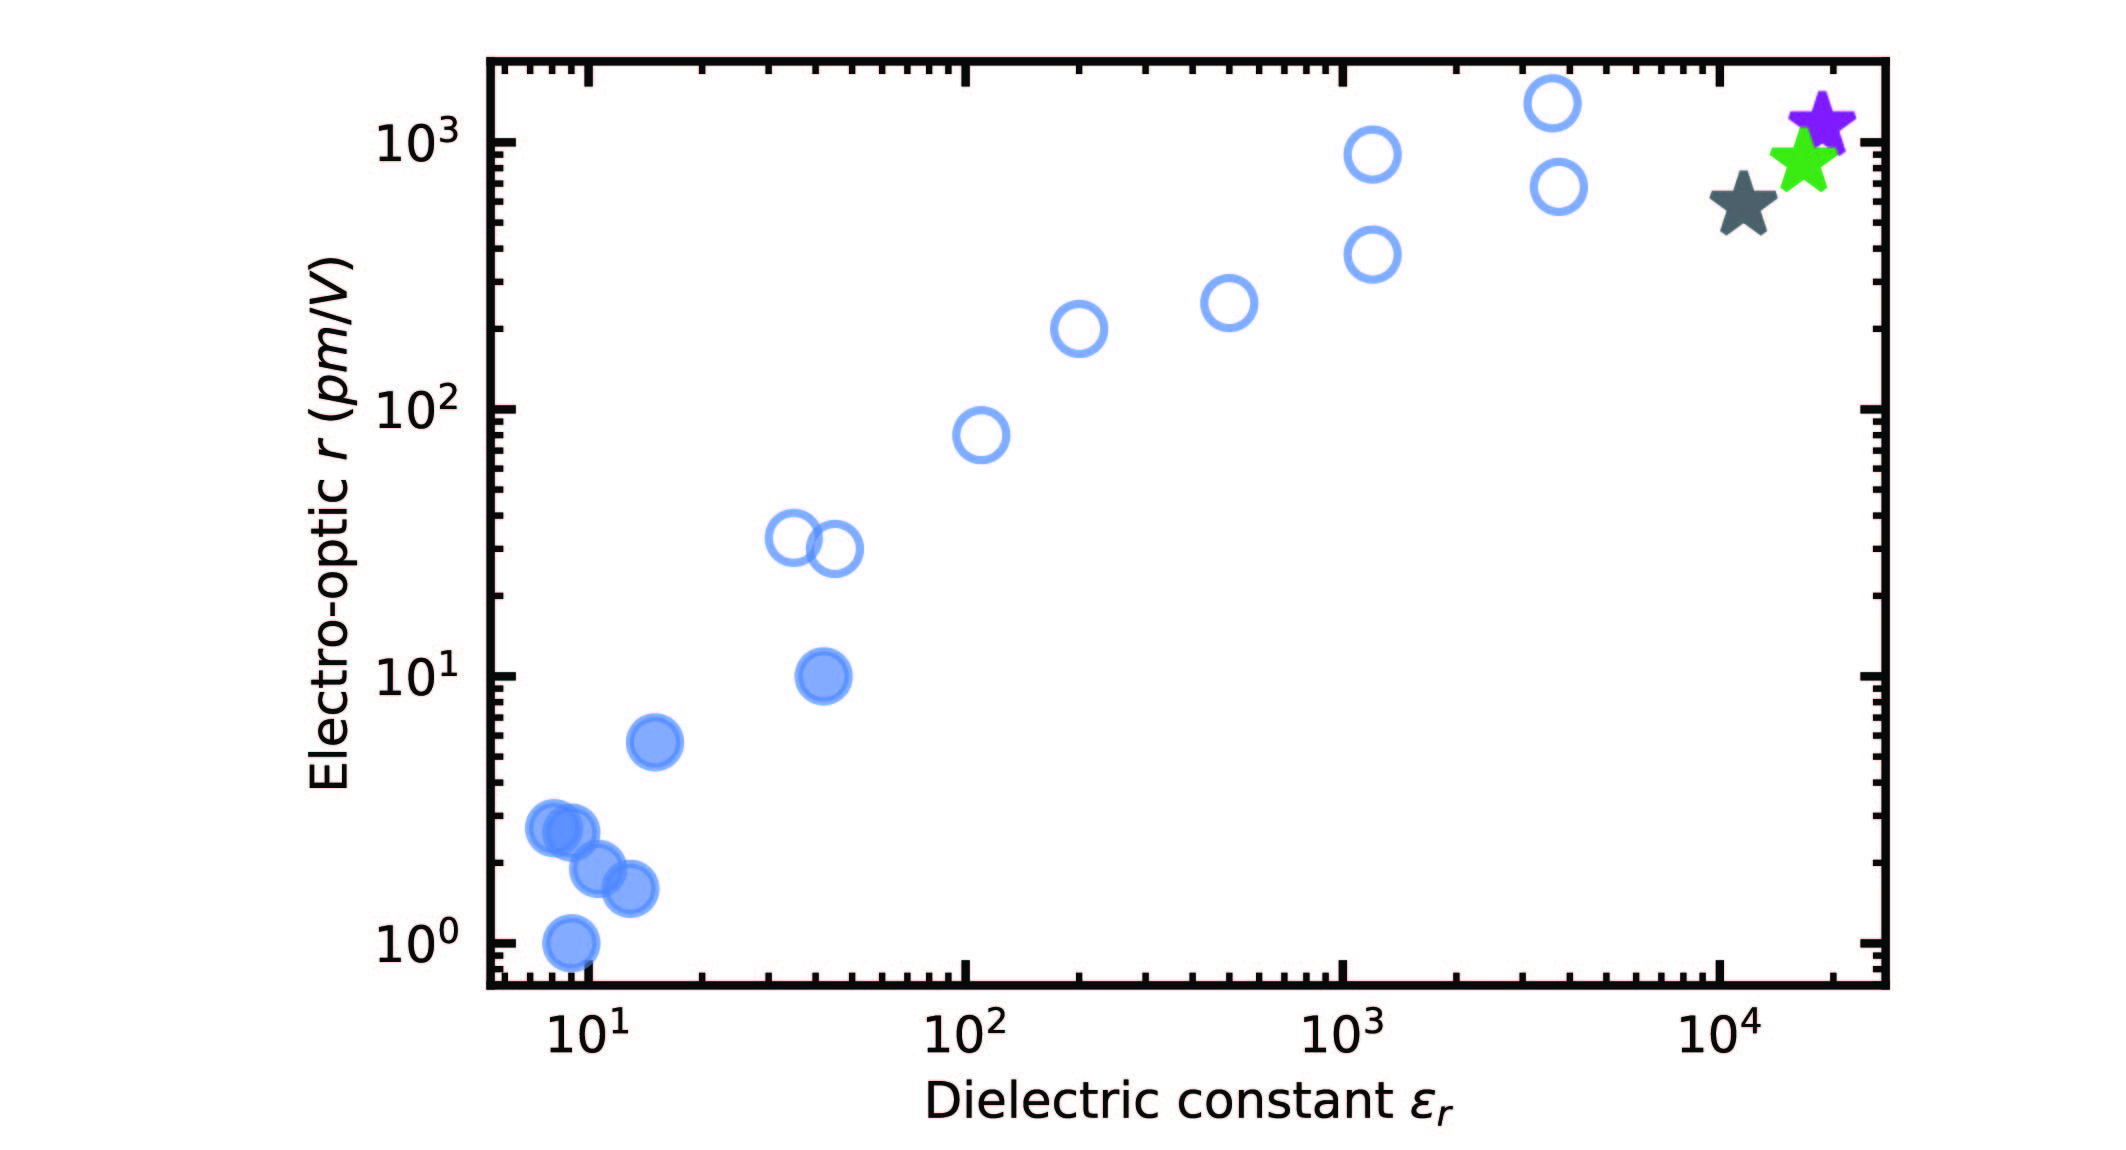
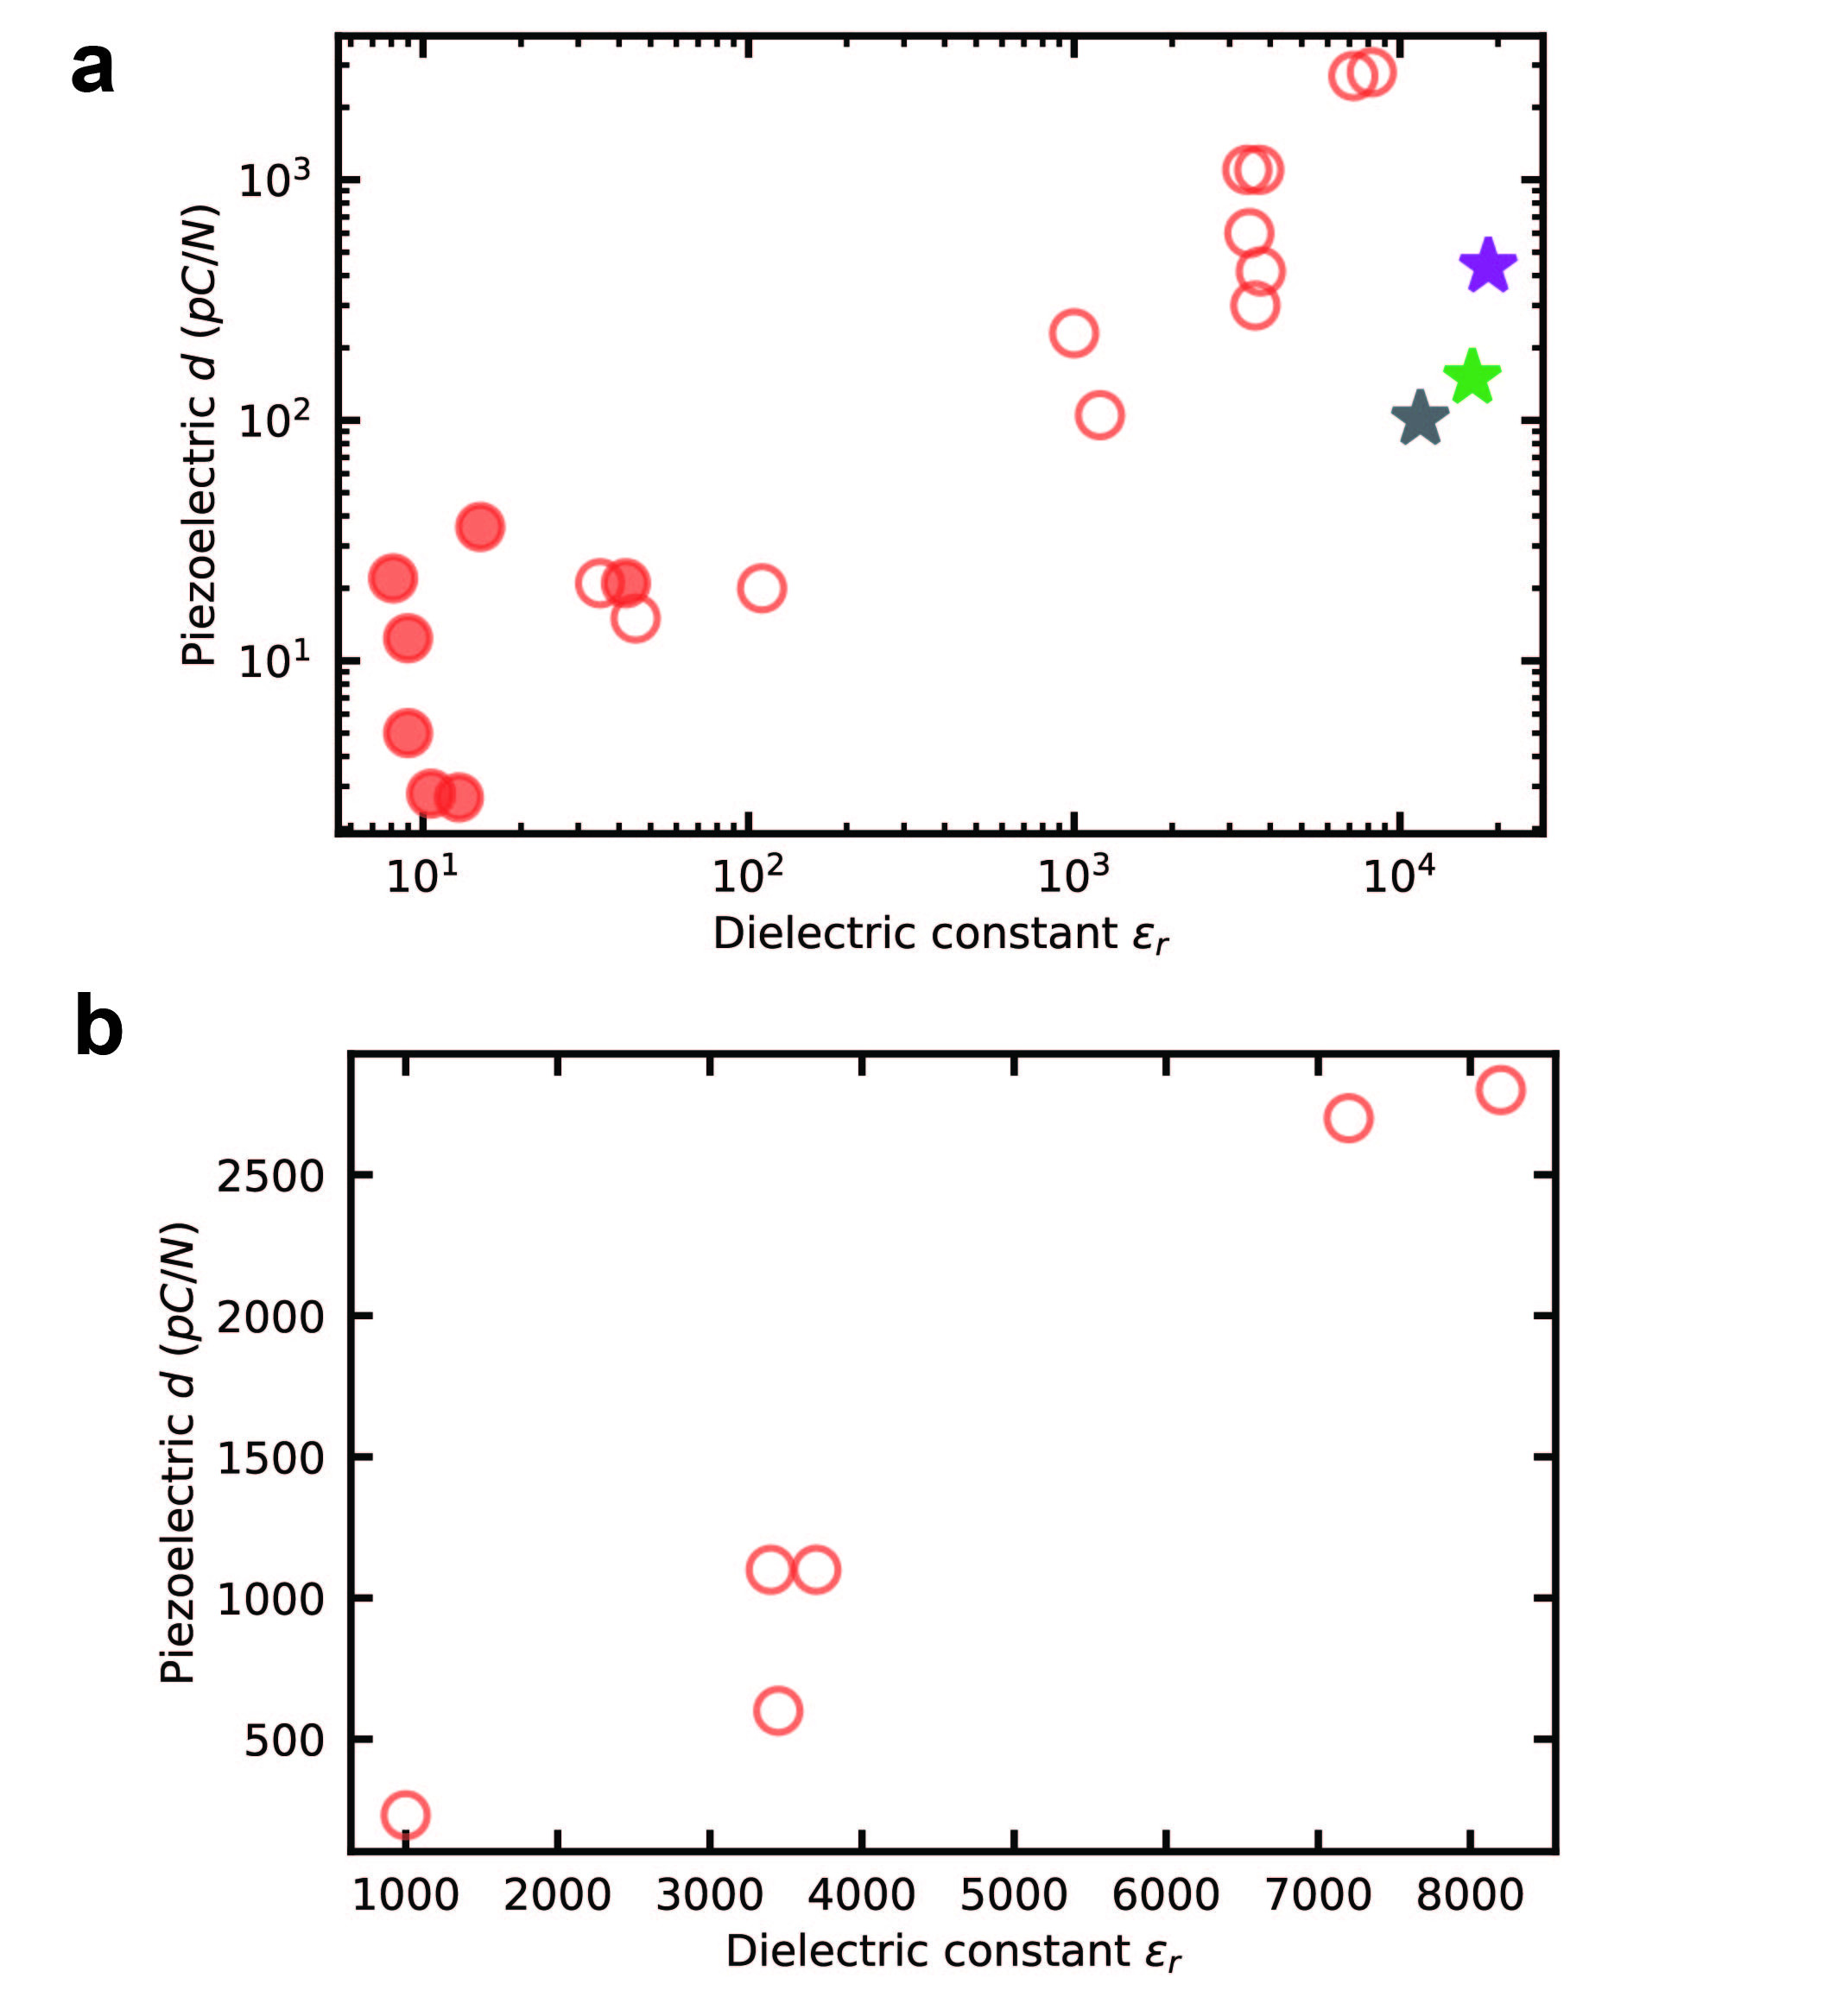
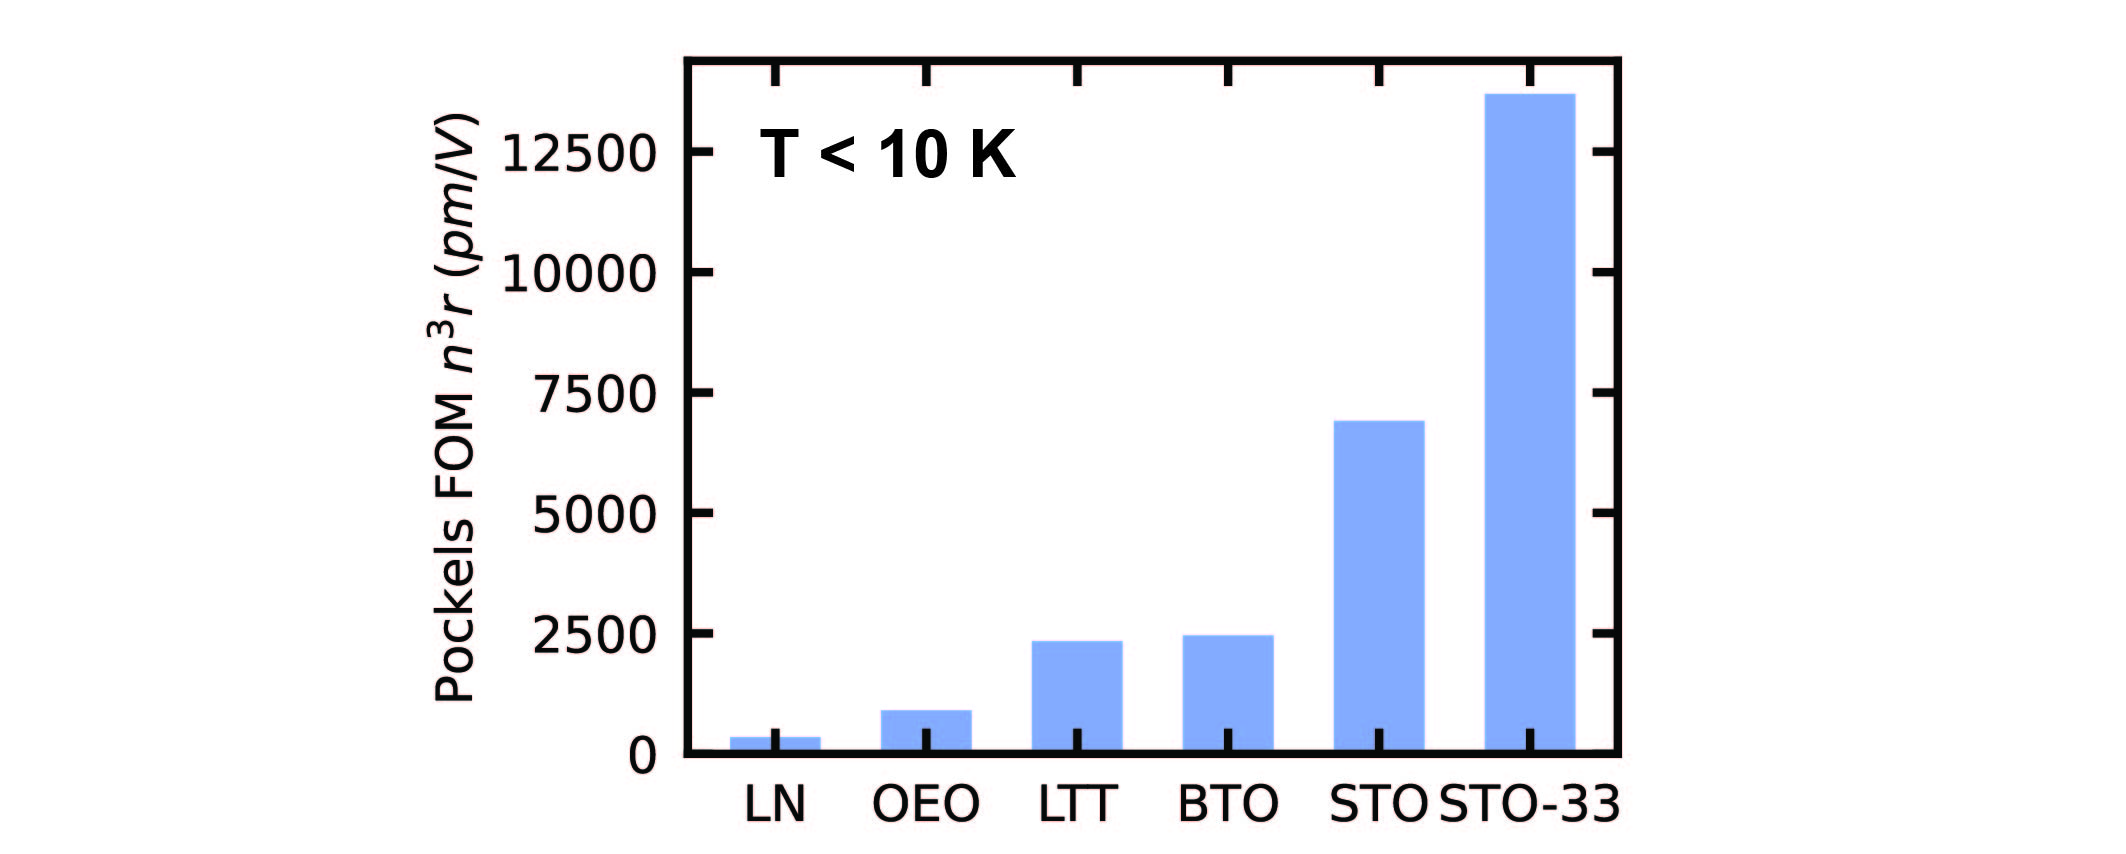
To better understand these results in the landscape of nonlinear materials, we compare the performance of natural and isotopically engineered STO with other piezo-electric and Pockels materials (more details in SI Section S13). First, we compare our results to existing reports of cryogenic ( K) nonlinearities in Fig. 4b, showing at least a 5 improvement over all previously reported materials, and more than a 40-fold improvement over lithium niobate. We then show the measured and as a function of for a wide range of perovskite materials measured at room temperature (Figures 4c and 4d). Following the insights outlined in this work, indeed these materials do fall within a narrow band, linearly dependent on the known and reflecting the similar , among materials.
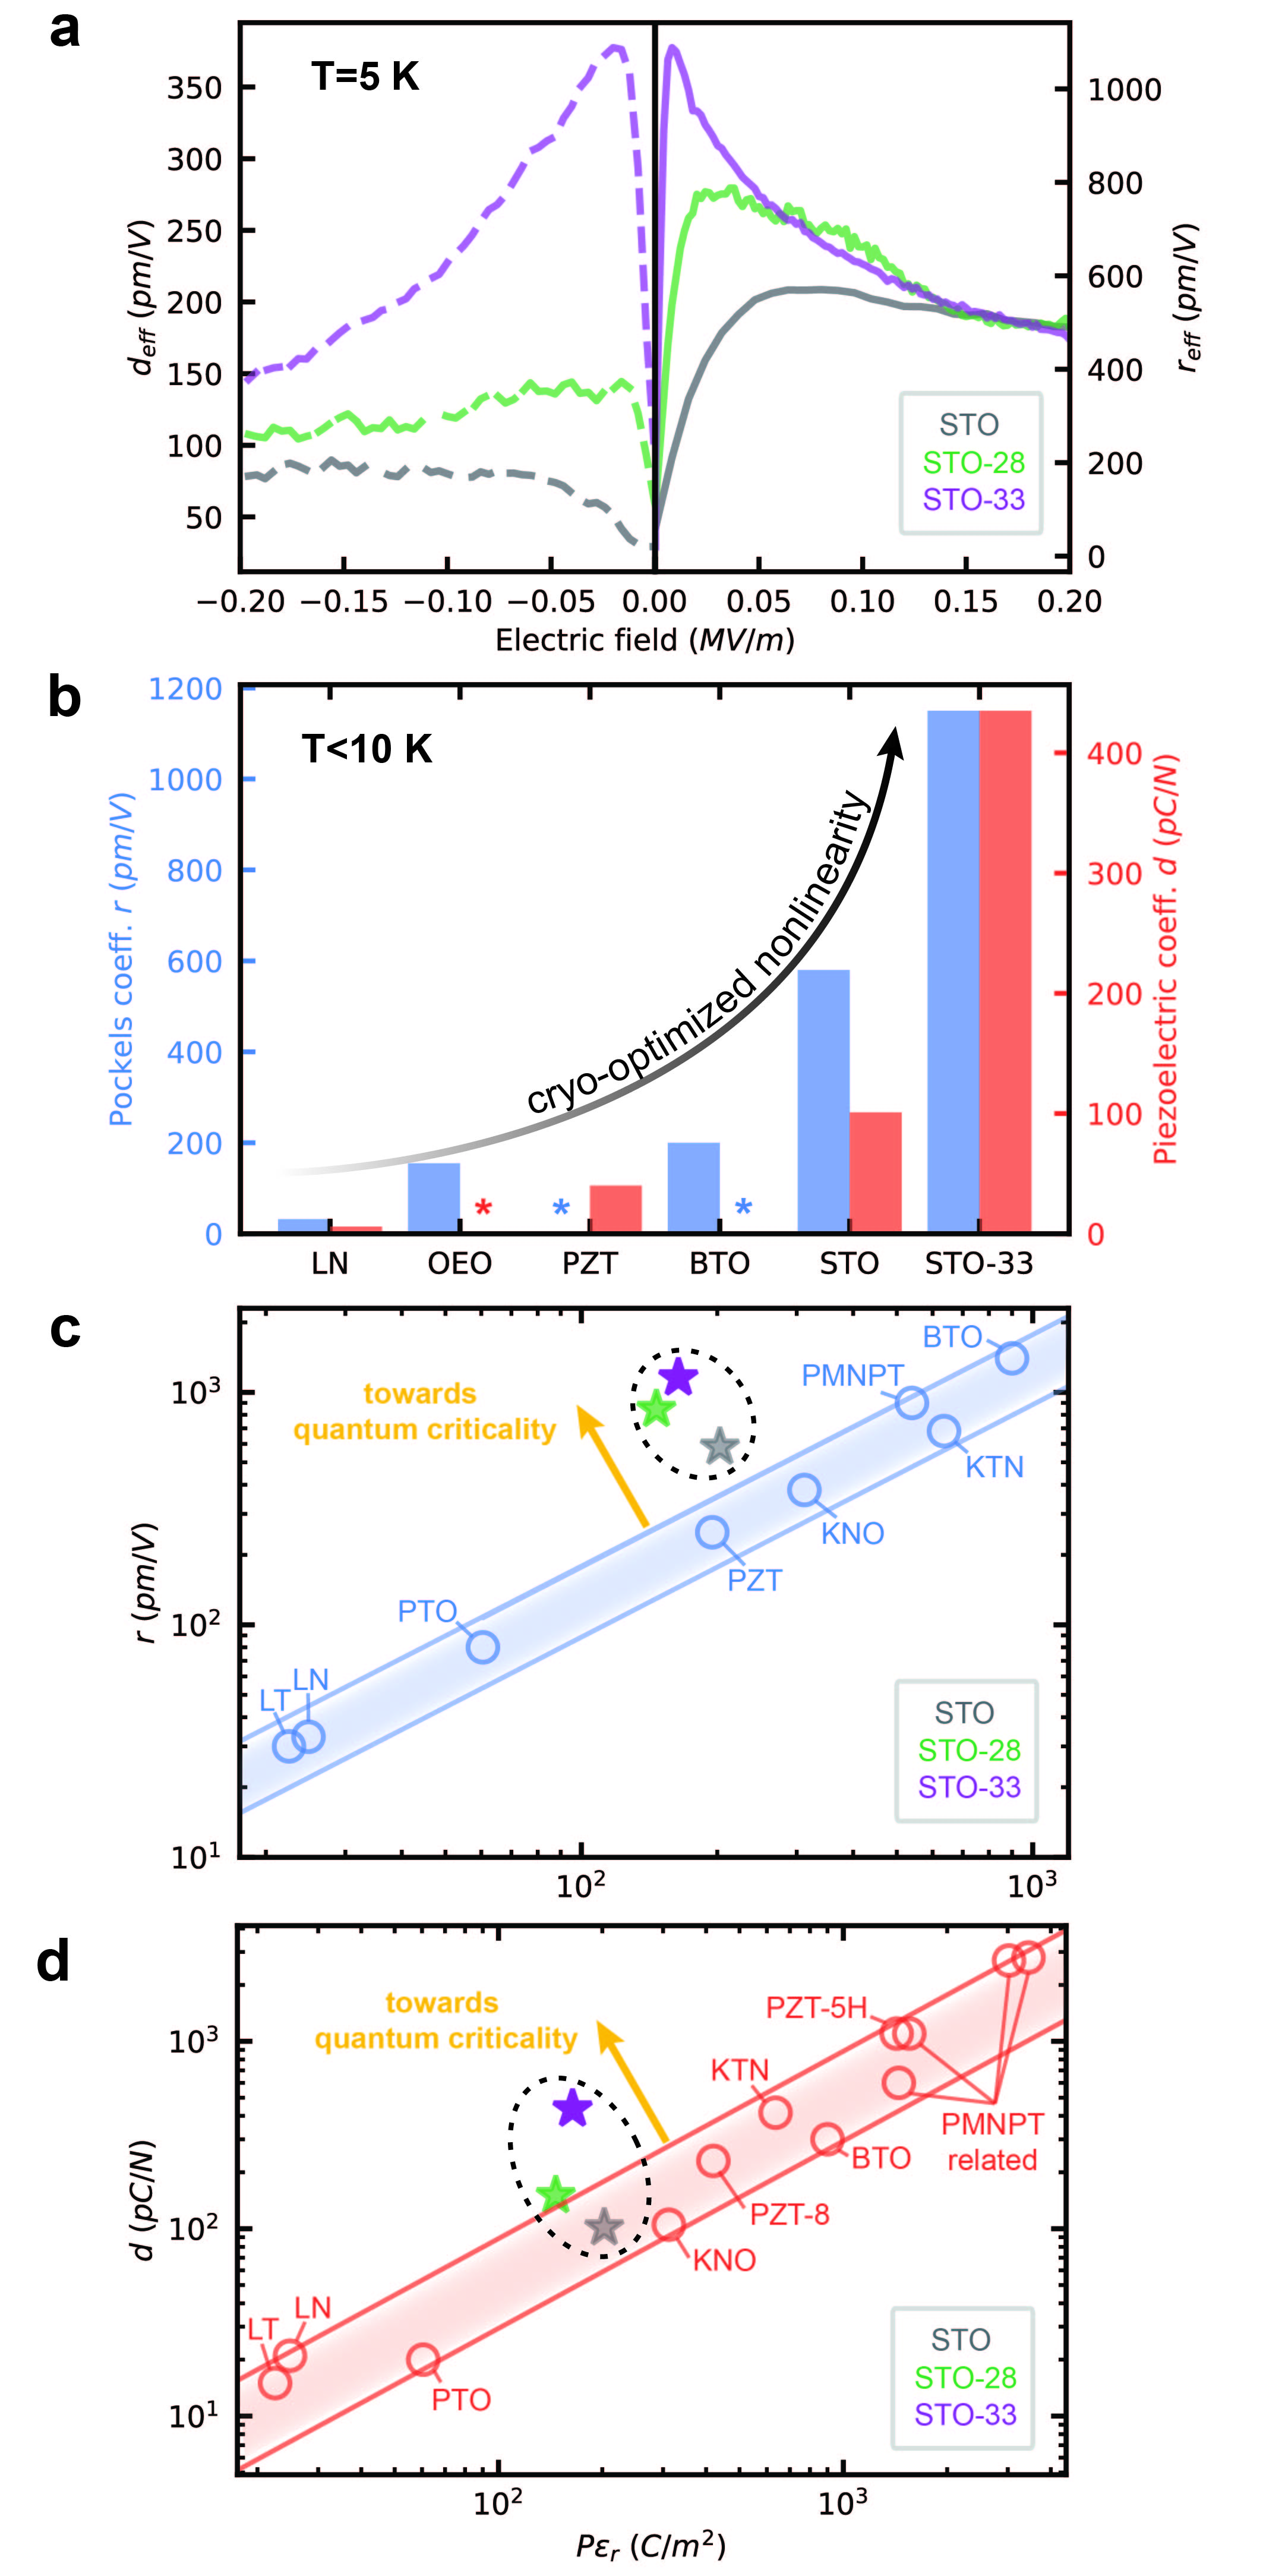
Therefore, up to a factor of order unity, is predictive of the strength of the electro-optic and piezo-electric response. Other works have suggested the scaling of piezo-electric materials with dielectric constant, but this relies on the similar electrical polarization found in ferroelectrics. By instead framing as a dependency on , not only is the trend in materials better described, but biased paraelectric materials can be directly compared. The notable exception to these trends is STO, which lies outside the band for the electro-optic effect in natural STO and further deviates as it is tuned to quantum criticality. For piezo-electricity, STO starts within the band of known materials, but is tuned outside the range at criticality. Despite the large changes in the peak dielectric constant, the maximum value of remains very similar among all our samples. Therefore, the increased nonlinearity arises from an unexpected and significant change in and , which are nominally similar for most materials (Table 1 and SI Section S12).
In traditional ferroelectric-paraelectric materials, the product of the Curie-Weiss constant, and the electrostrictive constant , have been shown to be almost the same over all materials 47. In STO, the connection is more intricate, as well known scaling laws do not hold. For example, even the mechanism for tuning the phase transition in STO by stabilizing quantum fluctuations differs fundamentally from a compositionally tuned ferroelectric materials like PZT or KTN 54. Therefore, we observe a distinct difference in quantum critical STO (near a quantum phase transition) compared to other perovskites which may be close to a classical phase transition (Fig. 4c,d).
As a result, the measured electrostrictive response for the isotopically substituted STO can also be classified as “giant”58, exceeding the heuristic scaling of known materials with the dielectric constant and the elastic compliance by more than one order of magnitude, and is therefore a “non-Newnham” electrostrictive material35.
Discussion
In this work, we propose a universal metric to understand second order optical and mechanical nonlinearities in materials, , whose change describes the full temperature and electrical bias dependence of a material’s nonlinearity– and is enhanced near phase transitions. Guided by this insight, we identify STO as an ideal material for cryogenic applications. We demonstrate large piezo-electric and electro-optic nonlinearities in STO that are further enhanced by tuning to quantum criticality. Surprisingly, while the observed behavior follows predictions, the scaling tensor coefficients and become drastically different from traditional ferroelectrics as STO approaches the QCP. Our measurements are also free from potential strain and clamping effects which may be present in grown films, and constitute the largest nonlinearities measured at cryogenic temperatures.
The observed strong nonlinearities unlock a wide range of opportunities for cryogenic classical and quantum applications. For example, the large Pockels effect reported here enables ultra-low VπL modulators for cryogenic photonics and efficient interconnects for superconducting microwave circuits43. Such a highly efficient modulator would allow for smaller device sizes with corresponding exponentially less loss and lower power consumption, critical to unlock the large-scale complex cryogenic photonic circuits desired for photonic quantum computing, for example32, 1 (additional discussion in SI Section S15). On the other hand, cryogenic piezo-electric systems could find use in space missions, low temperature scanners, cryofluid sensors and actuators60. Importantly, STO is foundry-compatible and lead-free, eliminating many of the processing and safety issues related to lithium niobate and lead-containing piezo-electrics.
Compared to traditional ferroelectric materials, quantum paraelectric materials biased to maximal nonlinearity have a much lower polarization and higher dielectric constant. An alternate pathway to nonlinearity would be to tune fully into the ferroelectric phase, where STO would display similarly large polarization while maintaining enhanced cryogenic nonlinearities. While our measurements are on bulk crystals of STO, scaling and integration with silicon electronic and photonic circuits is also feasible, with high quality Molecular Beam Epitaxy (MBE) at the wafer scale already demonstrated 4. Very recent reports have also measured ferroelectric STO thin films that outperform cryogenic BTO 48.
Our work highlights the advantages to exploring new photonic and piezo-electric materials that utilize exotic condensed matter physics to remove roadblocks for cryogenic technologies. It also suggests the exploration of related quantum paraelectric materials and low ferroelectrics for improved cryogenic optical and mechanical devices.
Methods
Landau-Ginzburg-Devonshire model
In general, we can understand the enhancement of nonlinearity near a phase transition by examining the Landau-Ginzburg-Devonshire phenomenological theory, which has been found to well describe the critical phenomena in ferroelectric-paraelectric systems5, 29. Here, the polarization () and electric field ( dependent Gibbs free energy, is:
| (4) |
The equilibrium state is found where the Gibbs free energy is minimized, and the dielectric constant is found through:
| (5) |
Usually, and are temperature independent or weakly dependent on temperature, while describes the effect of temperature. If negative then the transition is considered first order, if positive then second order. In our simulations, we set , , .
Zubko and Vendik extension for quantum paraelectrics
A variety of models have been used to describe the bias and temperature dependent response of the dielectric constant of STO. The best match with experiment13 comes from a solution of the Landau-Ginzburg-Devonshire equation by Vendik and Zubko50, 51, resulting in:
| (6) |
Where is the effective Curie-Weiss constant, with , where is the applied bias and the renormalizing field. is an integral which can be approximated as with as the Debye temperature of the relevant mode and as the Curie temperature.
In principle, one value of , , , and are needed to fit the entire temperature and voltage dependence of the dielectric constant. We first fit the temperature dependence under zero bias to fit all parameters except , which is explicitly related to the electric field dependence (Fig. S\fpeval7-4). The entire dataset is then globally fitted to extract , showing a very close match with the observed data (Fig. S\fpeval7-4). Our fit also allows for a small temperature-dependent offset field which reflects any built-in polarization (arising from strain or ferroelectricity, for example) which drives the asymmetry in Fig. 3, for example.
Dielectric measurements
Dielectric constants are extracted from the capacitance measured with a LCR meter and assume a parallel plate model, , where is the plate area and the thickness of the sample. This is a reasonable assumption due to the dimensions of the sample and the high dielectric constant which reduces fringing fields. A background capacitance is subtracted. (100) STO is used for all measurements so that the observed dielectric constants are all . With the dielectric response, , electrical polarization is found with:
| (7) |
All measurements are taken in a standard “P-E” hysteresis loop. All dielectric constant data was taken at 100 kHz with a drive voltage of 1 V. The electro-optic and piezo-electric data was also taken with a hysteresis loop. Reported data is an average over that loop.
Variable temperature interferometric measurement
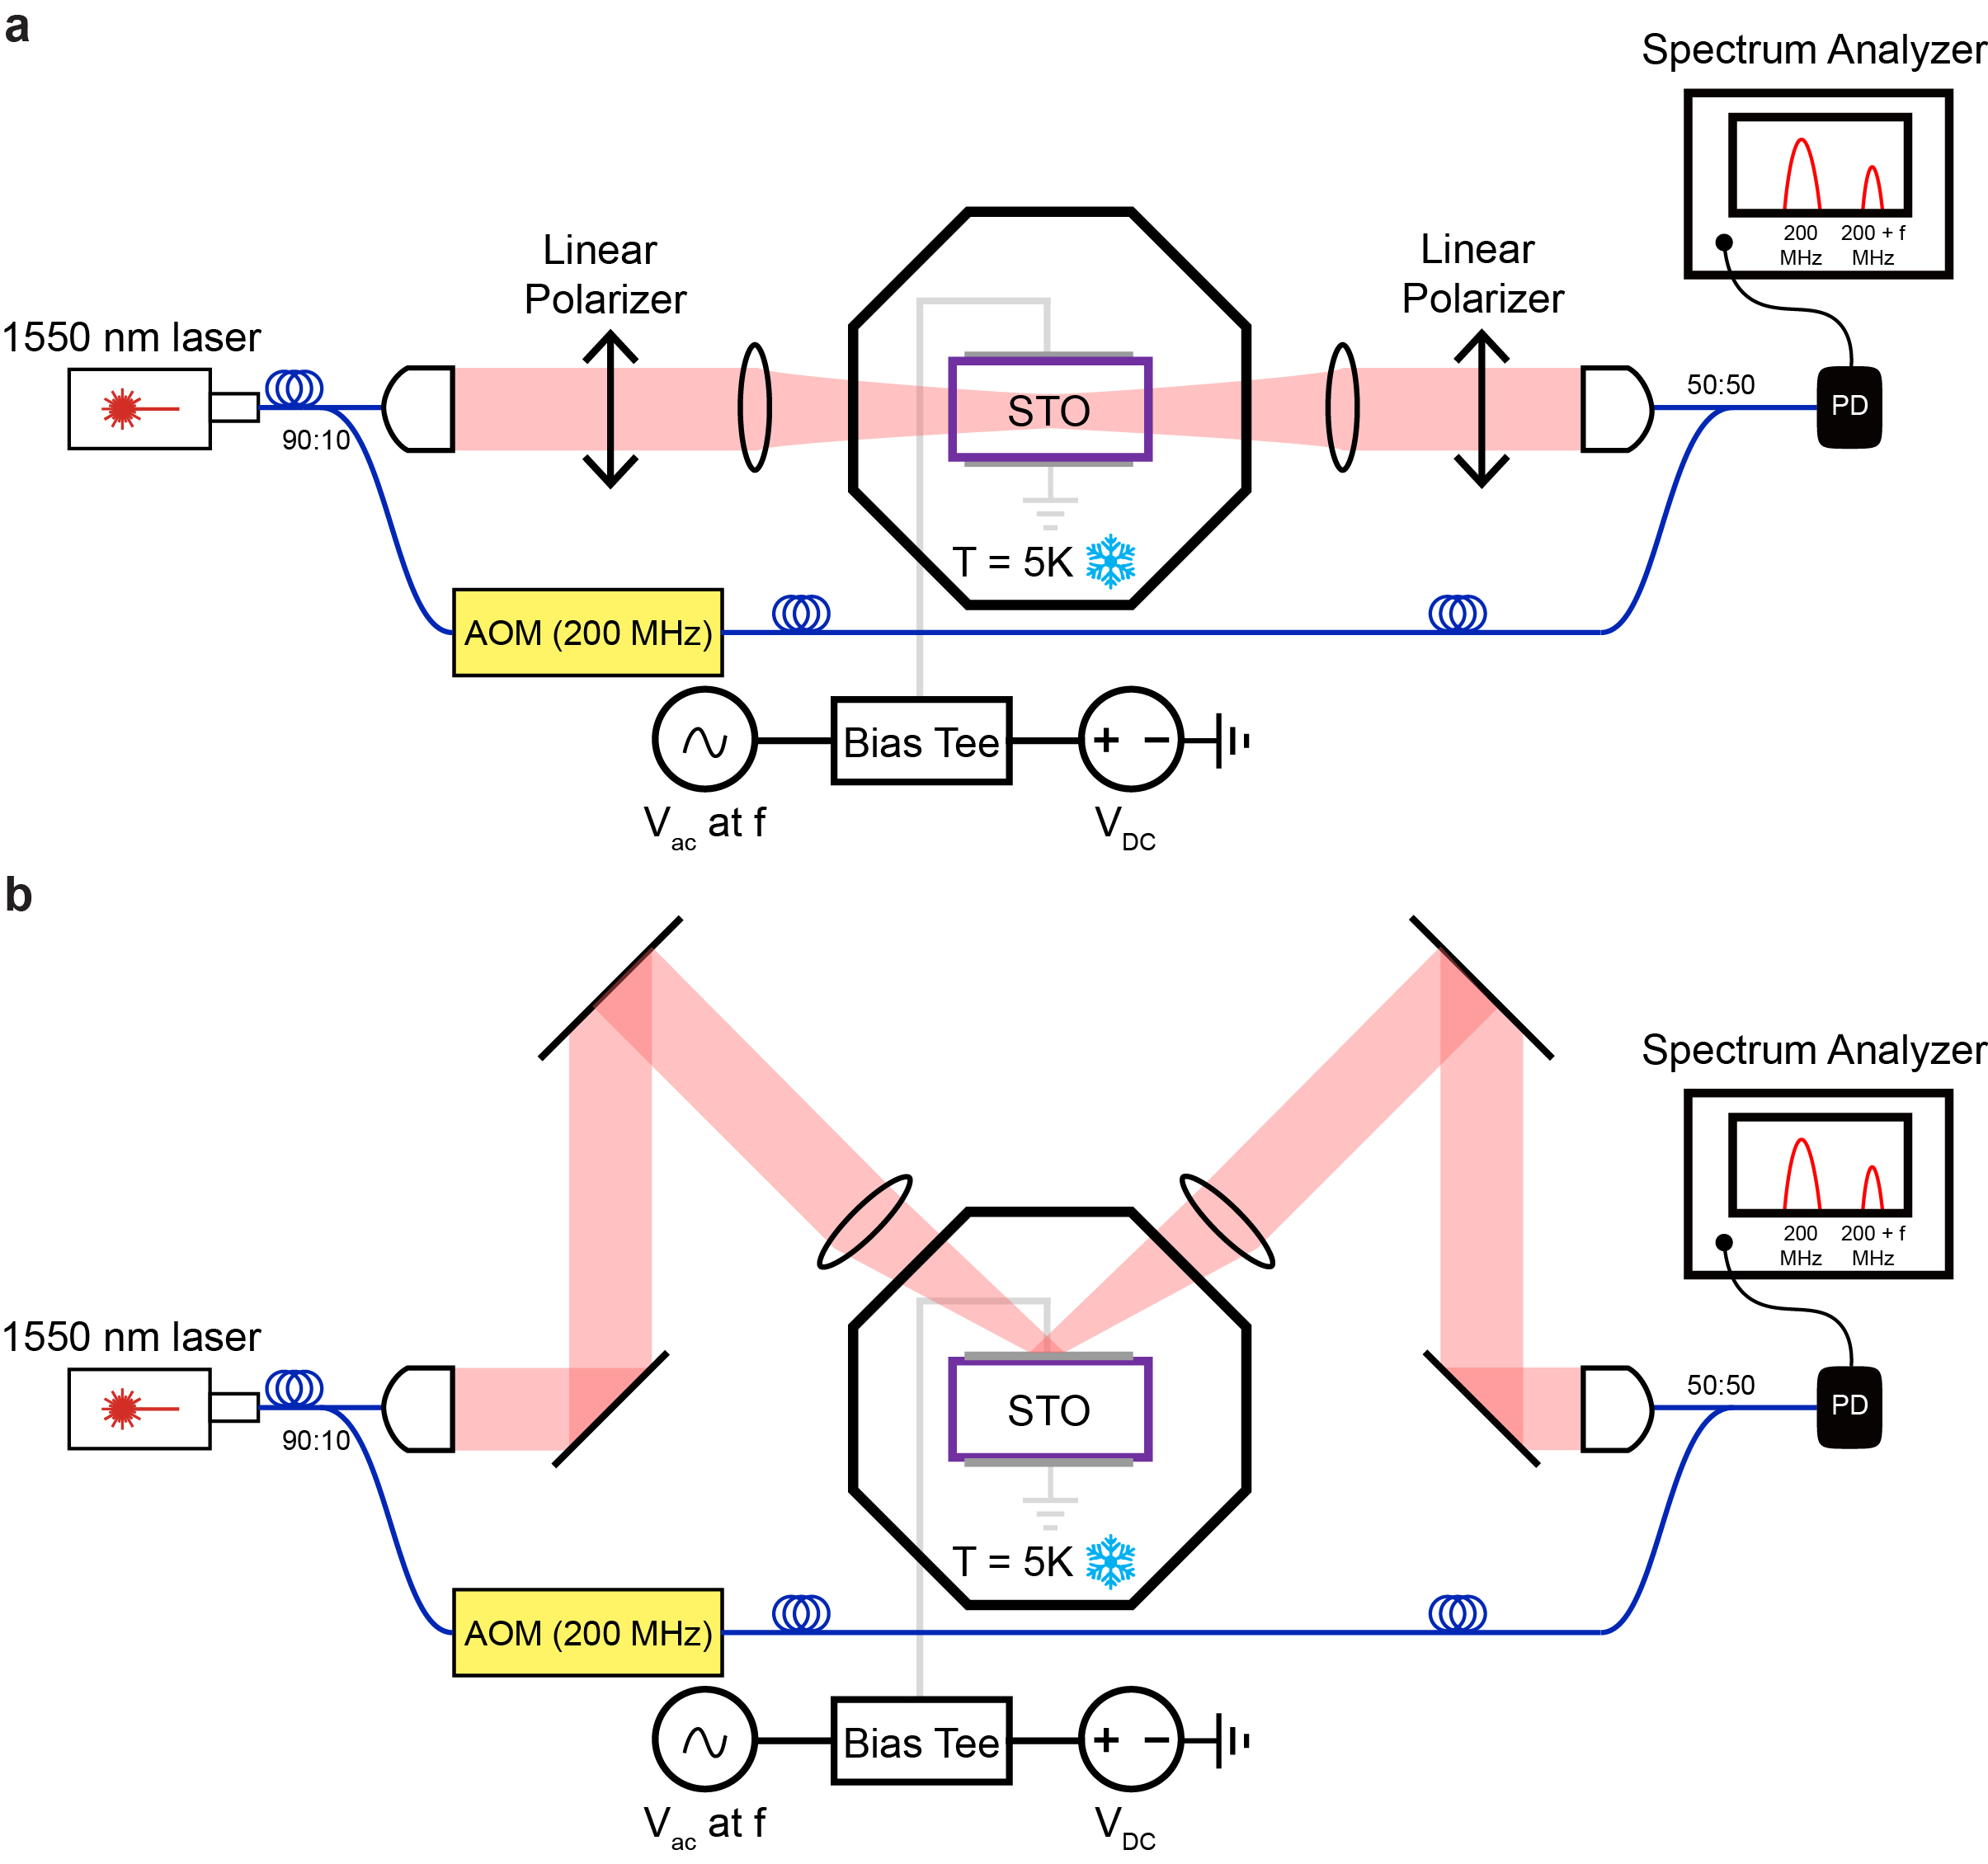
We measure the piezo-electric and electro-optic effect utilizing a sensitive Mach-Zehnder-Interferometer (MZI). Samples are mounted inside of a Montana Instruments S200 cryostat with a base temperature of T = 5 K and with rapid sample temperature control and electrical connections. A schematic is shown in Supplemental information Fig. S\fpeval8-4. The backside is affixed with a flexible but conductive adhesive, and the top surface is wire-bonded. The samples are metalized on the top and bottom surfaces with 30 nm of Pt and 50 nm of Au. The large work function of Pt avoids charge injection into the STO sample. The samples are commercially available 5x5 mm chips either 0.5 or 1 mm thick. A 1550 nm telecom laser (Anritsu MG9638A) is passed through a fiber beamsplitter. One arm is outcoupled in free space, passes first through a linear polarizer (LP) and is then focused onto the STO with a 200 mm lens. After transmitting through the STO the beam is re-collimated by another 200 mm lens, and passes through another linear polarizer, set to the same direction as the first LP. The other arm passes through a fiber coupled acousto-optic modulator (AOM, model 1550-AOM-2 manufactured by Aerodiode), which shifts the optical frequency by 200 MHz. The two arms are then recombined with a fiber beamsplitter, and the output power of one arm is monitored with a 50 terminated fast photo-diode (Thorlabs DET08CFC), and sent to a spectrum analyzer (Agilent N9030A).
Without interacting with the sample, the signal displays a beat note at the AOM frequency of 200 MHz, shifted away from DC noise and background. To measure the electro-optic effect, two side facets are polished to high optical quality and flatness to allow for laser transmission between the electrodes. An oscillating voltage at frequency is applied to the electrodes. The oscillating change of index due to the Pockels effect results in an oscillating phase shift which manifests as a further modulation on the power, creating signal at . By measuring the ratio of the power at and , a calibration free measurement can be made of the modulation index , which characterizes the strength of the phase shift (Supplemental information).
Measurement of the piezo-electric effect proceeds similarly, but with the laser reflected off the top metalized surface of the sample at a 45o angle. The moving “mirror” of the sample due to the applied bias causes an oscillating phase shift that can similarly be picked up by the interferometer. Typical laser powers are on the order of 1 mW at 1550 nm with a beam waist of order 100 m. The sample is mounted on a three-axis cryogenic nano-positioner which enables precise centering and alignment of the sample with respect to the beam. Electrical bias to the sample consists of both AC (Rigol DG4102) and DC (Keithley 2400) which are combined with a high voltage bias tee (Picosecond Pulse Labs 5530B). For all samples, at the highest voltages, the current never exceeds 25 nA. The strength of the electro-optic effect is independent of power between 0.1 mW and 6 mW, such that photorefractive screening is negligible. Further details can be found in the Supplementary information.
We calibrate our measurements by using a control chip of z-cut LiNbO3 (LN), measuring pm/V. This is about a 25% underestimate compared to the known value of 6 pm/V. We attribute this difference to the partially free moving boundary of the adhesive used to affix the sample. Mounting the sample multiple times did not change this underestimate. We therefore report here the piezo-electric coefficients of STO as a lower bound. This “loose” mounting also allows us to report coefficients nominally unaffected by strain. The frequency of piezo-electric measurements ranged from 20 kHz to 100 kHz, depending on the sample, to avoid sharp mechanical resonances.
The electro-optic nonlinearities do not suffer from this mounting detail. In LN, we measure 31 pm/V and 9 pm/V. These are within 10% of the reported values for LN. Our estimated uncertainty in the size of the electrode/length of the beam path is on this order of magnitude. All electro-optic data was taken at 100 kHz with a peak-to-peak drive voltage of 1 V. We observe that the calculated Pockels coefficient does not depend on the drive voltage between 0.2 V to 10 V.
Measurements were corrected for bias-tee and cable losses of the drive signals of about 1.3 dB. Our measurement is based on a power modulation observed at the output of the interferometer. For each experiment, the interferometer is bypassed to observe the sample-induced modulation of the laser intensity. For all experiments, the magnitude of this “pure power” modulation is at least 30 dB lower than the observed modulation due to the “true” induced phase shift. We estimate that this effect contributes to an overestimate of the nonlinearity by up to 3% at maximum.
Due to the quasi-cubic nature of STO, we report and as and but the corresponding and as and , to match convention from other works. We ignore the effects of antiferrodistortive structural phase transitions which occur at around 105 K.
Isotopically exchanged STO
Isotope substitution in STO samples is achieved through a high temperature annealing treatment in isotopically enriched oxygen gas. We begin with commercially available bulk STO chips, which are loaded into a furnace that is evacuated to a vacuum level of Torr with a turbomolecular pump. Then, the sample chamber is filled with 0.5 atm of 18O gas, and the sample is heated to C at a constant rate, for 300 minutes. The sample remains in the 18O rich environment at C for approximately 14 days (19998 minutes). At this higher temperature, the 18O pressure is 0.9 atm, and it is kept constant for the entire duration of the process. Subsequently, the sample is cooled down to room temperature for approximately 360 minutes by turning the heater off, and the chamber is pumped to the initial vacuum levels. To ensure an even distribution of the 18O isotopes throughout the bulk crystal, an additional vacuum annealing step is performed. This step involves heating to C in 300 minutes, and maintaining the sample at low vacuum levels and high temperature for 14 days. At the end of the process, the samples weight is recorded, and it is compared to the weight of the sample before the process to get an estimate of the 18O isotope concentration. Details regarding the total duration of the 18O and vacuum anneals, as well as the 18O estimate based on the weight measurement for all samples can be found in Table 2 in the Supplementary information.
Isotope content is verified using nanoscale secondary ion mass spectrometry (nanoSIMS), with the Cameca NanoSIMS 50L at the Stanford Nano Shared Facilities, and cross-checked with the weight-based measurement (Supplemental Information). Analyses are performed using a Cs+ primary ion beam set to an operating current of 5 pA and total impact energy of 16 keV. Detectors are set to measure masses 16O- and 18O- at a mass resolution of 6000 (Cameca definition) to avoid interferences. Before the measurements, we coat the entire sample with 10nm of gold for conductivity and perform a 20-30 minute pre-sputtering step inside the NanoSIMS 50L to remove superficial gold and etch into the STO. The measurements are performed by raster scanning multiple areas 2525 in size, at a resolution of 256256 pixels per data frame. Each analysis consists of 20-60 frames of data that are stacked to improve precision, and the first 5-20 frames are discarded as the beam sputters through the surface coatings and reaches a steady state of Cs+ implantation. The error on our measurement of the isotope concentration is calculated based on the recorded variance in 16O and 18O concentrations and is less than % in all measurements (SI Section S16).
Data availability
The experimental data and numerical simulations presented here are available from the corresponding authors upon reasonable request.
References
- Scaling and networking a modular photonic quantum computer. Nature, pp. 1–8. Cited by: Discussion, Quantum critical electro-optic and piezo-electric nonlinearities.
- A manufacturable platform for photonic quantum computing. External Links: 2404.17570, Link Cited by: Quantum critical electro-optic and piezo-electric nonlinearities.
- Nonlinear optics, fourth edition. External Links: ISBN 9780323850575 Cited by: Linking nonlinearity and phase transitions, Linking nonlinearity and phase transitions.
- Growth of homoepitaxial SrTiO3 thin films by molecular-beam epitaxy. Applied Physics Letters 94 (16), pp. 162905. External Links: ISSN 0003-6951, Document, Link, https://pubs.aip.org/aip/apl/article-pdf/doi/10.1063/1.3117365/13872261/162905_1_online.pdf Cited by: Discussion.
- Ferroelectric, dielectric and piezoelectric properties of ferroelectric thin films and ceramics. 61 (9), pp. 1267. External Links: Document, Link Cited by: Linking nonlinearity and phase transitions, Landau-Ginzburg-Devonshire model.
- Oxygen‐Octahedra Ferroelectrics. I. Theory of Electro‐optical and Nonlinear optical Effects. Journal of Applied Physics 40 (2), pp. 720–734. External Links: ISSN 0021-8979, Document, Link, https://pubs.aip.org/aip/jap/article-pdf/40/2/720/18348439/720_1_online.pdf Cited by: Linking nonlinearity and phase transitions.
- Nonlinear and quantum photonics using integrated optical materials. 9 (5), pp. 321–346. External Links: ISSN 2058-8437, Link, Document Cited by: Quantum critical electro-optic and piezo-electric nonlinearities.
- An integrated optical modulator operating at cryogenic temperatures. Nature Materials 19 (11), pp. 1164–1168. External Links: ISSN 1476-4660, Link, Document Cited by: Quantum critical electro-optic and piezo-electric nonlinearities, Optical and mechanical nonlinearity in SrTiO3, Quantum critical electro-optic and piezo-electric nonlinearities, Quantum critical electro-optic and piezo-electric nonlinearities.
- Piezoelectricity of SrTiO3: an ab initio description. Phys. Rev. B 88, pp. 035102. External Links: Document, Link Cited by: Optical and mechanical nonlinearity in SrTiO3.
- Superconducting cavity electro-optics: a platform for coherent photon conversion between superconducting and photonic circuits. Science Advances 4 (8), pp. eaar4994. External Links: Document, Link, https://www.science.org/doi/pdf/10.1126/sciadv.aar4994 Cited by: Quantum critical electro-optic and piezo-electric nonlinearities.
- Reversible and tunable second-order nonlinear optical susceptibility in pzt thin films for integrated optics. 9 (16), pp. 2100149. External Links: Document, Link, https://onlinelibrary.wiley.com/doi/pdf/10.1002/adom.202100149 Cited by: Quantum critical electro-optic and piezo-electric nonlinearities.
- Interferometric Determination of the Quadratic Electro‐Optic Coefficients in SrTiO3 Crystal. Journal of Applied Physics 41 (10), pp. 4118–4120. External Links: ISSN 0021-8979, Document, Link, https://pubs.aip.org/aip/jap/article-pdf/41/10/4118/7944523/4118_1_online.pdf Cited by: Linking nonlinearity and phase transitions, Optical and mechanical nonlinearity in SrTiO3.
- Quantum paraelectric states in SrTiO3 and KTaO3: Barrett Model, Vendik Model, and Quantum Criticality. Journal of the Physical Society of Japan 85 (7), pp. 074703. External Links: ISSN 1347-4073, Link, Document Cited by: Zubko and Vendik extension for quantum paraelectrics.
- KTN optical waveguide devices with an extremely large electro-optic effect. In Passive Components and Fiber-based Devices, Y. Sun, S. Jian, S. B. Lee, and K. Okamoto (Eds.), Vol. 5623, pp. 518 – 532. External Links: Document, Link Cited by: Optical and mechanical nonlinearity in SrTiO3, Optical and mechanical nonlinearity in SrTiO3.
- Miller’s phenomenological rule for computing nonlinear susceptibilities. IEEE Journal of Quantum Electronics 2 (8), pp. 328–329. External Links: Document Cited by: Linking nonlinearity and phase transitions.
- Microwave dielectric properties of single-crystal quantum paraelectrics KTaO3 and SrTiO3 at cryogenic temperatures. Journal of Applied PhysicsPhys. Rev. Lett.Nature Reviews MaterialsReports on Progress in PhysicsThe Journal of Physical Chemistry BSolid State CommunicationsPhys. Rev. BJournal of Physics D: Applied PhysicsApplied Physics ReviewsAIP AdvancesScience Advancesnpj Computational MaterialsNatureNature ElectronicsNTT Technical ReviewJournal of Applied PhysicsPhys. Rev. BIEEE Transactions on Ultrasonics, Ferroelectrics, and Frequency ControlJournal of Physics D: Applied PhysicsPhys. Rev. Mater.Phys. Rev.Journal of Applied PhysicsJournal of Applied PhysicsPhys. Rev. BJournal of MateriomicsApplied Physics ExpressAPL MaterialsPhys. Rev. Lett.NaturePhys. Rev. BJournal of Applied PhysicsarXiv preprint arXiv:2502.14349Journal of Physics: PhotonicsJournal of Applied PhysicsJapanese Journal of Applied PhysicsPhys. Rev. BAdvanced Optical Materialsphysica status solidi (a)Scientific ReportsJournal of Applied PhysicsJournal of Applied PhysicsOptics CommunicationsProceedings of the National Academy of SciencesPRX QuantumJournal of Physics: Condensed MatterPhys. Rev. Appl.Landolt-Börnstein - Group III Condensed Matter 97 (10), pp. 104111. Cited by: Optical and mechanical nonlinearity in SrTiO3.
- Giant piezoelectric effect in strontium titanate at cryogenic temperatures. Science 276 (5311), pp. 392–394. External Links: Document, Link, https://www.science.org/doi/pdf/10.1126/science.276.5311.392 Cited by: Optical and mechanical nonlinearity in SrTiO3.
- Erratum: indications of a T= 0 quantum phase transition in SrTiO3. Physical Review Letters 82 (14), pp. 3001–3001. External Links: ISSN 1079-7114, Link, Document Cited by: Optical and mechanical nonlinearity in SrTiO3.
- Room-temperature ferroelectricity in strained SrTiO3. Nature 430 (7001), pp. 758–761. External Links: ISSN 1476-4687, Link, Document Cited by: Optical and mechanical nonlinearity in SrTiO3.
- First-principles study of the linear electro-optical response in strained . 2, pp. 115202. External Links: Document, Link Cited by: Optical and mechanical nonlinearity in SrTiO3.
- Electro-optic behavior of lithium niobate at cryogenic temperatures. Optics Communications 281 (4), pp. 793–796. External Links: ISSN 0030-4018, Document, Link Cited by: Quantum critical electro-optic and piezo-electric nonlinearities, Optical and mechanical nonlinearity in SrTiO3.
- Enhanced electro-optic effect in potassium lithium tantalate niobate at the paraelectric phase near tc. Results in Physics 23, pp. 104059. External Links: ISSN 2211-3797, Document, Link Cited by: Linking nonlinearity and phase transitions, Optical and mechanical nonlinearity in SrTiO3.
- Fast varifocal lenses based on KTa1-xNbxO3 (KTN) single crystals. 7 (12), pp. 32–36. External Links: ISSN 2436-5327, Link, Document Cited by: Enhancing nonlinearity near quantum criticality.
- Ferroelectricity induced by oxygen isotope exchange in strontium titanate perovskite. Phys. Rev. Lett. 82, pp. 3540–3543. External Links: Document, Link Cited by: Quantum critical electro-optic and piezo-electric nonlinearities, Enhancing nonlinearity near quantum criticality.
- Efficient bidirectional piezo-optomechanical transduction between microwave and optical frequency. Nature Communications 11 (1). External Links: ISSN 2041-1723, Link, Document Cited by: Quantum critical electro-optic and piezo-electric nonlinearities.
- SrTiO3—glimpses of an inexhaustible source of novel solid state phenomena. Condensed Matter 5 (4), pp. 58. External Links: ISSN 2410-3896, Link, Document Cited by: Optical and mechanical nonlinearity in SrTiO3.
- Electrostrictive effect in ferroelectrics: An alternative approach to improve piezoelectricity. 1 (1), pp. 011103. External Links: ISSN 1931-9401, Document, Link, https://pubs.aip.org/aip/apr/article-pdf/doi/10.1063/1.4861260/14573406/011103_1_online.pdf Cited by: Optical and mechanical nonlinearity in SrTiO3.
- Terahertz field-induced ferroelectricity in quantum paraelectric SrTiO3. Science 364 (6445), pp. 1079–1082. External Links: Document, Link, https://www.science.org/doi/pdf/10.1126/science.aaw4913 Cited by: Optical and mechanical nonlinearity in SrTiO3.
- 4.05 - piezoelectric and ferroelectric materials: fundamentals, recent progress, and applications. In Comprehensive Inorganic Chemistry III (Third Edition), J. Reedijk and K. R. Poeppelmeier (Eds.), pp. 135–171. External Links: ISBN 978-0-12-823153-1, Document, Link Cited by: Landau-Ginzburg-Devonshire model.
- Integrated optical multi-ion quantum logic. Nature 586 (7830), pp. 533–537. External Links: ISSN 1476-4687, Link, Document Cited by: Quantum critical electro-optic and piezo-electric nonlinearities.
- Derivation of Miller’s rule for the nonlinear optical susceptibility of a quantum anharmonic oscillator. Journal of Physics B: Atomic, Molecular and Optical Physics 57 (9), pp. 095001. External Links: Document, Link Cited by: Linking nonlinearity and phase transitions.
- 2022 roadmap on integrated quantum photonics. 4 (1), pp. 012501. Cited by: Discussion.
- SrTiO3: an intrinsic quantum paraelectric below 4 K. Phys. Rev. B 19, pp. 3593–3602. External Links: Document, Link Cited by: Optical and mechanical nonlinearity in SrTiO3.
- Permittivity of Strontium Titanate. 43 (5), pp. 2124–2131. External Links: ISSN 0021-8979, Document, Link, https://pubs.aip.org/aip/jap/article-pdf/43/5/2124/18360952/2124_1_online.pdf Cited by: Optical and mechanical nonlinearity in SrTiO3.
- Electrostriction: nonlinear electromechanical coupling in solid dielectrics. 101 (48), pp. 10141–10150. External Links: Document, Link, https://doi.org/10.1021/jp971522c Cited by: Linking nonlinearity and phase transitions, Trends in nonlinear materials.
- [36] (2002) Oxides. External Links: ISBN 3540632743, Link, Document Cited by: Optical and mechanical nonlinearity in SrTiO3.
- Cryogenic optical characterization of nonlinear polymers. In Conference on Lasers and Electro-Optics 2010, pp. CTuR3. External Links: Link, Document Cited by: Optical and mechanical nonlinearity in SrTiO3.
- An integrated magneto-optic modulator for cryogenic applications. Nature Electronics 5 (9), pp. 604–610. External Links: ISSN 2520-1131, Link, Document Cited by: Quantum critical electro-optic and piezo-electric nonlinearities, Quantum critical electro-optic and piezo-electric nonlinearities.
- A ferroelectric quantum phase transition inside the superconducting dome of Sr1-xCaxTiO3-δ. Nature Phys 13, pp. 643–648. External Links: Document, Link Cited by: Optical and mechanical nonlinearity in SrTiO3.
- Ferroelectric quantum criticality. Nature Physics 10 (5), pp. 367–372. External Links: ISSN 1745-2481, Link, Document Cited by: Enhancing nonlinearity near quantum criticality.
- Miller’s rule and the static limit for second-harmonic generation. Phys. Rev. B 51, pp. 6928–6931. External Links: Document, Link Cited by: Linking nonlinearity and phase transitions.
- Single atoms with 6000-second trapping lifetimes in optical-tweezer arrays at cryogenic temperatures. 16, pp. 034013. External Links: Document, Link Cited by: Quantum critical electro-optic and piezo-electric nonlinearities.
- Photonic link from single-flux-quantum circuits to room temperature. Nature Photonics 18 (4), pp. 371–378. External Links: ISSN 1749-4893, Link, Document Cited by: Discussion, Quantum critical electro-optic and piezo-electric nonlinearities.
- Scalable fault-tolerant quantum technologies with silicon color centers. 5, pp. 010102. External Links: Document, Link Cited by: Quantum critical electro-optic and piezo-electric nonlinearities.
- Electro-optic modulation in integrated photonics. Journal of Applied Physics 130 (1). External Links: ISSN 1089-7550, Link, Document Cited by: Quantum critical electro-optic and piezo-electric nonlinearities, Quantum critical electro-optic and piezo-electric nonlinearities.
- Advanced piezoelectric materials: science and technology. Woodhead Publishing. Cited by: Quantum critical electro-optic and piezo-electric nonlinearities.
- Electrostrictive and piezoelectric effects in relaxor ferroelectrics: historical background. 69 (11), pp. 3013–3036. External Links: Document Cited by: Linking nonlinearity and phase transitions, Optical and mechanical nonlinearity in SrTiO3, Trends in nonlinear materials.
- Engineering high pockels coefficients in thin-film strontium titanate for cryogenic quantum electro-optic applications. External Links: Document, Link Cited by: Optical and mechanical nonlinearity in SrTiO3, Discussion, Acknowledgments.
- Ferroelectric tuning of planar and bulk microwave devices. Journal of Superconductivity 12 (2), pp. 325–338. External Links: ISSN 0896-1107, Link, Document Cited by: Optical and mechanical nonlinearity in SrTiO3.
- Phenomenological description of the permittivity of strontium titanate as a function of applied electric field and temperature. Technical Physics 42 (3), pp. 278–281. External Links: ISSN 1090-6525, Link, Document Cited by: Optical and mechanical nonlinearity in SrTiO3, Zubko and Vendik extension for quantum paraelectrics.
- Modeling the dielectric response of incipient ferroelectrics. Journal of Applied Physics 82 (9), pp. 4475–4483. External Links: ISSN 0021-8979, Document, Link, https://pubs.aip.org/aip/jap/article-pdf/82/9/4475/18696677/4475_1_online.pdf Cited by: Zubko and Vendik extension for quantum paraelectrics.
- Integrated lithium niobate electro-optic modulators operating at CMOS-compatible voltages. Nature 562 (7725), pp. 101–104. External Links: ISSN 1476-4687, Link, Document Cited by: Quantum critical electro-optic and piezo-electric nonlinearities.
- Lithium tantalate photonic integrated circuits for volume manufacturing. Nature, pp. 1–7. Cited by: Quantum critical electro-optic and piezo-electric nonlinearities.
- Suppression of the quantum fluctuation in -enriched strontium titanate. 64, pp. 174104. External Links: Document, Link Cited by: Trends in nonlinear materials.
- Potassium tantalate niobate crystals: efficient quadratic electro-optic materials and their laser modulation technology. 9 (5), pp. 838–854. External Links: ISSN 2352-8478, Document, Link Cited by: Optical and mechanical nonlinearity in SrTiO3.
- Fabrication and photonic applications of Si-integrated LiNbO3 and BaTiO3 ferroelectric thin films. 12 (2), pp. 020601. External Links: ISSN 2166-532X, Document, Link, https://pubs.aip.org/aip/apm/article-pdf/doi/10.1063/5.0192018/19549891/020601_1_5.0192018.pdf Cited by: Quantum critical electro-optic and piezo-electric nonlinearities, Quantum critical electro-optic and piezo-electric nonlinearities.
- A cryogenic electro-optic interconnect for superconducting devices. Nature Electronics 4 (5), pp. 326–332. External Links: ISSN 2520-1131, Link, Document Cited by: Quantum critical electro-optic and piezo-electric nonlinearities.
- Defining “giant” electrostriction. 131 (17), pp. 170701. External Links: ISSN 0021-8979, Document, Link, https://pubs.aip.org/aip/jap/article-pdf/doi/10.1063/5.0079510/19807168/170701_1_online.pdf Cited by: Trends in nonlinear materials.
- Origin of the giant quadratic electro-optic effect in KTa1-xNbxO3 single crystals. Optical Materials 46, pp. 429–431. External Links: ISSN 0925-3467, Document, Link Cited by: Linking nonlinearity and phase transitions.
- Cryogenic piezoelectric materials for transducer applications. In Low Temperature Materials and Mechanisms, pp. 201–230. Cited by: Discussion, Quantum critical electro-optic and piezo-electric nonlinearities.
Acknowledgments
This work was supported by a Vannevar Bush Faculty Fellowship from the US Department of Defense, Samsung Electronics, and by the Department of Energy under the Q-NEXT program and Grant No. DE-SC0020115E. This work was partially funded by an unrestricted gift from Google. C.P.A. acknowledges support by an appointment to the Intelligence Community Postdoctoral Research Fellowship Program at Stanford University administered by Oak Ridge Institute for Science and Education (ORISE) through an interagency agreement between the U.S. Department of Energy and the Office of the Director of National Intelligence (ODNI). G.S. acknowledges support from the Stanford Bloch Postdoctoral Fellowship. S.E. acknowledges support from the Shoucheng Zhang Graduate Fellowship and Korea Foundation for Advanced Studies Overseas Ph.D. Fellowship. Part of this work was performed at the Stanford Nanofabrication Facility (SNF) and the Stanford Nano Shared Facilities (SNSF), supported by the NSF under Grant No. ECCS-2026822. The work at the University of Michigan is supported by the National Science Foundation under Award No.DMR-2317618 (sample isotope annealing) and is supported by the Department of Energy under Award No. DE-SC0020184 (dielectric characterization).
We thank Daniil Lukin, Melissa Guidry, Joshua Yang, Zelong Yin and Yujia Yuan for assistance with characterizing initial SrTiO3 materials. We thank Erik Szakiel, Wentao Jiang, and Sahil Dagli for discussions and fabrication assistance on related devices. We thank Jason (Shangqing) Huang and Eric Rosenthal for comments on the manuscript.
Note added.— During preparation of this work, we were made aware of complementary work measuring cryogenic properties of STO thin films 48.
Author contributions
C.P.A. and G.S. conceived and designed the experiment. C.P.A. and G.S. built the measurement system, performed the experiment, and analyzed the data. A.C. and L.L. created the isotopically substituted STO. K.V.G. and S.E. assisted with sample polishing and preparation. K.V.G., S.E., A. D. W., G.H.A. and C.J. assisted with the measurements. J.V. and A.S.N. supervised the work. C.P.A., G.S., and J.V. wrote the manuscript with extensive input from the other authors.
Competing interests
The authors declare no competing interests.
Corresponding author
Correspondence and requests for materials should be addressed to C. P. Anderson (cpand@illinois.edu) and J. Vučković (jela@stanford.edu).
Supplemental information: Quantum critical electro-optic and piezo-electric nonlinearities
S1 Miller’s rules
| (2) |
In ferroelectrics 6 and anharmonic potentials2, 3, the proportionality constant, “Miller’s ” is found to be proportional to the electrical polarization of the crystal . For electro-optics, where two fields are at optical frequencies (input and output) and the electric field is near DC () and by using the definition , then:
| (3) |
| (4) |
Using the proportionality of to :
| (5) |
| (6) |
As many materials have a similar order of magnitude for the spontaneous electrical polarization in ferroelectrics (an ion mediating polarization can only move order one lattice constant), usually Miller’s rules are framed purely in terms of susceptibilities. Importantly, because the optical susceptibilities are low and similar material-to-material, the low frequency is a major determining factor of nonlinearity (Fig. S\fpeval5-4).
S2 Biased
An effective can be engineered by biasing a material with electric field. We first begin with the definitions of the nonlinear susceptibilities:
| (7) |
Here, we can see that if :
| (8) |
Expanding:
| (9) |
Terms can be gathered according to the expansion with the signal field, , such that:
| (10) |
Where is the zero-bias . Therefore, a DC bias can introduced a effective , based on the strength of and the bias field, . This has been utilized for cryogenic modulators in Si and SiGe , for example4, 28.
Biased quadratic nonlinearities
Generally, linear electro-optic and piezo-electric effects in materials can be thought of as a quadratic nonlinearity biased by spontaneous, remnant, or induced electrical polarization6, 12, 27. Beginning with the universal form of the associated quadratic nonlinearities:
| (11) |
| (12) |
Where is the change in the optical index matrix, and is the strain. For reference, if the change in index is small:
| (13) |
Specifically for perovskites, the polarization describes the motion of the ion, and the bond lengths directly change the bandgap of the crystal, modulating . For linear dielectrics where and there is no built-in polarization, equations 11 and 12 become, in Voigt notation:
| (14) |
| (15) |
Here, we can see the well-known quadratic electro optic (Kerr) and quadratic piezo-electric (electrostrictive) effects with applied field. In this case, these third-order nonlinearities are proportional to . Valid for both the paraelectric and ferroelectric state, the response of either an electrically biased system or a system with a spontaneous or remnant polarization can be framed as a biasing polarization () and a small signal polarization (), such that . Therefore, . With the signal small, and ignoring terms independent of the signal, . Therefore, if , . This is the case in our experiment. We assume the linearity of small signals such that . From the definition of Pockels coefficient as and the (inverse) piezo-electric coefficient as , then:
| (16) |
| (17) |
These relations should hold for materials where ionic displacement mediates the nonlinearity (Fig. S\fpeval5-4). On the other hand, purely electronic components of both nonlinearities exist (usually in non-ferroelectrics), but are in general weaker and not described here 13.
Example LGD simulations are shown for a model ferroelectric in Fig. S\fpeval6-4, showing that large changes in polarization are possible as a function of applied bias, mediating the nonlinearity in STO, for example. This is explored further in Fig. S\fpeval6-4b, which shows the predicted nonlinearity () as a function of temperature and bias above . We see that the nonlinearity diverges as approaches , and is maximized at a particular bias field. Thus, such electrically biased paraelectric materials near the phase transition remain a largely unexplored but promising32 route to tunable nonlinearity.
S3 Dielectric and polarization fitting
We show the temperature and voltage dependent line cuts of our fit for all three samples in Fig. S\fpeval7-4. The calculated experimental polarization is shown, which is about at moderate bias for all three samples. This is understood as the the isotope substitution not changing the relevant length scale by which the ion moves (polarization). The relevant features become sharper in electric field in STO-28 and STO-33. We note that our applied DC bias are more than two orders of magnitude below the dielectric breakdown of STO, which is roughly temperature independent at approximately 50 MV/m 1. Therefore, more extreme bias-induced behavior of STO can be probed in integrated devices.
STO-33 is in close proximity to the QCP from previous works, and indeed shows a slight dielectric peaking (Fig. S\fpeval7-4g) with temperature and hysteresis indicative of a small degree of ferroelectricity at K.
S4 Details of the Experimental Setup
Our Mach Zehnder interferometry (MZI) setup is schematically depicted in Fig. S\fpeval8-4. A 1550 nm laser () is split into two arms. In the first arm, the sample beam travels a distance through the STO, which is in a parallel plate capacitor configuration with top and bottom electrical contact pads applying an electric field perpendicular to the beam propagation direction and parallel (perpendicular) to the beam polarization for () measurements. Using a bias tee, we apply both a DC bias voltage (, where is the sample thickness) and an AC voltage with frequency : . Because of the refractive index modulation from the electro optic effect, the sample beam acquires a time-varying phase at frequency , and the transmitted field through the sample arm becomes:
| (18) |
The second arm of the MZI includes an acousto-optic modulator (AOM) driven at 200 MHz, which imparts a frequency shift of MHz on the propagating beam, resulting in a field:
| (19) |
The two arms of the interferometer are then recombined, and the total intensity signal is measured with a photodiode:
| (20) | |||
| (21) |
In particular, the interference term:
| (22) |
results in a detected signal with components at the beat frequency of 200 MHz and sidebands at MHz. The photodiode outputs a current onto a 50 load that is proportional to the intensity of the optical signal. We connect the photodiode output to the RF + DC port of a bias tee, which is 50 terminated on the DC port while the RF port is connected to an electronic spectrum analyzer (ESA, with 50 input impedance). The ESA records the powers and of the 200 MHz and at MHz signals. This directly provides information about the phase from the STO, as can be seen by taking the Jacobi-Anger expansion of the interference term in Eq. 22 above:
| (23) |
where is the Bessel function of the first kind. Here, we see that the term is responsible for the signal at the carrier (200 MHz) frequency, and the terms correspond to the signal at the first sidebands. Specifically, the intensities of the carrier () and () signals are proportional to and , respectively:
| (24) |
In our experiments the phase modulation is small so we can approximate the Bessel functions:
| (25) | |||
| (26) |
Rearranging Eq. 24 we obtain:
| (27) |
The spectrum analyzer connected to the photodiode measures the carrier and sideband powers in dbm ( and , respectively). Because the measured power scales as the square of the current outputted by the photodiode, the relationship between the measured power and output photodiode current (proportional to the interference intensity) is given by:
| (28) | |||
| (29) |
| (30) |
Extraction of the Pockels coefficient from the MZI experiment
As explained in the main text and above (Equations 11 and 13), the electro-optic effect is given by:
| (31) |
Where is defined in Eq. 16. In our experiments we focus primarily on the tensor elements, which we pick out experimentally by polarizing the optical signal in the same direction as the applied DC and AC electric fields. Rearranging Eq. 31, we obtain:
| (32) |
We note that the same treatment applies for the term, with the only difference being that the optical signal is polarized in an orthogonal direction in the MZI compared to the measurements.
In our MZI measurement, we measure optical phase through the STO, which is related to by:
| (33) |
Where is the distance the optical signal travels through the STO between the electrodes, and is the wavelength (1550 nm in our experiments). Thus:
| (34) |
Ignoring the minus sign, substituting for (since is the peak-to-peak voltage) and Eq. 30:
| (35) |
Extracted values of
The measured ratio between and is 3.33 (=170(20) pm/V), consistent with literature reports of a ratio between 2.8 and 4 at room temperature 11, 10.
For STO-33, the ratio between and also grows to about 4.5 (versus about 3 for natural STO). This may be related to the increased anisotropy and birefringence near the quantum phase transition.
Extraction of the piezo-electric coefficient from the MZI Experiment
We measure the piezo-electric coefficient with the MZI setup similar to the one used for Pockels coefficient, except that the sample beam is reflected off the top (reflective) surface of the STO, at an angle of 45∘. This enables a measurement of the change in thickness of the STO chip for a given applied (AC) voltage.
The piezo-electric coefficient is given by:
| (36) |
Where is the mechanical strain, defined as:
| (37) |
In our measurements, the electric field is applied to the STO in a parallel plate capacitor configuration (as in the Pockels coefficient measurements), so is the sample thickness, and is the change in thickness arising from the applied electric field. The change in sample thickness can be related to a change in optical phase by geometric arguments. Given the incidence angle of , the phase acquired by sample beam is:
| (38) |
| (39) |
As in the previous section, , since is defined as the peak-to-peak voltage. Combining Eq. 30 and Eq. 39, we obtain:
| (40) |
Finally, we note that because we take the ratio between the sideband and 200 MHz carrier signal, our measurements of both the Pockels coefficient and piezo-electric coefficient are independent of the responsivity of the detector, losses, power imbalance of the interferometer arms, and other sources of error.
S5 Frequency dependence
The voltage dropped on our sample, a capacitor, with a given applied in series with a resistance can be modeled as:
| (41) |
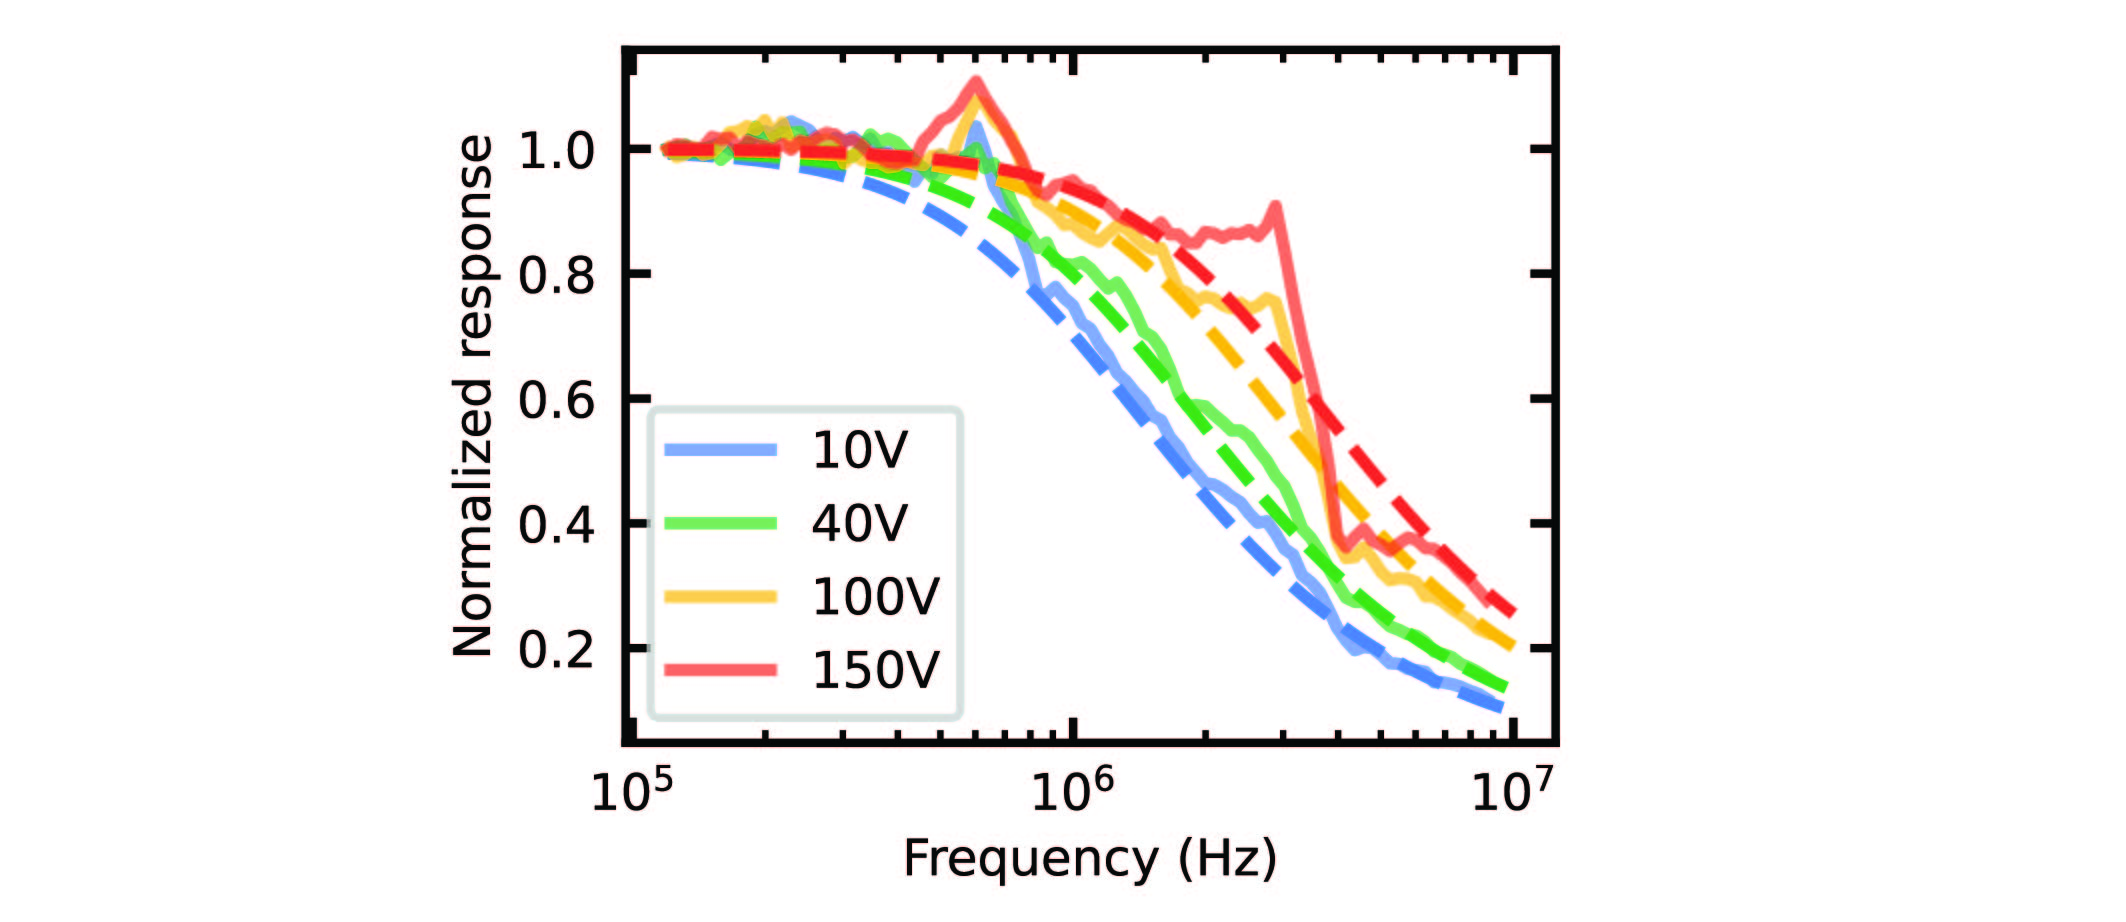
Where . We measure the frequency dependence of the Pockels modulation at multiple different bias voltages for natural STO. At the different voltages, we use the measured capacitance and assume to model the frequency dependence. Fig. S\fpeval10-4 shows a good agreement with our experimental data, where the 3 dB cutoff is pushed to higher frequencies at large bias fields. For our measurements, this is around 1-4 MHz. Therefore, the observed strength of modulation should not be limited significantly at 100 kHz and is entirely explained by electrical considerations, not a reduction in the Pockels effect at higher frequencies. The observed structure in our signal (Fig. S\fpeval10-4) is not noise, but instead high frequency electrical and mechanical resonances in our sample that are also avoided at low frequency. We also observed a weaker frequency dependence of the electro-optic coefficient in LN, consistent with its orders of magnitude lower dielectric constant and higher RC cutoff.
S6 Theoretical predictions of the electro-optic bandwidth
The frequency dependence of the dielectric response (Fig. S\fpeval7-4) sets the frequency dependence of the electro-optic response, as shown by Miller’s rules and the results in this manuscript.
The relevant frequency scale where the enhanced dielectric properties of STO, and other “soft” mode ferroelectrics is set by the relevant phonon frequency26. There, the Lyddane-Sachs-Teller (LST) relation holds (including for STO), which states:
| (42) |
where is the frequency of a long-wavelength transverse optic phonon and the frequency of the corresponding long-wavelength longitudinal optical phonon which mediates electrical polarization. and are the permittivities at frequencies below and above 26.
The result of this relation is that the maximum frequency at which the electro-optic response is large (or the bandwidth “BW”) is and that . If, as we predict from Miller’s rules and observe (Fig. 4b) that , then:
| (43) |
The phonon frequencies are well known at low temperature for STO, at about 1.4 THz in the (zero bias) quantum paraelectric state 15, 18. In fact, the reduction in dielectric constant with field exactly corresponds to a hardening of the phonons in this previous work.
We use this previous literature and insight to predict an intrinsic trade-off between the nonlinearity and operating bandwidth, shown in Fig. S\fpeval11-4 For all our samples, the theoretical BW limit is above 1 THz, using the observed “hardened” dielectric value that shows maximum nonlinearity. Therefore, STO and quantum critical STO may find wide use in high frequency applications up to many hundred GHz. These trends should also hold for piezo-electricity. These calculations make no evaluation of RF losses, just fundamental material response time.
S7 Change in index of refraction with field
Due to the nonlinear change of the electrical polarization with field, the electro-optic response transitions from quadratic to linear as a function of field. We plot the total change in index as a function of field for our three samples in Fig. S\fpeval9-4. The samples tuned to criticality have a higher slope, but display less quadratic electro-optic behavior and increased linearity. STO is not a purely quadratic electro-optic material.
S8 Optical loss
The optical loss of SrTiO3 is measured through the transmission of light through the bulk crystal with a power meter. The sample is moved within the cryostat with a cryogenic nanopositioner to either have the light pass through it, or bypass to the side. Therefore, a precise measurement of the loss purely due to the sample is obtained. The observed loss arises from the Fresnel reflections at the two polished interfaces, scattering due to roughness or metal, and intrinsic loss through the 5 mm crystal. Using the known index of refraction of STO, we correct for Fresnel reflections, resulting in an estimate of intrinsic loss at room temperature between 0-0.2 dB/cm. This is limited primarily by the power stability of the laser and should be considered an upper limit.
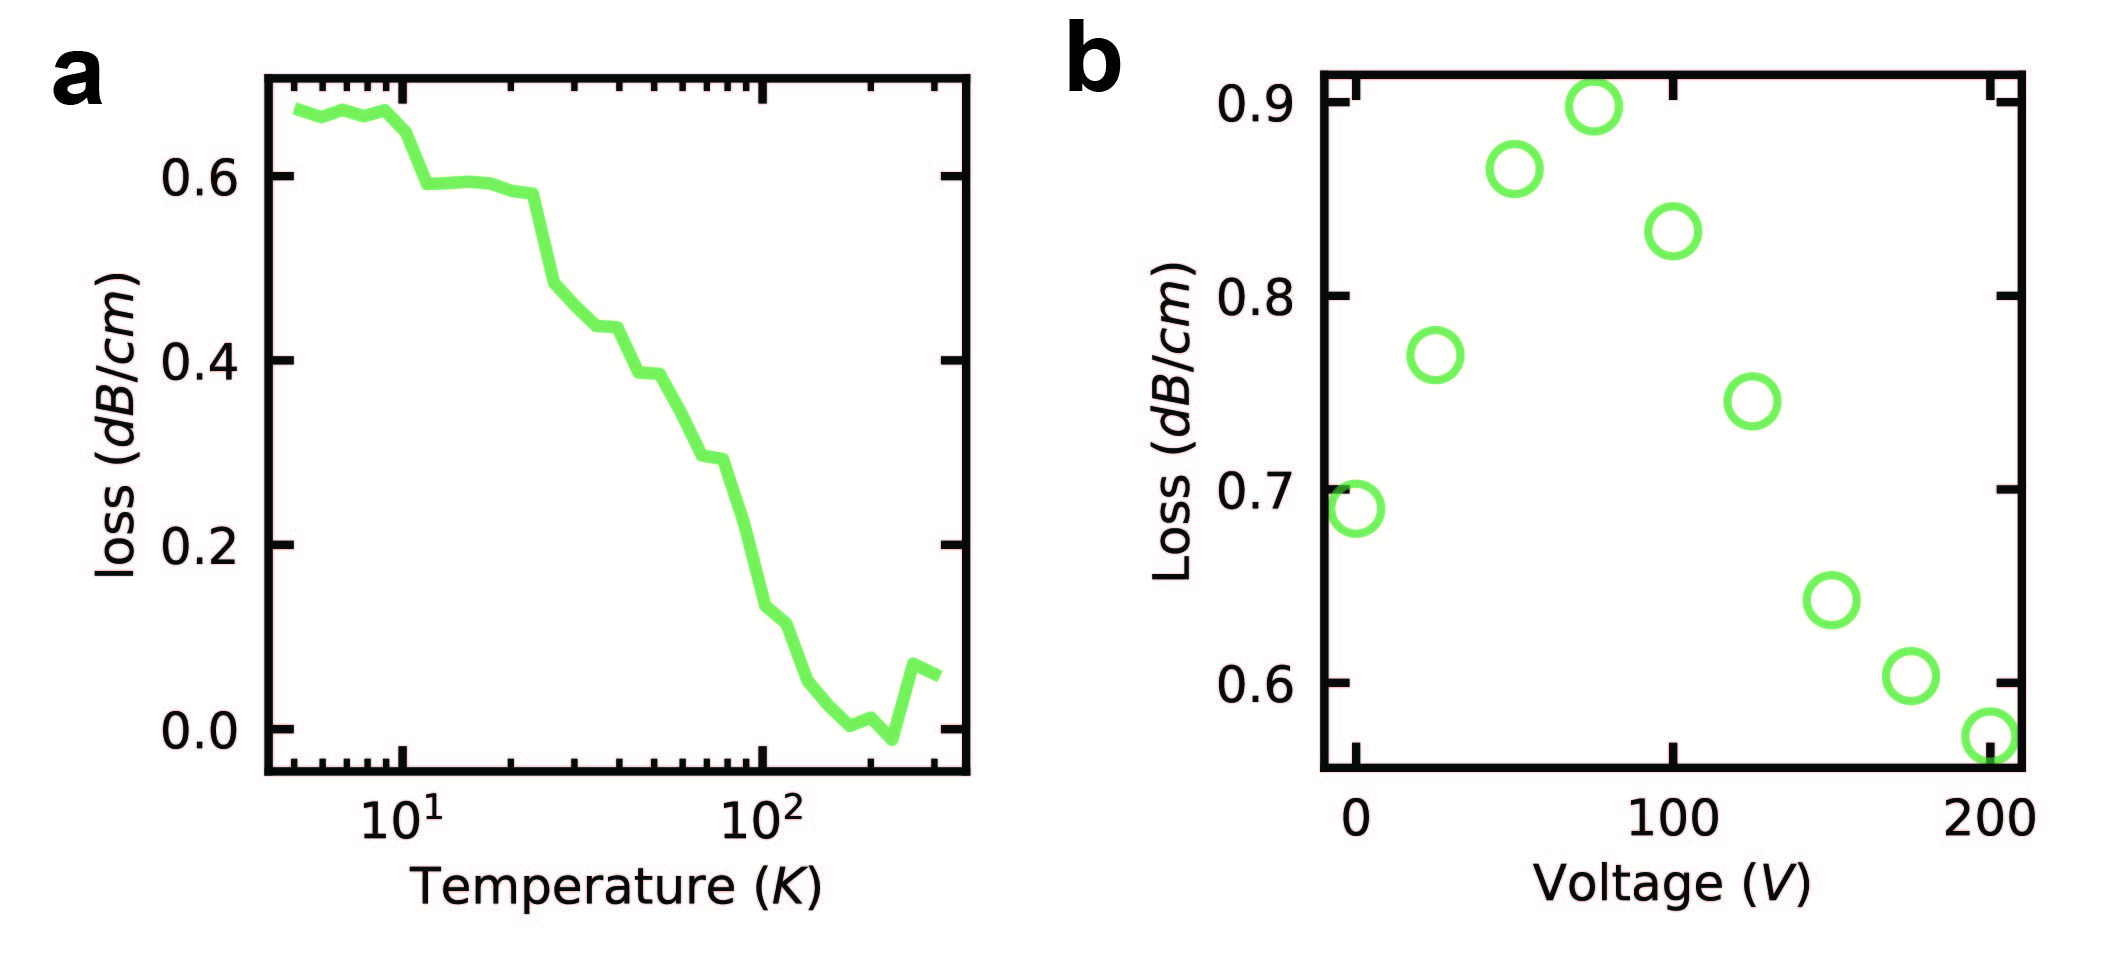
We plot the temperature dependence of the optical loss in Fig. S\fpeval12-4a. As STO cools, the loss increases but saturates at about 0.7 dB/cm, mirroring the quantum paraelectric dependence of the dielectric constant. This is sufficient for most integrated photonics applications.
The loss also depends on the applied bias, shown in Fig. S\fpeval12-4b. At zero bias, the loss is about 0.7 dB/cm, which then peaks to around 0.9 dB/cm at around 75 V (also where the nonlinearity is maximized), but then rapidly decays to lower than 0.55 dB/cm at 200 V bias . We hypothesize that this behavior is due to the formation of so-called polar nano-regions (PNRs)40, that have random orientations that scatter light due to differences in the index of refraction. As the bias grows, however, the applied field strongly aligns the crystal, reducing inhomogeneity. There is therefore an interesting trade space between nonlinearity, loss, and bias, that required further investigation, especially in integrated optical devices with larger bias fields.
S9 High resolution scans of the Pockels nonlinearity of STO-33
As there are some sweep speed dependent and hysteric effects in STO-33 we also report a slow, high resolution scan without biasing to large positive voltages. The data is shown in Fig. S\fpeval13-4 and is well reproduced by our model. The extracted values from this sweep are reported in the main text. The line-by-line fits are shown in Fig. S\fpeval14-4.
S10 Electromechanical coupling
We note that while the piezo-electric effect has a distinct maximum, surprisingly, the electromechanical factor monotonically rises for all observed data. This arises from the relation . Here, because , the desire for large dielectric constants still hold in general. However, while declines with applied bias, the dielectric constant reduces significantly faster, resulting in a higher . With integrated devices with higher fields or strain, higher should be possible at cryogenic temperatures- unlocking efficient transducers. Even with the limited fields currently, in natural STO, comparable or even exceeding bulk LN.
S11 Beam steering
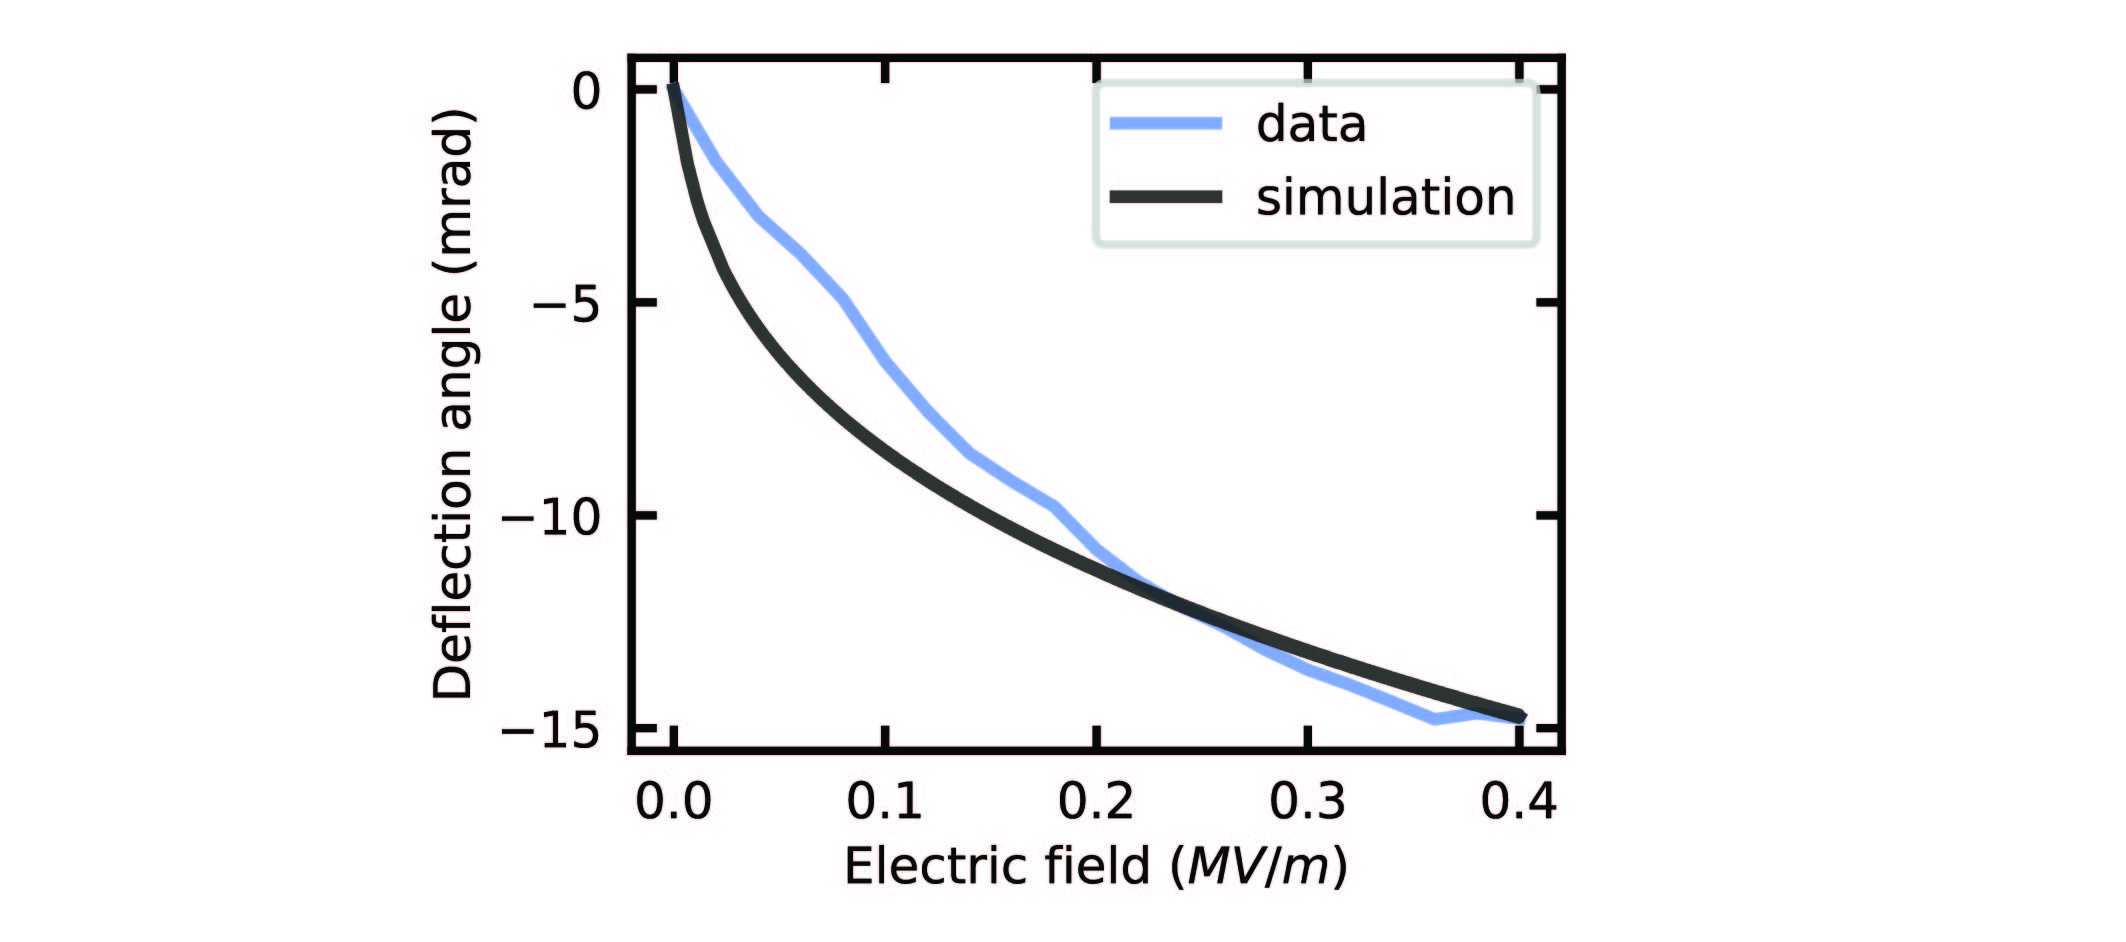
We make another isotopically exchanged STO sample, with an estimated 18O fraction of 24.5%. This sample displayed significant beam steering, which we observed with a camera placed after the optical beam passed through the STO chip and the second lens, in Fig. S\fpeval8-4a. We hypothesize that the origin of the beam steering is oxygen vacancies in the crystal, which trap charges that screen the electric fields applied. While nominally undesirable, trapped charge in KTN EO materials have been shown to make strong field gradients that mediate efficient beam steering. Following the treatment for KTN25, and our measured dielectric response (and therefore electro-optical effect), we can model the observed beam steering with only one free parameter (the charge trap density). Our predicted curve very closely matches the data, shown in Fig. S\fpeval16-4. Critically, we are able to reproduce the nonlinear nature of the effect due to the bias dependent optical nonlinearity, which is ignored in previous other treatments25.
For comparison, STO is also available in much larger and cheaper crystals compared to KTN for beam steering and other applications. KTN devices would also not work well at cryogenic temperatures due to their near room-temperature phase transition. KTN beam steering has found use in medical devices, Q-switches, ranging systems, and applications that require fast scan speeds using non-mechanical elements 5, 37.
S12 Trends in the and tensor elements
While nominally temperature independent, we show the temperature dependent fit of and for all three samples in Fig. S\fpeval14-4. The dip of the natural STO and resulting piezo-electric response at 10-20 K followed by a recovery is potentially due to a temperature-dependent mechanical resonance. We observed in other samples a slight increase in this same temperature range, instead of a dip. The main results of our work are independent of this anomaly. For STO-33, we note distinct increases in and from our fit below 15 K (Fig. S\fpeval14-4). The nature of this increase is potentially related to quantum criticality and requires further investigation.
While the observed tensor has good agreement to previous reports10, the tensor element is lower by almost exactly a factor of two compared to previous results at room temperature20. Changes in the elastic susceptibility at low temperatures (not measured here) may drive some of this difference31, 19. Despite the strong piezo-electricity, the observed is still significantly smaller than predicted with ab-initio theory 17
The trends of the and tensor values between samples are shown in Fig. S\fpeval17-4. The relative increase in STO-28 is the same for both electro-optic and piezo-electric nonlinearity, but near quantum criticality, changes much more dramatically. The observed , also both increase with increases in the dielectric constant at the maximum value of . We note that this is drastically different from traditional ferroelectrics, where remains nearly constant across all materials, and varies inversely with dielectric constant 36. In fact, near quantum criticality, we observe an electro-optic nearly three times larger than any other perovskite.
S13 Comparison with other nonlinear materials
In Fig. 4 of the main text, a comparison between nonlinear materials is displayed. There are variances in experimental reports and it is difficult overall to match dielectric and nonlinear measurements to the same source. In general, we use: ‘Oxides’ of Volume 36 ‘Ferroelectrics and Related Substances’ of Landolt-Börnstein - Group III Condensed Matter.”29, otherwise more references follow:
S14 Trends and comparisons in nonlinear materials
Nonlinearities as a function of dielectric constant
We also evaluate the scaling of piezo-electric and electro-optic nonlinearities with just the dielectric constant, shown in Figures S\fpeval18-4, S\fpeval19-4. This includes non ferroelectric materials like AlN, GaN, GaAs, KDP, KTP, BBO, ZnO, etc (where there is no polarization in the same sense as in ferroelectrics). We see that the dielectric constant is still a good metric for materials discovery and guidance. However, the trend is not purely linear in the electro-optic case, Fig. S\fpeval18-4. For the piezo-electric case, the trend is more complicated (Fig. S\fpeval19-4a), most likely due to non “ionic” contributions to the piezo-electric tensor. On the other hand Fig. S\fpeval19-4b shows the trend for a class of similar lead-zirconate-titanate compounds, showing good linearity. Therefore, dielectric constant is still a fair metric to identify nonlinear materials.
Comparison at cryogenic temperatures of
In Fig. S\fpeval20-4 we plot the reported Pockels figure of merit, , for materials with reported values at 10 K or lower. LTT is lithium thallium tartrate monohydrate, a known low ferroelectric 41. OEO stands for organic-electro-optic polymer.
Fig. 4b in the main text similarly shows a comparison of the piezo-electric coefficients at 10 K and lower. Values of various lead-zirconate-titanate compositions are similar at these low temperatures 34. As LN is far away from at both 297 K and below 10 K, its nonlinearities do not change significantly when cooled.
S15 Outlook for quantum and classical systems
For quantum systems utilizing electro-optics or piezo-electricity, the relevant parameter is the coupling coefficient (not the same as ). but also the impedance (or equivalently, the size/capacitance) of the device . Because are proportional to , then we can estimate . Another metric is the cooperativity () between optical(mechanical) and electrical subsystems, . Unfortunately, as the dielectric constant grows, so does the electrical loss. If we assume the imaginary dielectric response (loss) scales similarly to the dielectric constant, we can estimate that does not scale with dielectric constant of the material. Therefore, we propose that materials engineering primarily improves , but not . However, for certain applications, large is desirable specifically. For electro-optic quantum transduction, the important consideration is to reduce pump induced heating, where the relevant figure-of-merit scales with , and does not depend on the dielectric loss 16. With STO, similar transduction efficiencies can be achieved with at least 400 times less power compared to LN.
Cryogenic electro-optic devices also offers an attractive alternative solution to the “wiring problem” in superconducting systems, as optical fiber would allow for millions of signals to reach millikelvin environments with minimal heating30, 21. Finally, For photonic switches, STO would allow at least a 5x reduction in modulator size at 5 K due to increased . This is critical as loss is nonlinear with device length.
On the other hand, it is desirable to also minimize the electrical power consumption per bit of a potential cryogenic optical modulator. The required voltage scales with 1/, where L is the length of the modulator. On the other hand, the capacitance scales with L and , so . Therefore, one can estimate that materials have , if for a given device size. Higher dielectric constant materials closer to phase transitions therefore show improvement in classical modulator application. Other example applications of cryogenic systems can be found in the supplemental information of related work on BTO modulators7.
S16 Summary of 18O isotope exchange and annealing
As explained in the Methods section, we perform nanoscale-secondary-ion-mass-spectroscopy (nanoSIMS) to determine the relative ratio of 16O to 18O. We also compare this with the expected 18O ratio calculated by measuring the mass of the STO before the 18O rich annealing steps and after. Below, we summarize these results:
|
STO
(Natural) |
STO-28 | STO-33 |
Beam
Steering |
|
|---|---|---|---|---|
| nanoSIMS |
|
- | ||
| Weight-based | N/A |
|
||
| 18O anneal | 0 |
27.8
|
48.8 | 27.8 |
| Vacuum anneal | 0 | 27.8 | 41.8 | 27.8 |
We report on the nanoSIMS values in the main text, as they do not depend on other sources of mass change which confound a purely mass based measurement.
References
- Dielectric breakdown of single‐crystal strontium titanate. 35 (5), pp. 1420–1425. External Links: ISSN 0021-8979, Document, Link, https://pubs.aip.org/aip/jap/article-pdf/35/5/1420/18331717/1420_1_online.pdf Cited by: §S3.
- Nonlinear optics, fourth edition. External Links: ISBN 9780323850575 Cited by: §S1, §S1, §S13.
- Nonlinear optical phenomena and materials. Annual Review of Materials Science 4 (1), pp. 147–190. Cited by: §S1, §S1.
- Cryogenic operation of silicon photonic modulators based on the DC Kerr effect. Optica 7 (10), pp. 1385–1390. External Links: Link, Document Cited by: §S2.
- High speed non-mechanical two-dimensional ktn beam deflector enabled by space charge and temperature gradient deflection. Opt. Express 25 (13), pp. 15481–15492. External Links: Link, Document Cited by: §S11.
- Oxygen‐Octahedra Ferroelectrics. I. Theory of Electro‐optical and Nonlinear optical Effects. Journal of Applied Physics 40 (2), pp. 720–734. External Links: ISSN 0021-8979, Document, Link, https://pubs.aip.org/aip/jap/article-pdf/40/2/720/18348439/720_1_online.pdf Cited by: §S1, §S2.
- An integrated optical modulator operating at cryogenic temperatures. Nature Materials 19 (11), pp. 1164–1168. External Links: ISSN 1476-4660, Link, Document Cited by: §S15.
- Reversible and tunable second-order nonlinear optical susceptibility in pzt thin films for integrated optics. 9 (16), pp. 2100149. External Links: Document, Link, https://onlinelibrary.wiley.com/doi/pdf/10.1002/adom.202100149 Cited by: §S13.
- Electro‐optical properties of a single domain pbtio3 crystal. 77 (5), pp. 2102–2106. External Links: ISSN 0021-8979, Document, Link, https://pubs.aip.org/aip/jap/article-pdf/77/5/2102/18674299/2102_1_online.pdf Cited by: §S13.
- Interferometric Determination of the Quadratic Electro‐Optic Coefficients in SrTiO3 Crystal. Journal of Applied Physics 41 (10), pp. 4118–4120. External Links: ISSN 0021-8979, Document, Link, https://pubs.aip.org/aip/jap/article-pdf/41/10/4118/7944523/4118_1_online.pdf Cited by: §S12, §S4.
- ELECTRO‐optic properties of some ABO3 perovskites in the paraelectric phase. Applied Physics Letters 4 (8), pp. 141–143. External Links: ISSN 0003-6951, Document, Link, https://pubs.aip.org/aip/apl/article-pdf/4/8/141/18417059/141_1_online.pdf Cited by: §S4.
- Electro-optical properties of knbo3. 11 (3), pp. 285–290. External Links: ISSN 0030-4018, Document, Link Cited by: §S13, §S2.
- Design rules for strong electro-optic materials. 6 (1). External Links: ISSN 2057-3960, Link, Document Cited by: §S13, §S2.
- Thermodynamic theory of pbtio3. 62 (8), pp. 3331–3338. External Links: ISSN 0021-8979, Document, Link, https://pubs.aip.org/aip/jap/article-pdf/62/8/3331/18612856/3331_1_online.pdf Cited by: §S13.
- Phonon dispersion of quantum paraelectric in electric fields. 110, pp. 054302. External Links: Document, Link Cited by: §S6.
- Efficient bidirectional piezo-optomechanical transduction between microwave and optical frequency. Nature Communications 11 (1). External Links: ISSN 2041-1723, Link, Document Cited by: §S15.
- Electrostriction coefficient of ferroelectric materials from ab initio computation. 6 (6), pp. 065122. External Links: ISSN 2158-3226, Document, Link, https://pubs.aip.org/aip/adv/article-pdf/doi/10.1063/1.4954886/12914826/065122_1_online.pdf Cited by: §S12.
- Ferroelectric soft mode in a thin film impulsively driven to the anharmonic regime using intense picosecond terahertz pulses. 108, pp. 097401. External Links: Document, Link Cited by: §S6.
- Low-frequency superelasticity and nonlinear elastic behavior of SrTiO3 crystals. 61, pp. 946–956. External Links: Document, Link Cited by: §S12.
- Positive effective Q12 electrostrictive coefficient in perovskites. 112 (9), pp. 094106. External Links: ISSN 0021-8979, Document, Link, https://pubs.aip.org/aip/jap/article-pdf/doi/10.1063/1.4764046/15098788/094106_1_online.pdf Cited by: §S12.
- Control and readout of a superconducting qubit using a photonic link. Nature 591 (7851), pp. 575–579. Cited by: §S15.
- Ferroelectric crystals with giant electro-optic property enabling ultracompact q-switches. Science 376 (6591), pp. 371–377. External Links: ISSN 1095-9203, Link, Document Cited by: §S13.
- 4.05 - piezoelectric and ferroelectric materials: fundamentals, recent progress, and applications. In Comprehensive Inorganic Chemistry III (Third Edition), J. Reedijk and K. R. Poeppelmeier (Eds.), pp. 135–171. External Links: ISBN 978-0-12-823153-1, Document, Link Cited by: §S13.
- Refractive indices, permittivities, and linear electrooptic coefficients of tetragonal potassium tantalate-niobate crystals. 137 (1), pp. 257–265. External Links: Document, Link, https://onlinelibrary.wiley.com/doi/pdf/10.1002/pssa.2211370123 Cited by: §S13.
- New beam scanning model for high-speed operation using KTa1-xNbxO3 crystals. 4 (11), pp. 111501. External Links: Document, Link Cited by: §S11.
- Permittivity of Strontium Titanate. 43 (5), pp. 2124–2131. External Links: ISSN 0021-8979, Document, Link, https://pubs.aip.org/aip/jap/article-pdf/43/5/2124/18360952/2124_1_online.pdf Cited by: §S6, §S6.
- Electrostriction: nonlinear electromechanical coupling in solid dielectrics. 101 (48), pp. 10141–10150. External Links: Document, Link, https://doi.org/10.1021/jp971522c Cited by: §S2.
- Engineering electro-optics in SiGe/Si waveguides for quantum transduction. Quantum Science and Technology 5 (3), pp. 034006. External Links: Document, Link Cited by: §S2.
- [29] (2002) Oxides. External Links: ISBN 3540632743, Link, Document Cited by: §S13.
- An integrated magneto-optic modulator for cryogenic applications. Nature Electronics 5 (9), pp. 604–610. External Links: ISSN 2520-1131, Link, Document Cited by: §S15.
- Low temperature elastic moduli of strontium titanate. 8 (18), pp. 1483–1485. External Links: ISSN 0038-1098, Document, Link Cited by: §S12.
- Nonlinear strain and dc bias induced piezoelectric behaviour of electrostrictive lead magnesium niobate-lead titanate ceramics under high electric fields. 35 (13), pp. 1550–1554. External Links: ISSN 0022-3727, Link, Document Cited by: §S2.
- Temperature dependence of the elastic, piezoelectric, and dielectric constants of lithium tantalate and lithium niobate. 42 (6), pp. 2219–2230. External Links: ISSN 0021-8979, Document, Link, https://pubs.aip.org/aip/jap/article-pdf/42/6/2219/18357830/2219_1_online.pdf Cited by: §S13.
- Electromechanical properties of PMN-PT and PZT ceramics at cryogenic temperatures. In 2010 IEEE International Symposium on the Applications of Ferroelectrics (ISAF), Vol. , pp. 1–4. External Links: Document Cited by: §S14.
- Origin of giant piezoelectric effect in lead-free K1-xNaxTa1-yNbyO3 single crystals. 6 (1). External Links: ISSN 2045-2322, Link, Document Cited by: §S13.
- Electrostrictive and piezoelectric effects in relaxor ferroelectrics: historical background. 69 (11), pp. 3013–3036. External Links: Document Cited by: §S12.
- Potassium tantalate niobate crystals: efficient quadratic electro-optic materials and their laser modulation technology. 9 (5), pp. 838–854. External Links: ISSN 2352-8478, Document, Link Cited by: §S11.
- Piezoelectric and elastic properties of lithium niobate single crystals. 6 (2), pp. 151. External Links: ISSN 1347-4065, Link, Document Cited by: §S13.
- Dielectric, elastic, piezoelectric, electro-optic, and elasto-optic tensors of crystals. 50, pp. 5941–5949. External Links: Document, Link Cited by: §S13.
- Intrinsic-strain-induced ferroelectric order and ultrafine nanodomains in SrTiO3. 121 (25), pp. e2400568121. External Links: Document, Link, https://www.pnas.org/doi/pdf/10.1073/pnas.2400568121 Cited by: §S8.
- Optical and electro-optical properties of lithium thallium tartrate monohydrate. 1 (36), pp. 6441. Cited by: §S14.