Nonadiabatic laser-induced alignment dynamics of alkali dimers on the surface of a helium droplet
Abstract
Alkali dimers, \ceAk2, located on the surface of a helium nanodroplet, are set into rotation through the polarizability interaction with a nonresonant 1-ps-long laser pulse. The time-dependent degree of alignment is recorded using femtosecond-probe-pulse-induced Coulomb explosion into a pair of \ceAk+ fragment ions. The results, obtained for \ceNa2, \ceK2, and \ceRb2 in both the ground state and the lowest-lying triplet state , exhibit distinct, periodic revivals with a gradually decreasing amplitude. The dynamics differ from that expected for dimers had they behaved as free rotors. Numerically, we solve the time-dependent rotational Schrödinger equation, including an effective mean-field potential to describe the interaction between the dimer and the droplet. The experimental and simulated alignment dynamics agree well and their comparison enables us to determine the effective rotational constants of the alkali dimers with the exception of \ceRb2() that only exhibits a prompt alignment peak but no subsequent revivals. For \ceNa2(), \ceK2(), \ceK2() and \ceRb2(), the alignment dynamics are well-described by a 2D rotor model. We ascribe this to a significant confinement of the internuclear axis of these dimers, induced by the orientation-dependent droplet–dimer interaction, to the tangential plane of their residence point on the droplet.
I Introduction
Laser-induced alignment, the confinement of molecular axes to fixed-in-space axes through the use of moderately intense laser pulses, has been intensively explored for almost 30 years Stapelfeldt and Seideman (2003); Seideman and Hamilton (2005); Ohshima and Hasegawa (2010); Fleischer et al. (2012); Koch et al. (2019). A particular emphasis has been on alignment in the nonadiabatic regime where a femtosecond or picosecond laser pulse creates a rotational wave packet in each molecule. This leads to alignment dynamics characterized by periodically spaced, narrow time intervals, termed revivals, in which the degree of alignment reaches local maxima and minima. The majority of the many works reported explored isolated gas-phase molecules but interest also turned towards molecules in dissipative environments Ramakrishna and Seideman (2005). One direction of studies investigated molecules in dense gasses Vieillard et al. (2008); Owschimikow et al. (2010) allowing, e.g., non-Markovian collisional dynamics and related phenomena to be studied Zhang et al. (2019); Ma et al. (2019); Bournazel et al. (2023).
Over the last decade, it has been demonstrated that laser-induced alignment methods can also be applied to molecules embedded in liquid helium, mainly in the shape of nanodroplets Pentlehner et al. (2013a); Schmidt and Lemeshko (2015); Pickering et al. (2018); Vindel-Zandbergen et al. (2018); Chatterley et al. (2019); Cherepanov et al. (2021); Qiang et al. (2022); Liu et al. (2023) and very recently also in bulk samples Milner et al. (2024). In the nonadiabatic regime, studies showed that for low laser intensities, the observed alignment dynamics closely resembled that determined from solution of the rotational time-dependent Schrödinger equation for isolated molecules using the in-helium effective rotational constants and accounting for inhomogeneous broadening Chatterley et al. (2020a). The explanation was that the rotational energy of the molecules obtained from the laser interaction remained low enough that coupling to rotons and phonons of the He droplet is very weak. As such, the He-dressed molecules, i.e., the molecules along with their solvation shell of helium atoms, could rotate almost freely. At higher intensities, the alignment dynamics differs significantly from the gas-phase case leading to, e.g., transient decoupling of the molecules from its solvation shell Shepperson et al. (2017).
Most molecules are located in the interior of helium nanodroplets but a few species, notably dimers of alkali atoms, are known to reside on the surface Ancilotto et al. (1995); Stienkemeier and Vilesov (2001); Barranco et al. (2006). This offers an opportunity for exploring laser-induced alignment of molecules in a novel regime namely on a surface. In 2023, we reported nonadiabatic alignment dynamics of \ceNa dimers in the state on the surface of helium nanodroplets Kranabetter et al. (2023). The time-dependent degree of alignment exhibited a revival pattern that differed qualitatively from that expected for freely rotating molecules. The difference was shown to originate from the surface potential of the droplet, which confines the orientation of the dimers to the tangential plane of the surface at the point where the dimer is bound. The confinement is sufficiently strong that the observed alignment dynamics is well-described by that of a 2D quantum rotor. Furthermore, by comparing the observed alignment dynamics to results from quantum simulations, it became possible, for the first time, to determine the effective rotational constant, . Its value is 1.3 times smaller than the value of the gas-phase rotational constant. This reduction factor is less than in the case of diatomic and linear triatomic molecules inside He droplets Choi et al. (2006). The difference was ascribed to the fact that \ceNa2 interacts more weakly with the He droplet compared to molecules localized in the droplet interior. Here, we present a more comprehensive account of laser-induced alignment dynamics of alkali dimers on helium droplet surfaces. This is done through studies of \ceNa2, \ceK2, and \ceRb2 in both the and the state. These systems represent different polarizabilities, different rotational constants and different droplet-dimer interactions, parameters that all are expected to influence the alignment dynamics.
II Experimental setup
The apparatus used for the experiments has been described previously Kristensen et al. (2023). Thus, we only provide the essential details here. A beam of He droplets (estimated mean size of 15000 He atoms) from a continuous source is passed through a pickup cell containing a gas of either \ceNa, \ceK, or \ceRb. By regulating the temperature of the pickup cell, the vapor pressure is adjusted to a value where some of the droplets pick up two \ceAk atoms, leading to the formation of an alkali dimer in the state or the state Stienkemeier et al. (1995); Higgins et al. (1998); Auböck et al. (2007). The now doped droplet beam continues forward into a velocity map imaging (VMI) spectrometer, inside of which it is crossed by two focused, linearly polarized laser beams. The pulses in the first beam are used to induce alignment of the alkali dimers. They have a duration, , in the range 0.6–1.0 ps (FWHM), the exact values are given on Figure 2, and a central wavelength of 1300 nm. At this wavelength, the photon energy falls below the energy needed to cause single-photon electronic transitions from either the or the state Magnier et al. (1993, 2004); Allouche and Aubert-Frécon (2012), i.e., linear absorption is eliminated. The pulses are focused to a spot size of = 85 and the peak intensities of the pulses, , given on Figure 2, are chosen sufficiently high to induce significant alignment of the dimers yet sufficiently low that multiphoton ionization is avoided. The pulses in the second beam ( = 800 nm [400 nm for \ceRb2 and for \ceK2 ()], = 50 fs), sent at a delay after the alignment pulses, are used to doubly ionize the dimers through multiphoton absorption, Fig. 1(c), which leads to Coulomb explosion into pairs of \ceAk+ ions Kristensen et al. (2022, 2023). As described below, detection of the emission direction of these ions enables the determination of the degree of alignment at time . In practice, the VMI spectrometer projects the \ceAk+ ions onto a 2D imaging detector backed by a CCD camera. For \ceNa2, \ceK2, and \ceRb2 the detector is gated such that only \ce^23Na^+, \ce^39K^+, and \ce^85Rb^+ ions, respectively, are recorded. The camera acquires frames containing the ion hits from 10 consecutive sets of alignment and probe laser pulses. For the probe pulses, intensities ranging from 51012 to 9.31013 W/cm2 are used with a focused spot size of = 40 .
III Experimental results
III.1 Ion images
Fig. 1(a) shows a 2D-velocity image of \ceK+ ions recorded using the probe pulse only. Meanwhile, Fig. 1(b) shows an image of \ceK+ ions obtained when using both the alignment and the probe pulse. The images lack signal in the center and in three radial stripes, due to a centrally positioned metal disk and its three mounting rods Schouder et al. (2020); Chatterley et al. (2020b). The main purpose of this disk is to block out \ceAk+ ions from ionization of effusive \ceAk atoms that entered the VMI spectrometer. Outside the center, a few distinct channels are visible in the images, marked by annotated white circles. To understand the origin of these channels it is useful to consult the potential energy diagram for \ceK2, displayed in Fig. 1(c).
The probe pulse doubly ionizes \ceK2, corresponding to projection of the initial wave function for the = 0 vibrational level 111This is the only vibrational level populated at the 0.4 K temperature of the droplet in either the state or the state onto the \ceK2^2+ potential curve. For the internuclear distances considered, this curve is to a good approximation given by a Coulomb potential Kristensen et al. (2023). Subsequently, the molecular dication breaks apart into two \ceK+ ions, the process termed Coulomb explosion. The final kinetic energy of each \ceK+ ion equals half of the initial Coulomb energy eV/ [Å], where is the equilibrium bond distance 222This holds for the \ce^39K2 isotopologue (87.0 % abundance). For the \ce^39K^41K isotopologue (12.6 % abundance), the \ce^39K+ ion gets 51.3 % of the Coulomb energy.. For the state = 3.92 Å and for the state = 5.73 Å Deiglmayr et al. (2008); Bauer and Toennies (2019). Consequently, \ceK+ ions originating from dimers in the () state end with = 1.84 eV (1.26 eV). This difference in the final allow us to identify the ions in the region between the solid and dashed rings (between the dashed and dot-dashed rings) in Fig. 1(a) and (b) as those from Coulomb exploded () state dimers. For \ceNa2 and \ceRb2, it is possible to make a similar distinction between the two quantum states in the 2D velocity images of the \ceAk+ ion, see Refs. Kristensen et al. (2022, 2023) for details. Therefore, through analysis of the ion hits in the two channels, we are able to characterize the alignment dynamics of the three different alkali dimers studied in both the and the state.
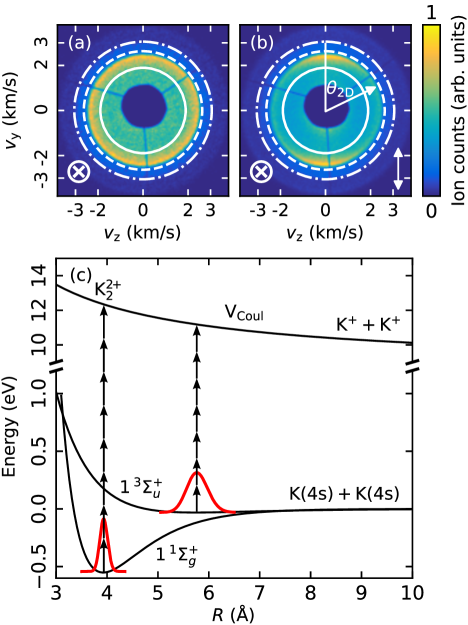
When only the probe pulse, polarized perpendicular to the detector plane, is present, the velocity image, Fig. 1(a), is circularly symmetric. This is the result expected for randomly oriented molecules. When the alignment pulse is applied prior to the probe pulse the circular symmetry is broken. For the image displayed in Fig. 1(b), where the probe pulse is sent at = 10 ps, the \ceK+ ions in both the and channel exhibit a clear anisotropy centered along the polarization axis (vertical) of the alignment pulse. In line with many previous works Pentlehner et al. (2013a, b), we interpret this observation as alignment of the dimers along the alignment pulse polarization direction.
III.2 Alignment dynamics
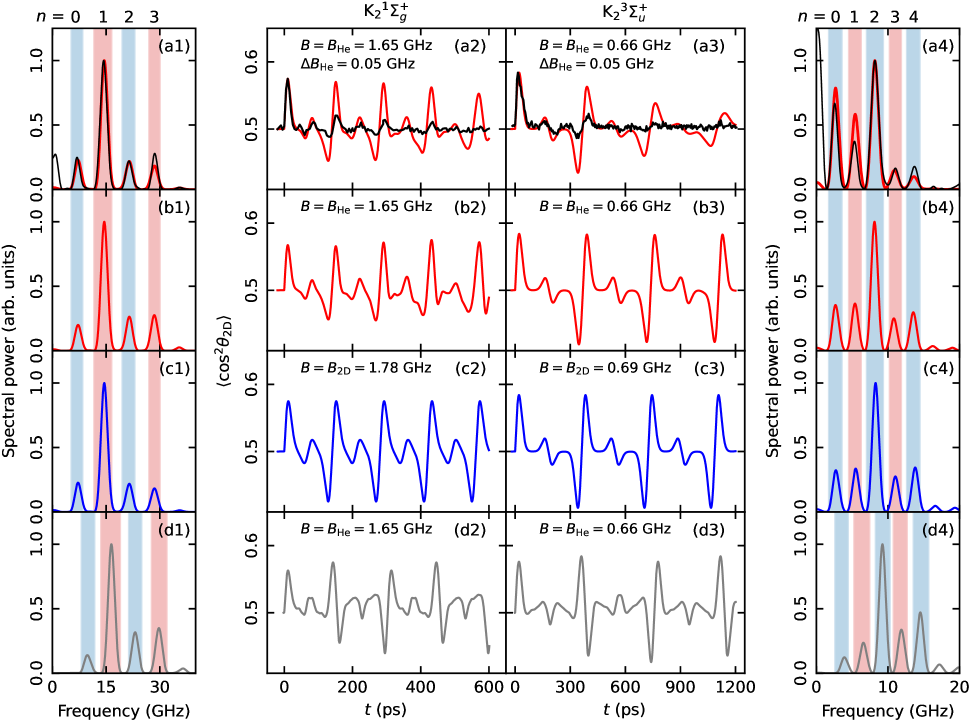
The alignment dynamics were measured for \ceNa2, \ceK2, and \ceRb2 in both the state and the state by recording ion images for various delays between the alignment and probe pulse. The delay was scanned from ps to ps for \ceNa2 and \ceK2 in the state, while a range from ps to ps was used for \ceRb2 in the state and for the measurements on the states of all the dimers. For all measurements the step size was kept between 1 ps and 5 ps. To quantify the degree of alignment, we determine the widely used metric for the ions in the and radial ranges individually for each image. Here, is the angle in the detector plane between the ion hit and the alignment pulse polarization direction, see Fig. 1(b). Figure 2(a2)–(c2) and (a3)–(c3) show for the state and state dimers, respectively.
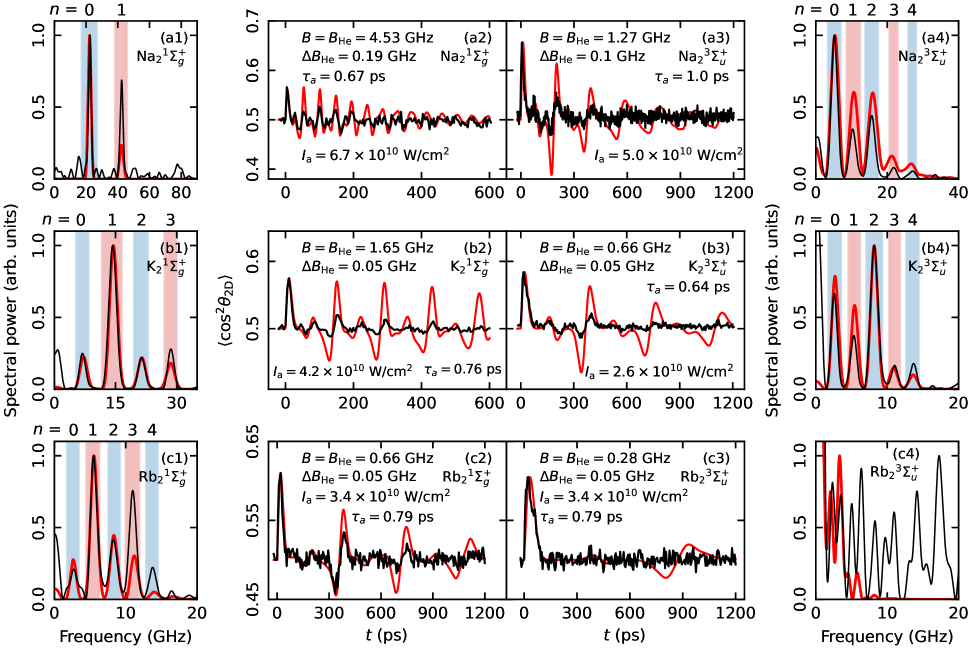
Figure 2(a3) shows the results for \ceNa2 in the state that were also presented in Ref. Kranabetter et al. (2023). Immediately after the alignment pulse is over, rises from 0.5, the value characterizing randomly oriented molecules, to the global maximum at = 6 ps, where = 0.66. At later times, exhibits an oscillatory structure with an amplitude that gradually diminishes. After 1000 ps, is back to a value of 0.5 and the oscillations are hardly visible any longer. The result for \ceK2( state), Figure 2(b3), is qualitatively similar to that for \ceNa2(). Again, reaches a global maximum at early times ( = 15 ps: = 0.58). The ensuing alignment dynamics is slower, notably the periodicity of the oscillations is larger, which appears reasonable since the moment of inertia of an isolated \ceK2( state) dimer is about twice as large as that of an isolated \ceNa2( state) dimer Ladjimi and Tomza (2024). In the case of \ceRb2(), Figure 2(c3), there is also an initial increase in to a maximum of 0.60 at = 25 ps. However, no oscillatory structure is observed at later times.
Turning to the state results, shown in Figure 2(a2)–(c2), we note that each of these traces also exhibit an initial alignment peak, followed by oscillations with recurring revivals that gradually decrease in amplitude. It is striking that several revivals are present for \ceRb2 in the state, in contrast to \ceRb2 in the state. A common trait for all six alignment traces measured is that they differ qualitatively from those observed for linear molecules in gas phase, see a few selected examples in Refs. Dooley et al. (2003); Ghafur et al. (2009); Wu et al. (2011); Chatterley et al. (2020b), and embedded inside helium droplets Chatterley et al. (2020a).
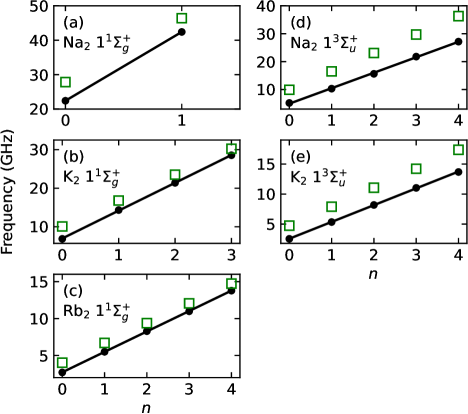
To analyse the results, we Fourier transform the alignment traces, thereby obtaining the spectral content. The black curves in Figure 2(a1)–(c1) and (a4)–(c4) show the spectra corresponding to the curves in Figure 2(a2)–(c2) and (a3)–(c3), respectively. Distinct peaks are observed in all the spectra, except for the case of \ceRb2(), see Figure 2(c4), where only noise is present. We label the peaks with integer values in order of increasing frequency, annotated above the panels in Figure 2(a1)–(c1) and (a4)–(b4). The central positions of the spectral peaks plotted as a function of the assigned (black dots in Fig. 3) fall very closely on a straight line. This linear relationship is corroborated by linear fits, shown with black lines in Fig. 3, to the data points. For rigid, linear, gas-phase molecules the peak positions are given by Chatterley et al. (2020a). Using the literature values for listed in Table 1, we calculate the peak positions for each dimer with . The results are shown with green squares in Fig. 3. For \ceNa2 and \ceK2 in the state, Fig. 3(d) and (e), the experimental peak positions deviate strongly from those expected for the isolated rotor. Similarly, there is a pronounced discrepancy between the gas-phase model and the observations for the state measurements of all three dimers, see Fig. 3(a)–(c). Thus, the spectral analysis supports that the observed alignment dynamics are not just that of linear molecules rotating in the gas phase.
IV Modeling the alignment dynamics
To model the alignment dynamics of the dimers, we solve the time-dependent rotational Schrödinger equation for the Hamiltonian:
| (1) |
Here, the first two terms are the same as those used when modelling laser-induced alignment of linear molecules in gas phase Friedrich and Herschbach (1995); Fleischer et al. (2012). is the rotational constant of the molecule, is the squared rotational angular momentum operator, and is the polarizability anisotropy of the molecule. The electric field envelope of the alignment pulse is denoted by and the angle between the internuclear axis and the polarization axis of the linearly polarized alignment pulse is denoted by . The third term, (), is an effective mean-field potential used to model the interaction between the alkali dimer and the He droplet with denoting the angle between the dimer internuclear axis and the droplet surface normal.
To obtain () we first calculated the \ceAk2-He potentials 333See Supplemental Material at [URL will be inserted by publisher] for the \ceAk2-He potentials at the CCSD(T) level with the valence and outermost core orbitals included in the correlation treatment and with basis set extrapolation Halkier et al. (1999) and using half of the counterpoise correction Burns et al. (2014); van Duijneveldt et al. (1994). For Na, the aug-cc-pVXZ (X = D,T,Q,5) basis sets were used Prascher et al. (2011). For K, the aug-cc-pVXZ-x2c (X = D,T,Q) Hill and Peterson (2017) were used with a recontraction using Hartree-Fock atomic coefficients, and for Rb, the Sapporo nZP (Z = D, T, Q) were used Noro et al. (2012).
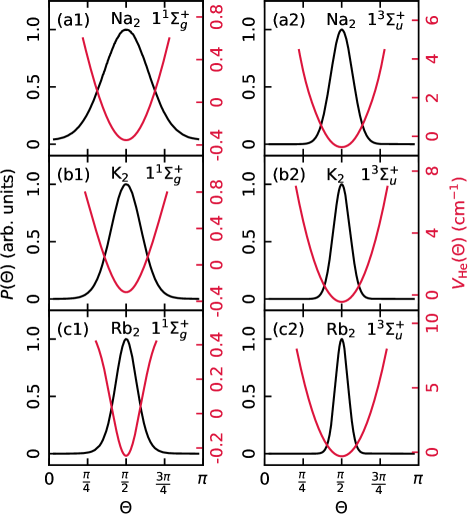
Next, the \ceAk2–\ceHe potentials were used to calculate () for the three different alkali dimers in both the state and the state. We follow the procedure described in detail in Ref. Guillon et al. (2011) and the supplement of Ref. Kranabetter et al. (2023): we approximate the curved surface of large \ceHe droplets with the flat surface of a \ceHe film on which an \ceAk2 molecule is adsorbed. From path integral Monte Carlo (PIMC) simulations we obtain the orientational distribution , i.e., the probability density that the dimer axis has an angle from the surface normal. The temperature is chosen low enough ( K, which is slightly lower than K assumed in experiments) that the \ceAk2 essentially occupies its ground state. On the other hand, we use the model Hamiltonian, Eq. 1, and equate its ground state with the PIMC result, . We can thus solve the effective Schrödinger equation for , and obtain , apart from a constant that is irrelevant for the dynamics. For \ceRb2 in the state, and () were taken from Ref. Guillon et al. (2011). Figure 4 shows () and for \ceNa2, \ceK2, and \ceRb2. For all three dimers in both the and the state, peaks at , i.e, the dimers are preferentially oriented parallel to the droplet surface. We note that for each dimer species, the distribution for the state is wider than for the state, and that for both the singlet and the triplet state, the angular distributions narrows as the mass of the dimer increases.
The Schrödinger equation with the Hamiltonian from Eq. 1, is solved using the effective potentials () and gas-phase values for taken from the literature Deiglmayr et al. (2008); Ladjimi and Tomza (2024). We use effective rotational constants instead of the gas-phase rotational constants and include inhomogeneous broadening of the rotational levels as done in Ref. Kranabetter et al. (2023) and in the modeling of alignment of molecules inside helium droplets Chatterley et al. (2020a). The inhomogeneous broadening accounts for the different local environments experienced by the dimers due to the variation of droplet sizes present in the experiment Lehmann (1999, 2007); Zillich et al. (2008). We implement the inhomogeneous broadening as a Gaussian distribution of with a FWHM of . In the numerical calculations, and are treated as free parameters and their values are varied to optimize the agreement between the calculated and measured . This is the same strategy as in rotational coherence spectroscopy (RCS), where the comparison of time-dependent alignment-sensitive experimental signals to results from numerical calculations are used to determine rotational constants Felker (1992); Riehn (2002).
We describe the initial rotational population by a Boltzmann distribution at the 0.37 K temperature expected for the alkali dimers on the helium droplets Auböck et al. (2007), and include weighting of the even and odd states according to nuclear spin statistics 444For \ceNa2 and \ce^39K2: : odd/even: 5/3; : odd/even: 3/5. For \ce^85Rb2: : odd/even: 7/5; : odd/even: 5/7.. For the experiments with \ceK2 and \ceRb2, the presence of multiple isotopologues were also taken into account. Due to the isotope abundances Berglund and Wieser (2011), 93.3% of the \ce^39K+ ions recorded originate from \ce^39K_2, while 6.7% come from \ce^39K^41K. Similarly, 72.2% of the \ce^85Rb^+ ions measured stem from \ce^85Rb_2 and 27.8% from \ce^85Rb^87Rb. The isotope abundances were included as weights in the calculation. In the \ceNa case there is only the \ce^23Na isotope. We did not include focal volume averaging because the focal spot size of the alignment beam is more than twice as big as that of the probe beam 555In Ref. Kranabetter et al. (2023), focal volume averaging was included in the calculation of nonadiabatic alignment dynamics of \ceNa2(). The results showed no significant difference compared to the results for a calculation without focal volume averaging.. Finally, we normalize the calculated traces such that the highest degree of alignment reached matches that observed in the experiment for the respective dimer. The purpose of this normalization is to ease visual comparison between experiment and theory. We note that the calculations are carried out assuming that the dimers reside at a position of the droplets where the local surface place is parallel to the detector plane, see the Appendix for details.
IV.1 Calculations for \ceK2
The red curve in Fig. 5(a2) shows for \ceK2 in the state obtained for the parameters, = 1.65 GHz and = 0.05 GHz, which led to the best agreement with the experimental in terms of matching the positions of the revival structures. We note that = 1.68 GHz Deiglmayr et al. (2008), so the in-helium rotational constant is only slightly reduced compared to the gas-phase value, / = 1.02. The gradual decay of the calculated results from the inhomogeneous broadening applied as seen when comparing the calculation in Fig. 5(a2) with the one in Fig. 5(b2), where inhomogeneous broadening was omitted. Experimentally, the amplitude of decreases significantly faster than for the calculated . Increasing in the calculation leads to a faster decay of the amplitude but it also shifts the minima and maxima of the revivals in ways that cannot be brought to match the experimental by adjusting the value of . Thus, changing does not give an overall better agreement with the experiment. This indicates that homogeneous broadening also contributes to the gradual decrease of the degree of alignment observed in the experiment (see discussion in Sec. V).
We also Fourier transformed the simulated to enable a comparison with the experimental spectrum. The results are depicted in Fig. 5(a1) with the height of the tallest peak in each spectrum normalized to unity. We find that the central positions of the peaks and their relative amplitudes are very similar for the calculated and the measured spectrum.
Figure 4(b1) shows that the () potential localizes the dimer axis to a region centered at the surface plane of the droplet. To test whether this localization is sufficiently strong that the laser-induced rotation effectively occurs in a plane, we solved the time-dependent Schrödinger equation for \ceK2 in the state using an isolated 2D rotor model Mirahmadi et al. (2021). Again, we treat the effective rotational constant, now denoted , as a free parameter. Fig. 5(c2) displays the simulated alignment trace, obtained for the value of , 1.78 GHz, that gives the best match with the experimental alignment trace. We interpret as the effective rotational constant with respect to the normal vector of the surface, which is the relevant axis of rotation for the 2D motion. Since the dimer is not lying completely flat on the surface, according to Figure 4(b1), we expect that is larger than . In fact, from we can determine the (classically) expected ratio / as , where is the value of the rotational constant averaged over . From in Figure 4(b1), we find , which is fairly close to / = 1.08.
As a reference, we calculated the alignment dynamics of isolated gas-phase \ceK2() dimers, that is, with () removed from the Hamiltonian in Eq. 1. The result obtained with a rotational constant = , shown in Fig. 5(d2), looks qualitatively different from the measured . Notably the polarity of every second revival structure is opposite to that in the experimental trace. This difference persists independent of the choice of . Similarly, the spectrum corresponding to the isolated gas-phase dynamics cannot be brought to match the experimental spectrum no matter the choice of . Thus, the observed alignment dynamics cannot be described by the laser-induced rotation of isolated molecules.
Next, we turn to the results for \ceK2 in the state. The alignment trace calculated with the Hamiltonian in Eq. 1, using () displayed in Figure 4(b2), is illustrated in Fig. 5(a3). The calculated was obtained for = 0.66 GHz and = 0.05 GHz, which are the values that produced the best agreement with the experimental in terms of matching the positions of the revival structures. In comparison, = 0.79 GHz Bauer and Toennies (2019), so / = 1.20. Thus, the triplet state dimer is relatively more He-dressed than the singlet state dimer. As for \ceK2(), increasing results in a better agreement with the experimental alignment concerning the decay in but deteriorates the agreement with respect to the positions of the revivals.
Like in the \ceK2() case we also applied the 2D rotor model. Fig. 5(c3) shows the resulting alignment trace obtained for = 0.69 GHz, which led to revival maxima and minima at positions closely matching those in the experimental trace. The alignment dynamics from the 2D model is also essentially identical to from the 3D + () model without the inhomogeneous broadening included, Fig. 5(b3). As for \ceK2(), we determined from , which is quite similar to / = 1.05. Note that for the \ceK2() dimers is (percent-wise) closer to than in the case of the \ceK2() dimers. The reason is, we believe, that the triplet dimers are lying more flat on the surface than the singlet dimers – see Figure 4(b1) and Figure 4(b2).
IV.2 Calculations for \ceNa2
For \ceNa2 in the state, the best agreement with the experimental is obtained for = 1.27 GHz and = 0.1 GHz in the 3D + () calculation, Eq. 1, with () displayed in Figure 4(a2). The simulated is illustrated by the red curve in Figure 2(a3). The value of the gas-phase rotational constant is 1.65 GHz Bauer and Toennies (2019), which gives / = 1.30. Thus, \ceNa2() experiences some He-dressing similar to what was observed for \ceK2(). We also applied the 2D rotor model to \ceNa2 in the triplet state and found excellent agreement with the structure of the experimental alignment trace using = 1.33 GHz 666The simulated result is not shown here but can be seen in Fig. 2 of Ref. Kranabetter et al. (2023). As for the \ceK2 dimer, we determined from and found a ratio of 1.05, which is spot on with / = 1.05.
We also simulated the alignment dynamics for \ceNa2 in the state with the 3D + () model now using () shown in Figure 4(a1). Here, the best agreement with the experimental comes with the parameters = 4.53 GHz and = 0.17 GHz. For comparison, = 4.64 GHz Deiglmayr et al. (2008) so / = 1.02, which follows the trend of only very little He-dressing found for \ceK2(). Interestingly, the 2D rotor model was not able to qualitatively capture the experimental alignment trace. We believe this is due to the much wider of \ceNa2() compared to the other dimers, see Figure 4, i.e., the angular localization of the dimer axis to the surface plane is not strong enough to restrict the rotation to two dimensions.
IV.3 Calculations for \ceRb2
The red curve in Figure 2(c2) shows the calculated for \ceRb2 in the state, based on the 3D + () model using () displayed in Figure 4(c1). In this case, we find that it is = 0.66 GHz and = 0.05 GHz that give the best match with the experimental alignment trace. The gas-phase rotational constant is 0.67 GHz Deiglmayr et al. (2008) so / = 1.02, in line with the findings for the singlet state of \ceK2 and \ceNa2. We also find that the rotational dynamics are well-described by the 2D rotor model (not shown) for = 0.69 GHz. This is expected since the internuclear axis of \ceRb2() is quite strongly confined to the surface plane of the droplet, see Figure 4(c1). Again, we determined from and found a ratio of 1.08, which is quite close to / = 1.05.
For \ceRb2 in the it is not possible to obtain a reliable match between the calculated and the measured due to the lack of alignment dynamics after the initial alignment peak in the measurement, see Figure 2(c3). Instead we employ a previously calculated effective rotational constant for the dimer at a helium surface, = 0.28 GHz Guillon et al. (2011), a value which is slightly smaller than = 0.32 GHz Bauer and Toennies (2019). Using this and = 0.05 GHz, the same amount of inhomogeneous broadening as found for \ceRb2() and for \ceK2, we calculate an alignment trace with the 3D + () model. The result is presented as the red curve in Figure 2(c3). The calculation shows that remains at 0.5 in the interval from = 100 ps to = 700 ps followed by a revival with moderate amplitude. Presumably, this revival structure is not observed in the measurement due to the same mechanisms that are responsible for the gradual decrease in the degree of alignment for the other alkali dimers. We note that alignment dynamics are still observed in the measurement for \ceRb2 in the state around the time scale of the missing half revival in the state measurement, as can be seen by comparing Figure 2(c2) and (c3). This indicates that the gradual decay in the degree of alignment happens faster for \ceRb2 in the state than for the state.
V Discussion
Table 1 summarizes the effective values obtained for the different alkali dimers via fits to the 3D model including (). To assess the uncertainties in the reported values, we have done a series of additional calculations with slight changes to . Based on how well the calculations fit the measured alignment traces, we estimate the uncertainty in to 0.02 GHz. If is varied more than that, we observe significant discrepancies between the calculations and the measured alignment traces, in particular for the central positions of the peaks in the spectra.
Via the experimentally determined values and the theoretical values for we have calculated the ratios / for each dimer, with the exception of \ceRb2 in the state. All ratios are presented in Table 1. The uncertainties indicated were derived via the estimated uncertainty of and do not include possible uncertainties of the literature values of . For the state dimers, is only 2% larger than , indicating that the interaction with the helium droplet is very weak. In contrast, is 30% and 20% larger than for \ceNa2 and \ceK2 in the states, respectively, suggesting that the state dimers are more strongly influenced by the helium surface than their state counterparts. Finally, we note that the / ratios for both spin states are much smaller than the ratios of 2–6 observed for linear molecules inside helium droplets Choi et al. (2006); Chatterley et al. (2020a).
The primary shortcoming of the 3D model with () and inhomogeneous broadening is that the amplitude of the revivals in the calculated does not decay fast enough compared to the experimental observations. As mentioned earlier, this indicates that the rotational wave packets are also influenced by homogeneous broadening, that is, by loss of population in the excited rotational levels due to the finite lifetimes, and possibly also by a direct loss of phase Choi et al. (2006); Blancafort-Jorquera et al. (2019). We note that molecules rotating inside helium droplets appears less influenced by inhomogeneous broadening Chatterley et al. (2020a). This difference is currently not clear, nor is it clear why \ceNa2 appears to be subjected to more inhomogeneous broadening than \ceK2 and \ceRb2, especially for the state.
| State | (GHz) | (GHz) | / |
|---|---|---|---|
| \ceNa_2 | 4.53 0.02 | 4.64111From Ref. Deiglmayr et al., 2008. | 1.02 0.01 |
| \ceK_2 | 1.65 0.02 | 1.68111From Ref. Deiglmayr et al., 2008. | 1.02 0.01 |
| \ceRb_2 | 0.66 0.02 | 0.67111From Ref. Deiglmayr et al., 2008. | 1.02 0.03 |
| \ceNa_2 | 1.27 0.02 | 1.65222From Ref. Bauer and Toennies, 2019. | 1.30 0.02 |
| \ceK_2 | 0.66 0.02 | 0.79222From Ref. Bauer and Toennies, 2019. | 1.20 0.04 |
| \ceRb_2 | - | 0.32222From Ref. Bauer and Toennies, 2019. | - |
VI Conclusion and outlook
There are two major points, we want to emphasize from this work. Both bring about new insight, leave open questions and point towards new opportunities. Firstly, we showed that the three alkali dimer species, \ceNa2, \ceK2, and \ceRb2, residing on the surface of a helium nanodroplet and populated in either the or the state, can be set into rotation by a 1 ps laser pulse. In all three cases, the laser-dimer interaction leads to a global maximum in the degree of alignment at 5–25 ps after the laser pulse and with a peak value of value in the range 0.57–0.66. At longer times, the alignment dynamics exhibit a number of transient structures (revivals) with a decreasing amplitude such that there is no discernible variation of after 1000 ps. \ceRb2() makes an exception in that the only structure in is the prompt peak; no revivals are observed. The simulated degree of alignment found by solving the time-dependent Schrödinger equation with the droplet-dimer potential included reproduces the experimental alignment dynamics well in terms of positions and polarity of the revival structures. Inclusion of inhomogeneous broadening, corresponding to a distribution of rotational constants, leads to a decreasing amplitude of the simulated alignment trace although not as pronounced as in the experimental data. Secondly, using the rotational coherence spectroscopy aspect of nonadiabatic laser-induced alignment, we determined the effective rotational constants for the dimers with the exception of \ceRb2(). For \ceNa2 and \ceK2 in the state is reduced by 20-30 % compared to while for \ceNa2, \ceK2 and \ceRb2 in the state is only a couple of percent smaller than . Currently, there are no theoretical results to benchmark these results against.
We believe the current work opens several new possibilities. 1) Inclusion of rotational echo techniques Karras et al. (2015); Rosenberg et al. (2018); Zhang et al. (2019) may enable a distinction between homogeneous and inhomogeneous broadening, something which is not possible with the current measurements. Such an experimental extension could shed light on why the alignment transients disappear so quickly compared to that expected based on pure inhomogeneous broadening. 2) Rotational echo techniques typically involve two alignment pulses. Such a scheme also makes it possible to explore enhancement of the degree of alignment by optimizing the timing and intensity of the two laser pulses Leibscher et al. (2004); Bisgaard et al. (2004); Lee et al. (2004). The largest value of observed was 0.66 in the case of \ceNa2(). This is a very modest degree of alignment. In terms of potential applications of the aligned molecules it would be highly beneficial with a significantly larger degree of alignment, which is something that alignment using two, or more, laser pulses may provide Cryan et al. (2009); Christiansen et al. (2015). 3) The \ceLi2 dimer, which is formed in the state on He droplets under standard conditions Lackner et al. (2013), is expected to be significantly less pinned to the droplet surface even compared to \ceNa2(). Preliminary studies in our group indicate that its alignment dynamics differs significantly from any of those observed here. 4) Finally, it should also be possible to explore nonadiabatic alignment of heteronuclear dimers of alkali atoms or of mixed alkali–alkaline earth atom dimers and use the results to determine effective rotational constants, none of which are currently known.
Acknowledgements.
H.S. acknowledges support from The Villum Foundation through a Villum Investigator Grant No. 25886. We thank Jan Thøgersen for expert help with the optics and the laser system.*
Appendix A
Details on theoretical modeling
A.1 3D model
First, we note that the experimental (t) is determined for those dimers that are parallel to, or close to parallel to, the detector plane. This is so because in the 2D velocity images, we only analyze \ceAk+ fragment ions in a fairly narrow ring around the maximum radius defined by the ions from Coulomb explosion of dimers aligned parallel to the detector plane, see Fig. 1(a) and (b), where the outermost ring (innermost) ring contains the \ceK+ ions from the () state.
In the simulations, we assume that the dimers are located at a position on the droplet where the surface plane is parallel to the detector plane. This emulates to some degree the outcome of the experiment and, in addition, it greatly simplifies the numerical calculations compared to if the surface plane is randomly oriented with respect to the detector. We are aware that there could be some contribution to the experimental signal from other locations of the dimers on the droplets. One implication of not including this contribution is that the calculations tend to overestimate but, importantly, the omission of other dimers locations does not change the rotational dynamics of the dimers, i.e. the spectral peaks are not influenced.
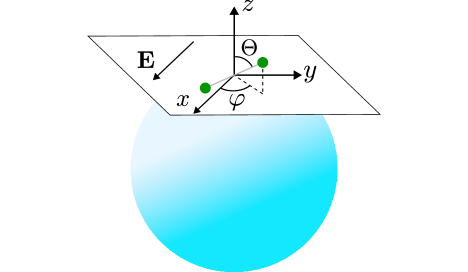
The coordinate system used in the simulations is shown in Fig. 6. The detector plane is parallel to the plane and the polarization of the alignment pulse is parallel to the x-axis, i.e. . With this definition, the potential associated with the laser-molecule interaction can be written as Søndergaard et al. (2017)
| (2) |
where is the electric field amplitude and is the polarizability anisotropy. We employ a laser pulse with a Gaussian envelope function:
| (3) |
where is the full width at half maximum (FWHM) of the pulse duration and is the peak intensity. The full rotational Hamiltonian describing the alkali dimers on the droplet surface now takes the form
| (4) |
which is equivalent to that given in Eq. 1.
For a specific initial basis state of the dimer, the simulation proceeds by time propagating the state through diagonalization of the Hamiltonian with () or without laser field (, for the laser intensity is assumed to be zero) with a step size in the linear molecule basis (keeping up to states). Once the state is known at each time step, the degree of alignment observed in the detector plane can be obtained by calculating the expectation value of
| (5) |
To take the temperature and nuclear spin statistics into account, we first diagonalize to obtain the corresponding eigenvalues. We then do thermal averaging of with the corresponding Boltzmann factor and include the abundances of even and odd states according to nuclear spin statistics (() is even with respect to around and does therefore not mix odd and even values). To account for the inhomogeneous broadening, the rotational constant is assumed to be normally distributed about
| (6) |
with a standard deviation , which is related to by . The expectation value is averaged with respect to different rotational constants sampled from the normal distribution (200 samples. Finally, we also include the abundance ratios of different isotopologues. For the cases where the dimer is composed of different isotopes, for example \ce^39K^41K, there is no effect of nuclear spin statistics.
A.2 2D model
When the molecule is confined to the plane, the motion becomes two-dimensional. In that case, the Hamiltonian of the system is
| (7) |
with
| (8) |
The definition of is the same as for the 3D case. For the 2D case, the basis states are now the eigenstates of , satisfying the relation (again keeping the states from to ), where now odd/even sector division is with respect to the quantum number , since that is what defines parity in the 2D case.
References
- Stapelfeldt and Seideman (2003) H. Stapelfeldt and T. Seideman, Rev. Mod. Phys. 75, 543 (2003).
- Seideman and Hamilton (2005) T. Seideman and E. Hamilton, Adv. At. Mol. Opt. Phys 52, 289 (2005).
- Ohshima and Hasegawa (2010) Y. Ohshima and H. Hasegawa, Int. Rev. Phys. Chem. 29, 619 (2010).
- Fleischer et al. (2012) S. Fleischer, Y. Khodorkovsky, E. Gershnabel, Y. Prior, and I. S. Averbukh, Isr. J. Chem. 52, 414 (2012).
- Koch et al. (2019) C. P. Koch, M. Lemeshko, and D. Sugny, Rev. Mod. Phys. 91, 035005 (2019).
- Ramakrishna and Seideman (2005) S. Ramakrishna and T. Seideman, Phys. Rev. Lett. 95, 113001 (2005).
- Vieillard et al. (2008) T. Vieillard, F. Chaussard, D. Sugny, B. Lavorel, and O. Faucher, J. Raman Spectrosc. 39, 694 (2008).
- Owschimikow et al. (2010) N. Owschimikow, F. Königsmann, J. Maurer, P. Giese, A. Ott, B. Schmidt, and N. Schwentner, J. Chem. Phys. 133, 044311 (2010).
- Zhang et al. (2019) H. Zhang, B. Lavorel, F. Billard, J.-M. Hartmann, E. Hertz, O. Faucher, J. Ma, J. Wu, E. Gershnabel, Y. Prior, and I. S. Averbukh, Phys. Rev. Lett. 122, 193401 (2019).
- Ma et al. (2019) J. Ma, H. Zhang, B. Lavorel, F. Billard, E. Hertz, J. Wu, C. Boulet, J.-M. Hartmann, and O. Faucher, Nat Commun 10, 1 (2019).
- Bournazel et al. (2023) M. Bournazel, J. Ma, F. Billard, E. Hertz, J. Wu, C. Boulet, J.-M. Hartmann, and O. Faucher, Phys. Rev. A 107, 023115 (2023).
- Pentlehner et al. (2013a) D. Pentlehner, J. H. Nielsen, A. Slenczka, K. Mølmer, and H. Stapelfeldt, Phys. Rev. Lett. 110, 093002 (2013a).
- Schmidt and Lemeshko (2015) R. Schmidt and M. Lemeshko, Phys. Rev. Lett. 114, 203001 (2015).
- Pickering et al. (2018) J. D. Pickering, B. Shepperson, B. A. K. Hübschmann, F. Thorning, and H. Stapelfeldt, Phys. Rev. Lett. 120, 113202 (2018).
- Vindel-Zandbergen et al. (2018) P. Vindel-Zandbergen, J. Jiang, M. Lewerenz, C. Meier, M. Barranco, M. Pi, and N. Halberstadt, J. Chem. Phys. 149, 124301 (2018).
- Chatterley et al. (2019) A. S. Chatterley, C. Schouder, L. Christiansen, B. Shepperson, M. H. Rasmussen, and H. Stapelfeldt, Nat. Commun. 10, 133 (2019).
- Cherepanov et al. (2021) I. N. Cherepanov, G. Bighin, C. A. Schouder, A. S. Chatterley, S. H. Albrechtsen, A. V. Muñoz, L. Christiansen, H. Stapelfeldt, and M. Lemeshko, Phys. Rev. A 104, L061303 (2021).
- Qiang et al. (2022) J. Qiang, L. Zhou, P. Lu, K. Lin, Y. Ma, S. Pan, C. Lu, W. Jiang, F. Sun, W. Zhang, H. Li, X. Gong, I. S. Averbukh, Y. Prior, C. A. Schouder, H. Stapelfeldt, I. N. Cherepanov, M. Lemeshko, W. Jäger, and J. Wu, Phys. Rev. Lett. 128, 243201 (2022).
- Liu et al. (2023) Y.-Y. Liu, Y. Cui, X.-Z. Zhang, R.-B. Yang, Z.-Q. Li, and Z.-W. Wang, J. Chem. Phys. 159, 114305 (2023).
- Milner et al. (2024) A. A. Milner, I. MacPhail-Bartley, K. Preocanin, S. Dasgupta, X. Peng, and V. Milner, Phys. Rev. A 109, 013110 (2024).
- Chatterley et al. (2020a) A. S. Chatterley, L. Christiansen, C. A. Schouder, A. V. Jørgensen, B. Shepperson, I. N. Cherepanov, G. Bighin, R. E. Zillich, M. Lemeshko, and H. Stapelfeldt, Phys. Rev. Lett. 125, 013001 (2020a).
- Shepperson et al. (2017) B. Shepperson, A. A. Søndergaard, L. Christiansen, J. Kaczmarczyk, R. E. Zillich, M. Lemeshko, and H. Stapelfeldt, Phys. Rev. Lett. 118, 203203 (2017).
- Ancilotto et al. (1995) F. Ancilotto, G. DeToffol, and F. Toigo, Phys. Rev. B 52, 16125 (1995).
- Stienkemeier and Vilesov (2001) F. Stienkemeier and A. F. Vilesov, J. Chem. Phys. 115, 10119 (2001).
- Barranco et al. (2006) M. Barranco, R. Guardiola, S. Hernández, R. Mayol, J. Navarro, and M. Pi, J Low Temp Phys 142, 1 (2006).
- Kranabetter et al. (2023) L. Kranabetter, H. H. Kristensen, A. Ghazaryan, C. A. Schouder, A. S. Chatterley, P. Janssen, F. Jensen, R. E. Zillich, M. Lemeshko, and H. Stapelfeldt, Phys. Rev. Lett. 131, 053201 (2023).
- Choi et al. (2006) M. Y. Choi, G. E. Douberly, T. M. Falconer, W. K. Lewis, C. M. Lindsay, J. M. Merritt, P. L. Stiles, and R. E. Miller, Int. Rev. Phys. Chem. 25, 15 (2006).
- Kristensen et al. (2023) H. H. Kristensen, L. Kranabetter, C. A. Schouder, J. Arlt, F. Jensen, and H. Stapelfeldt, Phys. Rev. A 107, 023104 (2023).
- Stienkemeier et al. (1995) F. Stienkemeier, J. Higgins, W. E. Ernst, and G. Scoles, Phys. Rev. Lett. 74, 3592 (1995).
- Higgins et al. (1998) J. Higgins, C. Callegari, J. Reho, F. Stienkemeier, W. E. Ernst, M. Gutowski, and G. Scoles, J. Phys. Chem. A 102, 4952 (1998).
- Auböck et al. (2007) G. Auböck, J. Nagl, C. Callegari, and W. E. Ernst, J. Phys. Chem. A 111, 7404 (2007).
- Magnier et al. (1993) S. Magnier, P. Millié, O. Dulieu, and F. Masnou-Seeuws, J. Chem. Phys. 98, 7113 (1993).
- Magnier et al. (2004) S. Magnier, M. Aubert-Frécon, and A. R. Allouche, J. Chem. Phys. 121, 1771 (2004).
- Allouche and Aubert-Frécon (2012) A.-R. Allouche and M. Aubert-Frécon, J. Chem. Phys. 136, 114302 (2012).
- Kristensen et al. (2022) H. H. Kristensen, L. Kranabetter, C. A. Schouder, C. Stapper, J. Arlt, M. Mudrich, and H. Stapelfeldt, Phys. Rev. Lett. 128, 093201 (2022).
- Schouder et al. (2020) C. A. Schouder, A. S. Chatterley, L. B. Madsen, F. Jensen, and H. Stapelfeldt, Phys. Rev. A 102, 063125 (2020).
- Chatterley et al. (2020b) A. S. Chatterley, M. O. Baatrup, C. A. Schouder, and H. Stapelfeldt, Phys. Chem. Chem. Phys. 22, 3245 (2020b).
- Note (1) This is the only vibrational level populated at the 0.4 K temperature of the droplet.
- Note (2) This holds for the \ce^39K2 isotopologue (87.0 % abundance). For the \ce^39K^41K isotopologue (12.6 % abundance), the \ce^39K+ ion gets 51.3 % of the Coulomb energy.
- Deiglmayr et al. (2008) J. Deiglmayr, M. Aymar, R. Wester, M. Weidemüller, and O. Dulieu, J. Chem. Phys. 129, 064309 (2008).
- Bauer and Toennies (2019) J. B. Bauer and J. P. Toennies, J. Chem. Phys. 150, 144310 (2019).
- Pentlehner et al. (2013b) D. Pentlehner, J. H. Nielsen, L. Christiansen, A. Slenczka, and H. Stapelfeldt, Phys. Rev. A 87, 063401 (2013b).
- Ladjimi and Tomza (2024) H. Ladjimi and M. Tomza, Phys. Rev. A 109, 052814 (2024).
- Dooley et al. (2003) P. W. Dooley, I. V. Litvinyuk, K. F. Lee, D. M. Rayner, M. Spanner, D. M. Villeneuve, and P. B. Corkum, Phys. Rev. A 68, 023406 (2003).
- Ghafur et al. (2009) O. Ghafur, A. Rouzee, A. Gijsbertsen, W. K. Siu, S. Stolte, and M. J. J. Vrakking, Nat Phys 5, 289 (2009).
- Wu et al. (2011) J. Wu, A. Vredenborg, B. Ulrich, L. P. H. Schmidt, M. Meckel, S. Voss, H. Sann, H. Kim, T. Jahnke, and R. Dörner, Phys. Rev. A 83, 061403 (2011).
- Friedrich and Herschbach (1995) B. Friedrich and D. Herschbach, Phys. Rev. Lett. 74, 4623 (1995).
- Note (3) See Supplemental Material at [URL will be inserted by publisher] for the \ceAk2-He potentials.
- Halkier et al. (1999) A. Halkier, T. Helgaker, P. Jørgensen, W. Klopper, and J. Olsen, Chem. Phys. Lett. 302, 437 (1999).
- Burns et al. (2014) L. A. Burns, M. S. Marshall, and C. D. Sherrill, J. Chem. Theory Comput. 10, 49 (2014).
- van Duijneveldt et al. (1994) F. B. van Duijneveldt, J. G. C. M. van Duijneveldt-van de Rijdt, and J. H. van Lenthe, Chem. Rev. 94, 1873 (1994).
- Prascher et al. (2011) B. P. Prascher, D. E. Woon, K. A. Peterson, T. H. Dunning, and A. K. Wilson, Theor Chem Acc 128, 69 (2011).
- Hill and Peterson (2017) J. G. Hill and K. A. Peterson, J. Chem. Phys. 147, 244106 (2017).
- Noro et al. (2012) T. Noro, M. Sekiya, and T. Koga, Theor. Chem. Acc. 131, 1124 (2012).
- Guillon et al. (2011) G. Guillon, A. Zanchet, M. Leino, A. Viel, and R. E. Zillich, J. Phys. Chem. A 115, 6918 (2011).
- Lehmann (1999) K. K. Lehmann, Mol. Phys. 97, 645 (1999).
- Lehmann (2007) K. K. Lehmann, J. Chem. Phys. 126, 024108 (2007).
- Zillich et al. (2008) R. E. Zillich, K. B. Whaley, and K. von Haeften, J. Chem. Phys. 128, 094303 (2008).
- Felker (1992) P. M. Felker, J. Phys. Chem. 96, 7844 (1992).
- Riehn (2002) C. Riehn, Chem. Phys. 283, 297 (2002).
- Note (4) For \ceNa2 and \ce^39K2: : odd/even: 5/3; : odd/even: 3/5. For \ce^85Rb2: : odd/even: 7/5; : odd/even: 5/7.
- Berglund and Wieser (2011) M. Berglund and M. E. Wieser, Pure Appl. Chem. 83, 397 (2011).
- Note (5) In Ref. Kranabetter et al. (2023), focal volume averaging was included in the calculation of nonadiabatic alignment dynamics of \ceNa2(). The results showed no significant difference compared to the results for a calculation without focal volume averaging.
- Mirahmadi et al. (2021) M. Mirahmadi, B. Schmidt, and B. Friedrich, New J. Phys. 23, 063040 (2021).
- Note (6) The simulated result is not shown here but can be seen in Fig. 2 of Ref. Kranabetter et al. (2023).
- Blancafort-Jorquera et al. (2019) M. Blancafort-Jorquera, A. Vilà, and M. González, Phys. Chem. Chem. Phys. 21, 21007 (2019).
- Karras et al. (2015) G. Karras, E. Hertz, F. Billard, B. Lavorel, J.-M. Hartmann, O. Faucher, E. Gershnabel, Y. Prior, and I. S. Averbukh, Phys. Rev. Lett. 114, 153601 (2015).
- Rosenberg et al. (2018) D. Rosenberg, R. Damari, and S. Fleischer, Phys. Rev. Lett. 121, 234101 (2018).
- Leibscher et al. (2004) M. Leibscher, I. S. Averbukh, and H. Rabitz, Phys. Rev. A 69, 013402 (2004).
- Bisgaard et al. (2004) C. Z. Bisgaard, M. D. Poulsen, E. Péronne, S. S. Viftrup, and H. Stapelfeldt, Phys. Rev. Lett. 92, 173004 (2004).
- Lee et al. (2004) K. F. Lee, I. V. Litvinyuk, P. W. Dooley, M. Spanner, D. M. Villeneuve, and P. B. Corkum, J. Phys. B 37, L43 (2004).
- Cryan et al. (2009) J. P. Cryan, P. H. Bucksbaum, and R. N. Coffee, Phys. Rev. A 80, 063412 (2009).
- Christiansen et al. (2015) L. Christiansen, J. H. Nielsen, D. Pentlehner, J. G. Underwood, and H. Stapelfeldt, Phys. Rev. A 92, 053415 (2015).
- Lackner et al. (2013) F. Lackner, J. Poms, G. Krois, J. V. Pototschnig, and W. E. Ernst, J. Phys. Chem. A 117, 11866 (2013).
- Søndergaard et al. (2017) A. A. Søndergaard, B. Shepperson, and H. Stapelfeldt, J. Chem. Phys. 147, 013905 (2017).