Analysis of the Effect of Bars on Environmental Dependence of Disc Galaxies with MaNGA Survey Data
Abstract
Bars are fundamental structures in disc galaxies, although their role in galaxy evolution is still not fully known. This study investigates the effect of the presence of bars on the environmental dependence of disc galaxies’ properties using the volume-limited sample from Mapping Nearby Galaxies at APO (MaNGA) survey. The disc galaxies with and without bars samples were obtained using the Galaxy Zoo 2 project then assigned into field and group sub-samples. These sub-samples were used to compare the stellar mass, star formation rate, colour, concentration index and gas phase metallicity, and their relationships between field and group environments. Then these are used to investigate if there is an existence of any difference between galaxies with and without bars. A one-to-one correspondence between field and group galaxies’ properties were observed, and a strong dependence on the environment for properties of unbarred galaxies was observed when compared to barred. The stellar mass against star formation rate, colour against concentration index and stellar mass against gas phase metallicity of unbarred galaxies strongly depend on environment while for barred these relations weakly depend on environment. The study concludes that bars in disc galaxies decrease the dependence of analysed properties and its relations on the environment.
I Introduction
Bars are commonly seen in disc galaxies in today’s Universe and are believed to play a significant role in shaping the development of galaxies by facilitating the transfer of angular momentum, within both the visible and dark matter components of the galaxy as suggested by simulations [2, 1]. Hence they are very important structures in the disc galaxies, although their role in galaxy evolution is still not fully known [3, 5, 4, 6, 7]. The mechanism for the growth of bars and the question as to why some galaxies have bars while others do not are still not understood in detail [5, 1, 2]. Bars typically expand by capturing stars from the existing disc, they may also generate stars from channeled gas; however, it is crucial to strike a balance between the growth of bars and the disc, as simulations indicate that excessive gas channeling could lead to bar destruction [1]. Ref. [2] highlighted that a significant number of bars are believed to originate from disc instability and further noted that a disc with gas-poor content is more likely to develop a bar.
Various studies have looked at how a bar impacts its host galaxy obtaining conflicting outcomes [8, 10, 11, 12, 9, 13, 14, 15, 16, 18, 19, 20, 17]. Bars are also effective in pushing gas towards the centre of galaxies to fuel star formation bursts where this process could potentially raise the metal content in the regions of both gas and stars [8, 13]. Gas that accumulates in the areas of a galaxy due to the bar can be utilised for star formation as mentioned in Ref. [14] as well to fuel the central black hole or to enhance the central mass concentration [15]. While it remains uncertain whether bars directly cause gas consumption, indications point to a connection between bars and this phenomenon [16, 17, 18, 19, 9, 23, 6, 21, 4, 19, 22, 20]. There is evidence of an increased rate of forming stars at the centres of barred galaxies e.g. see Ref. [16], which often appear as nuclear rings [17]. The time for this enhanced rate of forming stars is still unknown although the estimate from the stellar population analysis indicates that these are short-lived and may consist of a sequence of continuous eruptions [18]. Ref. [19] found that the metallicity in the central area is increased, however, fiber observations of low-mass and low-redshift galaxies showed no similar rise in star formation rate (SFR). According to the study by Ref. [9], barred galaxies have older and more metal-rich stellar populations when compared to unbarred. Since bars are observed to have both suppress and enhance the SFR in disc galaxies it is difficult to mention if bars are the driver of SFR or the result of star formation cessation in galaxies.
To determine whether there are differences between galaxies with and without bars, many observational studies have attempted to compare galaxies with and without bars, however, their findings are not conclusive [23, 6, 21, 4, 19, 22]. Unbarred galaxies have a greater SFR than barred galaxies according to Ref. [4], which compares a volume-limited sample of barred galaxies matching the galaxies’ stellar masses (M) with a sample of unbarred galaxies making a total of galaxies with from the Sloan Digital Sky Survey in order to investigate the relationship between disc features and bulge in the presence of a large galaxy bar. Authors discovered that although there is no significant difference in colours, the discs of galaxies without bars are noticeably bluer than those barred. Their analysis leads to the conclusion that this situation deserves further research, both theoretical and empirical. There is much evidence for gas flow along bars, including the increased central metallicity in spiral galaxies with bars when compared to unbarred spirals regardless of the global SFR results and higher central gas molecular content [19, 22, 23]. The fact that galaxies with bars are redder than those without bars and that the fraction of gas and SFR are lower at constant M is possible evidence for the role of the bars in reducing the SFR as pointed out by Ref. [4], despite the fact that Ref. [6] observed that there is no evidence to confirm such a relationship.
Single-fibre analyses of the star population in barred galaxies’ center area (bulge) reveal similarities to those of unbarred galaxies. Ref. [3] states that there is no noticeable distinction in the metallicity (not gas or stars) of barred and unbarred galaxies. According to Ref. [6], the host galaxy’s M affects the incidence of bars where for galaxies with mass MM, the fraction of bars increases with M, while remain constant between 50% and 60% for more massive galaxies. The size of the bar also depends on the M of the galaxy for which Ref. [6] found that there is a two-fold relationship between bar size and M: the size of the bar is nearly constant in galaxies at kpc and MM, and the bar size at higher M scales as M. Ref. [24] investigating the dependence of bars occurrence on properties of galaxies and environments using a volume-limited sample generated from the seventh release of Sloan Digital Release Sky Survey, notice that the redder the colour, the increase of strong bar will be, and the highest value in the intermediate velocity dispersion. This trend indicates that medium mass systems often have strong bars. The low-mass, low-density blue galaxies are preferred for weak bars while the strong bars affect the concentration index of the galaxies when massive galaxies are considered. They again found that when other physical properties of the galaxy (such as colour) were fixed the bar fraction was not directly affected by the large background density. Furthermore Ref. [24] discovered that for strong bars, the distance to the nearest neighbour galaxy reduces when the neighbour’s virial radius drops to less than 10%, regardless of the neighbour’s morphology. These findings suggest that the mechanism underlying this phenomenon is gravitational rather than hydrodynamic. They further showed that strong bars collapse during the strong movement of the tides, then concluded that the fraction of weak bars was not related to environmental parameters.
A study by Ref. [25] examining the relationship between bars and AGN activity in late-type galaxies, reveals that AGN host galaxies have a higher fraction of bars (42.6%) compared to non-AGN galaxies (15.6%). However, this trend is influenced by the known fact that AGN host galaxies are generally more massive and redder. When controlling for factors like colour and M, the differences between bar presence and AGN activity disappear, indicating that bars do not enhance AGN activity. These findings suggest that there is no conclusive evidence that bars in galaxies stimulate AGN activity. Presenting initial findings from Galaxy Zoo 2 [26], focusing on 13,665 disc galaxies to analyse the prevalence of bars in these galaxies based on various properties like colour and luminosity, Ref. [26] observed that approximately 29.4% of the galaxies in the sample have bars, aligning with previous visual classifications but lower than automated methods. A noteworthy trend shows that the fraction of bars increases with a redder colour, less luminosity, and a dominated bulge indicating that more than half of the galaxy’s bar has a mostly red bulge. The results indicate a colour dichotomy in disc galaxies where the red sequence is dominated by the bar and bulge while the blue clouds have minimal bulge or bar evidence. This supports theories of galaxy evolution, despite the fact that the results were discussed in the context of the inner evolution scenario in relation to the bar and bulge formation of disc galaxies.
The majority of previous research has mainly used single-fiber spectroscopy to explain the evolution of bars and how they are influenced by both internal and external factors in understanding galaxy evolution [29, 27, 28, 30, 31, 32, 33]. According to Ref. [27], the proportion of barred galaxies is higher in the Coma cluster’s core than in the outer region. Ref. [28] observed the absence of statistical correlation between the environment and the presence of bars in spiral galaxies. They further pointed out that bars are influenced by internal mechanisms larger than external, opposite to Ref. [30], presenting the influence of environmental dependence of bars and bulges in disc galaxies, which observed that the likelihood of having a bar increases as galaxies become massive and redder observing a significant bar-environment correlation. Ref. [31] shows how galaxies without bars can be shielded by the strong tidal field at the centre. Some studies using N-body simulations confirm that the bars are caused by external factors [32, 33]. According to Ref. [33], the fraction of bars in the Virgo and Fornax groups is slightly higher than the field, which implies that the fraction of bars may vary in different environments. This result emphasizes on the observational efforts to find relationships between environment and bar fractions [33, 34].
Although the dynamical influence of bars has been studied in detail using individual cases [27, 31, 32, 33, 34, 35], statistically large enough samples of barred galaxies from cosmological studies are essential for systematically understanding the bars. Moreover, it is clear that large samples of galaxies with bars from spatially resolved spectroscopy are necessary to carry out a detailed analysis of the stellar population gradient trend. To address these needs, the Mapping Nearby Galaxies survey at Apache Point Observatory (MaNGA) [36, 37, 38] data and data from a citizen science effort (Galaxy Zoo 2) that attempts to distinguish light from structural components of galaxies within the MaNGA data cube have been implemented in this work. According to Ref. [39], fractional bar lengths and main sequence of star formation are related, which uses a defined sample of 684 disc galaxies from the MaNGA survey to investigate the star formation and gas properties of a stretch of barred galaxies having various M ranges and environments. The authors further concluded that star formation conditions within the core are controlled by shear, turbulence and wind flow. Therefore, the physical properties of the core are largely controlled by the host galaxy’s available M and it plays a role in the formation of stars in disc galaxies.
Our goal in this study is to investigate if the presence of bars in disc galaxies influences the dependence of their physical properties (M, SFR, colour, r-band concentration index () and gas phase metallicity) on the environment, using a large sample of local cosmic disc galaxies obtained from the integral field spectroscopy (IFS) data of the MaNGA survey [36, 37, 38].
We present the survey and the methods of getting the samples in Section II. Section III is used to present the results and in Section IV the results are discussed. We summarize the study in section V of this paper. We consider the standard cosmology with the Hubble constant km s-1 Mpc-1, matter density parameter , and dark energy density parameter .
II Data
II.1 MaNGA survey
The MaNGA survey [36, 37, 38] is one of the fourth-generation Sloan Digital Sky Survey (SDSS) [40], which has been used for the spatially resolved spectroscopic measurements studies containing galaxies employing fiber-Integrated Field Unit (IFU) operating in the range from to arcseconds ( fiber per IFU) with a wavelength coverage of , [36, 41, 42]. The target galaxies of MaNGA were chosen from a broad spectrum of various ranges in masses and colours within the redshift range of . According to Refs. [38, 37], the Primary + sample includes galaxies with a spatial coverage of up to of galaxy effective radius (Re) for of the total sample. Re is representing the radius within which half of the total light of the galaxy is enclosed [38, 43]. The remaining (secondary) samples are typically seen at a higher redshift than the Primary + sample, out to Re. In this study, we use a volume-limited sample up to , with km/s line-of-sight velocity difference covering Mpc projected distance generated from the MaNGA survey, as detailed in Ref. [44], which characterizes the environment of large-scale structures [45]. The use of a volume-limited sample is very important for statistical purposes based on the fact that using a flux-limited sample introduces bias as the faint galaxies at large distances are obscured by the luminous galaxies [46].
II.2 Barred and unbarred galaxy samples
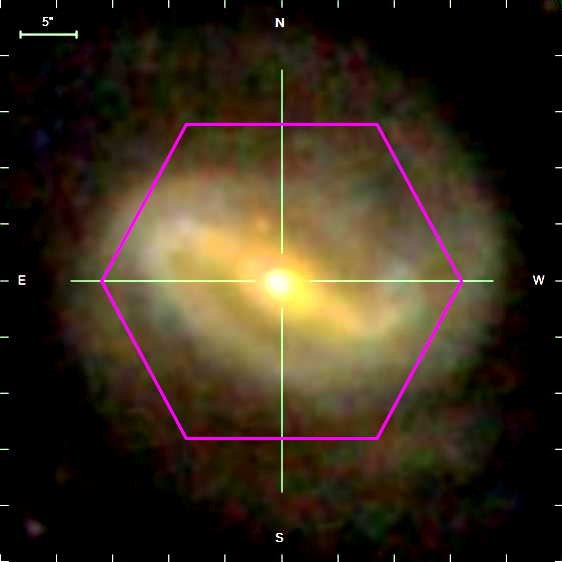
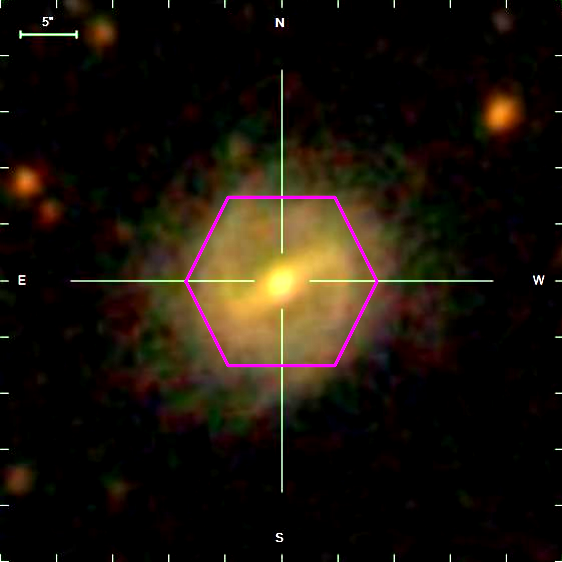
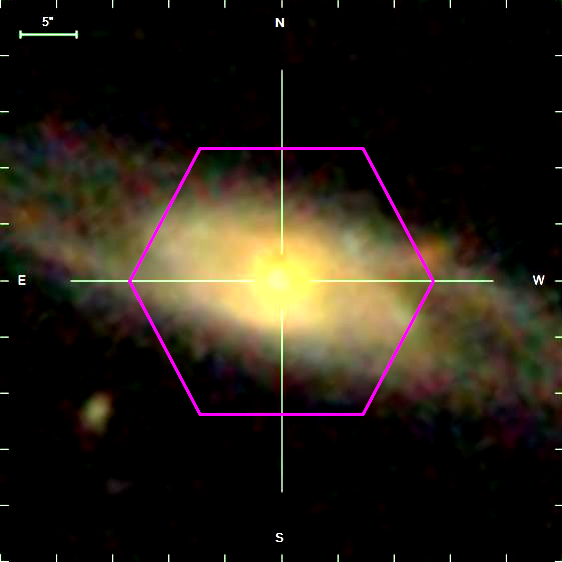
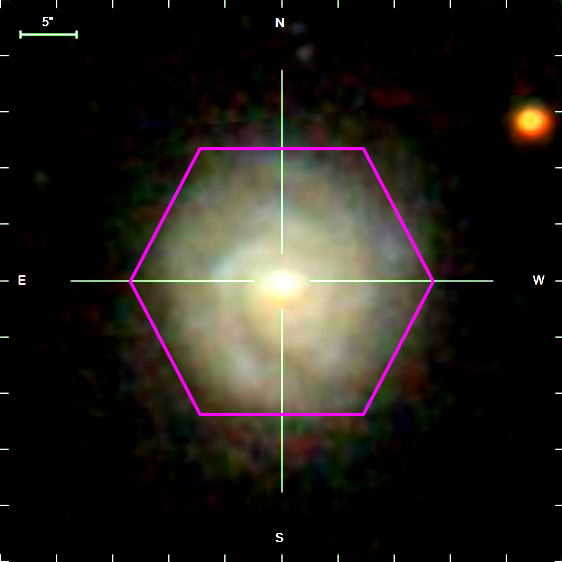
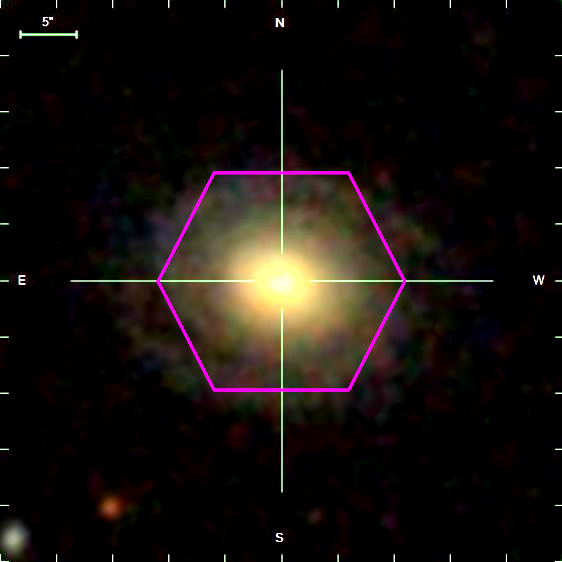
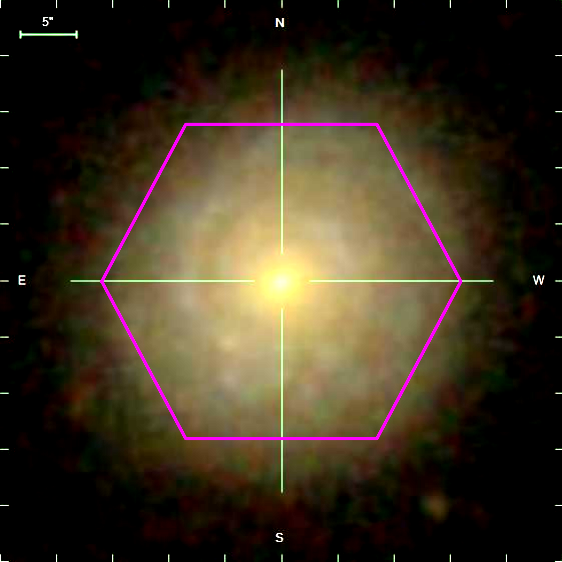
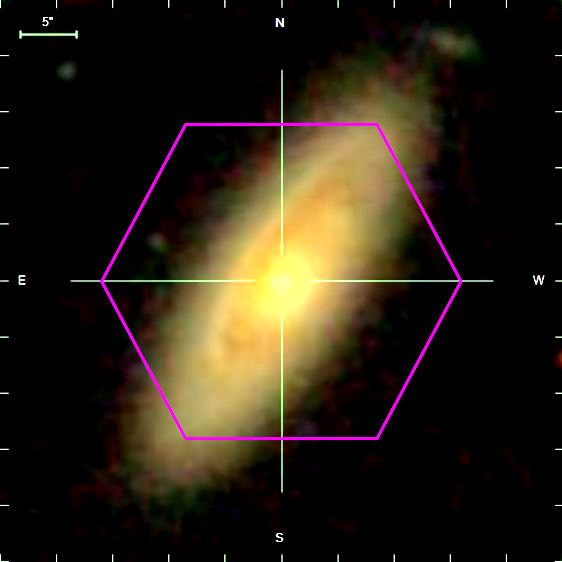
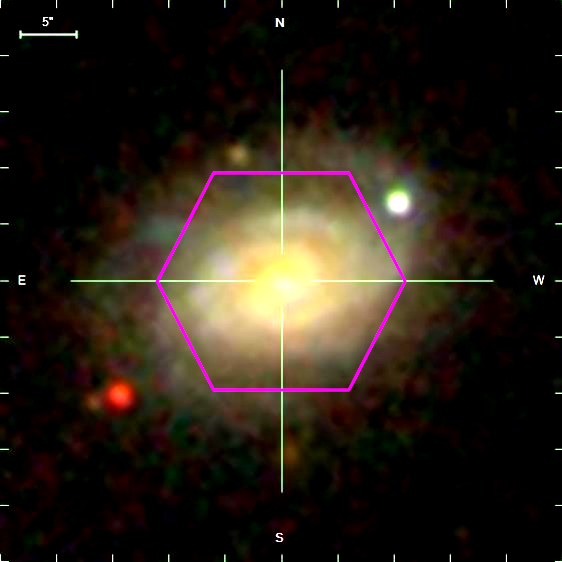
Morphological classifications for all MaNGA-restricted samples were obtained from the Galaxy Zoo 2 project as detailed in Refs. [48, 47]. Galaxies’ images were used by citizen scientists to identify if they are early, late, or merges, and additionally, more detailed features such as bars, bulges and edge shapes were measured. Respondents answered questions depending on their observation about the galaxy image, then were asked a follow-up question based on their answer using a decision tree mode at which Ref. [47] provides an unbiased opinion fraction for each of these questions. This has been improved in Ref. [48] with the limitations of considering good sample galaxies under each classification. It is very important to keep in mind that in this work, the limits recommended in Ref. [47] are used to find samples of barred and unbarred galaxies. For the selection of barred and unbarred galaxies’ samples we used the following criteria:
| (1) | |||
| (2) | |||
| (3) | |||
| (4) | |||
| (5) |
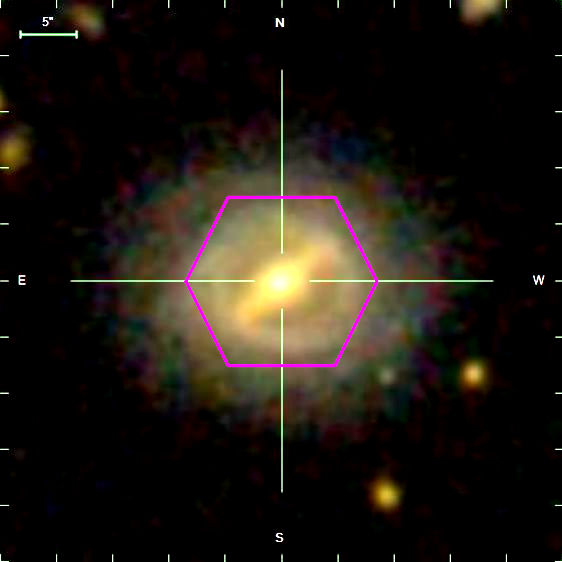
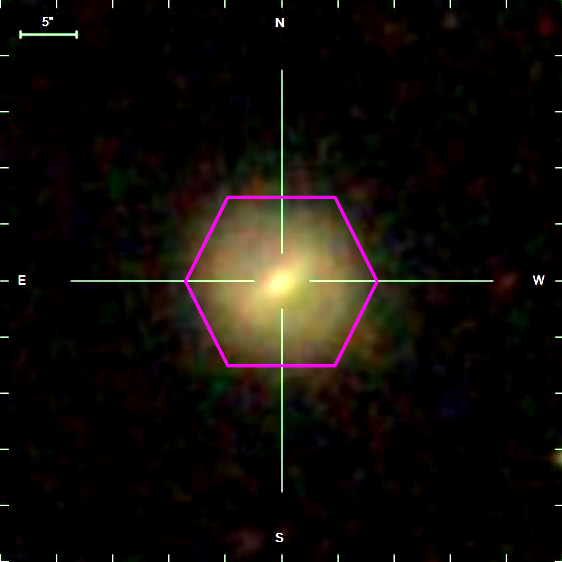
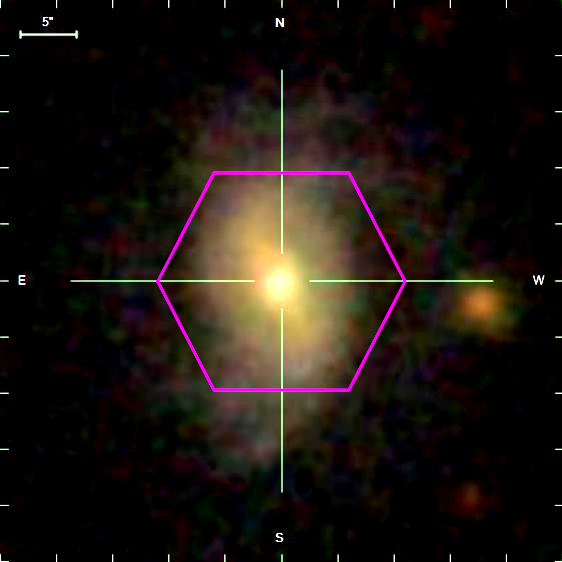
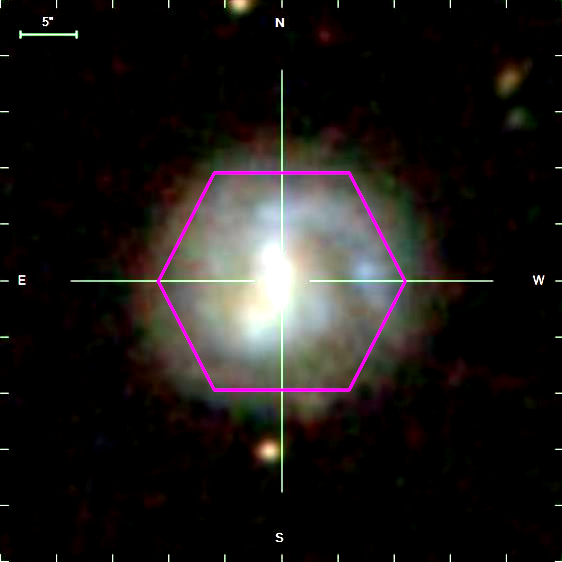
where represents the probability of a particular galaxy type. For barred galaxies we employed criteria (1), (2), (3), and (4) to select a total number of 356 barred galaxies. For unbarred galaxies we employed criteria (1), (2), (3), and (5) to make a total of 1180 unbarred galaxies. The samples of MaNGA images for barred galaxies are shown in Fig. 1 and unbarred galaxies in Fig. 2.
II.3 Galaxy environment
The Galaxy Environment for MaNGA Value Added Catalogue (GEMA-VAC) [49], was used to quantify the barred and unbarred galaxies’ environment. This volume-limited value-added catalogue contains environmental quantification for several MaNGA galaxies, based on the methods described in Refs. [45, 50, 51]. We use the information provided in the GEMA-VAC at which the galaxies are assigned in groups using a halo-based group finder by Ref. [52]. The galaxies which are alone in the group (Group size (GS) ) are named as the field and the galaxies with at least one neighbour in the group (Group size (GS) ) are named group galaxies. With these conditions applied to barred and unbarred pre-defined criteria a total number of (4) and 198 () field and group barred galaxies were obtained. Furthermore, a total number of () and () field and group unbarred galaxies were obtained. These samples are used in the next sections to compare the M, SFR, colour, and gas phase metallicity between field and group environments.
The parameter distributions from our sample were compared using the Anderson–Darling two-sample statistical test [53, 54, 55] by taking the null hypothesis that all field and group samples originate from the same population [55]. The Anderson–Darling statistical test is preferred due to its more sensitive statistical results [56]. In principle, if field and group samples do not reject the null hypothesis, this indicates that our field and group samples are galaxies with the same population, so there is no dependency on the environment. The approach is outlined in Ref. [57], which processes IFS data cubes to extract spectroscopic properties that were used to obtain the galaxy physical properties used in this work. In addition to the parameters obtained from pyPipe3D [57], a set of photometric structure features can also be obtained directly from the MaNGA data cube such as broadband photometry in the B, V, R and u, g, r, i filters. Filter parameters were used from Ref. [58], which employed the Vega photometric system that redshifted to the rest frame of each object.
III Results
III.1 Galaxy properties
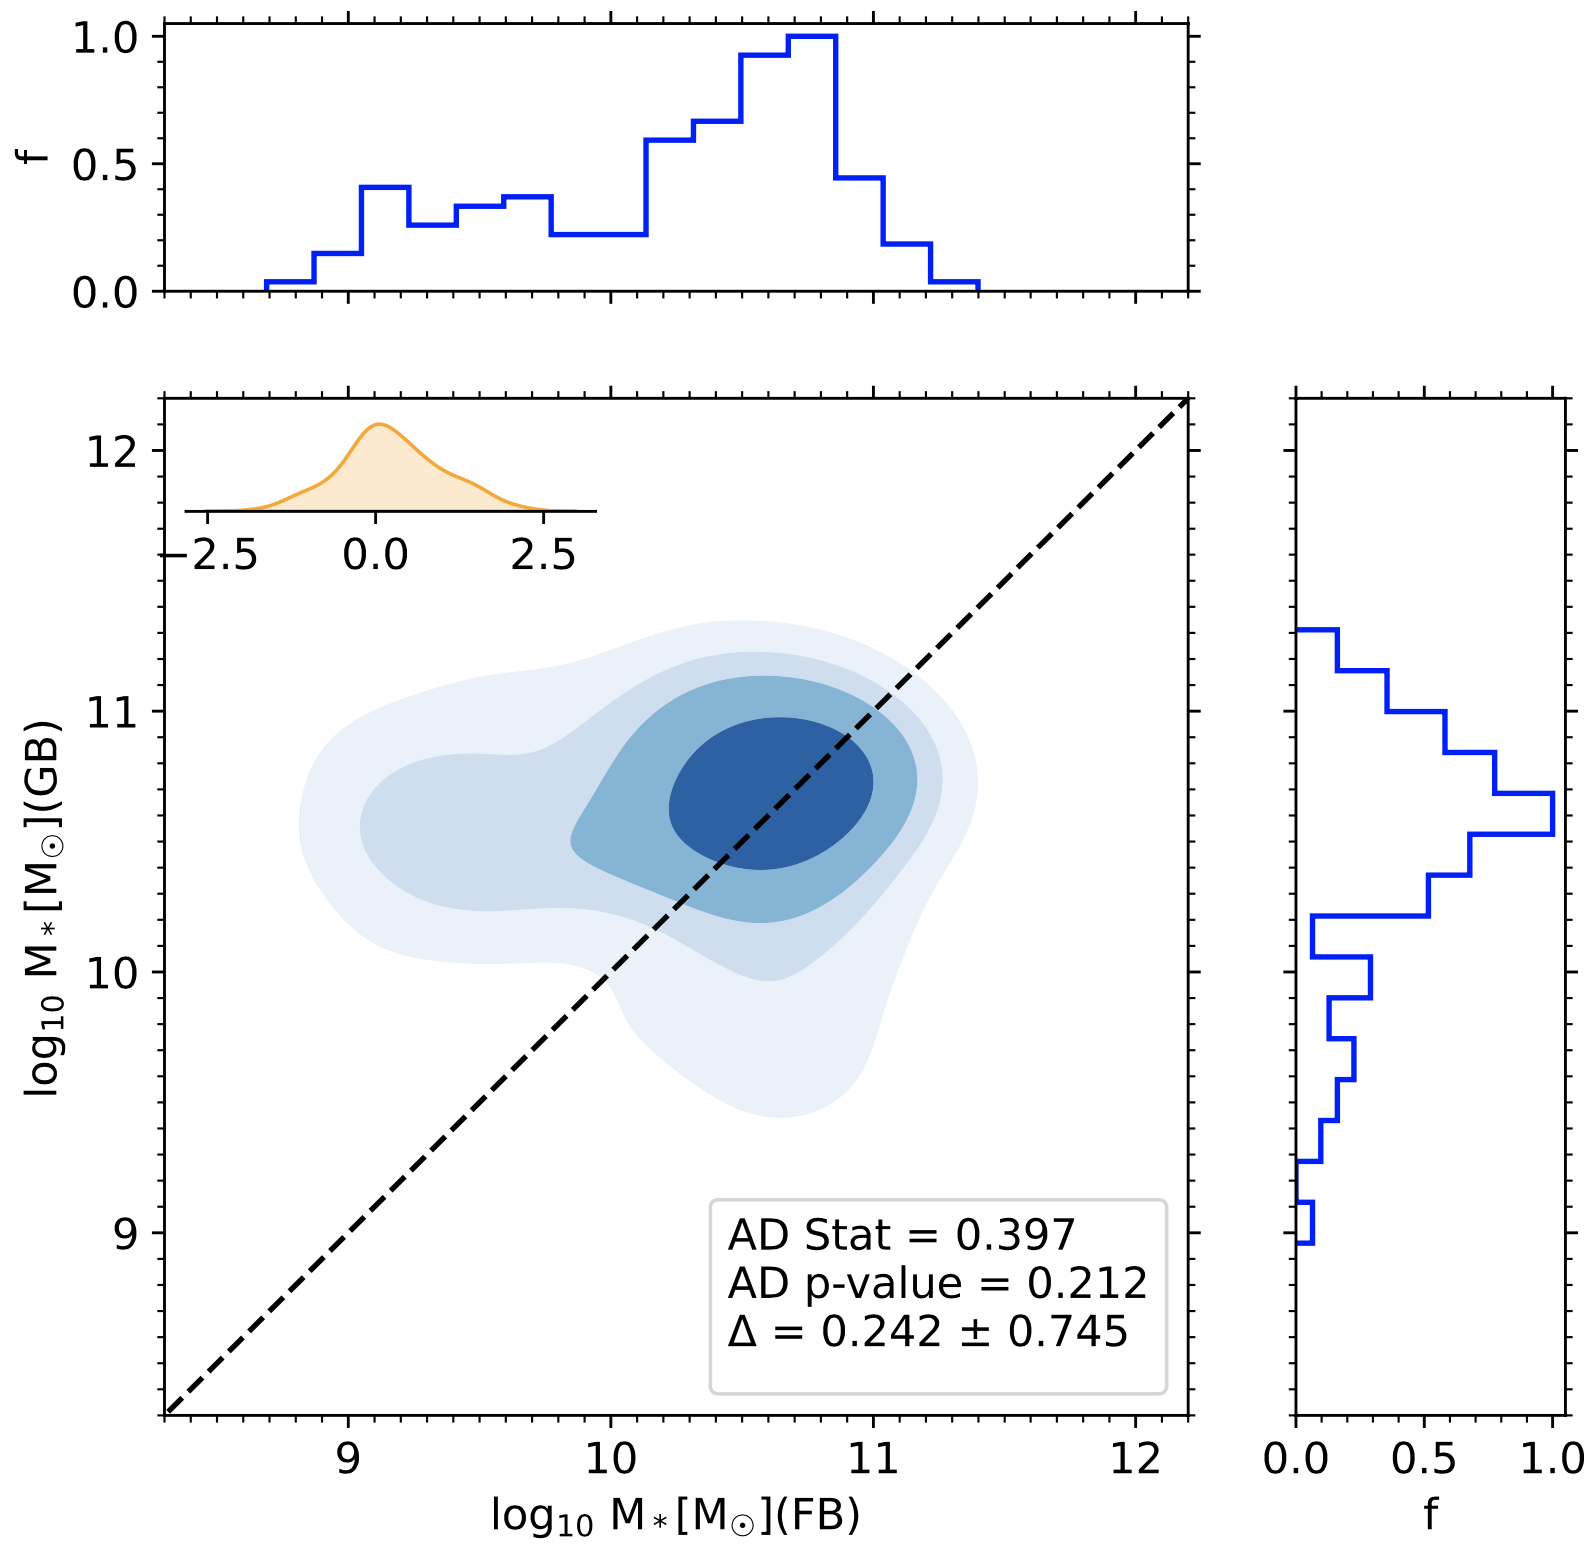
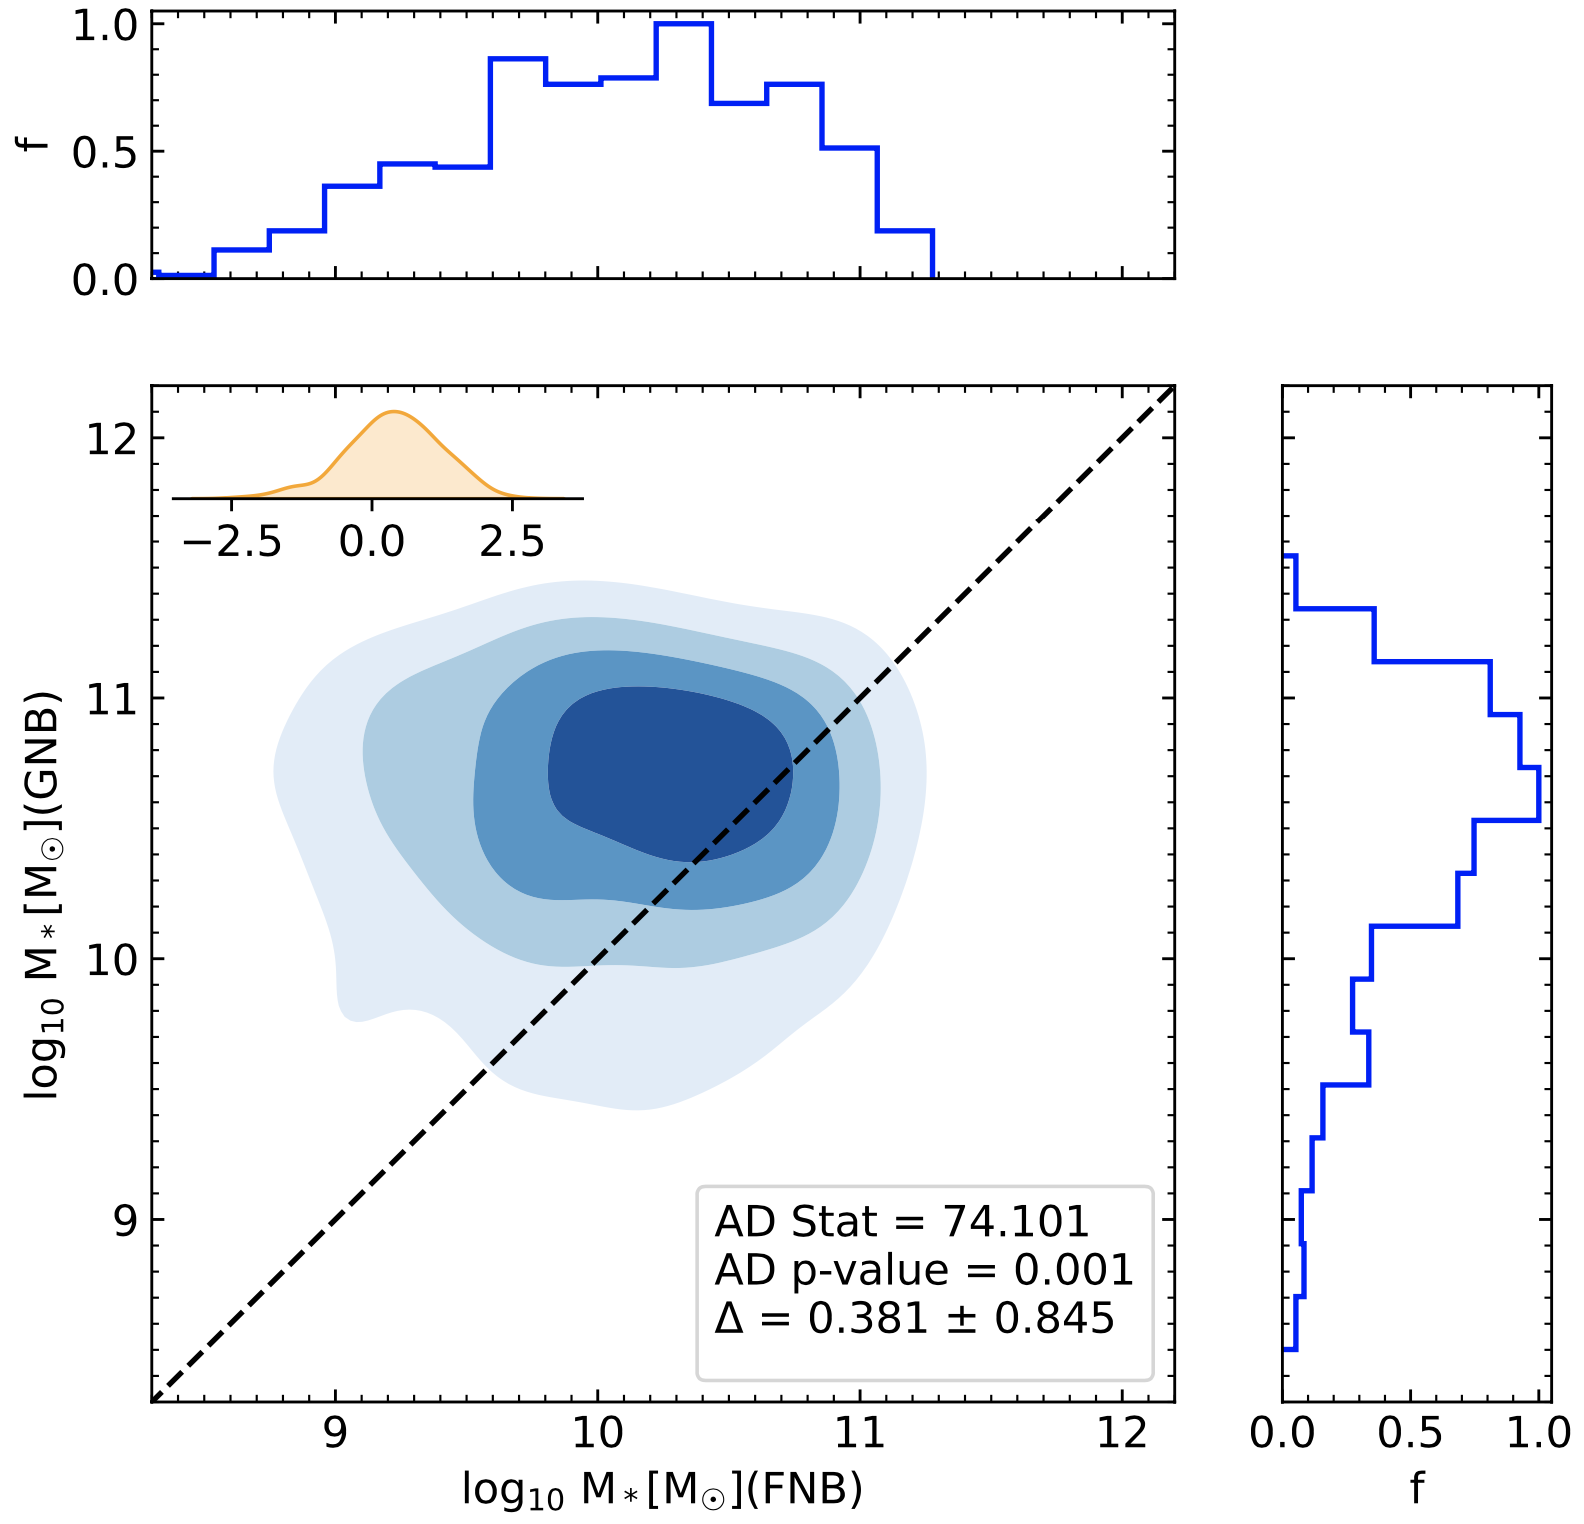
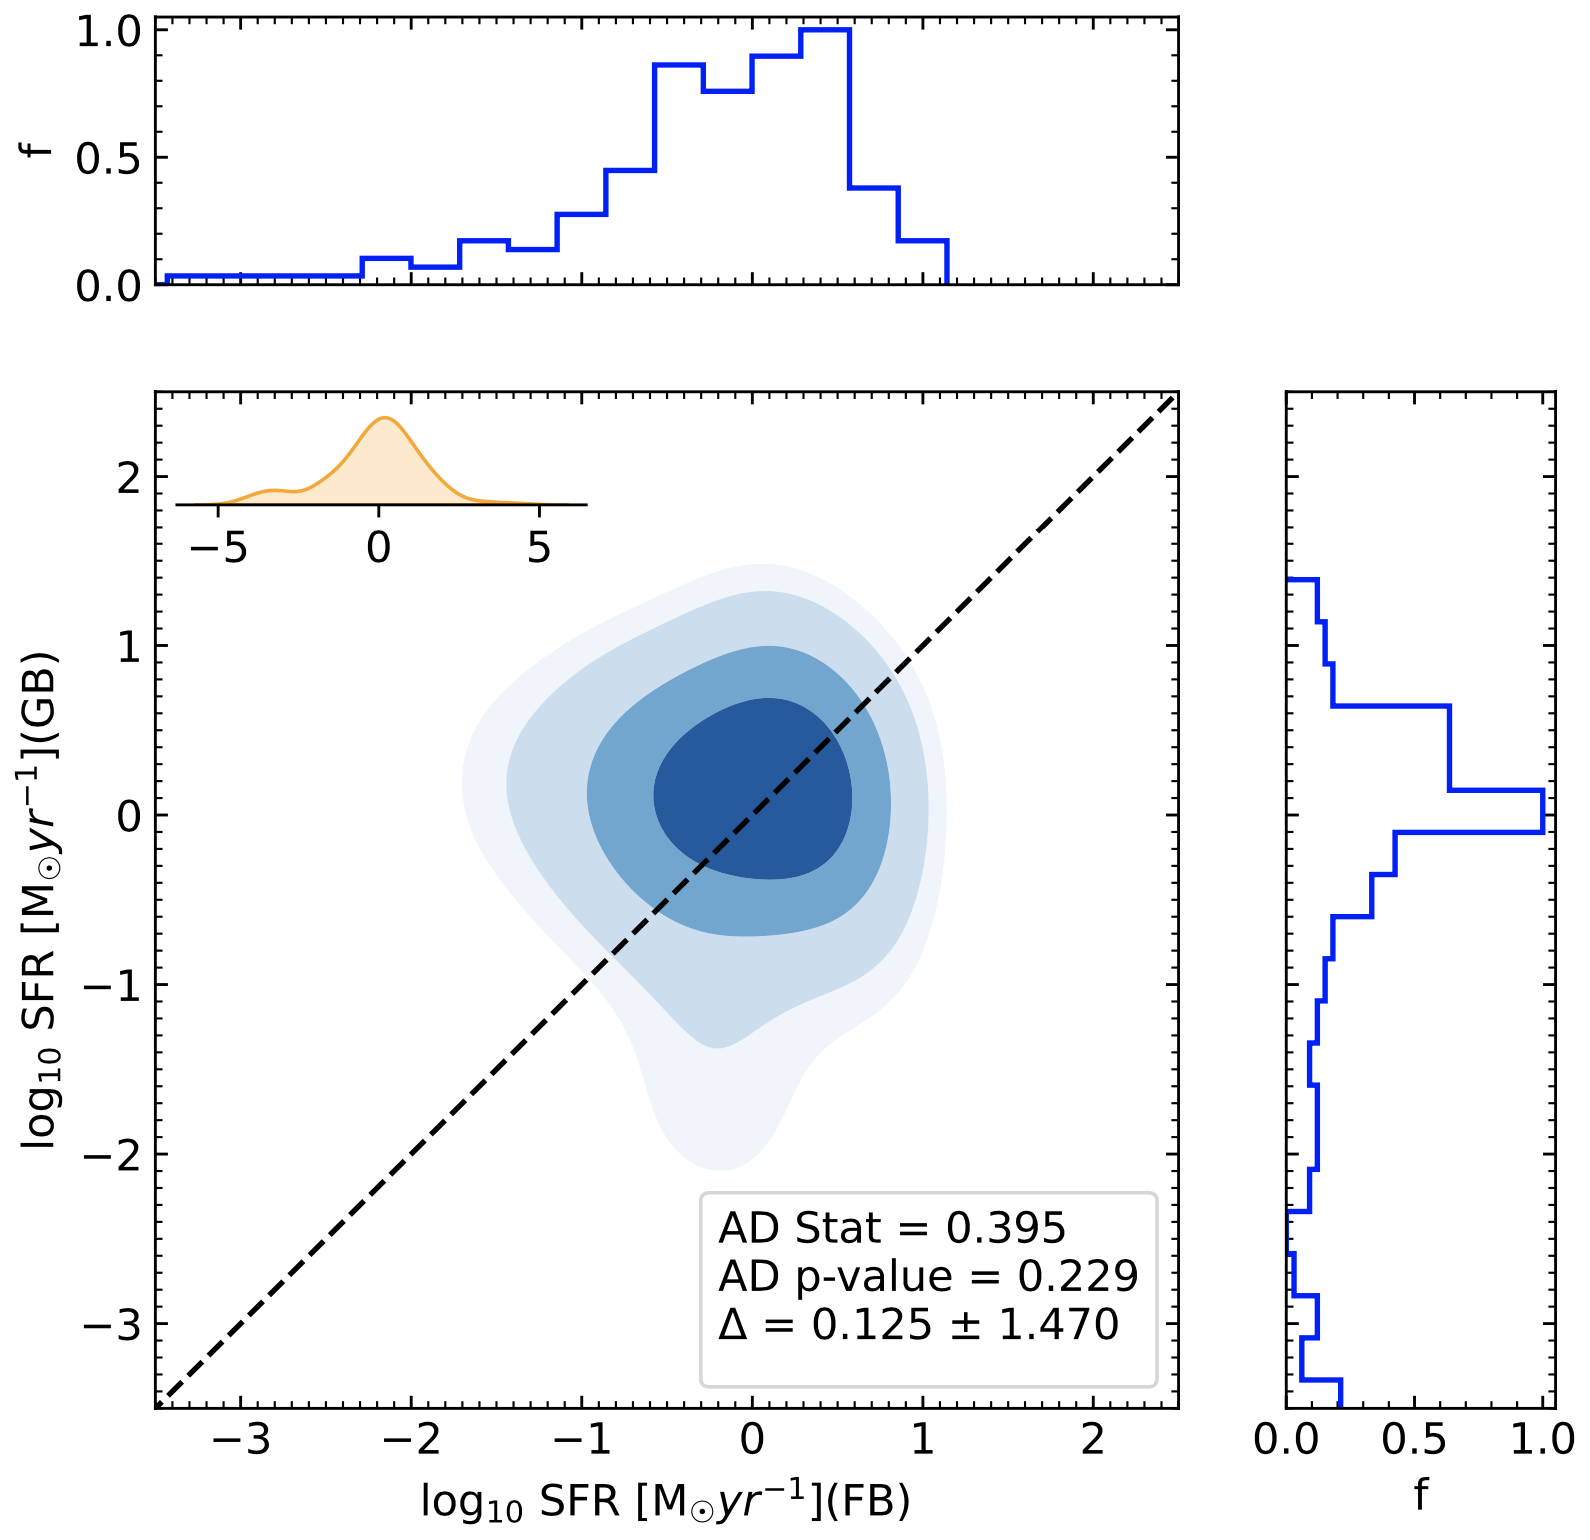
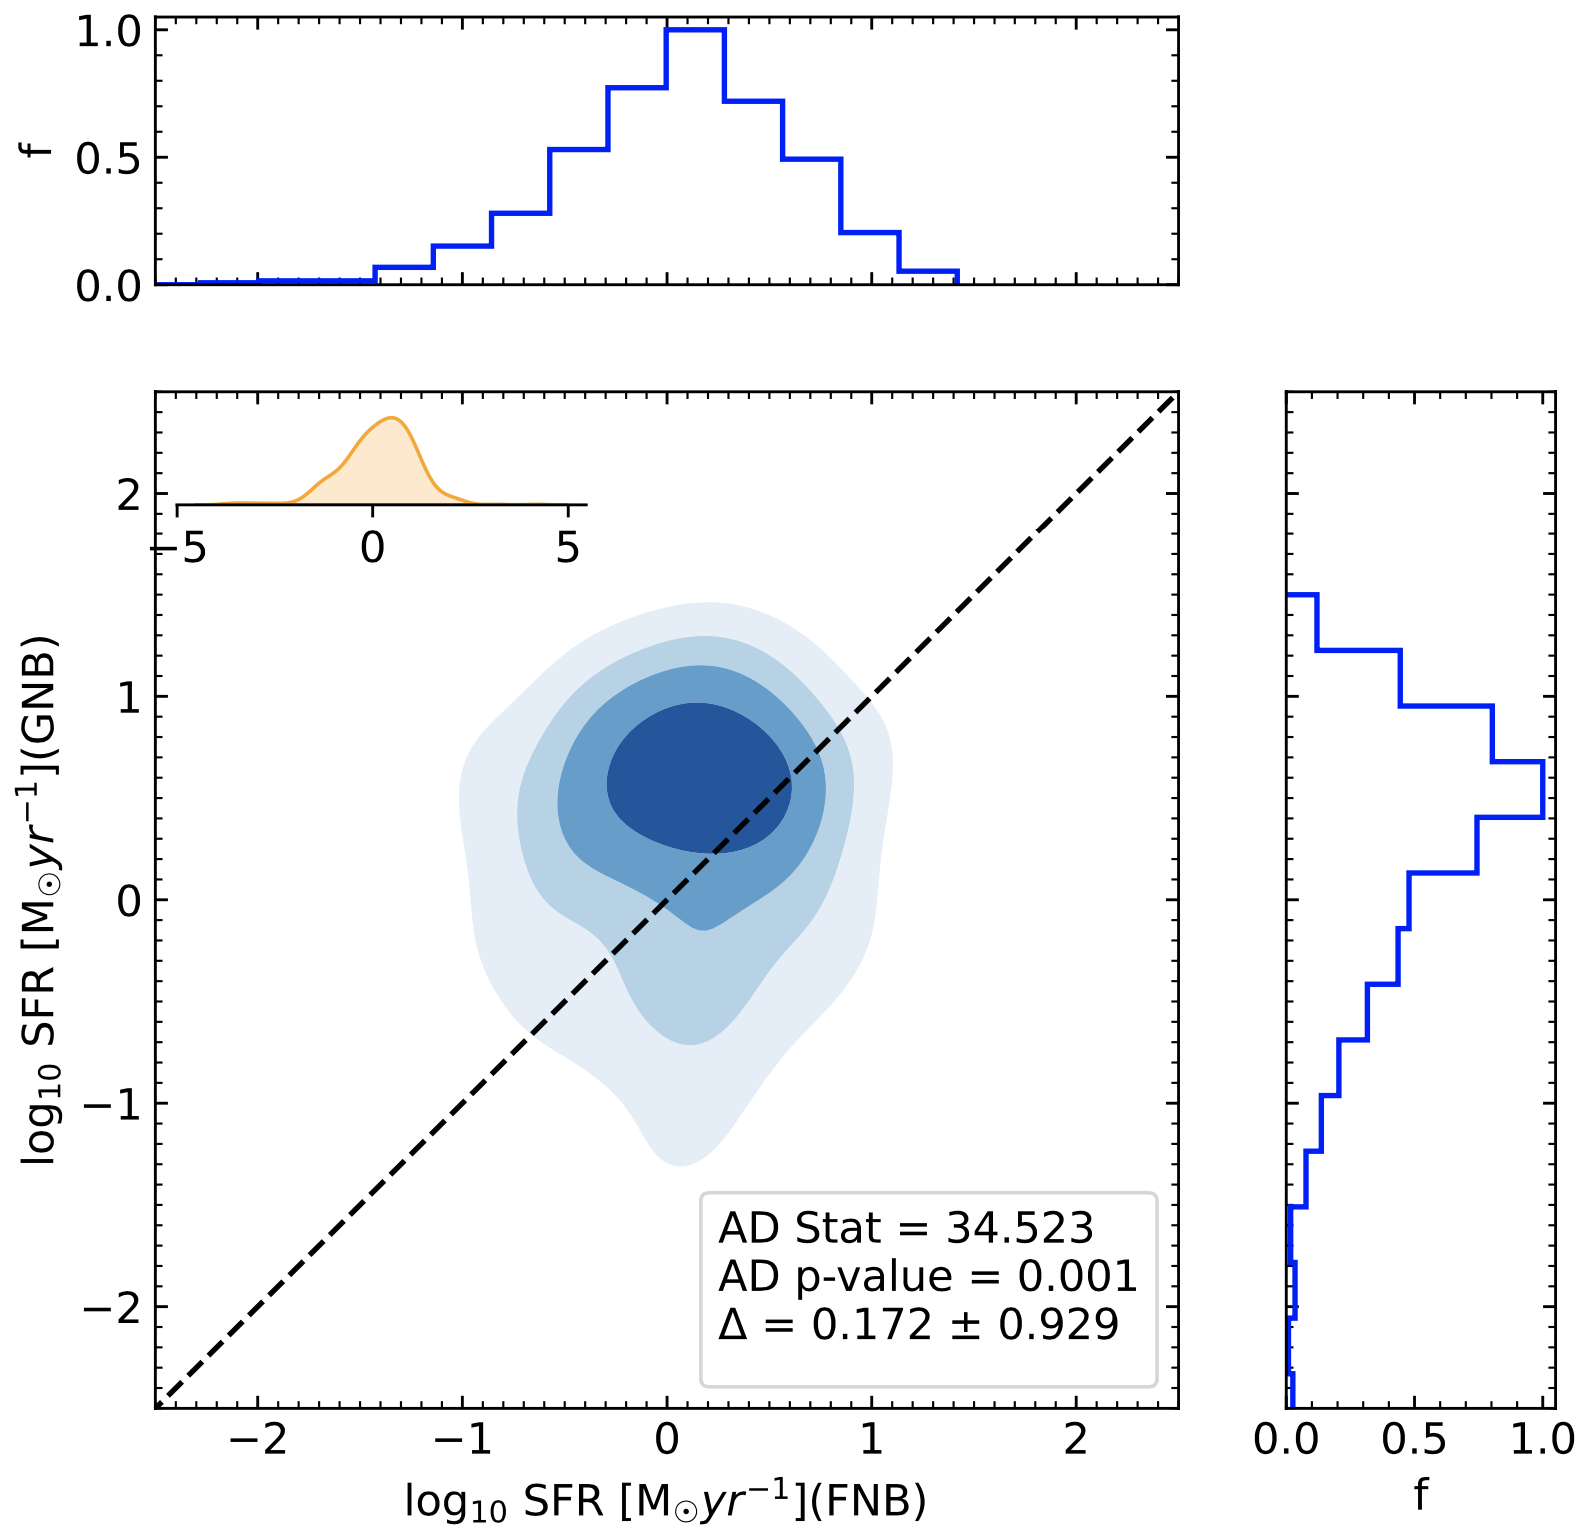
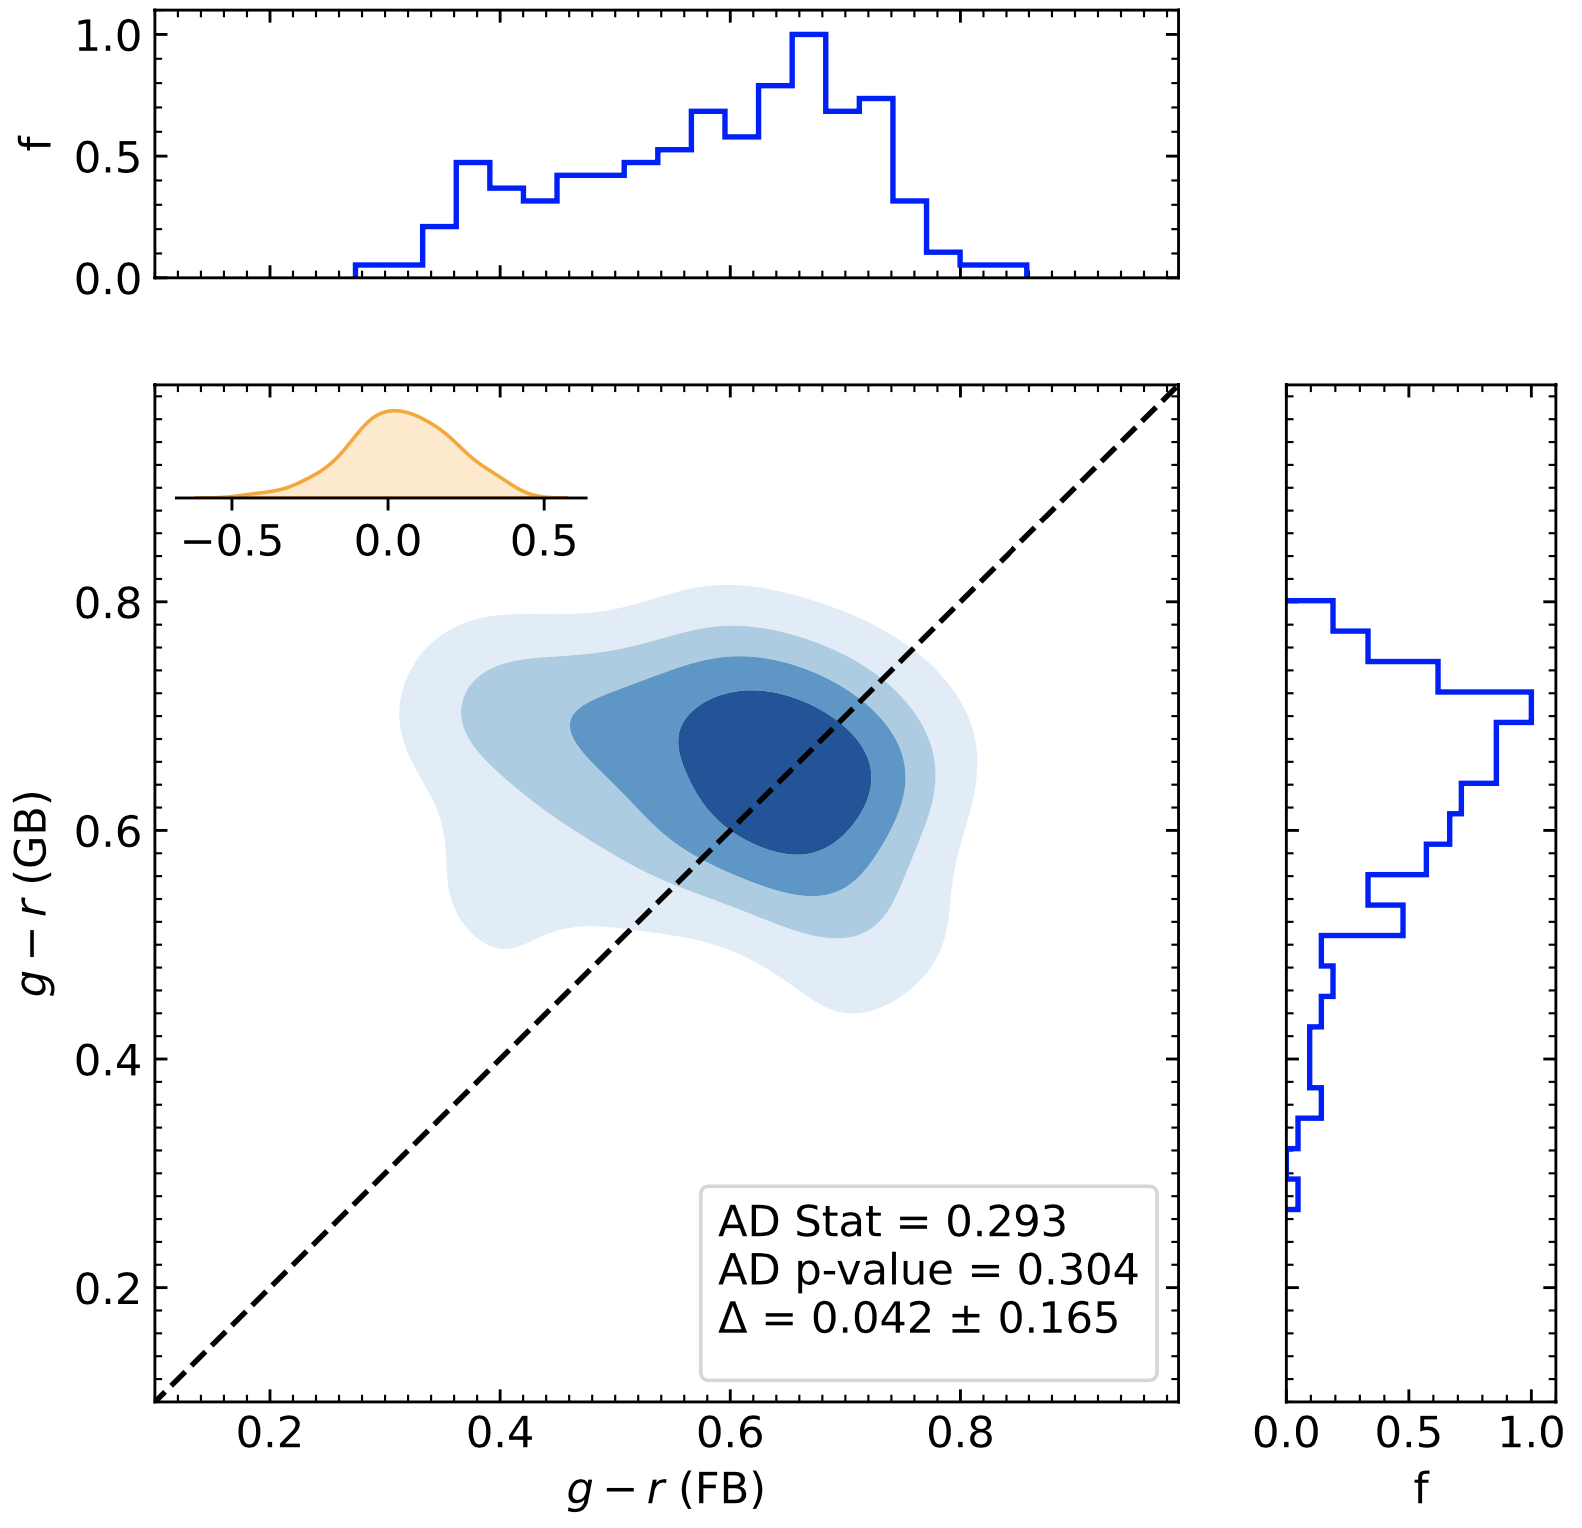
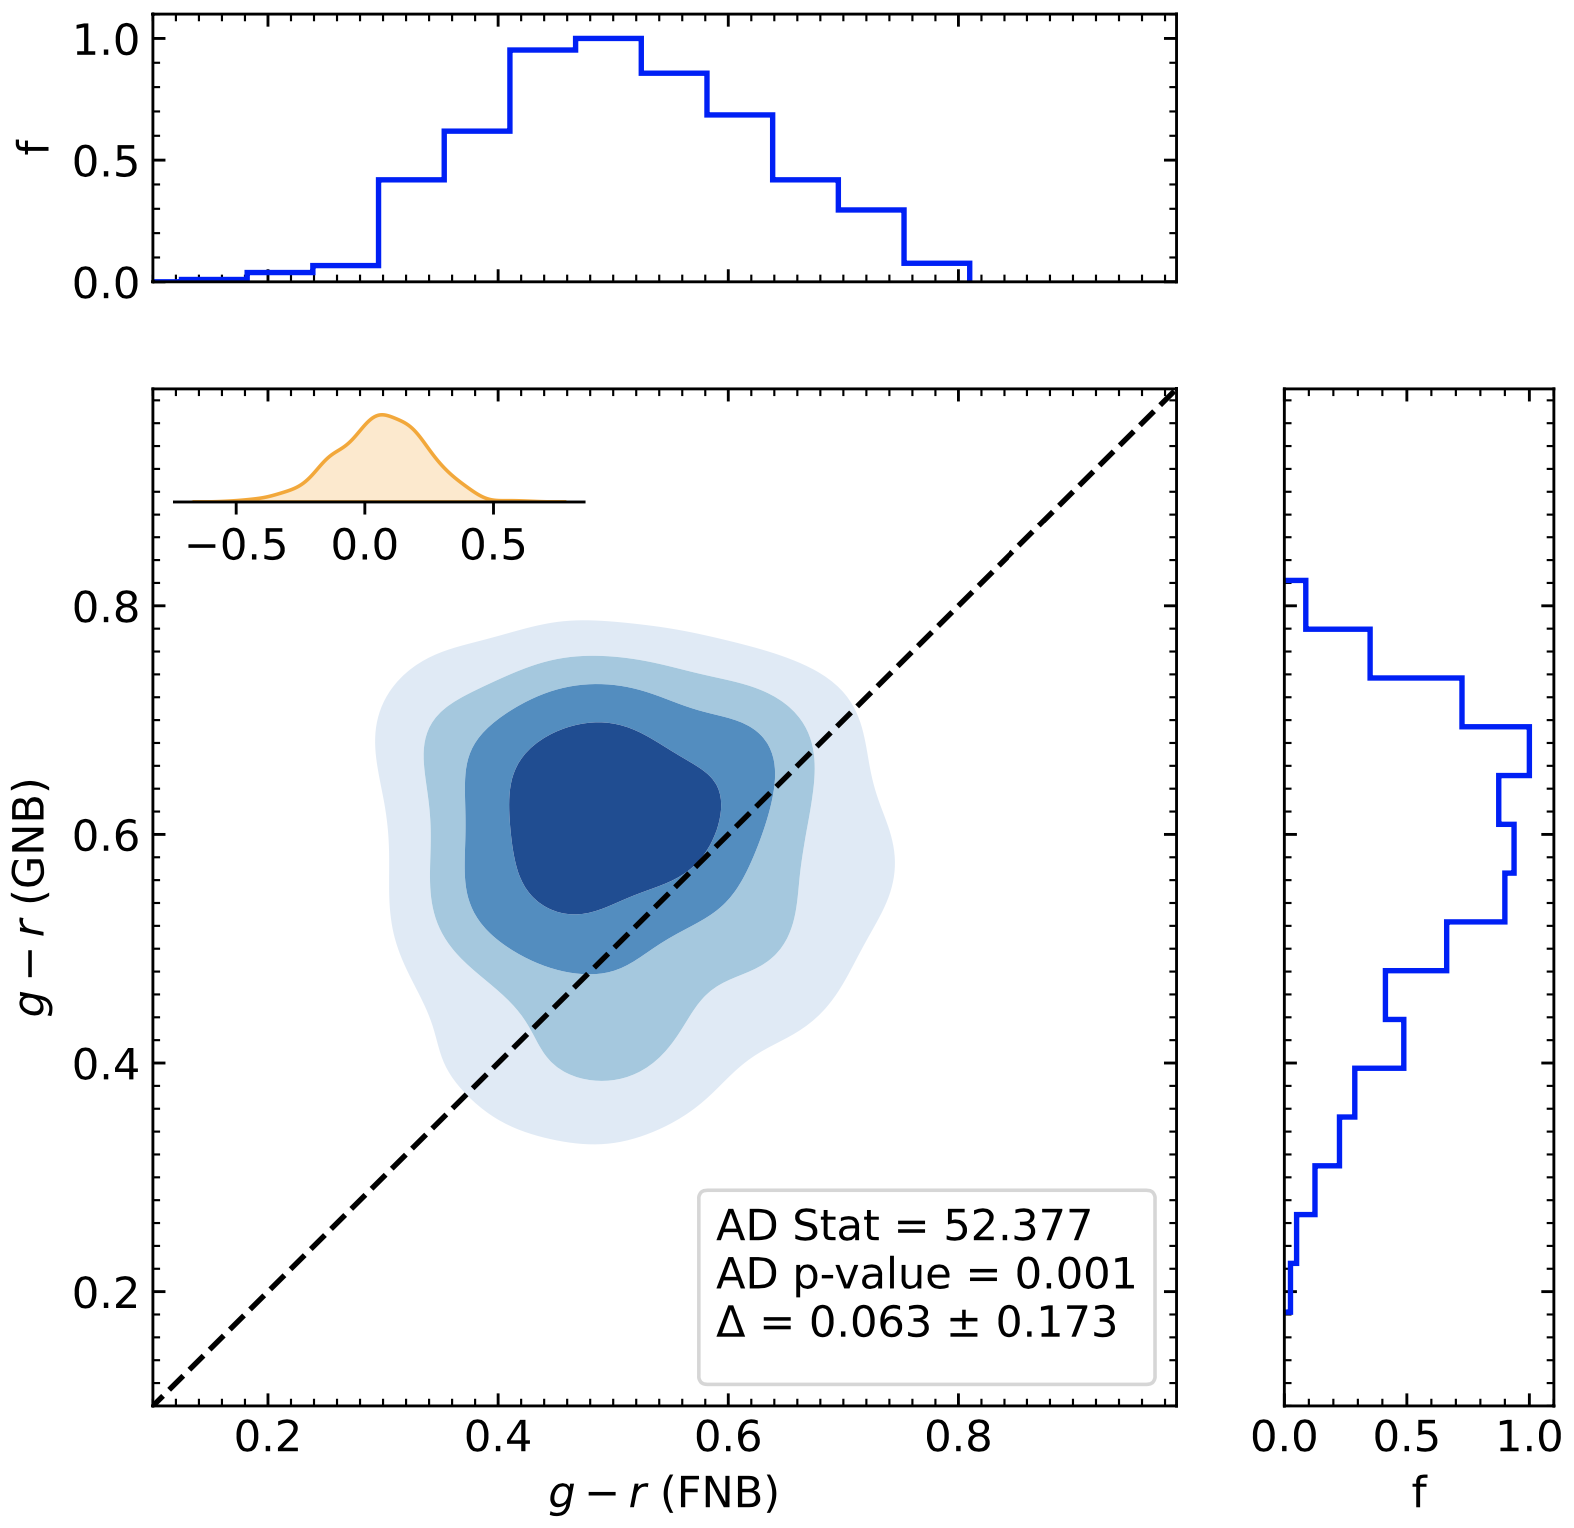
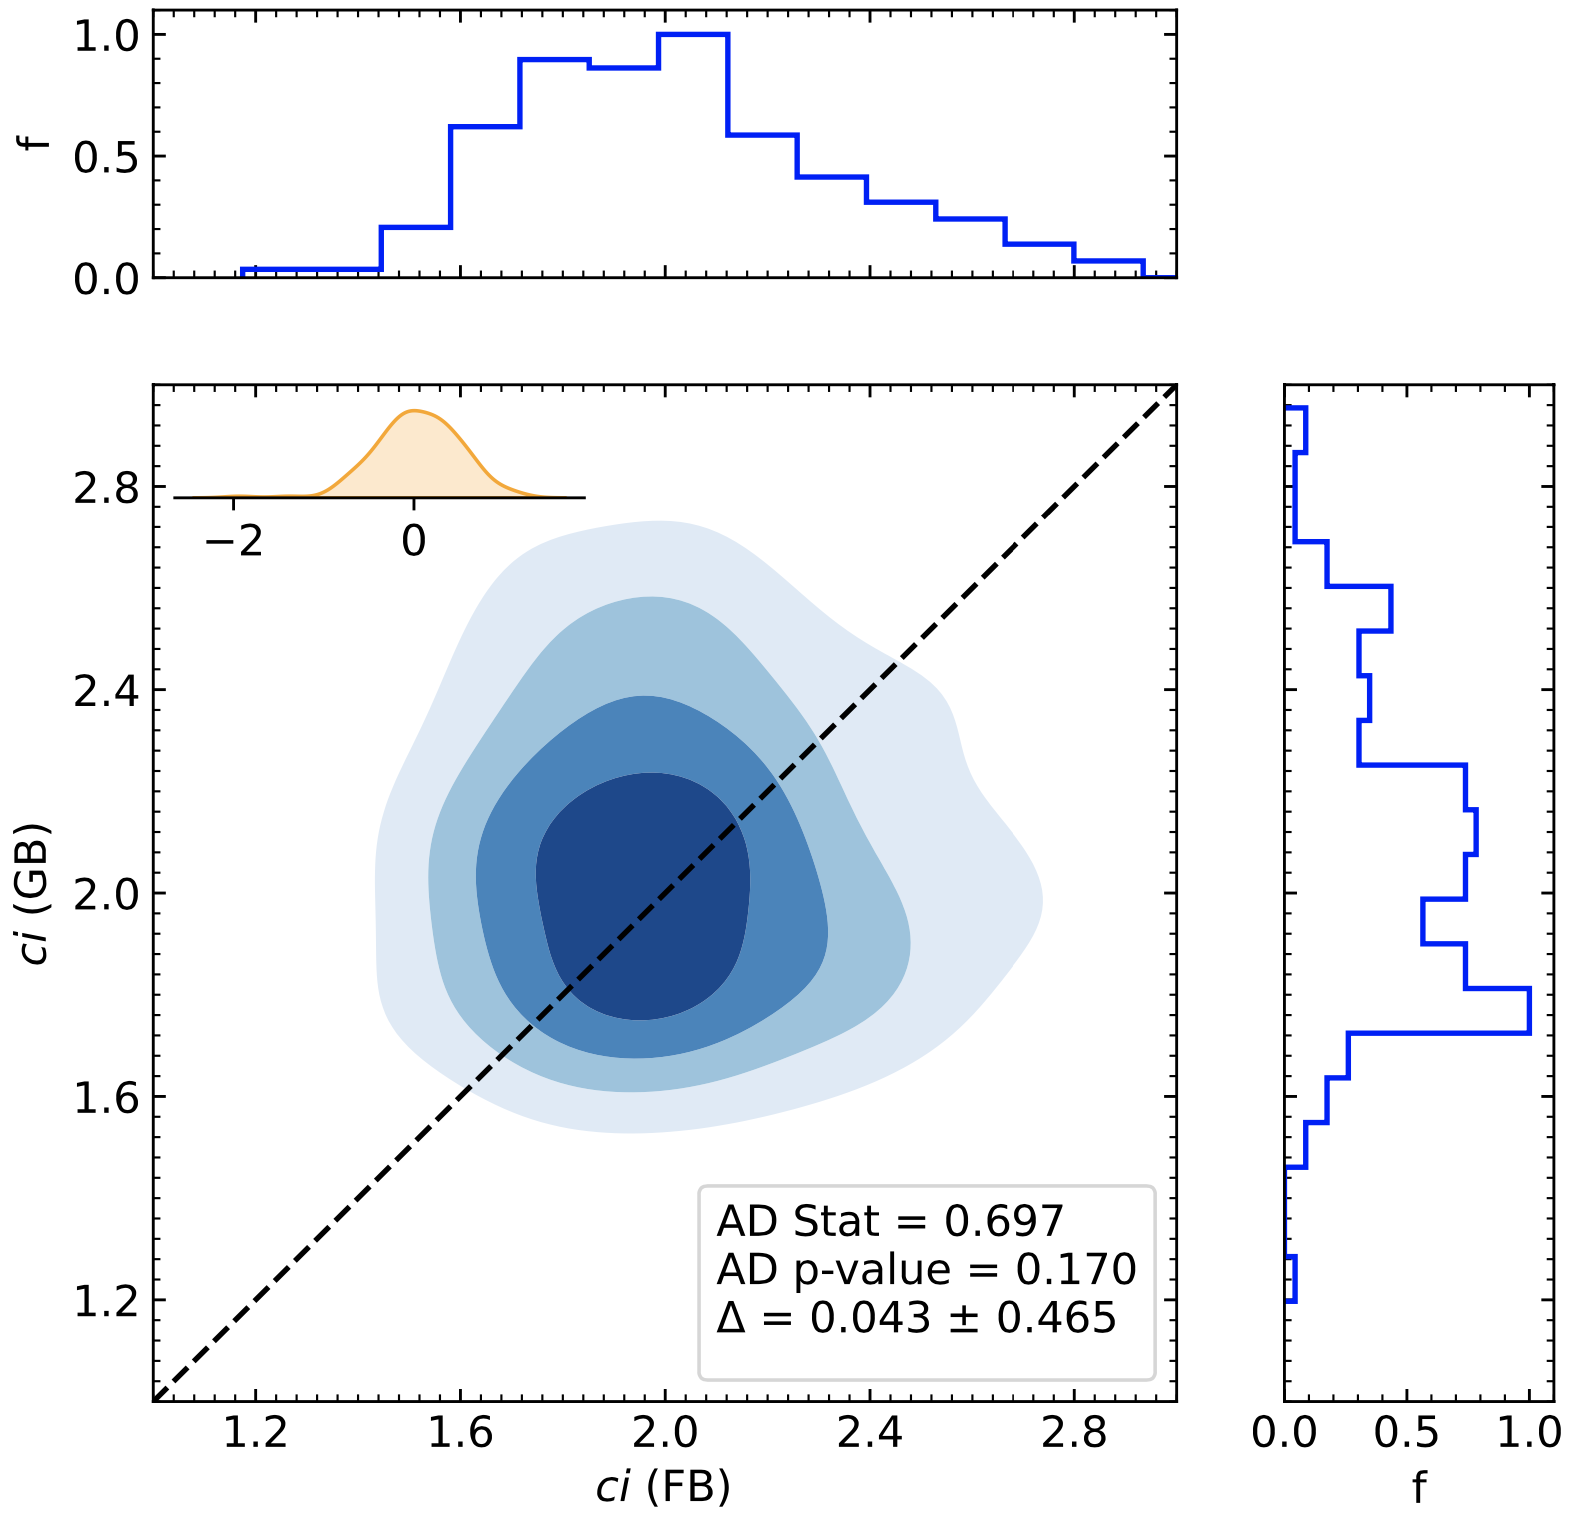
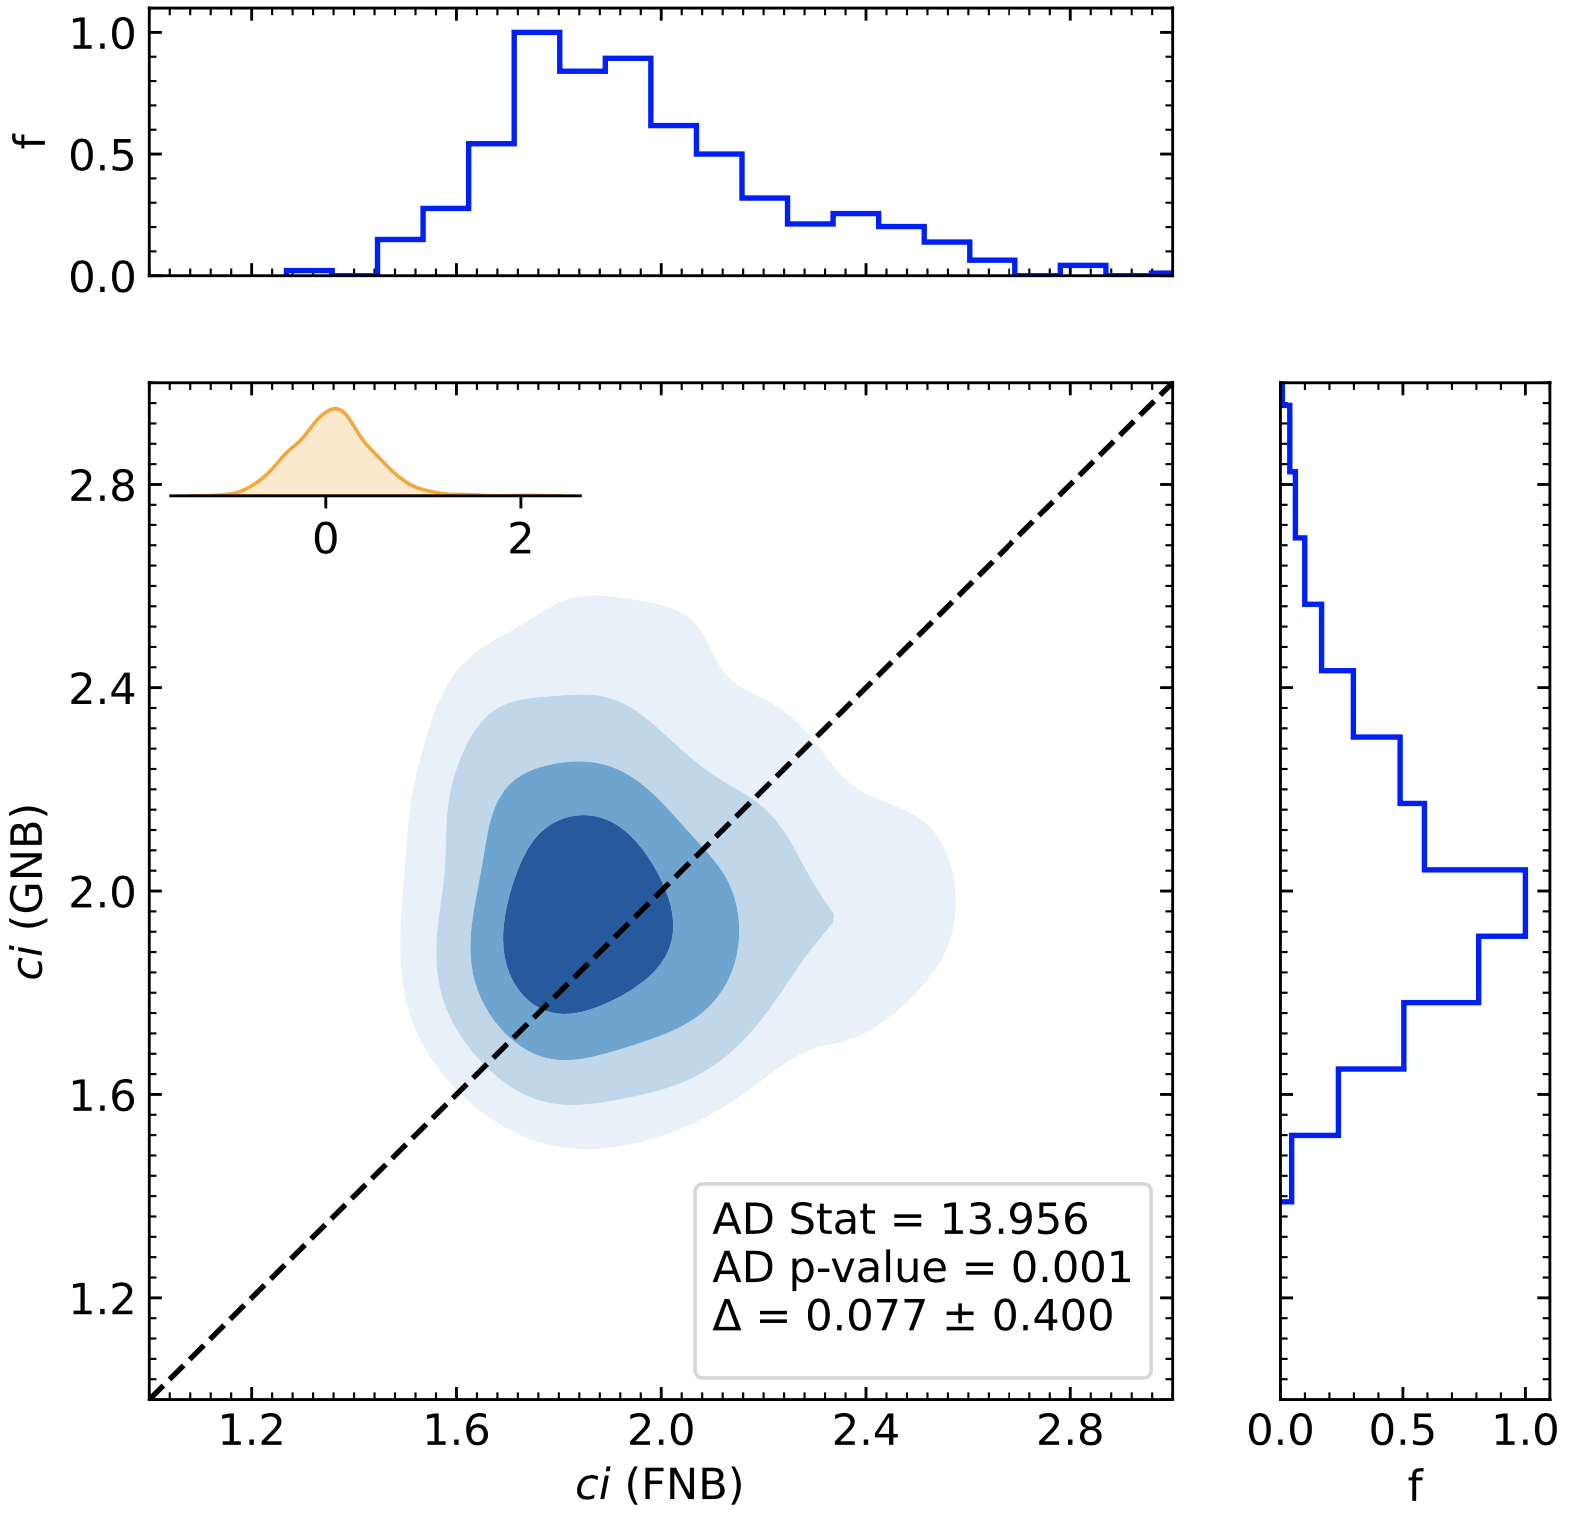
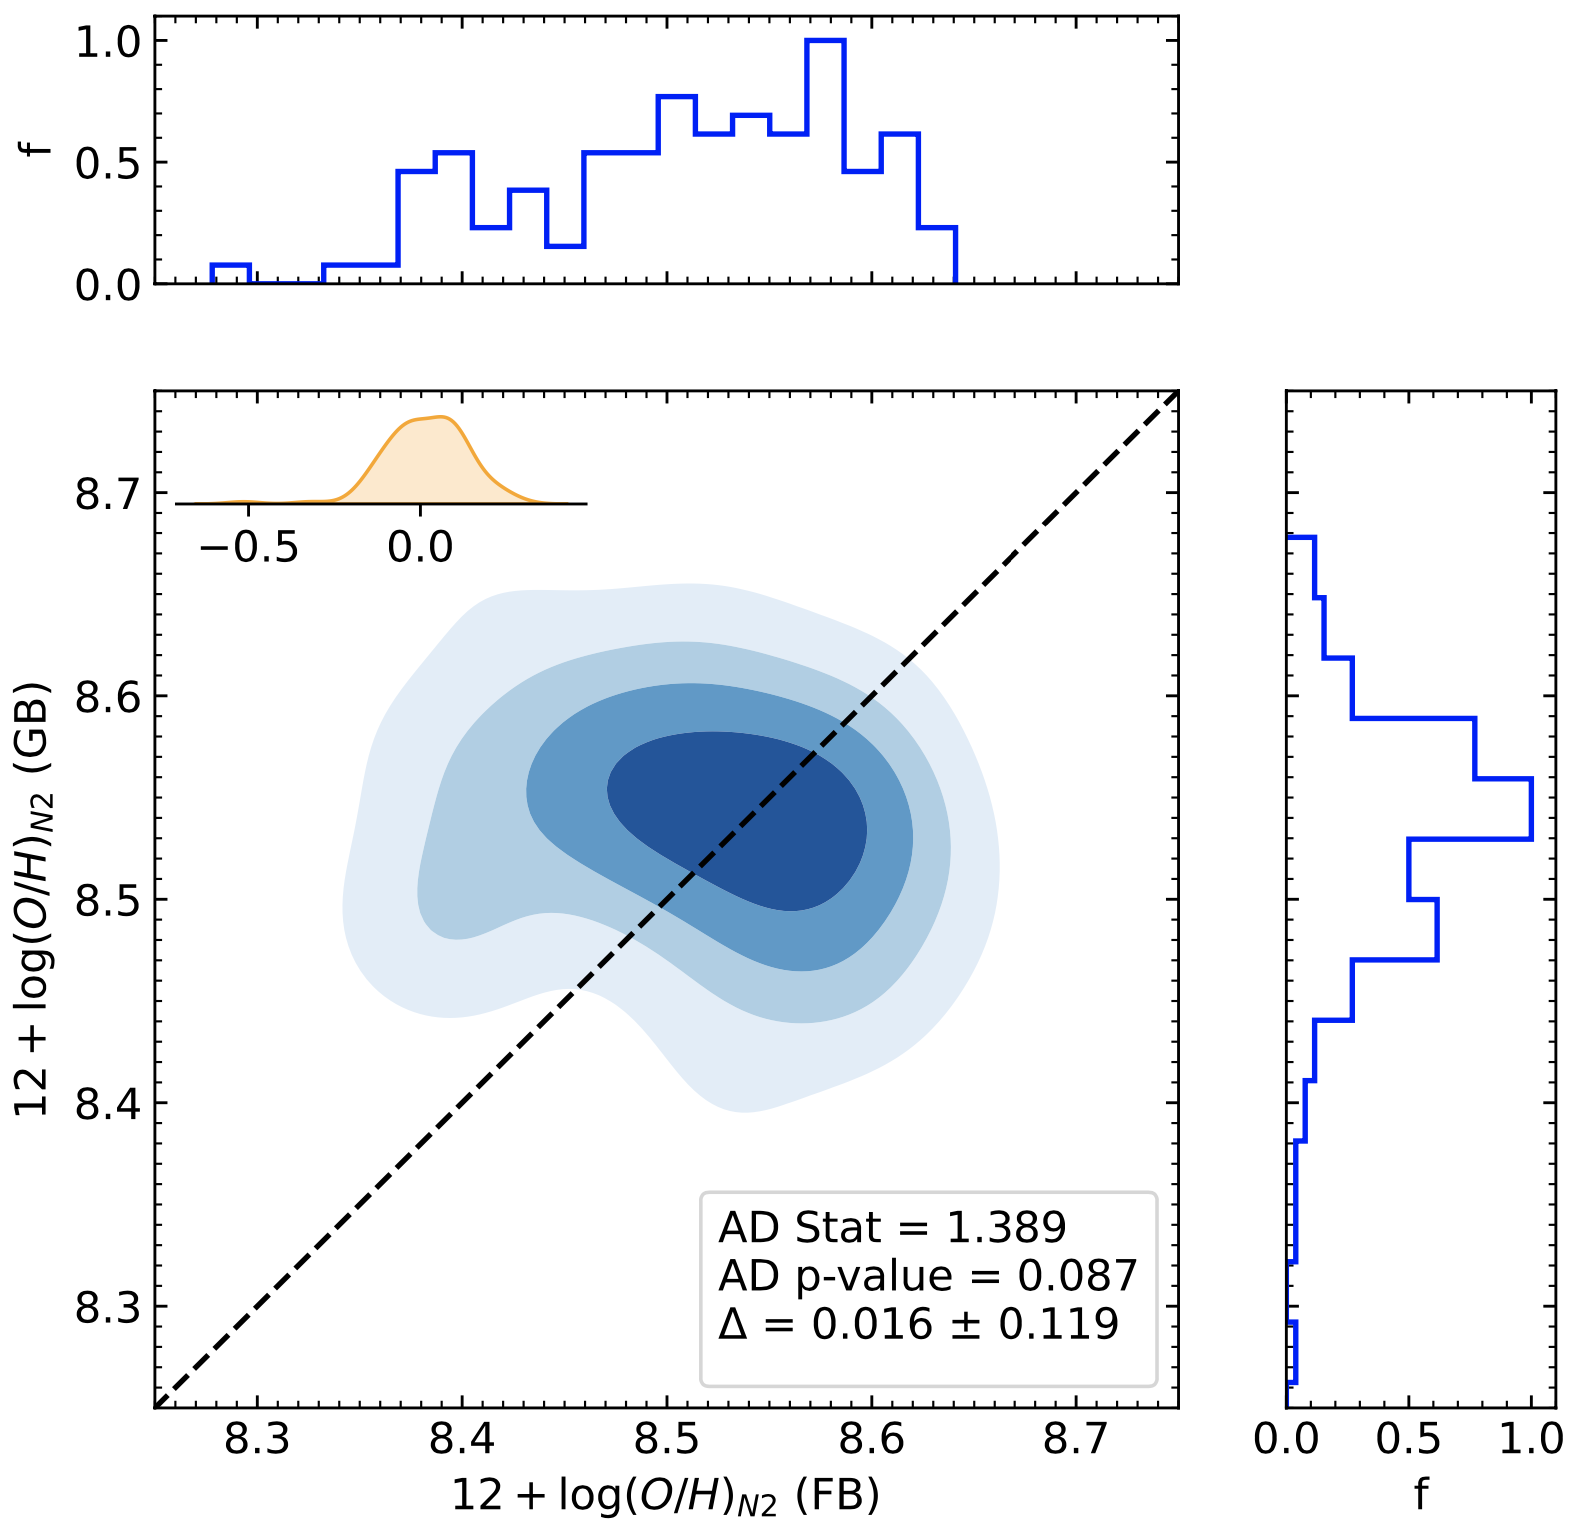
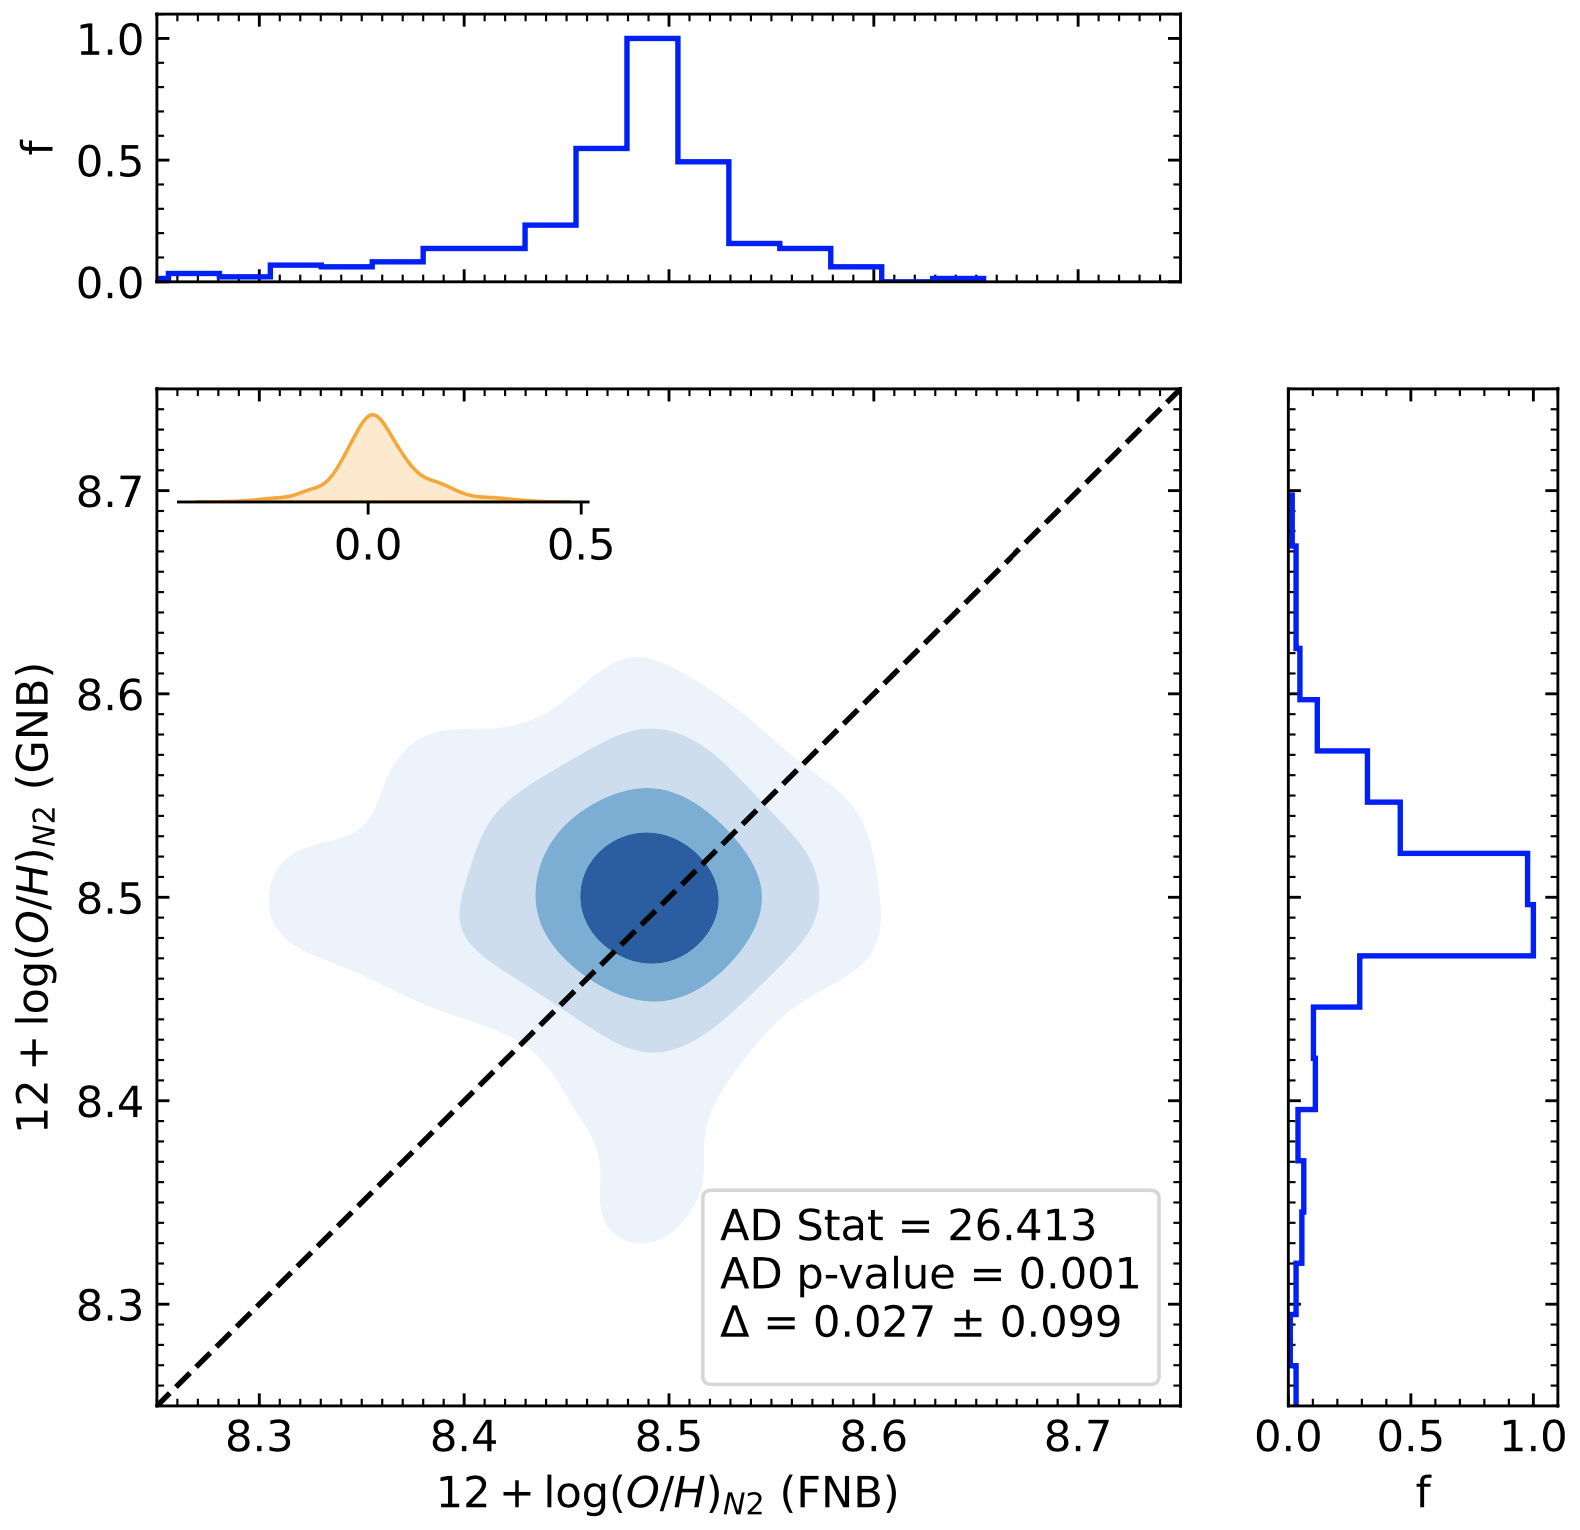
In this section, we compare the selected properties between field and group galaxies obtained from the MaNGA survey for barred and unbarred galaxies as the tracer of the influence of bars on the environmental dependence of galaxy properties. Comparison of sets of physical properties of barred (left panel) and unbarred (right panel) galaxies are shown in Figs. 3, 4, 5, 6, and 7. Each panel shows the density distribution as a set of contours filled in field and group parameter maps. Each successive line encloses the points of , , and , respectively. A one-to-one relationship is indicated by the black dotted line, while the density distribution of the difference for two datasets of the particular parameters is shown by the upper left inset. The side panels show the normalised distributions for each sample where represent the normalized frequency. The Anderson-Darling p-value, the Anderson-Darling statistic, and the mean difference () with its corresponding dispersion are observed in the shown legend in each panel of all figures for the selected properties.
The galaxys’ M was estimated using photometry by means of the relation obtained from Ref. [59]. Valid for the Ref. [60] the initial mass function is given by equation,
| (6) |
where is the photometry M in solar mass unit, while the is colour index and is the band absolute magnitude.
The star formation rate used in this study is derived from the dust-corrected H luminosity () by employing equation,
| (7) |
The relationship was proposed by Ref. [61] for Ref. [62]’s initial mass function. This SFR is the upper limit because in this derivation all the H fluxes are summed up regardless of the detected ionization nature. This means that this calculation yields SFR even in non-ionising galaxies that can be directly related to recent star formation events [63, 65, 64].
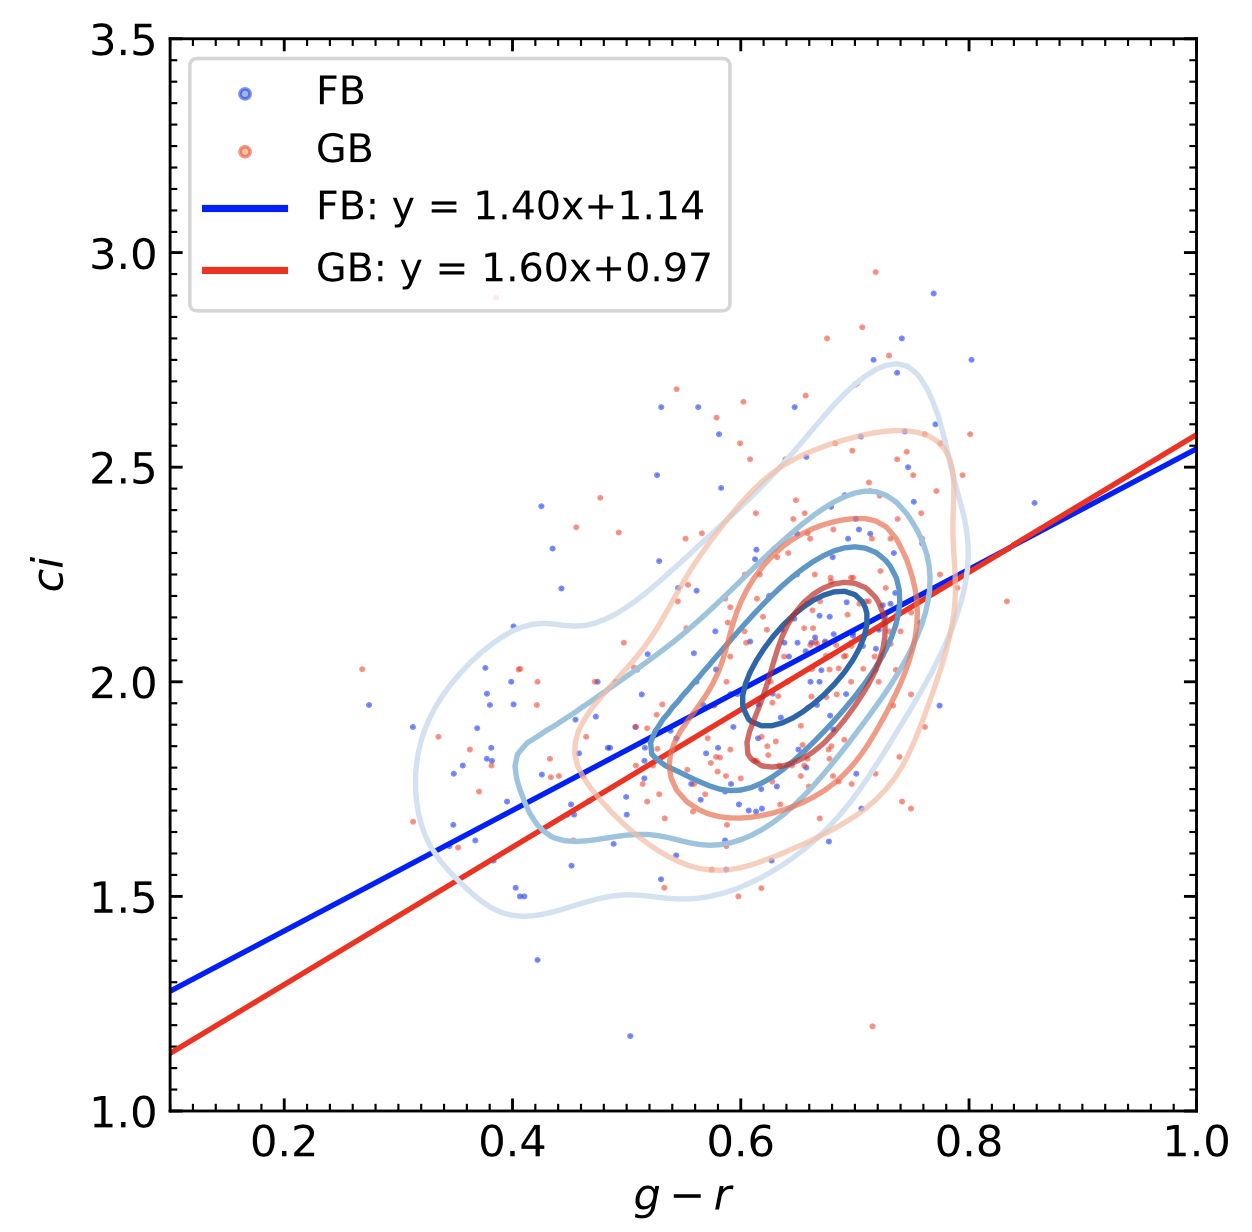
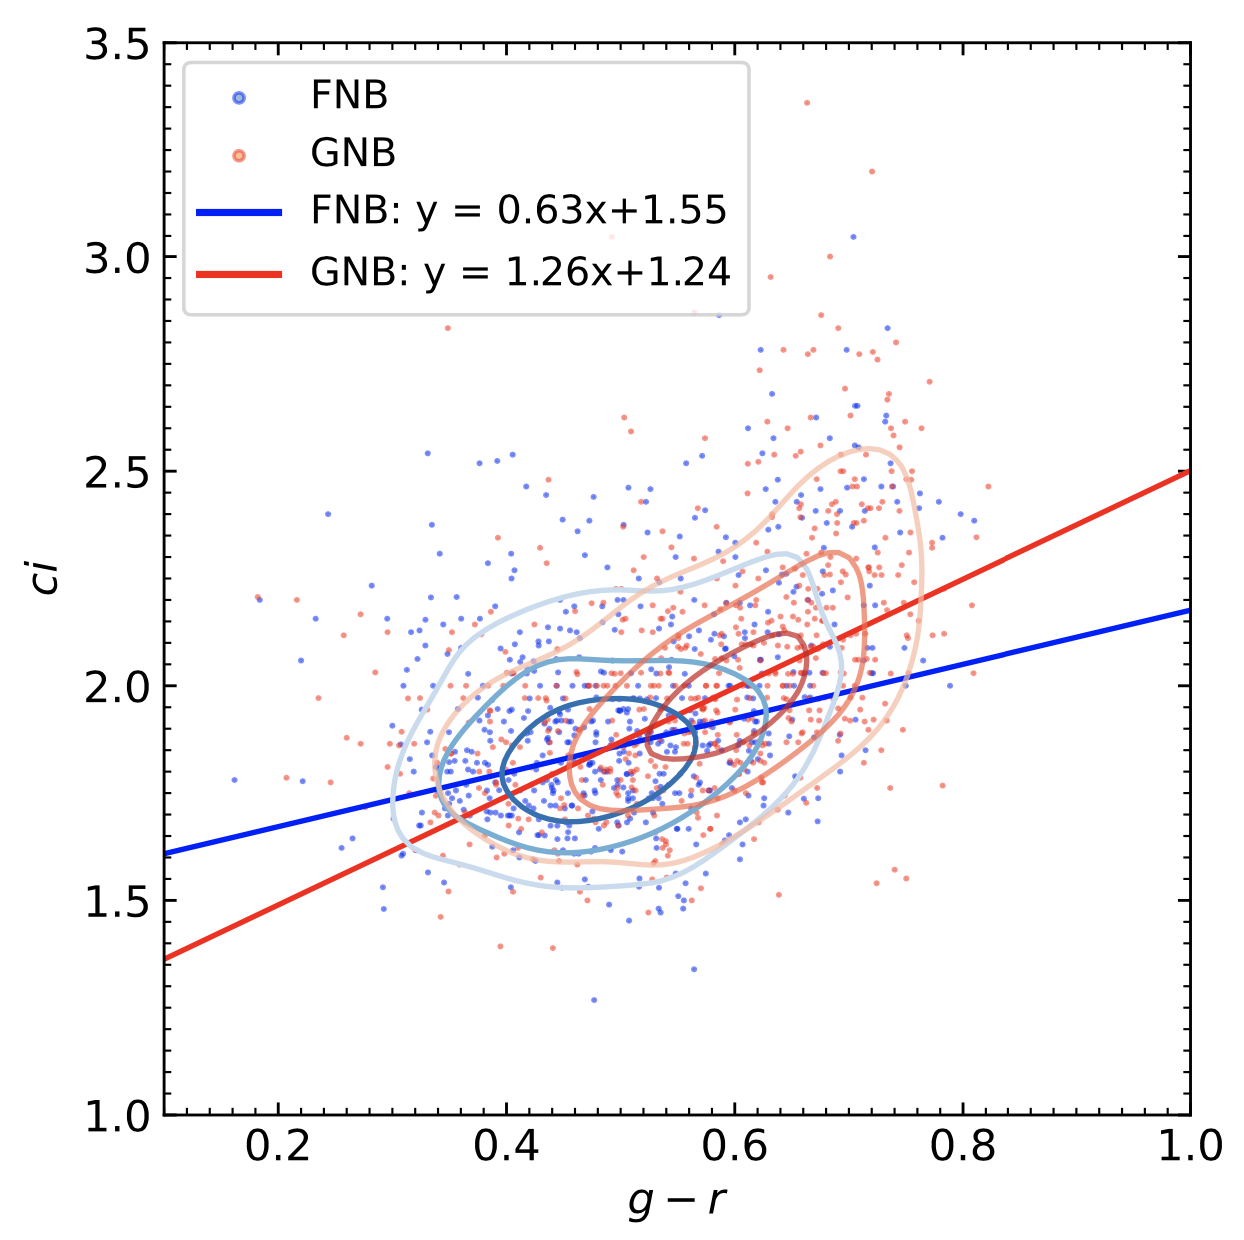
The colour was extracted from the NSA catalogue obtained following the procedures outlined in Ref. [57]. We used to represent the radius around and to represent the radius around of the Petrosian flux, respectively. We then calculated the structural parameter, the r-band concentration index as the ratio between the two radii given by . The two subsamples’ distributions for colour and in a group and field environment are shown in Figs. 5 and 6.
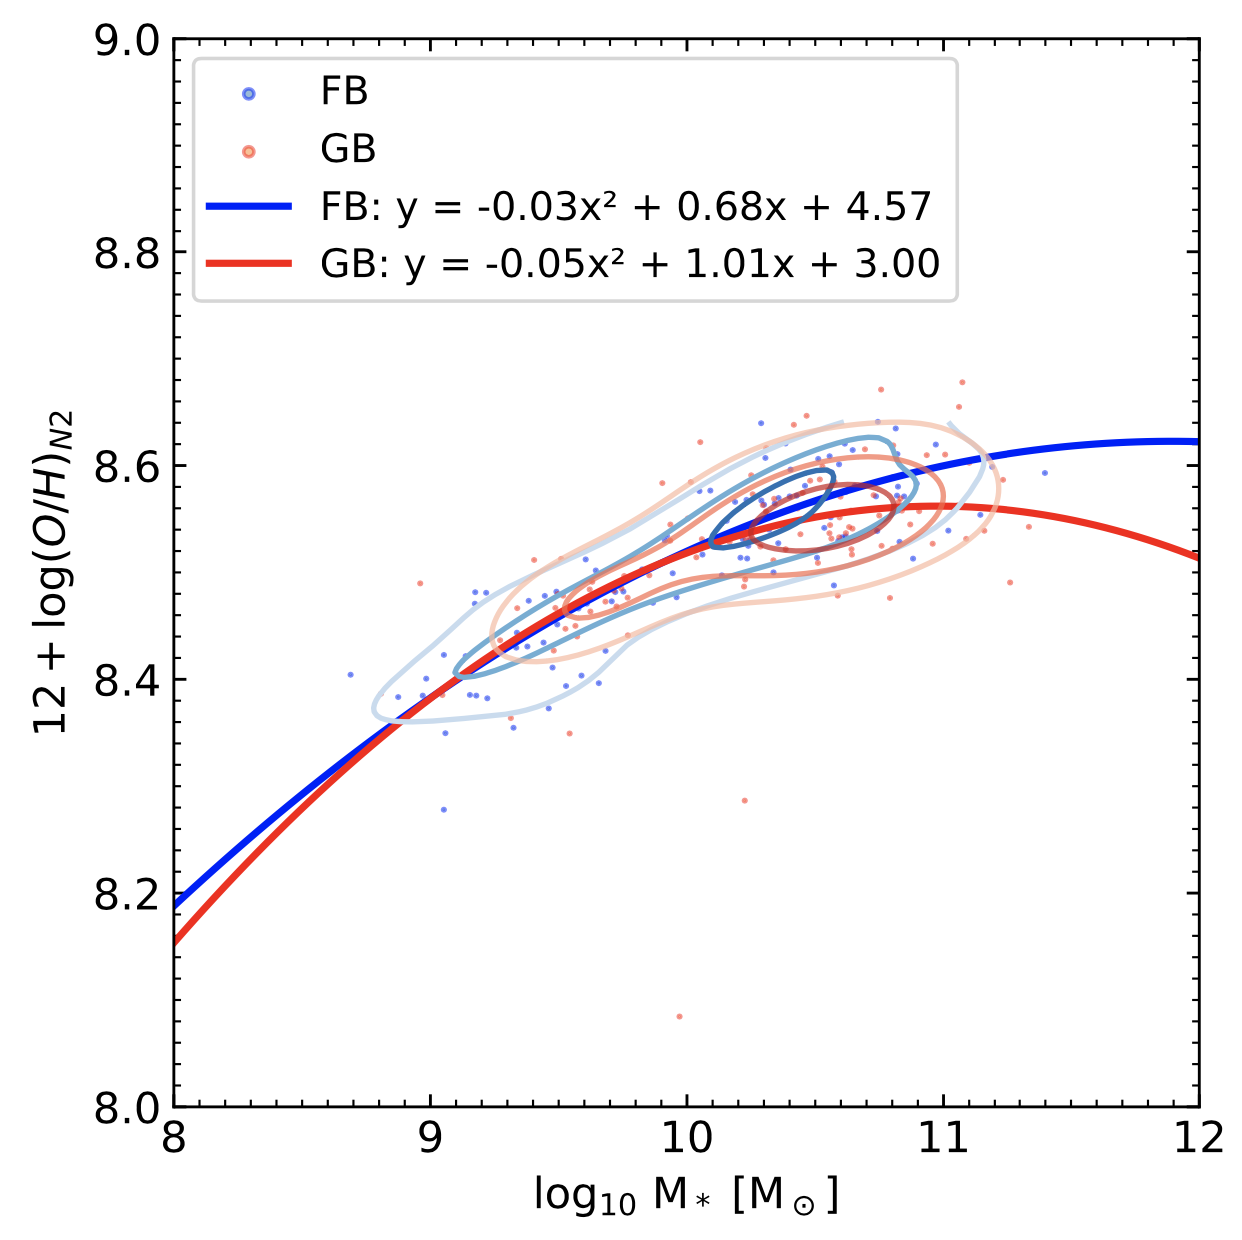
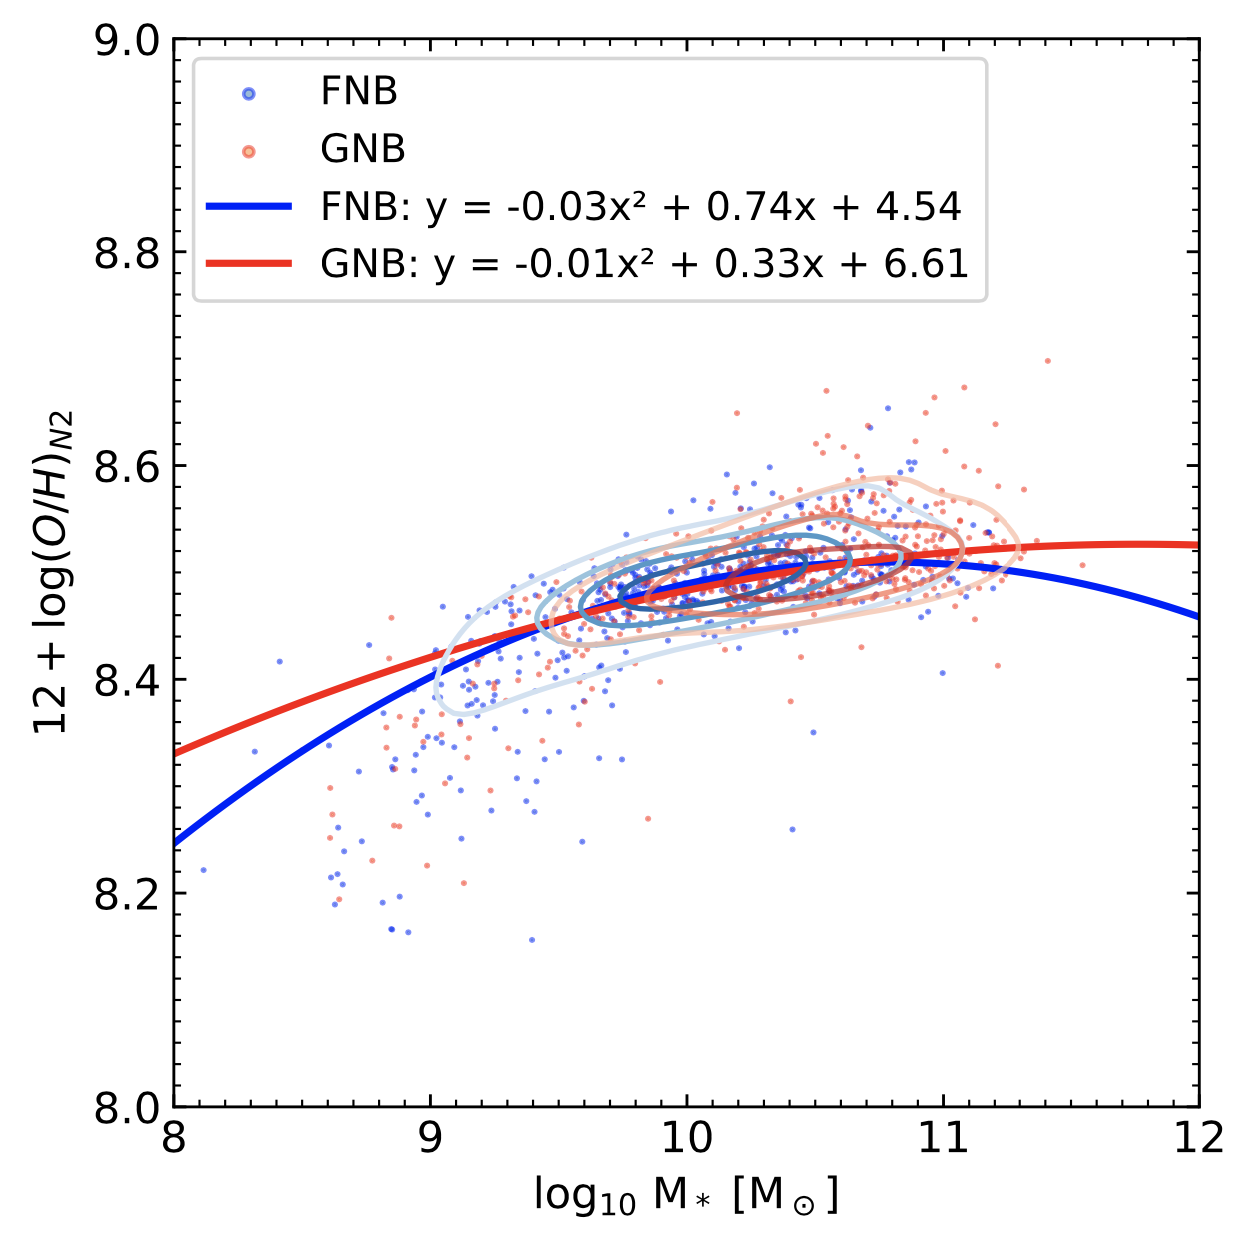
For understanding the existence of different oxygen abundance calibrators as detailed in Refs. [67, 68, 69, 66, 70, 71, 72, 73, 74, 75, 79, 78, 77, 76], in this study we adopted the estimate of the oxygen abundance from the N2-based calibrator proposed by Ref. [67] (), which was obtained by using equation,
| (8) |
where The results of this particular study have been shown in Fig. 7.
III.2 Galaxy properties relationship
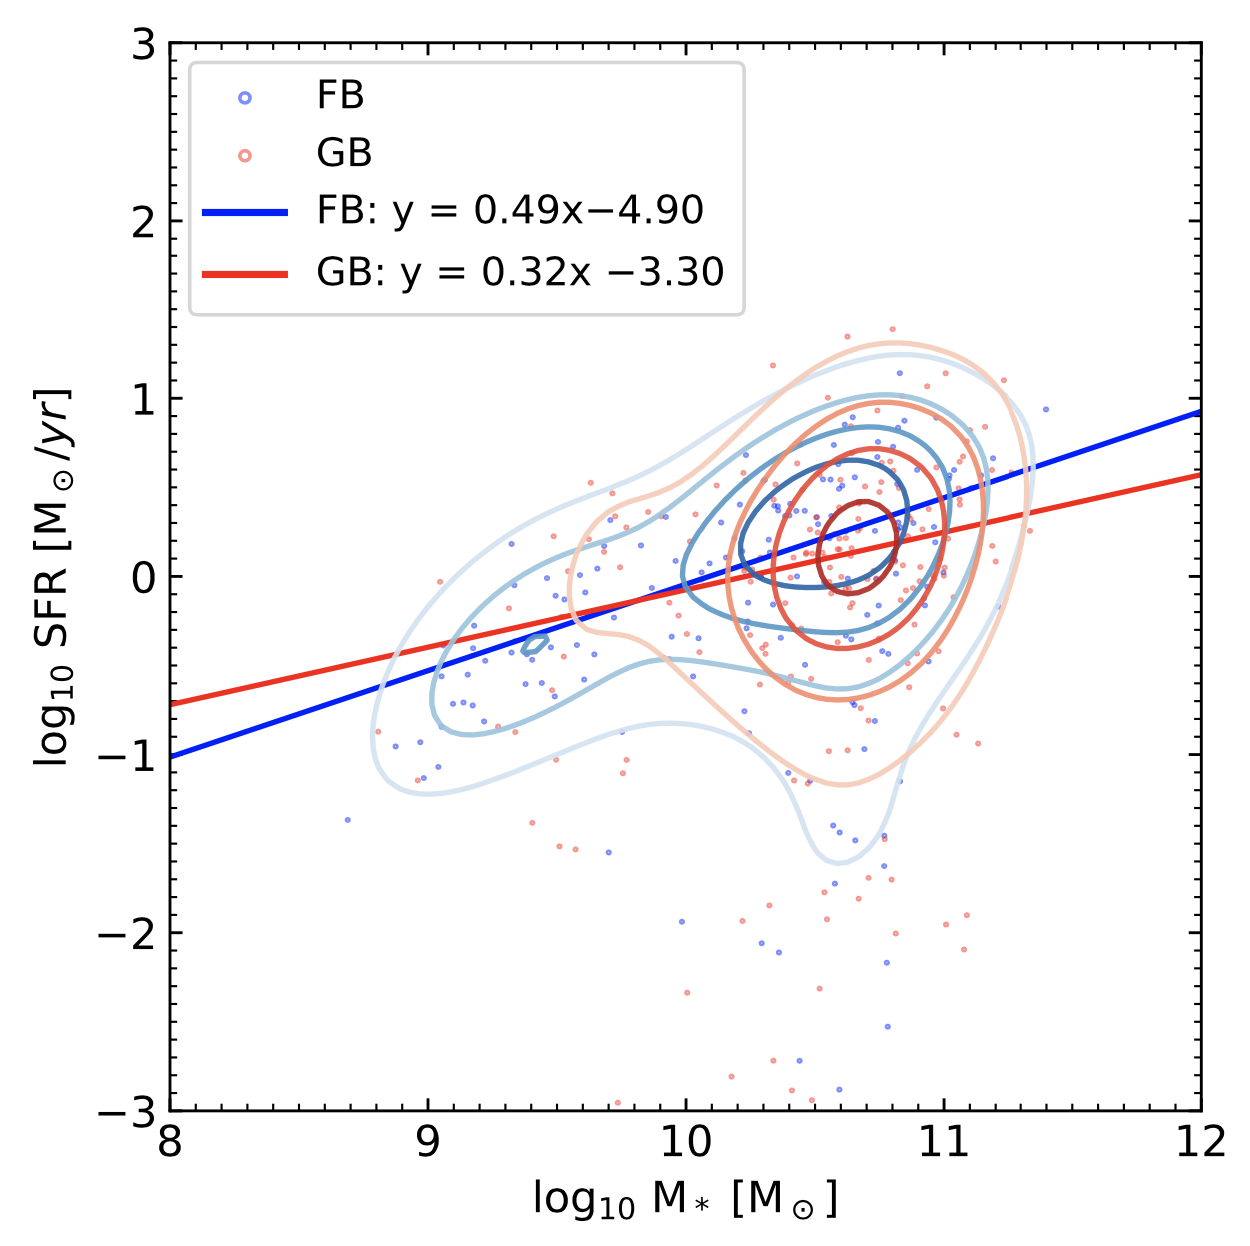
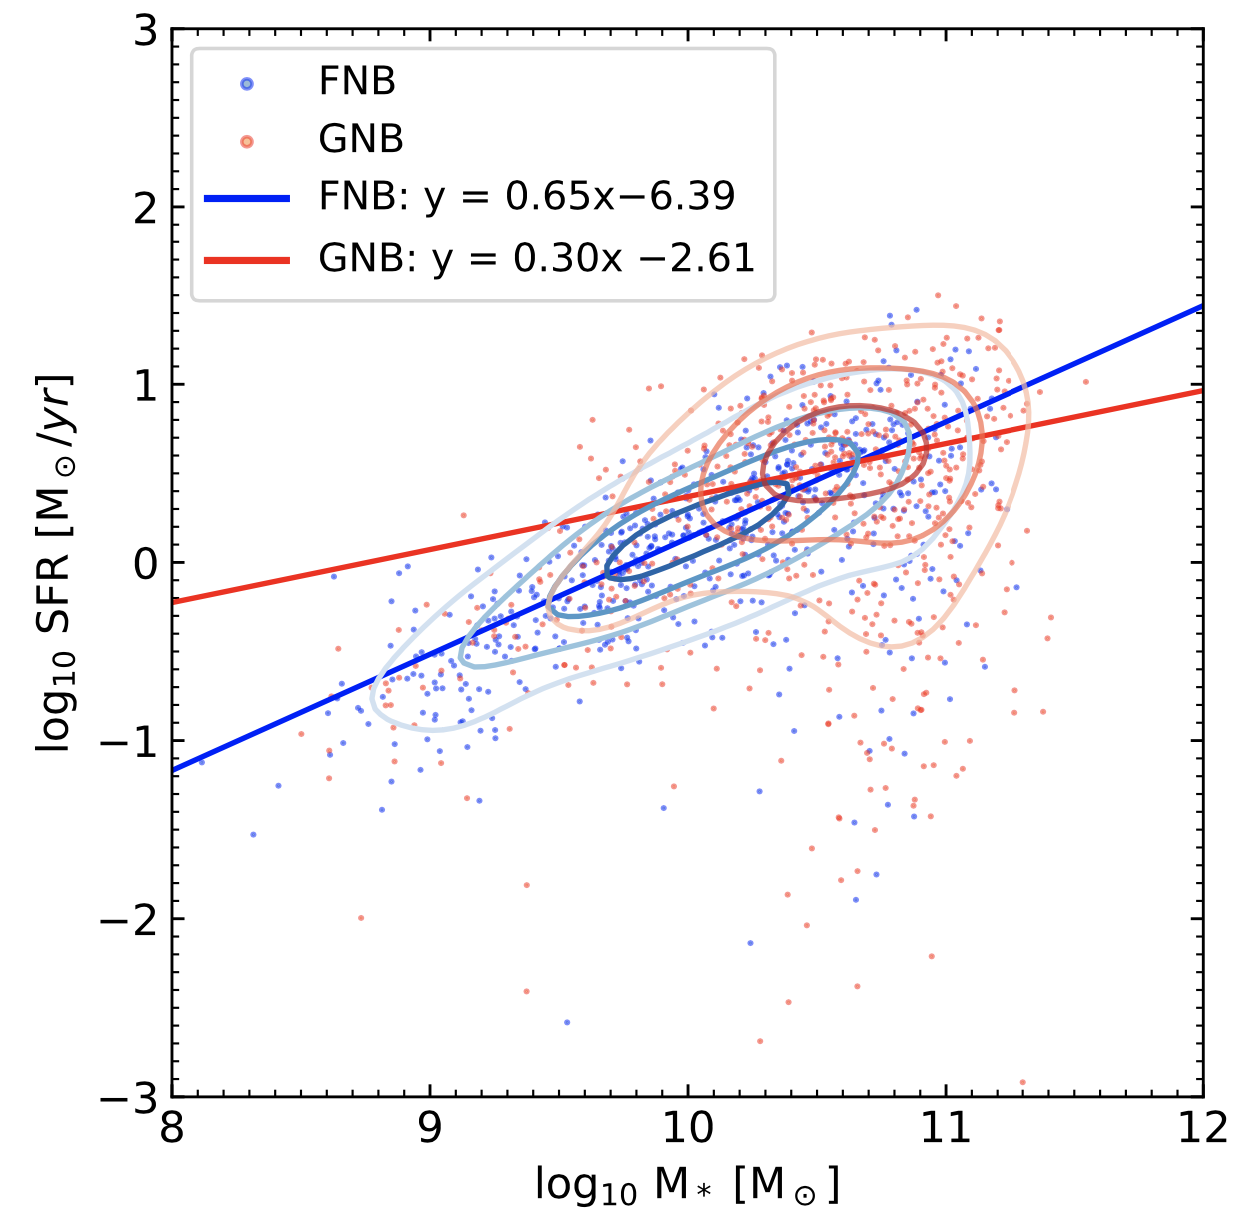
In this section we derive the fundamental relationships between the properties of galaxies obtained in the previous section, aiming to observe if there is any significant difference in the environmental dependence of barred galaxies when compared to unbarred ones. For this purpose, we plot Figs. 8, 9, and 10 that show the variation in stellar mass against SFR, colour against concentration index () and Stellar mass against gas phase metallicity, respectively.
From the left panel of Fig. 8 for barred galaxies by performing the regression analysis the general equations for the best-fitted lines to the field and group galaxies’ stellar masses against SFRs plots are respectively can be obtained as
| (9) | ||||
| (10) |
From the right panel of Fig. 8 for unbarred galaxies by performing the regression analysis the general equations for the best-fitted lines to the field and group galaxies’ stellar masses against SFRs plots are respectively can be obtained as
| (11) | ||||
| (12) |
From the left panel of Fig. 9 for barred galaxies by performing the regression analysis the general equations for the best-fitted lines to the field and group galaxies’ colours against concentration indices (s) plots are respectively obtained as
| (13) | ||||
| (14) |
From the right panel of Fig. 9 for unbarred galaxies by performing the regression analysis the general equations for the best-fitted lines to the field and group galaxies’ colours against concentration indices (s) are respectively obtained as
| (15) | ||||
| (16) |
From the left panel of Fig. 10 for barred galaxies by performing the regression analysis the general equations for the best-fitted lines to the field and group galaxies’ gas phase metallicities against stellar masses are respectively found as
| (17) | ||||
| (18) |
From the right panel of Fig. 10 for unbarred galaxies by performing the regression analysis the general equations for the best-fitted line to the field and group galaxies’ gas phase metallicities against stellar masses are respectively found as
| (19) | ||||
| (20) |
IV Discussion
The stellar masses shown in the left panel of Fig. 3 for barred galaxies present a systematic offset () of dex between field and group galaxies’ datasets where M of the group is slightly larger than the field. The observed difference is much less when compared to the spread of the M characterised by the standard deviation given by indicating a one-to-one correspondence between field and group galaxies’ M. The distributions of the two data sets indicate that they are the same, having the AD statistics of and p-value of . A systematic offset of dex between the unbarred field and group galaxies’ M is shown in the right panel of Fig. 3, where the group galaxies’ masses are greater than the field ones. Comparing this difference with the spread between the two data sets characterised by the standard deviation of , this difference is far smaller. The distributions of the two data sets indicate that they are different by having different AD statistics of and p-value of . The presence of bars results in a decrease of the difference in masses between field and group galaxies by . The large value of AD statistics and small p-value for unbarred galaxies indicate the strong dependence of M on the environment when compared to barred galaxies. These facts imply that the presence of bars decreases the dependence of M on the environment for the disc galaxies.
The left panel of Fig. 4 shows a comparison of SFRs for barred galaxies obtained using the dust-corrected H luminosity as already stated, where the spread is around a one-to-one relationship presenting a systematic offset of only dex between the barred field and group galaxies’ SFRs, with the field galaxies’ SFRs being slightly larger than the group ones. This difference is much smaller when compared to the spread between field and group galaxies characterised by the standard deviation of SFRs . The distributions of the two data sets indicate that they are similar, having the AD statistics of and p-value of . A consistent offset of dex between the two datasets is shown in the right panel of Fig. 4 for the unbarred galaxies, where the group galaxies’ SFRs are larger than the ones in field galaxies. Compared to the spread between these two sets of values, which is defined by the SFR standard deviation , this difference is far smaller, again indicating a one-to-one relationship. However, the distributions of the two data sets indicate that they are different, having the AD statistics of and p-value of . These results imply a strong dependence of SFRs for unbarred galaxies on the environment when compared to that of barred galaxies, indicating that the presence of bars decreases the dependence of SFRs on the environment.
Figs. 5 and 6 show a one-to-one correspondence between field and group disc galaxies for both barred (left panels) and unbarred (right panels) ones. The barred samples show the offset of dex for colour and while the unbarred samples show dex offset. These differences are smaller than the spread between the two sets of values characterised by standard deviations of and . We also performed the Anderson–Darling statistical test as in earlier cases for the and distributions of two subsamples at field and group environments and found that the and of unbarred galaxies strongly depend on environment with AD statistics of and respectively when compared to barred galaxies with AD statistics of and respectively. Similarly, the lower p-values ( for both colour and ) of unbarred samples when compared to barred ones ( and for and , respectively) reinforce the observation that bars result in the decrease of the dependence of both colour and on the environment. Almost all of the galaxies in this study are of the late-type, with , which is realistic since the study involves spiral galaxies that are indeed late-type.
The left panel of Fig. 7 displays the gas phase metallicity of barred galaxies, which shows a systematic offset of dex between field and group barred galaxies’ metallicity where the group’s metallicity is slightly higher than the field ones. This difference is significantly smaller when compared to the spread between the two datasets as characterised by a standard deviation of , indicating a one-to-one correspondence in metallicity between barred field and group galaxies. The distributions of the two data sets indicate that they are the same, having the AD statistics of and p-value of . A systematic offset of dex for unbarred galaxies where the group metallicity is greater than the field ones is shown in the right panel of Fig. 7. In comparison with the spread between the two datasets, with a standard deviation of , this difference is much smaller which implies that there is a one-to-one correspondence. The distributions of the two data sets indicate that they are different, having the AD statistics of and p-value of . The large value of AD statistics and small p-value for metallicity indicate the strong dependence of unbarred galaxies on the environment when compared to barred ones. These facts imply that the presence of bars decreases the dependence of gas phase metallicity on the environment for disc galaxies.
The difference in slopes between Eqs. (9) and (10) is dex and the difference in intercepts is , which are within the maximum errors in the measurements ( and for the slope and intercept, respectively). These differences produce p-values of and in slope and intercept, respectively by t-test. Since these p-values are much greater than the standard statistics’ p-value () these differences in slope and intercept are less significant which implies that the variation of M and SFR for barred galaxies are not significantly influenced by the environment. On the other hand the difference in slopes between Eqs. (11) and (12) is dex and the difference in intercept is , which are much greater than the maximum errors in the measurement ( and for the slope and intercept, respectively). These differences produce p-values of and in slope and intercept, respectively. Since these p-values are much less than the standard statistics’ p-value () the differences in slope and intercept are much more significant which implies that the variation of M and SFR for unbarred galaxies is affected by the environment.
The difference in slopes between Eqs. (13) and (14) is dex and the difference in intercepts is . These differences are within the maximum errors associated with the slope () and intercept (). Furthermore, the p-values produced by these differences are and for the slope and intercept, respectively by t-test. Since these p-values are much greater than the standard statistics’ p-value () these differences in slope and intercept are less significant which implies that the variation of colours and concentration indices (s) for barred galaxies are not significantly influenced by the environment. On the other hand the difference in slopes between Eqs. (15) and (16) is dex and the difference in intercepts is , which are much larger than the maximum errors in the measurement ( and for the slope and intercept, respectively). Moreover, these differences produce p-values of and in slope and intercept, respectively. Since these p-values are much less than the standard statistics’ p-value () the differences in slope and intercept are much more significant which implies that the variation of colour and concentration index () for unbarred galaxies is affected by the environment.
The differences in quadratic coefficients (curvature), linear coefficients (slopes), and intercepts between Eqs. (17) and (18) are dex, dex, and dex, respectively. These differences are within the maximum errors associated with the curvature, slope and intercept given by , and , respectively. Furthermore, the p-values produced by these differences are , and for the curvature, slope and intercept, respectively using the t-test. Since these p-values are much greater than the standard statistics’ p-value () the differences in curvature, slope and intercept are less significant which implies that the variation of stellar mass against gas phase metallicity for barred galaxies are not significantly influenced by the environment. On the other hand, the difference in curvatures, slopes, and intercepts between Eqs. (15) and (16) are dex, dex and dex, respectively, which are much larger than the maximum errors in the measurement (, and ). Furthermore, these differences produce p-values of , , in curvature, slope and intercept, respectively. Since the p-values are less than the standard p-value in statistics (), the differences in curvature, slope and intercept are significant which implies that the variation of stellar mass against gas phase metallicity for unbarred galaxies is affected by the environment.
The results are consistent with the findings of Ref. [80], who observed that a large fraction of spirals in dense environment have early-type morphology than the field similar to the evidence from Fig.9 whereby group galaxies have high concentration indices (early type) when compared to field for both barred and unbarred galaxies. The study agrees with the results that mostly early-type spirals are found in group environments compared to late-type [80, 81], similarly we observed most barred galaxies to exist in groups () when compared to unbarred (), in this case barred, unbarred galaxies resemble early-type, late-type, respectively based on the findings that bars forms over time [82, 83, 84, 85, 86]. From Figs.9 group galaxies have higher colour (most redder) when compare to field supporting the results from Refs. [87, 88, 89] that the blue spiral resides outside the group environments than red spiral galaxies. The M against SFR and against relationships as shown in Figs.8, Fi.9 are well fitted by a linear line, the most widely proposed relation in a number of works for the given mass ranges E.g. in Refs. [90, 91, 92, 93, 94, 95, 92, 96, 97] while the M against gas phase metallicity relationships as shown in Fig.10 is well fitted by a polynomial supporting the study by Ref. [73].
V Summary and Conclusion
Using a volume-limited sample obtained from the MaNGA survey we investigated the influence of bars on the environmental dependence of disc galaxies’ physical properties. We selected the galaxies with bars using the criteria (1), (2), (3), and (4) then unbarred galaxies, using criteria (1), (2), (3), and (5) to obtain a total of and for the galaxies with bars and without bars, respectively. To quantify the galaxy’s environmental effect we used the Galactic Environment for the MaNGA Value Added Catalogue (GEMA-VAC) obtained by using the methods described in Ref. [45, 50, 51] which is a volume-limited sample up to whereby the galaxies are assigned in groups using the halo-based group finder used by Ref. [52]. The galaxies which are alone in the group (Group size (GS) ) are referred to as field and the galaxies with at least one neighbour (Group size (GS) ) are named group galaxies. A total number of and field and group barred galaxies were obtained. Similarly, a total number of and field and group unbarred galaxies were obtained. These samples were used to compare the M, SFR, colour, r-band concentration index () and gas phase metallicity between field and group environments as shown by Figs. 3, 4, 5, 6 and 7, respectively. Then these were used to investigate if there is the existence of any difference between barred and unbarred galaxies. The M against SFR, against , and M against gas phase metallicity were studied in Figs. 8, 9 and 10, respectively. Together with the already established results, this study revealed the following:
-
•
A one-to-one correspondence of M, SFR, colour, and gas phase metallicity between field and group galaxies were observed for both barred and unbarred galaxies.
-
•
The M, SFR, colour, and gas phase metallicity of unbarred galaxies strongly while barred weakly depend on the environment indicating that the presence of a bar in disc galaxies decrease the dependence of its properties on the environment.
-
•
The slope and intercept of M against SFR relation of barred galaxies are weakly dependent on the environment while for unbarred there is a strong dependence.
-
•
There is a significant difference in the slopes and intercepts of colour against relation between field and group for unbarred galaxies, while for barred the differences are insignificant.
-
•
The insignificant difference in curvatures, slopes and intercepts of M against gas phase metallicity when field and group barred galaxies are compared were observed while for unbarred galaxies the differences are significant.
The study revealed that the presence of bars in disc galaxies decreases the dependence of analysed properties and their relations on the environment. The study emphasises on bar consideration in the investigation of the environmental dependence of disc galaxies’ properties.
Acknowledgements
PP acknowledges support from The Government of Tanzania through the India Embassy, Mbeya University of Science and Technology (MUST) for Funding and SDSS for providing data. UDG is thankful to the Inter-University Centre for Astronomy and Astrophysics (IUCAA), Pune, India for the Visiting Associateship of the institute. Funding for the Sloan Digital Sky Survey IV has been provided by the Alfred P. Sloan Foundation, the U.S. Department of Energy Office of Science, and the Participating Institutions. SDSS-IV acknowledges support and resources from the Center for High-Performance Computing at the University of Utah. SDSS-IV is managed by the Astrophysical Research Consortium for the Participating Institutions of the SDSS Collaboration, including the Brazilian Participation Group, the Carnegie Institution for Science, Carnegie Mellon University, Center for Astrophysics — Harvard & Smithsonian, the Chilean Participation Group, the French Participation Group, Instituto de Astrofísica de Canarias, The Johns Hopkins University, Kavli Institute for the Physics and Mathematics of the Universe (IPMU)/University of Tokyo, the Korean Participation Group, Lawrence Berkeley National Laboratory, Leibniz Institut für Astrophysik Potsdam (AIP), Max-Planck-Institut für Astronomie (MPIA Heidelberg), Max-Planck-Institut für Astrophysik (MPA Garching), Max- Planck-Institut für Extraterrestrische Physik (MPE), National Astronomical Observatories of China, New Mexico State University, New York University, University of Notre Dame, Observatário Nacional/MCTI, The Ohio State University, Pennsylvania State University, Shanghai Astronomical Observatory, United Kingdom Participation Group, Universidad Nacional Autónoma de México, University of Arizona, University of Colorado Boulder, University of Oxford, University of Portsmouth, University of Utah, University of Virginia, University of Washington, University of Wisconsin, Vanderbilt University, and Yale University.
References
- [1] F. Bournaud, F. Combes, Gas accretion on spiral galaxies: Bar formation and renewal, A&A 392, 83 (2002) [arXiv:astro-ph/0206273].
- [2] E. Athanassoula, R. Machado, S. Rodionov, Bar formation and evolution in disc galaxies with gas and a triaxial halo: morphology, bar strength and halo properties, MNRAS429, 1949 (2013) [arXiv:1211.6754].
- [3] R. Cacho, P. Sánchez-Blázquez, J. Gorgas, I. Pérez, et al., Gaseous-phase metallicities and stellar populations in the centres of barred galaxies, MNRAS 442, 2496 (2018) [arXiv:1406.6885].
- [4] S. Kruk, C. Lintott, S. Bamford, K. Masters, et al., Galaxy Zoo: secular evolution of barred galaxies from structural decomposition of multiband images, MNRAS 473, 4731 (2018) [arXiv:1710.00093].
- [5] J. Sellwood, J. Shen, Z. Li, The global stability of M33: still a puzzle, MNRAS 486, 4710 (2019) [arXiv:1902.07222].
- [6] P. Erwin, The dependence of bar frequency on galaxy mass, colour, and gas content–and angular resolution–in the local universe, MNRAS 474, 5372 (2018) [arXiv:1711.04867].
- [7] Q. Deng, Y. Zu, S. Alam, Y. Yoon, Dependence of galactic bars on the tidal density field in the SDSS, MNRAS 525, 1520 (2023) [arXiv:2306.05451].
- [8] J. Sellwood, A. Wilkinson, Dynamics of barred galaxies, Rep. Prog. Phys 56, 173 (2011) [arXiv:astro-ph/0608665].
- [9] A. Fraser-McKelvie, M. Merrifield, A. Aragón-Salamanca, T. Peterken, et al., SDSS-IV MaNGA: The link between bars and the early cessation of star formation in spiral galaxies, MNRAS 499, 1116 (2020) [arXiv:2009.0785].
- [10] K. George, S. Subramanian, Bar quenching: Evidence from star-formation-rate indicators, A&A 651, A107 (2021) [arXiv:2105.06492].
- [11] F. Maeda, F. Egusa, K. Ohta, Y. Fujimoto, et al., Bar quenching: Evidence from star-formation-rate indicators, ApJ 943, 7 (2023) [arXiv:2211.15681].
- [12] M. Kim, Y. Choi, S. Kim, Effect of bars on evolution of SDSS spiral galaxies, MNRAS 494, 5839 (2020) [arXiv:2107.0692].
- [13] G. Gavazzi, G. Consolandi, E. Viscardi, M. Fossati, et al., H3: an H imaging survey of HI selected galaxies from ALFALFA-V. The Coma supercluster survey completion, A&A 576, A16 (2015) [arXiv:1505.07423].
- [14] S. Jogee, The Fueling and Evolution of AGN: Internal and External Triggers, Physics of Active Galactic Nuclei at all Scales 693, 143 (2006) [arXiv:astro-ph/0408383].
- [15] J. Kormendy, R. Kennicutt, Secular evolution and the formation of pseudobulges in disk galaxies, ARA&A 42, 603 (2004) [arXiv:/astro-ph/0407343].
- [16] J. Knapen, J. Beckman, C. Heller, I. Shlosman, et al., The central region in M100: Observations and modeling, ApJ 454, 623 (1995) [arXiv:astro-ph/9506098].
- [17] S. Comerón, J. Knapen, J. Beckman, E. Laurikainen, et al., AINUR: Atlas of Images of NUclear Rings, MNRAS 402, 2462 (2010) [arXiv:0908.0272].
- [18] E. Allard, J. Knapen, R. Peletier, M. Sarzi, et al., The star formation history and evolution of the circumnuclear region of M100, MNRAS 371, 1087 (2006) [arXiv:astro-ph/0606490].
- [19] S. Ellison, P. Nair, D. Patton, J. Scudder, et al., The impact of gas inflows on star formation rates and metallicities in barred galaxies, MNRAS 416, 2182 (2011) [arXiv:1106.1177].
- [20] C. Carles, H. Martel, S. Ellison, D. Kawata, et al., The mass dependence of star formation histories in barred spiral galaxies, MNRAS 463, 1074 (2016) [arXiv:1610.02366].
- [21] P. Coelho, D. Gadotti, Bars rejuvenating bulges? evidence from stellar population analysis, ApJL 743, L13 (2011) [arXiv:1111.1736].
- [22] L. Newnham, K. Hess, K. Masters, S. Kruki, et al., The HI morphology and stellar properties of strongly barred galaxies: support for bar quenching in massive spirals, MNRAS 492, 4697 (2020) [arXiv:1901.01164].
- [23] K. Sheth, S. Vogel, M. Regan, M. Thornleyet al., Secular evolution via Bar-driven gas inflow: Results from BIMA SONG, ApJ 632, 217 (2005) [arXiv:astro-ph/0505393].
- [24] G. Lee, C. Park, M. Lee, Y. Choi, et al., Dependence of barred galaxy fraction on galaxy properties and environment, ApJ 745, 127 (2012) [arXiv:1110.1933].
- [25] G. Lee, J. Woo, M. Lee, H. Hwang, et al., Do bars trigger activity in galactic nuclei?, ApJ 750, 141 (2012) [arXiv:1203.1693].
- [26] K. Masters, R. Nichol, B. Hoyle, C. Lintott, et al., Galaxy Zoo: bars in disc galaxies, MNRAS 411, 2026 (2011).
- [27] L. Thompson, Bar instabilities in Coma cluster galaxies, ApJL 244, L43 (1981).
- [28] S. Sarkar, B. Pandey, S. Bhattacharjee, Do galactic bars depend on environment?: an information theoretic analysis of Galaxy Zoo 2, MNRAS 501, 994 (2021) [arXiv:2009.12797].
- [29] M. Chacón, R. Delgado-Serrano, B. Sodi, Bar Presence in Local Galaxies: Dependence on Morphology in Field Galaxies, RAA 24,115014 (2024).
- [30] R. Skibba, K. Masters, R. Nichol, I. Zehavi, et al., Galaxy Zoo: the environmental dependence of bars and bulges in disc galaxies, MNRAS 423, 1485 (2012) [arXiv:/1111.0969].
- [31] G. Byrd, M. Valtonen, Tidal generation of active spirals and S0 galaxies by rich clusters, ApJ 350, 89 (1990).
- [32] M. Gerin, F. Combes, The influence of galaxy interactions on stellar bars, A&A 230, 37 (1990).
- [33] P. Eskridge, J. Frogel, R. Pogge, A. Quillen, et al., The frequency of barred spiral galaxies in the near-infrared, AJ 119, 536 (2000) [arXiv:astro-ph/9910479].
- [34] J. Aguerri, J. Méndez-Abreu, E. Corsini, et al., The population of barred galaxies in the local universe-I. Detection and characterisation of bars, A&A 495, 491 (2009) [arXiv:0901.2346].
- [35] V. Debattista, O. Gonzalez, R. Sanderson, K. El-Badry, et al., Formation, vertex deviation, and age of the Milky Way’s bulge: input from a cosmological simulation with a late-forming bar, MNRAS 485, 5073 (2019) [arXiv:1805.12199].
- [36] K .Bundy, M. Bershady, D. Law, R. Yan, et al., Overview of the sdss-iv manga survey: mapping nearby galaxies at apache point observatory, ApJ 798, 7 (2014) [arXiv:1412.1482].
- [37] R. Yan, K. Bundy, D. Law, M. Bershady, B. Andrews, et al., SDSS-IV MaNGA IFS galaxy survey—Survey design, execution, and initial data quality, AJ 152, 197 (2016) [arXiv:1607.08613].
- [38] D. Wake, K. Bundy, A. Diamond-Stanic, R. Yan, et al., The SDSS-IV MaNGA sample: design, optimization, and usage considerations, AJ 154, 86 (2017) [arXiv:1707.02989].
- [39] A. Fraser-McKelvie, A. Aragón-Salamanca, M. Merrifield, K. Masters, et al., SDSS-IV MaNGA: spatially resolved star formation in barred galaxies, MNRAS 495, 4158 (2020) [arXiv:2005.08987].
- [40] D. York, J. Adelman, J. Anderson Jr, S. Anderson, et al., The Sloan Digital Sky Survey: Technical Summary, AJ 120, 1579 (2000) [arXiv:astro-ph/0006396].
- [41] M. Blanton, M. Bershady, B. Abolfathi, F. Albareti, et al., Sloan Digital Sky Survey IV: Mapping the Milky Way, nearby galaxies, and the distant universe, AJ 154, 28 (2017) [arXiv:1703.00052].
- [42] N. Drory, N. MacDonald, MA. Bershady, K. Bundy, et al., The MaNGA integral field unit fiber feed system for the Sloan 2.5 m telescope, AJ 149, 77 (2015) [arXiv:1412.1535].
- [43] M. Blanton, E. Kazin, D. Muna, B. Weaver, et al., Improved background subtraction for the sloan digital sky survey images, AJ 142, 31 (2011) [arXiv:1105.1960].
- [44] N. Abdurro’uf, K. Accetta, C. Aerts, V. Silva Aguirre, et al., The seventeenth data release of the Sloan Digital Sky Surveys: Complete release of MaNGA, MaStar, and APOGEE-2 data, AJ 259, 35 (2022) [arXiv:2112.0202].
- [45] M. Argudo-Fernández, S. Verley, G. Bergond, S. Puertas, et al., Catalogues of isolated galaxies, isolated pairs, and isolated triplets in the local Universe, A&A 578, A110 (2015) [arXiv:1504.00117].
- [46] P. Teerikorp, Eddington-Malmquist bias in a cosmological context, A & A 576, A75 (2015) [arXiv:1503.02812].
- [47] K. Willett, C. Lintott, S. Bamford, K. Masters, et al., Galaxy Zoo 2: detailed morphological classifications for 304 122 galaxies from the Sloan Digital Sky Survey, MNRAS 435, 2835 (2013) [arXiv:1308.3496].
- [48] R. Hart, S. Bamford, K. Willett, K. Masters et al., Galaxy Zoo: comparing the demographics of spiral arm number and a new method for correcting redshift bias, MNRAS 461, 3663 (2016) [arXiv:1607.01019].
- [49] I. Zinchenko, Gas and stellar kinematic misalignment in MaNGA galaxies: What is the origin of counter-rotating gas?, A&A 674, L7 (2023) [arXiv:2305.13387 ].
- [50] J. Etherington, D. Thomas, Measuring galaxy environments in large-scale photometric surveys, MNRAS 451, 660 (2015) [arXiv:1505.01171].
- [51] H. Wang, H. Mo, X. Yang, Y. Zhang, et al., ELUCID—exploring the local universe with reconstructed initial density field. III. Constrained simulation in the SDSS volume, ApJ 831,164 (2016) [arXiv:1608.01763].
- [52] X. Yang, H. Mo, F. Van den Bosch, A. Pasquali, et al., Galaxy groups in the SDSS DR4. I. The catalog and basic properties, AJ 671, 153 (2007) [arXiv:0707.4640].
- [53] T. Anderson, D. Darling, Asymptotic theory of certain” goodness of fit” criteria based on stochastic processes, The Annals of Mathematical Statistics 23, 193 (1952) .
- [54] AN Pettitt, A two-sample Anderson-Darling rank statistic, Biometrika 63, 161 (1976).
- [55] F. Scholz, M. Stephens, K-Sample Anderson–Darling Tests, J. Am. Stat. Assoc 82, 918 (1987).
- [56] G. Babu, E. Feigelson, Astrostatistics: Goodness-of-fit and all that, ASPCS 351, 127 (2006).
- [57] S. Sánchez, J. Barrera-Ballesteros, E. Lacerda, A. Mejía-Narvaez, et al., SDSS-IV MaNGA: pyPipe3D analysis release for 10000 galaxies, ApJ 262, 32 (2022) [arXiv:2206.0706].
- [58] M. Fukugita, K. Shimasaku, T. Ichikawa, Galaxy colors in various photometric band systems, PASP 107, 945 (1995).
- [59] E. Bell, R. De Jong, The stellar populations of spiral galaxies, MNRAS 312, 497 (2000) [arXiv:astro-ph/9909402].
- [60] G. Chabrier, Galactic stellar and substellar initial mass function, PASP 115, 763 (2003) [arXiv:0304382].
- [61] R. Kennicutt, Star formation in galaxies along the Hubble sequence, ARA&A 36, 89 (1998) [arXiv:astro-ph/9807187].
- [62] E. Salpeter, The luminosity function and stellar evolution, ApJ 121, 161 (1995).
- [63] M. Cano-Díaz, S. Sánchez, S. Zibetti, Y. Ascasibar, et al., Spatially resolved star formation main sequence of galaxies in the CALIFA survey, ApJL 821, L26 (2016) [arXiv:1602.02770].
- [64] S. Sánchez, C. Walcher, C. Lopez-Cobá, B. Ballesteros, et al., From Global to Spatially Resolved in Low-Redshift Galaxies, RMxAA 57, 3 (2021) [arXiv:2009.00424].
- [65] S. Sanchez, V. Avila-Reese, H. Hernandez-Toledo, E. Cortes-Suarez, et al., SDSS IV MaNGA - Properties of AGN host galaxies, RMxAA 54, 1 (2018) [arXiv:1709.0543].
- [66] L. Sanchez-Menguiano, J. Almeida, C. Munoz-Tunon, S. Sanchez, et al., Characterizing the local relation between star formation rate and gas-phase metallicity in MaNGA spiral galaxies, ApJ 882, 9 (2019) [arXiv:1904.03930].
- [67] R. Marino, F. Rosales-Ortega, S. Sánchez, A. Gil de Paz, et al., The O3N2 and N2 abundance indicators revisited: improved calibrations based on CALIFA and Te-based literature data, A&A 553, A114 (2013) [arXiv:1307.5316].
- [68] F. Vogt, M. Dopita, S. Borthakur, L. Verdes-Montenegro, et al., Galaxy interactions in compact groups–II. Abundance and kinematic anomalies in HCG 91c, MNRAS 450, 2593 (2015) [arXiv:1504.03337].
- [69] E. Pérez-Montero, T. Contini, The impact of the nitrogen-to-oxygen ratio on ionized nebula diagnostics based on [N ii] emission lines, MNRAS 398, 949 (2009) [arXiv:0905.4621].
- [70] L. Pilyugin, J. Vilchez, T. Thuan, New improved calibration relations for the determination of electron temperatures and oxygen and nitrogen abundances in H II regions, ApJ 720, 1738 (2010).
- [71] L. Kewley, S. Ellison, Metallicity calibrations and the mass-metallicity relation for star-forming galaxies, ApJ 681, 1183 (2008) [arXiv:0801.1849].
- [72] R. Maiolino, T. Nagao, A. Grazian, F. Cocchia, et al., AMAZE-I. The evolution of the mass–metallicity relation at , A&A 488, 463 (2008) [arXiv:0806.2410].
- [73] C. Tremonti, T. Heckman, G. Kauffmann, J. Brinchmann, et al., The origin of the mass-metallicity relation: insights from 53,000 star-forming galaxies in the sloan digital sky survey, ApJ 613, 898 (2004) [arXiv:/astro-ph/0405537].
- [74] M. Dopita, R. Sutherland, Spectral signatures of fast shocks. I. Low-density model grid, ApJ 102, 161 (1996).
- [75] M. Peña-Guerrero, A. Peimbert, M. Peimbert, Recalibration of pagel’s method for H II regions considering the thermal structure, the ionization structure, and the depletion of O into dust grains, ApJL 756, L14 (2012).
- [76] C. Espinosa-Ponce, S. Sánchez, C. Morisset, J. Barrera-Ballesteros, et al., HII regions in CALIFA survey: II. The relation between their physical properties and galaxy evolution MNRAS 512, 3436 (2022) [arXiv:2202.07518].
- [77] I. Ho, A machine learning artificial neural network calibration of the strong-line oxygen abundance, MNRAS 485, 3569 (2019) [arXiv:1903.01506].
- [78] M. Curti, F. Mannucci, G. Cresci, R. Maiolino, The mass–metallicity and the fundamental metallicity relation revisited on a fully Te-based abundance scale for galaxies, MNRAS 491, 944 (2020) [arXiv:1910.00597].
- [79] A. López-Sánchez, M. Dopita, L. Kewley, H. Zahid, et al., Eliminating error in the chemical abundance scale for extragalactic H ii regions, MNRAS 426, 2630 (2020) [arXiv:1203.5021].
- [80] T. Goto, C. Yamauchi, Y. Fujita, S. Okamura, et al., The morphology—density relation in the Sloan Digital Sky Survey, MNRAS 346, 601 (2003).
- [81] J. Aguerri, J. Iglesias-Paramo, J. Vilchez, C. Munoz-Tunón, Environmental effects in the structural parameters of galaxies in the Coma cluster, AJ 127, 1344 (2004) [arXiv:astro-ph/0401025 ].
- [82] D. Izquierdo-Villalba, S. Bonoli, Y. Rosas-Guevara, V. Springel, et al., Buckling instability in tidally induced galactic bars, A&A 624, A37 (2019) [arXiv:1902.07103].
- [83] S. Ansar, S. Pearson, R. Sanderson, A. Arora, et al., Bar formation and destruction in the FIRE-2 simulations, ApJ 978, 37 (2024) [arXiv:2309.16811 ].
- [84] S. Kwak, W. Kim, S. Rey, S. Kim, Origin of non-axisymmetric features of Virgo cluster early-type dwarf galaxies. I. Bar formation and recurrent buckling, ApJ 839, 24 (2017) [arXiv:1703.10285].
- [85] P. López, C. Scannapieco, S. Cora, I. Gargiulo, Unveiling the origins of galactic bars: insights from barred and unbarred galaxies, MNRAS 529, 979 (2024) [arXiv:2403.13061 ].
- [86] D. Izquierdo-Villalba, S. Bonoli, Y. Rosas-Guevara, V. Springel, et al., Disc instability and bar formation: view from the IllustrisTNG simulations, MNRAS 514, 1006 (2022) [arXiv:2203.07734].
- [87] C. Wolf, A. Aragón-Salamanca, M. Balogh, M. Barden, et al., The STAGES view of red spirals and dusty red galaxies: mass-dependent quenching of star formation in cluster infall, MNRAS 393, 1302 (2009) [arXiv:0811.3873 ].
- [88] P. Bamford, R. Nichol, I. Baldry, K Land, et al., Galaxy Zoo: the dependence of morphology and colour on environment, MNRAS 393, 1324 (2009) [arXiv:0805.2612].
- [89] K. Masters, M. Mosleh, A. Romer, R. Nichol, et al., Galaxy Zoo: passive red spirals, MNRAS 405, 783 (2010) [arXiv:0910.4113 ].
- [90] D. Elbaz, E. Daddi, D. Borgne, The reversal of the star formation-density relation in the distant universe, A&A 468, 33 (2007) [arXiv:astro-ph/0703653].
- [91] J. Speagle, C. Steinhardt, P. Capak, J. Silverman, et al., A Highly Consistent Framework for the Evolution of the Star-Forming” Main Sequence” from , ApJS 214, 15 (2014) [arXiv:1405.2041].
- [92] S. Leslie, L. Kewley, D. Sanders, N. Lee, Quenching star formation: insights from the local main sequence, MNRAS 455, L82 (2015) [arXiv:1509.03632].
- [93] E. Daddi, M. Dickinson, G. Morrison, R. Chary, et al., Multiwavelength study of massive galaxies at . I. Star formation and galaxy growth, ApJ 670, 156 (2007). [arXiv:0705.2831].
- [94] T. Yuan, L. Kewley, D. Sanders, The Role of Starburst-Active Galactic Nucleus Composites in Luminous Infrared Galaxy Mergers: Insights from the New Optical Classification Scheme, ApJ 709, 884 (2010).
- [95] J. Rich, L. Kewley, M. Dopita, Galaxy-Wide Shocks in Late-Merger Stage Luminous Infrared Galaxies, ApJ 782, 9 (2014) [arXiv:1104.1177].
- [96] K. Schawinski, D. Thomas, M. Sarzi, C. Maraston, et al., Observational evidence for AGN feedback in early-type galaxies, MNRAS 382, 1415 (2007) [arXiv:0709.3015].
- [97] K. Whitaker, P. Dokkum, G. Brammer, M. Franx, The star formation mass sequence out to z= 2.5, ApJL 754, L29 (2015) [arXiv:1205.0547].