Exerting chemical pressure on the kagome lattice as frustration control in the kapellasite family Cu3(OH)6+x(Cl,Br)3-x
Abstract
The kapellasite family Cu3(OH)6+x(Cl,Br)3-x forms a series of compounds, wherein the chemical pressure realized by the site cation tunes the spin exchange in the frustrated distorted kagome lattice. Via hydrothermal synthesis we have grown single crystals of the whole series for rare-earths and found a clear structural transition to a superstructure variant at a specific chemical pressure level exerted by = Dy. Phases with crystal structures in the vicinity of this superstructure transition realize a distorted kagome lattice of the Cu2+ cations with characteristic features of a spin liquid. Here, subtle structural disorder as well as controlled chemical pressure can stabilize the spin liquid phase. We study the crystal structure and the magnetic ground state of these phases via single crystal x-ray diffraction, magnetic susceptibility, specific heat and muon spin spectroscopy measurements.
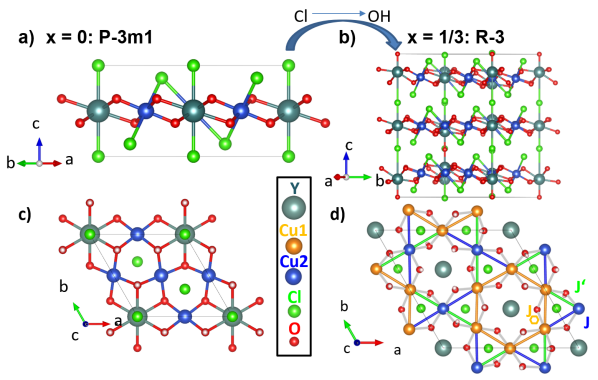
Antiferromagnetic kagome layers, are prime candidates to search for an experimental realization of the quantum spin-liquid (QSL) phase [1, 2], characterized by the absence of static magnetic order down to lowest temperatures with macroscopic entanglement and fractional excitations. Cu-based systems with kagome layers of Cu2+ spin = 1/2 cations are considered ideal QSL candidates, with one of the first experimental QSL phases observed in herbertsmithite with composition ZnCu3(OH)6Cl2 [3, 4]. Recently, the disordered case of a Dirac spin liquid (SL) [5, 6] is found within a related new family of compounds with composition Cu3(OH) wherein can be F, Cl, Br, NO3, SO4 and both a divalent or trivalent cation as summarized in Ref. [7]. The majority of these systems crystallize with kapellasite-related structures, a structural polymorph of the herbertsmithite structure with AA-stacked perfect kagome planes [8] (see Figure 1). For trivalent cations , e.g. = Nd - Dy, Y, an additional halogen atom is included, resulting in compounds with composition Cu3(OH)6Cl3 crystallizing with a trigonal crystal structure (space group 1, no. 164) [7]. For Nd, Sm canted antiferromagnetic order of the Cu magnetic moments has been found at around 20 K and 18 K [9]. Polarization of the rare-earth moments is indicated by a second anomaly in the magnetic susceptibility at 8 K and 6 K. For = Eu, we have reported two magnetic transitions at = 14.7 K and = 8.7 K, where the magnetism shows enhanced anisotropy and increased effective magnetic moments of and at 350 K. [7] The enhancement over the Cu2+ spin-only effective moment of 1.73 can be ascribed to polarization from the Van Vleck excited moment of Eu3+ cations. Also for = Eu a magnetic long-range order (LRO) transition occurs with a sharp magnon peak appearing in the magnetic Raman continuum below the magnetic transition temperature of = 17 K [10]. For = Gd, Tb, Dy similar magnetic transitions are observed at = 17 K, 16 K, and 17 K, respectively [11]. All these compounds show a similar additional magnetic transition from the polarization of the rare-earth ion. Gd, Tb, and Dy show additional peaks in the heat capacity at 4.5 K, 7.5 K, and at 6 K, respectively [11]. For = Y, a magnetic transition at = 15 K was detected by neutron diffraction [12] with clear magnetic Bragg reflections, but the Cu ordered magnetic moments are suppressed to 0.42(2). LRO for = Y is furthermore supported by static moments seen in SR experiments [13, 14]. The magnetic structure is similar to those of the Cd- and the Ca-Kapellasite systems [15, 16]. These two phases represent two examples of kapellasite family members with being a divalent ion, where the magnetic order at 4 K and 7.2 K, respectively is ascribed to strong Dzyaloshinskii-Moriya (DM) interaction. [13, 12, 14, 17] Hence, these 1 structural variants constitute a family of the kapellasite-type compounds, where in all cases magnetic field induced DM interaction causes ordering of the Cu ions with a transition for the rare-earth moments at around half , depending on by the paramagnetic rare-earth moments.
Interestingly, for the nonmagnetic cation A = Y the compound is not stable against water, leading to Cl - OH substitution. As a result phases with composition YCu3(OH)6+xCl3-x are formed, until the end-member Y3Cu9(OH)19Cl8 for = 1/3 is reached, which crystallizes with a trigonal structure (space group , no. 148) [18, 19]. This substitutional variant shows a distortion of the Cu lattice. The Y atoms move out of the kagome plane, being pulled away by the shorter (OH)-1 bond, thus generating two non-equivalent Cu sites and a unique magnetic lattice with three different nearest-neighbor exchange interactions is required [18, 20] to describe the experimental data. Similarly, Cd- and Ca-kapellasite have a H2O molecule occupying the same interplane site [15, 16] and Ca-kapellasite exhibits also Ca positions pushed out of the kagome planes, hence formation of a superstructure may also be expected [16]. For Y3Cu9(OH)19Cl8 chemical disorder-free crystals can be obtained which undergo LRO below 2.2 K, as spin waves were seen in inelastic neutron scattering, and fast damped oscillations in SR were detected [21]. Multimagnon modes were detected by terahertz time-domain spectroscopy, further confirming LRO, and a 1/5 magnetization plateau was observed [22]. Finally, in 1H-NMR a clear peak of the spin-lattice relaxation rate was detected at [23].
Recently, a phase with the very small trivalent cation In3+ was reported, crystallizing in space group 1, however with two different Cu sites leading to highly distorted kagome layers [24]. The compound shows short range order around 6 K and LRO around 2 K. Rare-earth ions with smaller ionic radii have not been studied yet.
In addition to the chlorides, the sister compound series YCu3(OH)6Br2[Brx(OH)1-x] was also synthesized [25]. Introducing additional site disorder by mixing Cl and Br the next level of complexity was reached [26, 27, 28]. For pure bromides, the crystal structure determination proposed a mixture of the two end members of the series, similar to the Cl system, with partial occupancy of both Y sites, located within and out of the kagome layers.[29]. Variations of have been reported [30, 31, 32] even reaching the composition YCu3(OH)6.5Cl2.5 [25, 33, 32, 34] . This finding comes as a surprise since it results in = 1/2, thus exceeding the superstructure scenario of the compounds with , i.e. a composition Y3Cu9(OH)19BrYCu3(OH)6.33Br2.66 [32]. Unfortunately in most studies reported so far, full crystal structure determinations were not performed. We recently were able to demonstrate that clean crystals of again realize the superstructure [19].
The Br system attracted particular attention. A term in the specific heat and a Dirac cone-shaped excitation spectrum found by inelastic neutron scattering experiments were interpreted as signatures of a Dirac spin-liquid ground state [31, 30, 6, 35]. Thermal transport studies revealed thermally activated phonon-spin scattering indicating a gapped magnetic excitation spectrum [33] and 1/9 and 1/3 magnetization plateaus were found [36, 34, 5]. In addition, quantum oscillations in torque measurements were observed for the first time in an insulator [36]. However, SR and NQR measurements revealed an inhomogeneous magnetic ground state with both fast and slow relaxing channels [37].
As mentioned above smaller trivalent site rare-earth cations have not been reported, so far. Here, we report on the whole series of rare-earth elements Cu3(OH)6+x(Cl,Br)3-x for both halogen anions, Cl and Br. In particular, focus on the syntheses, structure determination by single crystal XRD, magnetic susceptibility, specific heat and Sr measurements on selected examples showing the superstructure caused by the smaller rare-earth elements.
Results
Crystal Structure and Stoichiometry
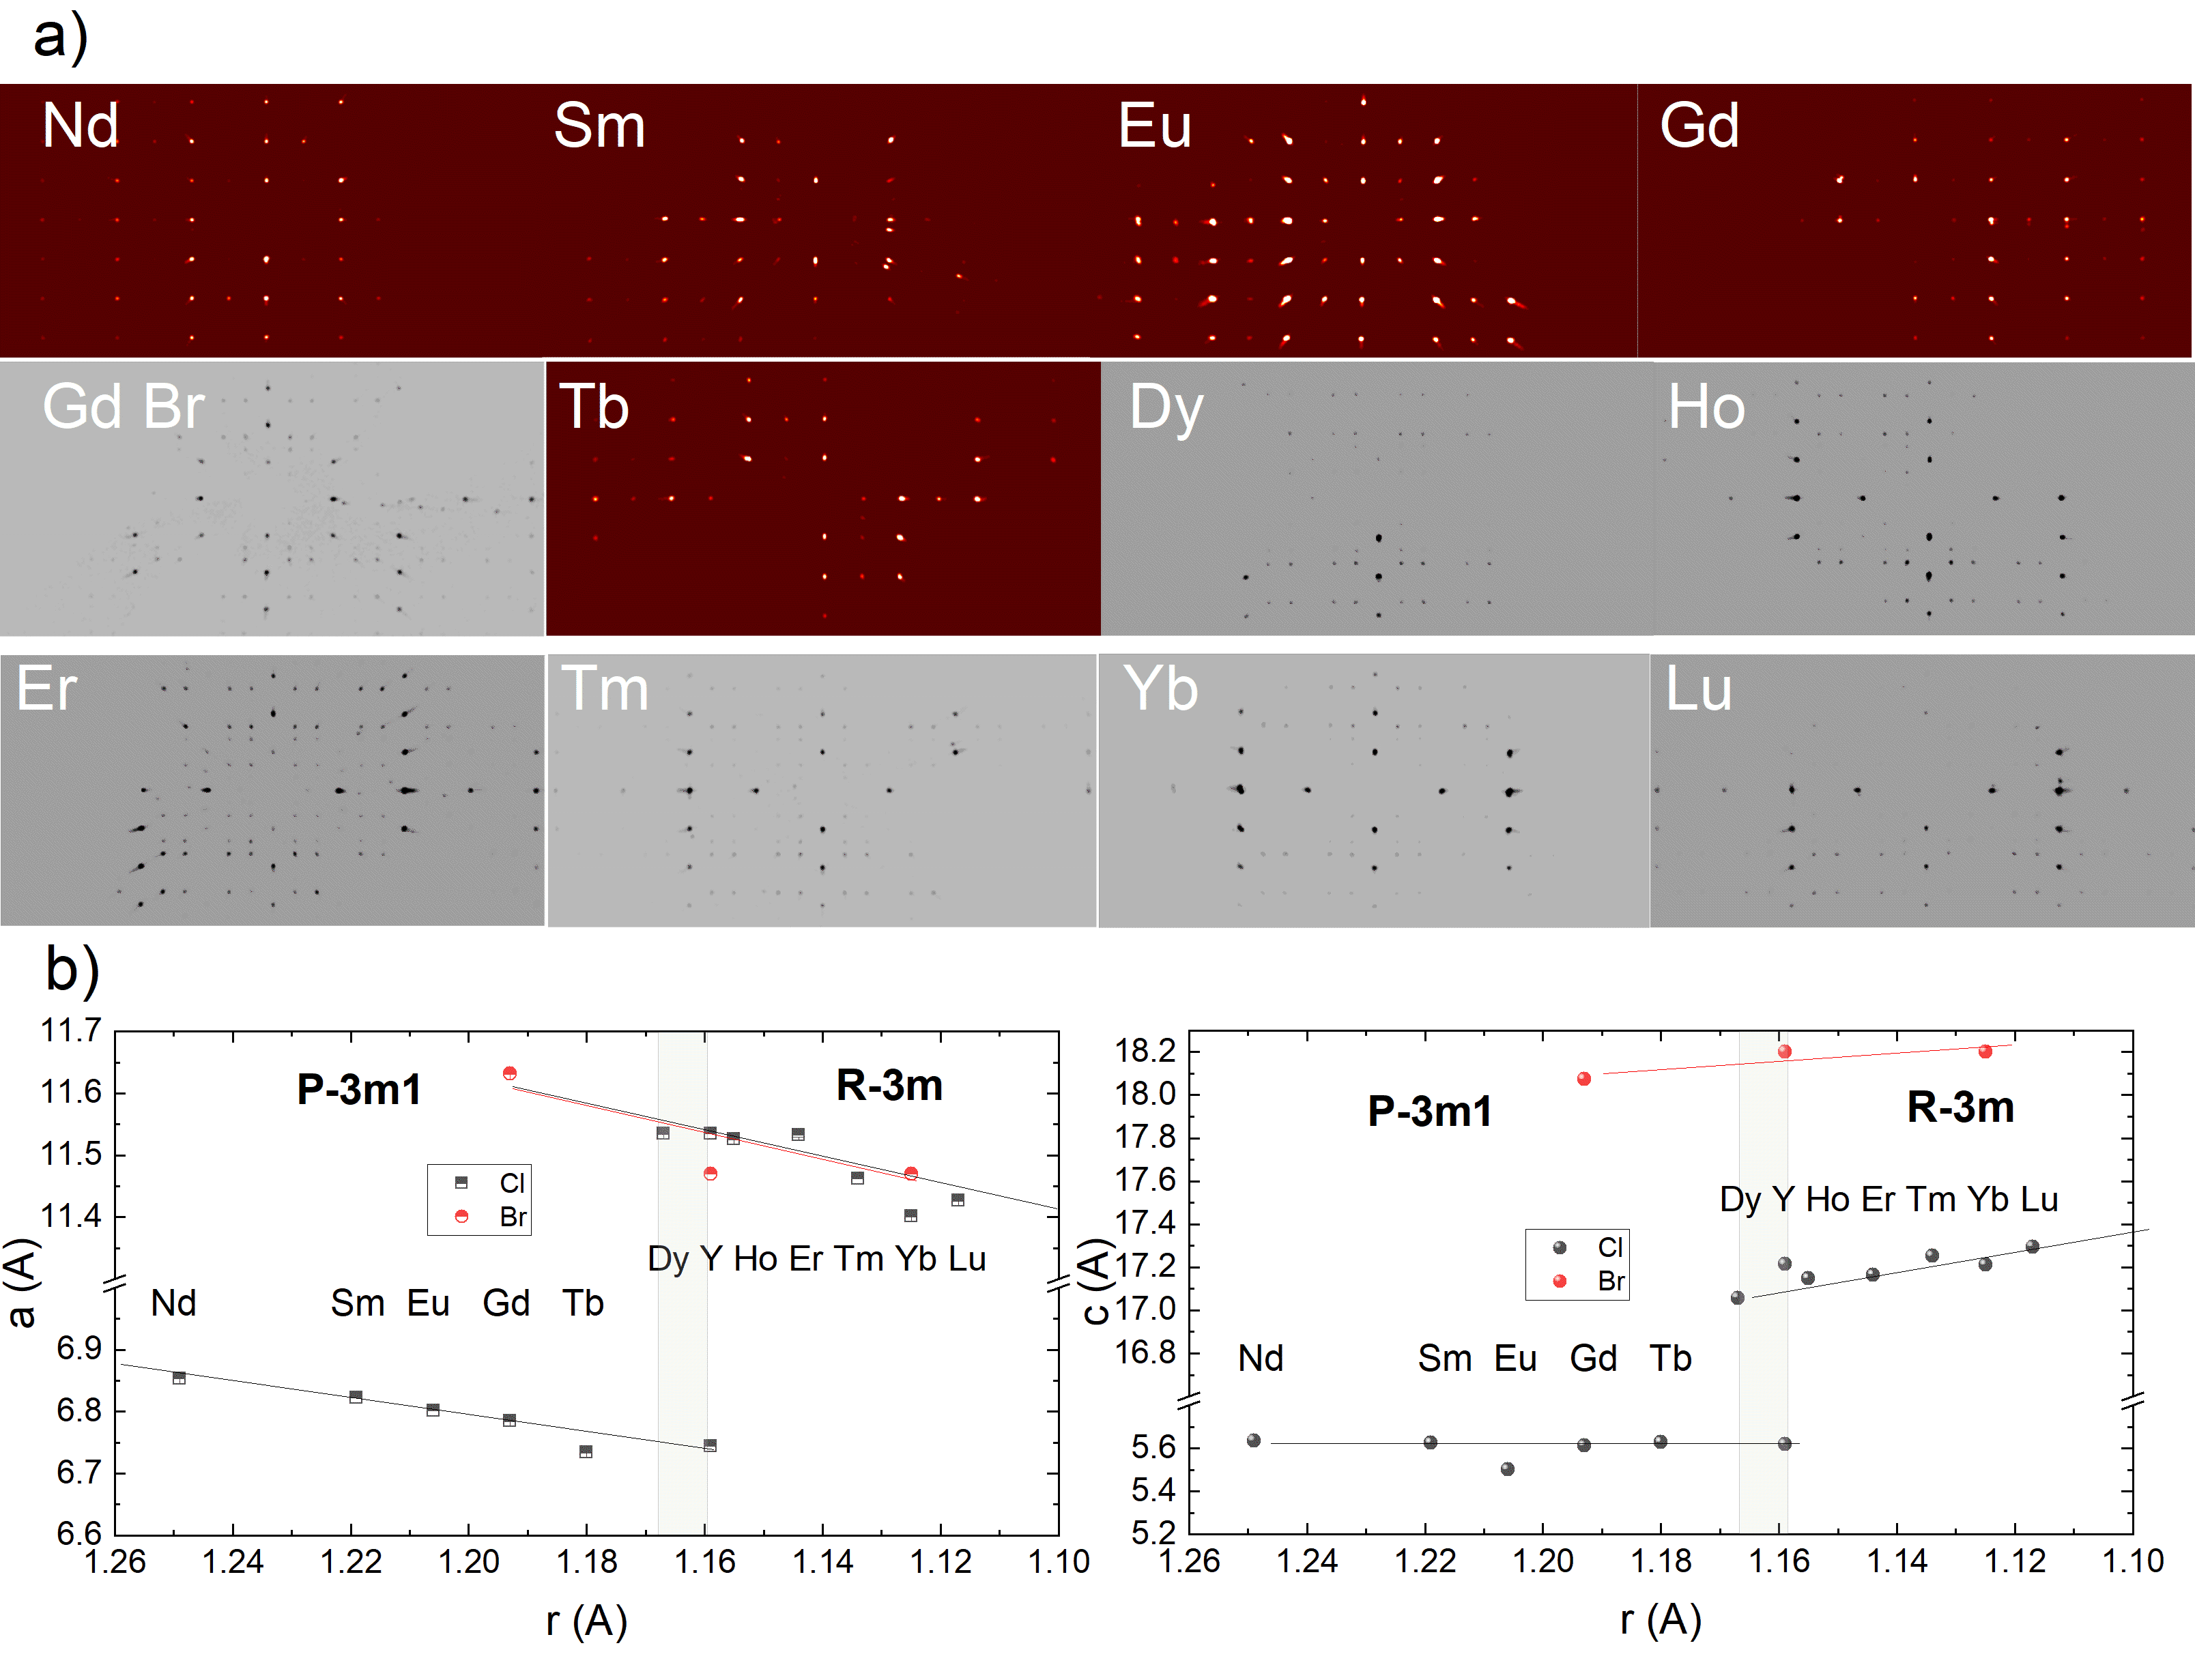
Figure 2 displays zonal diffraction maps of Cu3(OH)6+x(Cl,Br)3-x crystals, where is a rare-earth cation.
Cu3(OH)6+x(Cl,Br)3-x Kapellasite crystallizes for large site ions with a stoichiometry of as Cu3(OH)6(Cl,Br)3 in the trigonal space group 1 (no. 164). The lattice constants range around Å and Å (see Fig. 1 a,c). For smaller site cations instead a variant crystallizes with the composition Cu9(OH)19(Cl,Br)9 with the trigonal space group (no. 148). Here, the lattice constants range around Å, Å as shown in Figure 1 b,d). The supercell is a structural subunit of the compound Cu3(OH)6Cl3, occurring from the substitution of 1/9 of Cl- by (OH)-. Notably, blends of mixed have been reported for Y, Cl [9] and Y, Br [25, 30, 31, 32], but comparing the physical properties of the Cl phase [9] with twofold magnetic entropy release at 15 K and 2.5 K to the end-members with single entropy release at either 15 K or 2.5 K [21]. This findings rather indicates a inhomogeneous disordered phase mix whereas our optical transparent crystals always show clear superstructure Bragg reflections.
In Figure 2 a) we display (0 k l) zonal diffraction maps of Bragg reflections in red-white color of the subcell shown in Figure 1 a,c), which clearly differ to the supercell in black-white color, where clear additional Bragg reflections are observed. The superstructure realizes partially shorter bonds between the planes on substituting Cl- by (OH)- and hence the atoms start to move out of the kagome planes. This leads to a buckling of the kagome layers leaving behind two different Cu positions. The buckling shortens one of the Cu - Cu bonds to 3.26 Å (for Y), while the others remain at around 3.38 Å. This results in Cu - O - Cu bonding angles of 110°and 116°and 117°. The superexchange via Cu - O bonds is known to be strongly dependent on the bonding angle and is maximal for 180°. A phase diagram considering the change of exchange interactions has been theoretically investigated in Ref. [20]. The phase diagram for isolated and hence 2D kagome planes has three scenarios: , order at the corners and a classical spin liquid in the center, which is sketched in Fig. 4 c). Notably, in the presently investigated systems the site ions consist of magnetic rare-earth ions. These, however, are far separated and do not establish clear LRO Similar e. g. to the O3 perovskites [38, 39, 40]. There with rare-earth and Ni, Mn, V the rare-earth ions stay paramagnetic and mainly control the magnetism of the transition metal sublattice, a similar scenario proposed and discussed for the present compounds.
In Figure 2 b) and Table 1 we display and list the lattice parameters for varying site cations. With the reduction of the atomic radius of the -site cations , a compression of the in-plane lattice parameter takes place. Interestingly, the lattice parameter stays nearly constant for Cu3(OH)6Cl3 until the -superstructure with Cu9(OH)19(Cl,Br)8 is formed. Starting from = Dy the lattice parameter increases with decreasing radius of the cation. We attribute this effect to the built-up of chemical strain induced by in-plane compression due to the site reduction rather than to isotropic chemical pressure. Notably, we already observed the structural transition for = Dy, different to results reported earlier derived from investigations on a solid state sintered powder sample [11]. On the other hand, as reported before for the Y system both structural variants may co-exist, dependent on the presence of water molecules [13]. Fu et al. utilized a water-free solid-state sintering technique of DyClH2O 1:3 CuO, which can result in both structural variants, whereas our hydrothermal synthesis route clearly substitutes the 1 phase. Nonetheless as discussed in the magnetism section below we find tiny impurities of the 1 phase. We crosschecked the existence of the superstructure by combined Energy-dispersive X-ray spectra (EDX) and single crystal x-ray diffraction (XRD) analyses.
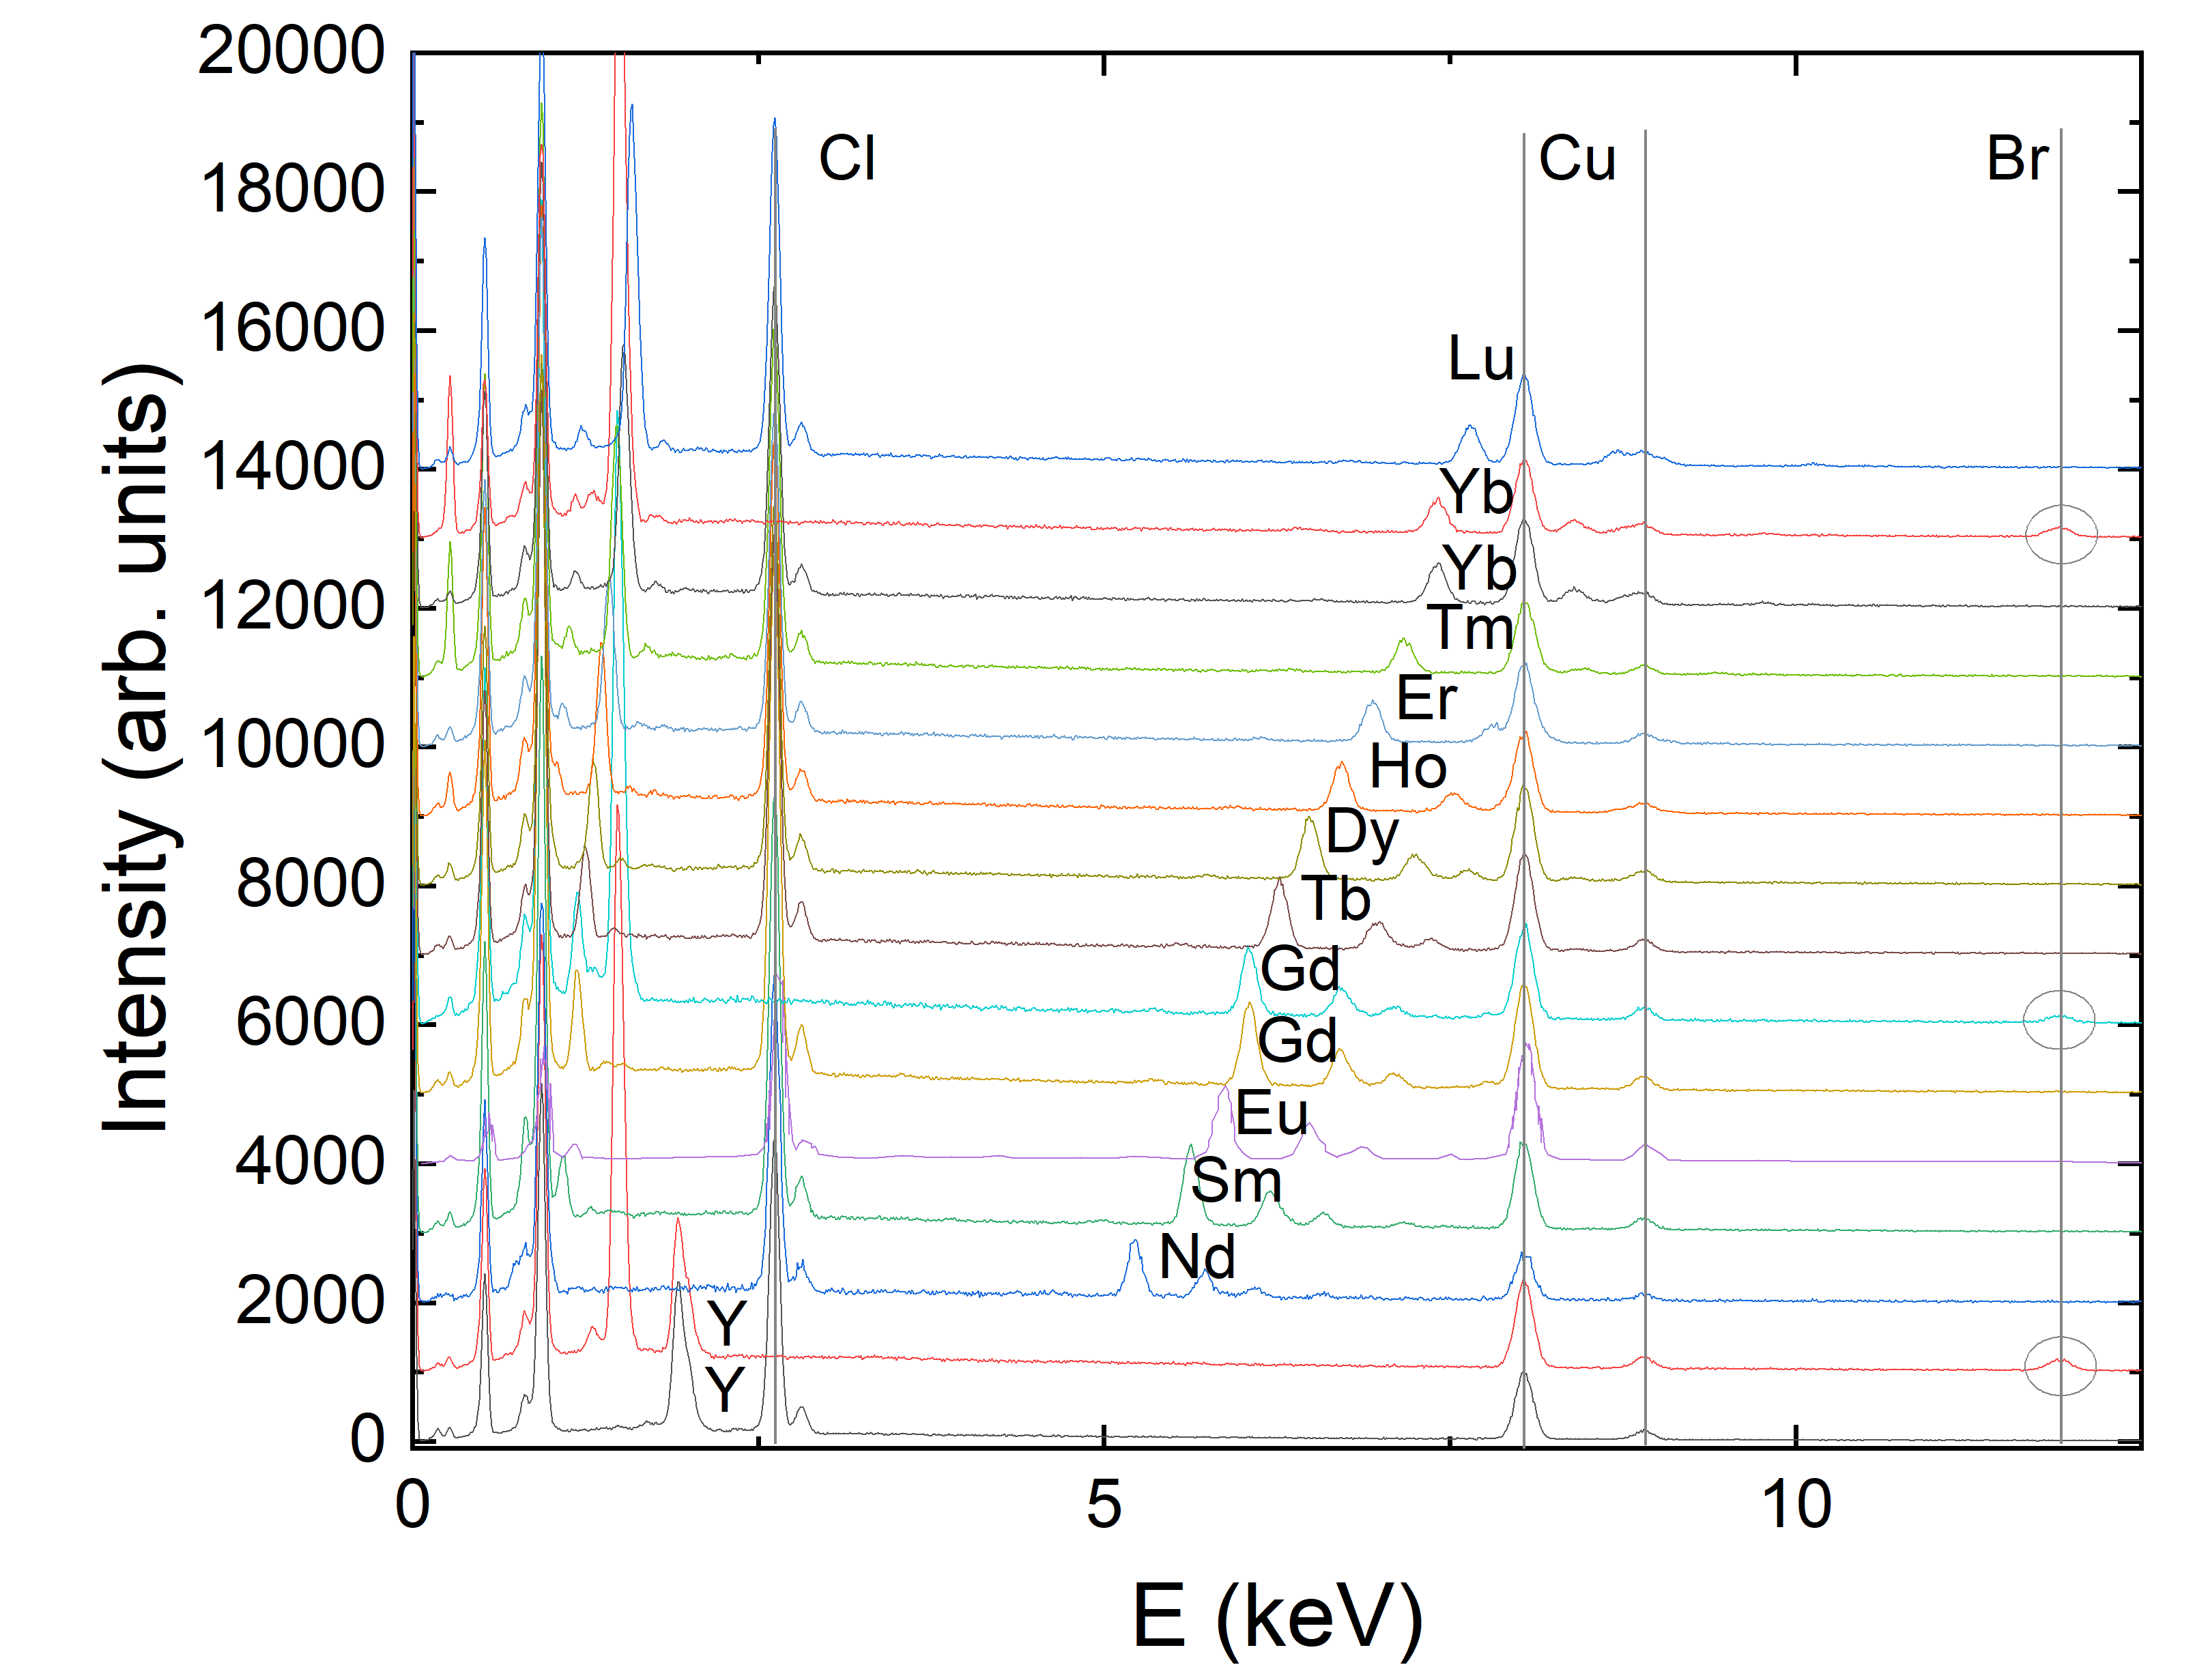
We ensure phase pure high quality crystals of all rare-earth cations by EDX analysis. Examples of spectra are shown in Fig. 3, revealing highly stoichiometric crystals all within standard error bars of the expected formula, with a continuous shift of the Lα line.
We further determined the change of the atom positions with site variation as summarized in Tab. LABEL:atompos. With decreasing site rare-earth atom radius the atoms slowly move out of the kagome plane, in line with the sudden jump to a new cell appearing at around = 1.16 Å when they have completely moved out of the kagome layers. The clearest trend is seen for the -component of the atom positions which changes by about , whereas the atom positions within the plane remain the same within experimental error. For the larger cell we see a continuation of this trend, that due to the increased amount of positions we do not list.

| Cl | Br | |||
|---|---|---|---|---|
| a (Å) | c (Å) | a (Å) | c (Å) | |
| Nd | 6.8535(5) | 5.6352(4) | ||
| Sm | 6.8227(5) | 5.6249(5) | ||
| Eu | 6.8014(9) | 5.5007(10) | ||
| Gd | 6.7851(8) | 5.6118(9) | 11.6314(10) | 18.0728(19) |
| Tb | 6.7343(11) | 5.6287(9) | ||
| Dy | 11.5344(9) | 17.0578(13) | ||
| Y | 6.7490(9) | 5.6244(11) | ||
| Y | 11.5575(11) | 17.211(2) | 11.5945(5) | 18.2302(11) |
| Ho | 11.5259(8) | 17.1478(14) | ||
| Er | 11.533(4) | 17.164(4) | ||
| Tm | 11.4618(10) | 17.252(2) | ||
| Yb | 11.4011(9) | 17.2116(17) | 11.4703(6) | 18.2018(10) |
| Lu | 11.4270(7) | 17.2952(15) |
| x | y | z | |||
| 1 | 1 | 0.5 | |||
| Cu | 0.5 | 0.5 | 0.5 | ||
| Cl | 1 | 1 | 0 | ||
| Cl | 2/3 | 1/3 | zCl | ||
| O | xrmO | yO | zO | ||
| Nd | Sm | Eu | Gd | Tb | |
| zCl | 0.8647(4) | 0.8639(4) | 0.8651(15) | 0.8624(6) | 0.867(4) |
| xO | 0.6099(7) | 0.611(2) | 0.613(2) | 0.6154(11) | 0.620(3) |
| yO | 0.8049(3) | 0.806(4) | 0.8065(11) | 0.8077(5) | 0.8100(17) |
| zO | 0.6316(7) | 0.633(4) | 0.633(2) | 0.6332(11) | 0.625(5) |
As mentioned above, for rare earth cations with radii less than that of Y, the 1 crystal structure does not survive and it converts into a structure described by the space group . However, the kagome lattice is distorted, as already found for Y. Looking at the structural trends one may assume a continuous tuning of the magnetic ground state following the magnetic phase diagram of the distorted kagome layers (see Fig. 4) [20]. The structural trends are best revealed by analyzing the Cu - O - Cu bonding angles. Starting from = Dy, we see a clear splitting of the Cu - O - Cu distances highlighted in Fig. 4 a): In case of the superstructure we always detect three different Cu - O bonding distances: there is the Cu1 atom, which slightly moves away from (1/6, 1/3, 1/2) and Cu2 atom, which remains at a high symmetry position of (0 1/2 1/2). Cu1 creates a hexagon via the Cu1 - O - Cu1 bond, with a large Cu - O distance extending from the initial Cu - O distance of 1.98 Å to 1.99 Å (see Fig. 4 a). These hexagons promote the exchange path (orange line in Fig. 1 d) with the largest bond angle as plotted in Fig. 4 b). Next is the Cu1 - O - Cu2 bond labeled as , which is unchanged from the parent 1 crystal structure showing a linear compressing trend and its Cu - O - Cu bond promotes the magnetic exchange path (blue line in Fig. 1 d). Finally, one bond shortens strongly labeled as . The Cu2 - O - Cu1 angle is the relevant one, defining the degree of distortion. It has the lowest bond angle observed at around 110, resulting in a decreased exchange interaction (green line in Fig. 1 d). In Fig. 4 c) we display the magnetic phase diagram of the distorted kagome lattice. Experimentally we showed that for Y we are very close to the SL border [21]. With disorder as evidenced by our powder samples [13], or the mixed Y occupation found in the Y and halogen = Br case with composition YCu3(OH)6Br2[Brx(OH)1-x] [30, 6] the magnetic order is already destabilized and a SL state is realized.
From our study of spin waves in the Y case using inelastic neutron scattering experiments, we found that K and K determined at a temperature of 1.55 K [21] (note the positive definition of AFM interaction). Using our lowest temperature diffraction result summarized in Fig. [21] we know the angles of and are 117 and 117.5 averaging to and has the angle . Consequently we can use a linear fit to establish the change of the exchange interactions for the angles that do vary within 108 to 120 as observed in our XRD analysis. We assume a simple linear dependence of the exchange interaction in relation to the Cu - O - Cu angle determining the strength of magnetic superexchange summarized in the equation
| (1) |
This results in a crossover from antiferromagnetic to ferromagnetic exchange at 105.83 in agreement with findings e.g. for haydeiite [41] stating a transition at around 105. For the closely related kapellasite ZnCu3(OH)6Cl2 with only one Cu - O - Cu bond of an angle of 105.5 an exchange interaction of -12 K [42] was found consistent with a value of -4.5 K derived from eq.(1). Another example is the system herbertsmithite ZnCu3(OH)6Cl2, where an exchange interaction of 180(10) K [43] with a kagome bond angle of 119 [19] was found comparing well with a value of 158 K obtained from eq.(1). Applying the relationship to our diffraction results we find clear exchange interaction ratios that are displayed in the phase diagram in Fig. 4 c) extracted from Ref. [20] indicating that chemical pressure moves away from the border and thus the largest ion with the superstructure GdCu3(OH)6Br3 could indeed reside in the SL region.
Magnetic Susceptibility
To characterize the magnetic ground states we performed magnetic susceptibility measurements. For the large site ions Nd - Tb these measurements have been reported in Ref. [9, 7, 11]. As discussed in the Introduction, in case of the 1 structure magnetic order from considerable DM-interaction occurs around 15 K, with a propagation vector resulting in a 120 order as already known from the Ca and Cd variants.
By decreasing the size of the site cations, we find our Dy-based single crystals have already formed the superstructure in contrast to other reports. The Dy-compound marks the first superstructure system with the largest cation. This magnetically completely non-characterized system will be discussed below. Next in size to Dy is Y. For this superstructure system various reports on its magnetic properties exist [18, 13, 22, 21].Around K a magnetic order transition is observed with only 10% of the expected magnetic entropy [18], and a small moment of only 0.38 was extracted from SR [21]. In INS experiments spin-waves at 2/3 and 4/3 were observed confirming the in-plane order in the kagome-layers as predicted by theory [20]. Observation of a multi-center magnon further confirms a LRO scenario [22] supported by 1H-NMR experiments which found a clear peak of the spin-lattice relaxation rate at [23]. However, this order is not very pronounced in magnetization measurements, where only at lowest temperatures, far below the transition, several humps are seen. [22] Notably, in data a plateau at around 0.2 is observed that is sharper in the direction, but similarly visible along , as shown in [19, 22]. The only other superstructure system reported so far, is given by Gd with Br as the halogen whereas the Cl system crystallizes with the 1 structure.[44] Here, no clear magnetic transitions are seen in the susceptibility. A peak in the specific heat is observed at around 2.5 K comprising an entropy of only 10 J/mol K-1 corresponding to exactly 10% of the maximum magnetic entropy of 103.73 J /mol, as found in the Y system.
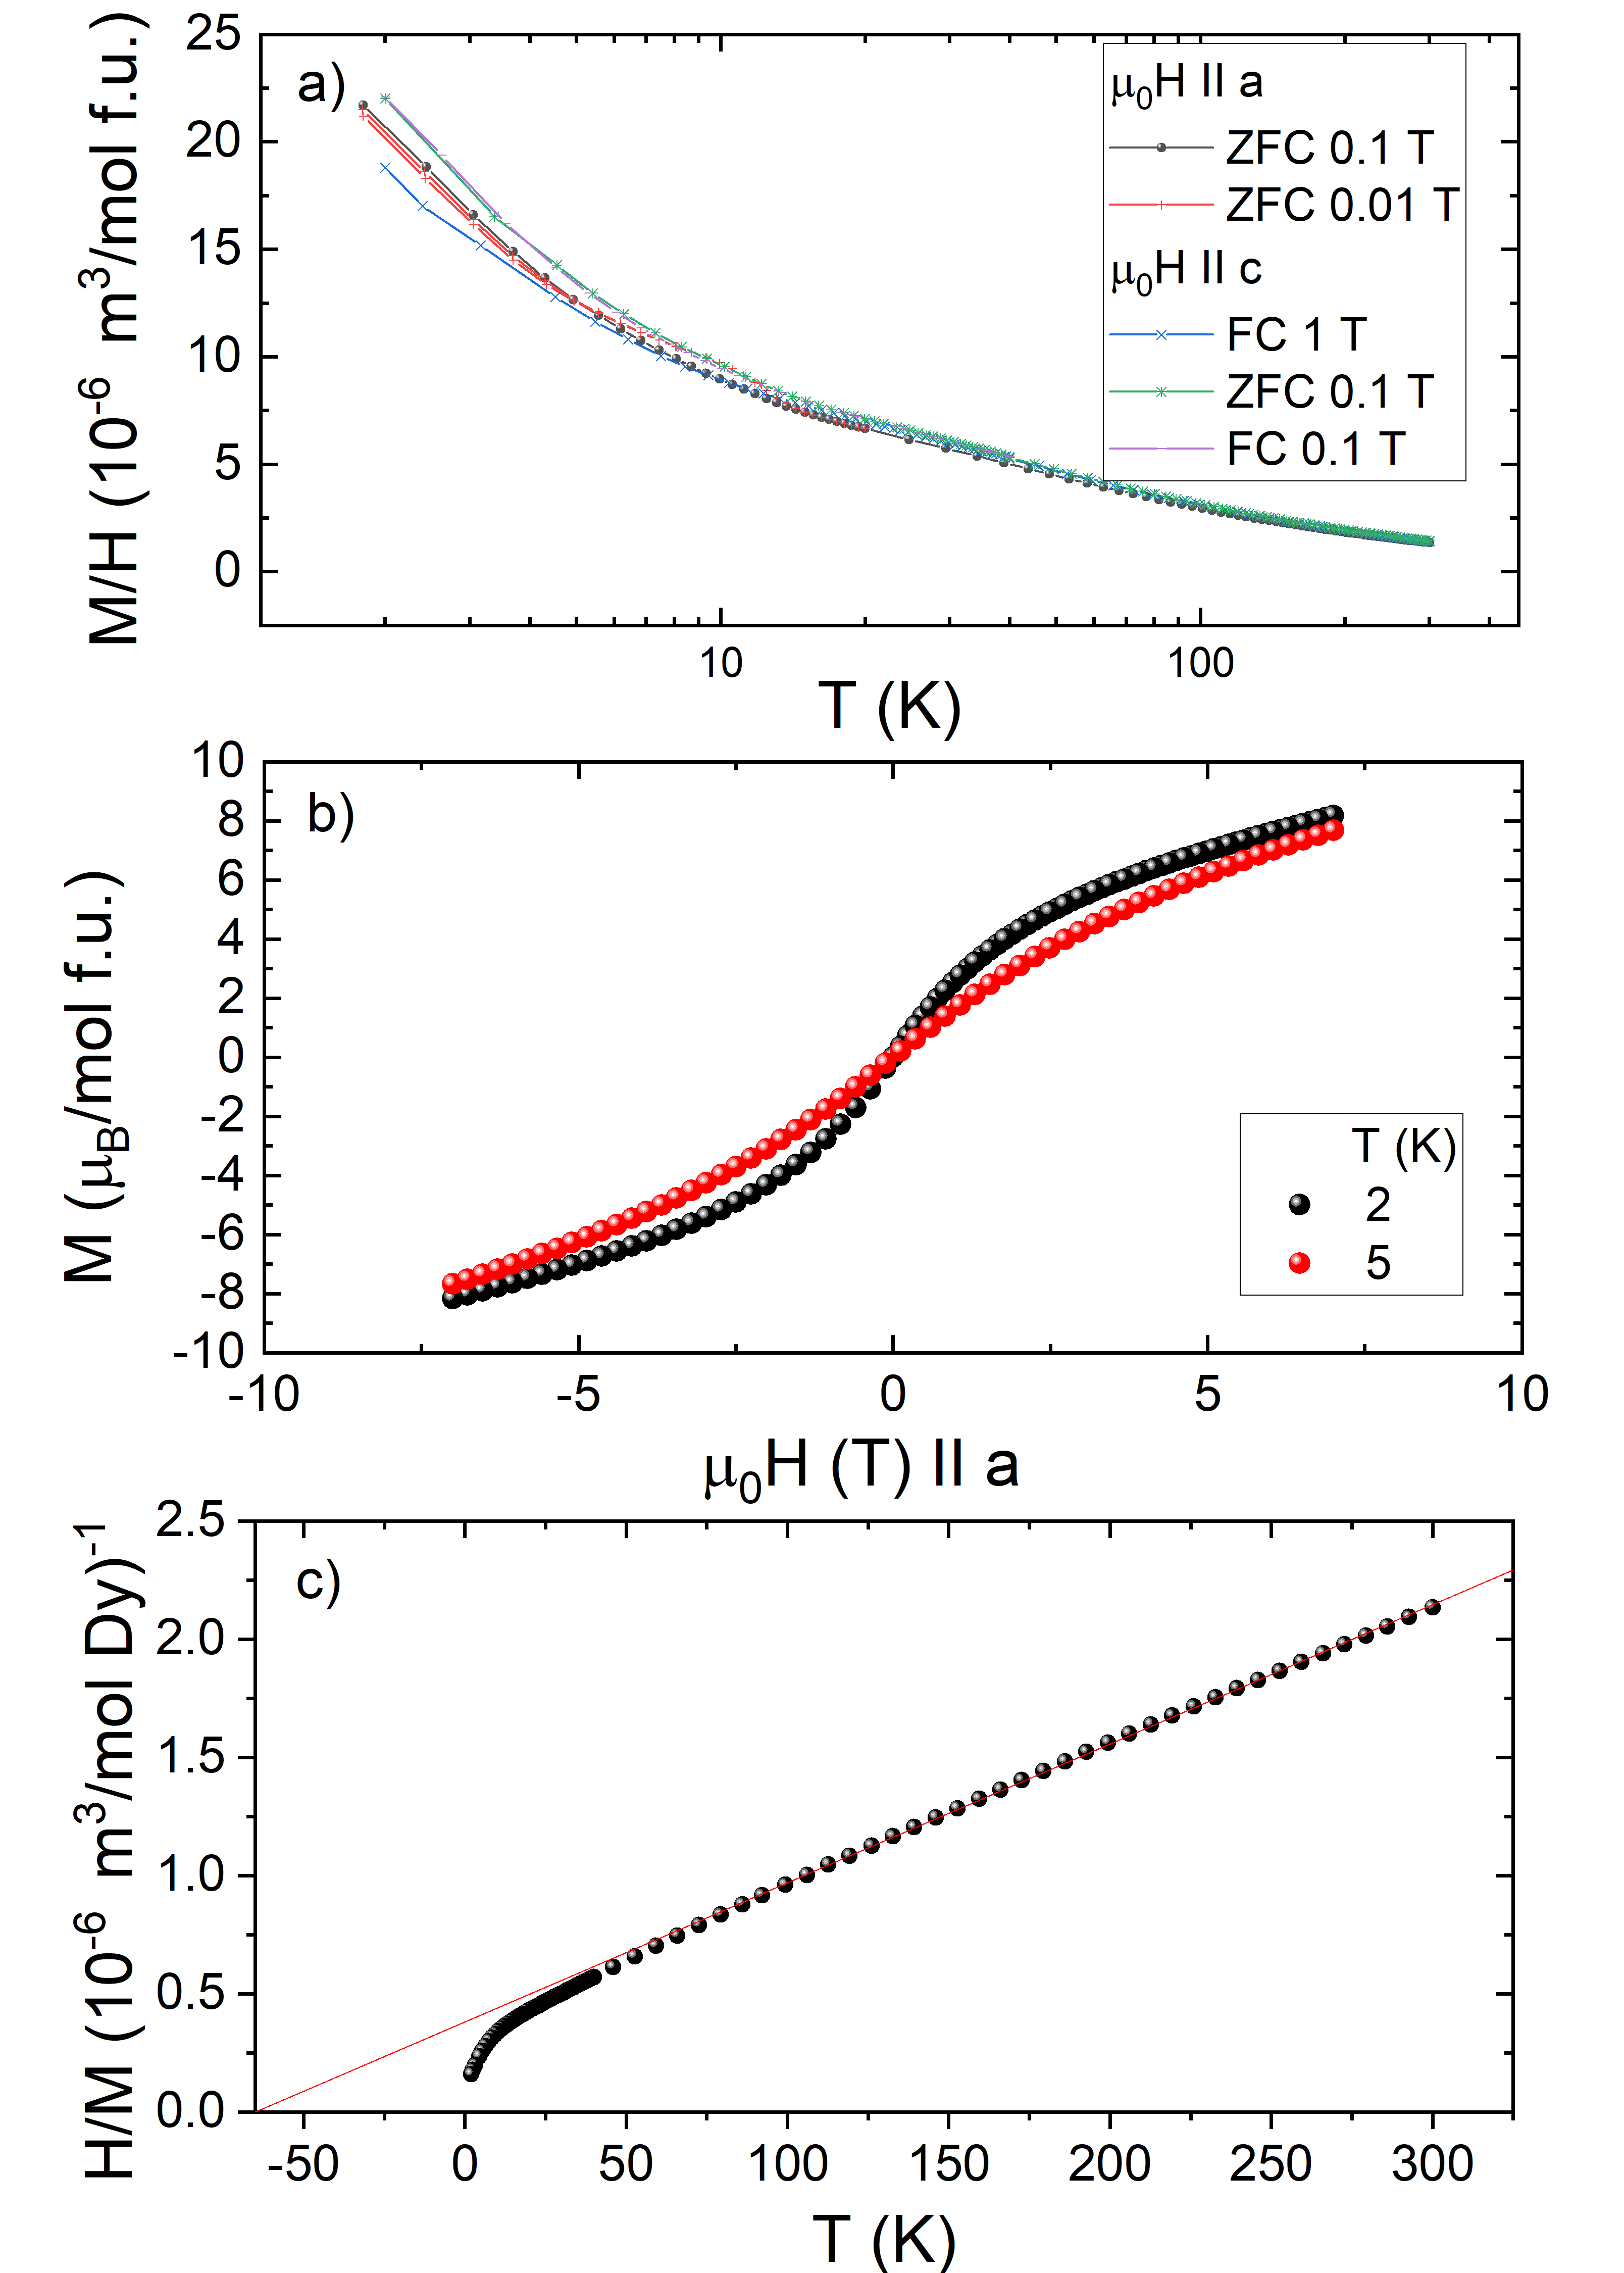
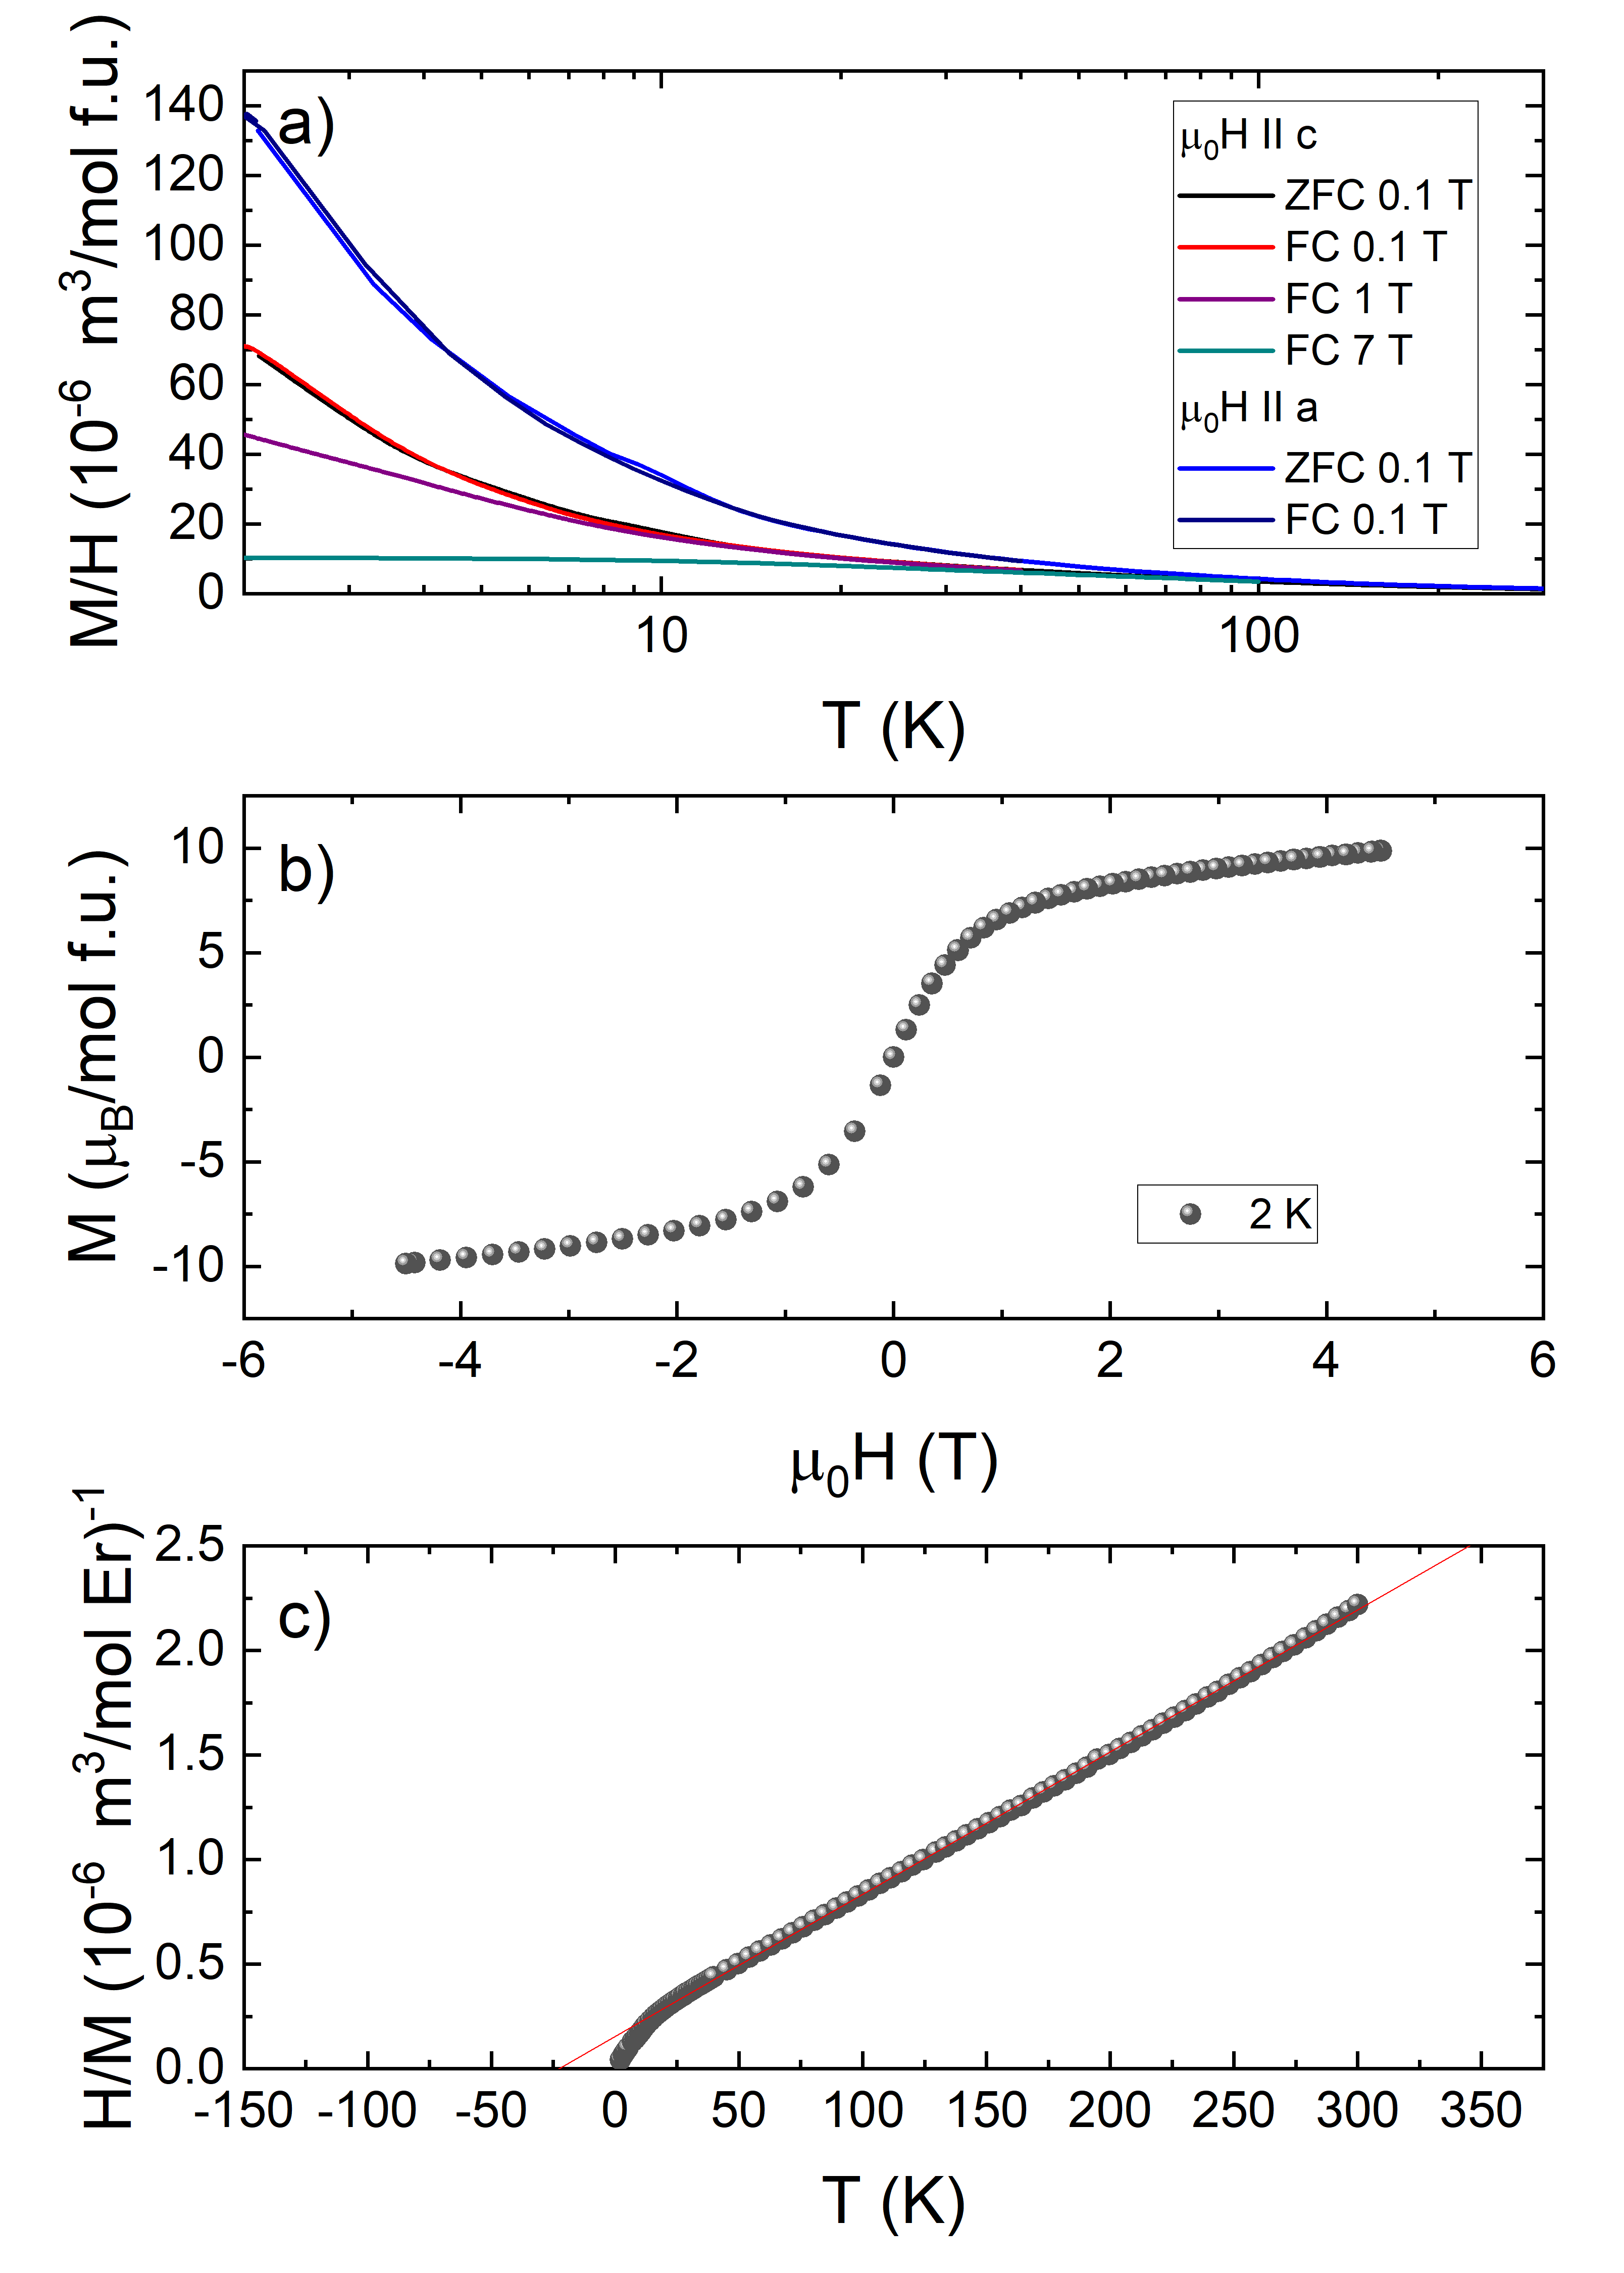
Now we focus on the system Dy3Cu9(OH)19Cl8. In Figure 5 a) we show the magnetic susceptibility versus temperature in a semi-logarithmic scale for varying field strength applied both along and directions. Even with the semi-logarithmic representation the field dependence is small and neither magnetic transitions nor anisotropy is apparent. The magnetization versus field is plotted in Fig. 5 b). At 7 T the magnetization starts to slightly level off around 8 per formula unit (f.u.), which is still far from the maximum moment of that may be expected per formula unit for Dy3Cu9(OH)19Cl8. The observation of a subtle leveling off of the magnetization suggests a possible 1/3 plateau or 0.33 as observed for the Y-variants cases [19, 34].
The magnetic susceptibilities of rare-earth ions (except Gd) are largely determined by crystal electric field effects and Curie-Weiss behavior can at best be expected at very high temperatures [45]. The fitted effective moments obtained from the high-temperature susceptibilities are commonly in fair agreement with the expected , where is the Landé -factor and the total angular momentum. Derived Curie-Weiss temperatures from fits of the high-temperature susceptibilities are largely determined by crystal field splitting of the multiplets and consequently do not allow meaningful conclusions about exchange interactions.
We show in Fig. 5 c) the inverse of the susceptibility and apply a Curie-Weiss fit in the range of 100 - 300 K, yielding a subtly reduced Curie-Weiss temperature of -65(2) K compared to -100(4) K for Y [18]. The effective moment obtained from the slope of 0.0056(2) for the inverse susceptibility per Dy amounts to 10.7(3) , in line with the expected value dominated by the rare earth moment as one Dy3+ has effective moments of 10.6 and 3 Cu2+ cations each would contribute with 1.8 leading to an expected effective moment of consistent with our findings.
Next, in Figure 6 a) we show the magnetic susceptibility versus temperature in a semi-logarithmic scale, for Er3Cu9(OH)19Cl8 at varying field strength applied both along and direction. Again we see no clear magnetic transition, but the field dependence and anisotropy is enhanced. The magnetization versus field is plotted in Fig. 5 b), where each Er3+ cation contributes with 9 . Similarly, around 7 T the magnetization levels off and we are close to a plateau, which would be more apparent at lower temperatures. The moment lies around 10 , comparing to , as expected for full polarization of the Er and Cu magnetic moments. Here, extrapolating the temperature dependence we can expect 12 around 0.5 K stabilizing a 1/3-plateau or 0.33 .
As shown in Fig. 5 c) a Curie-Weiss law was fitted in the range of 100 to 300 K with a K. The slope of 0.0068(2) corresponds to an effective moment of 9.7(2) close to the expected value of per Erbium atom.
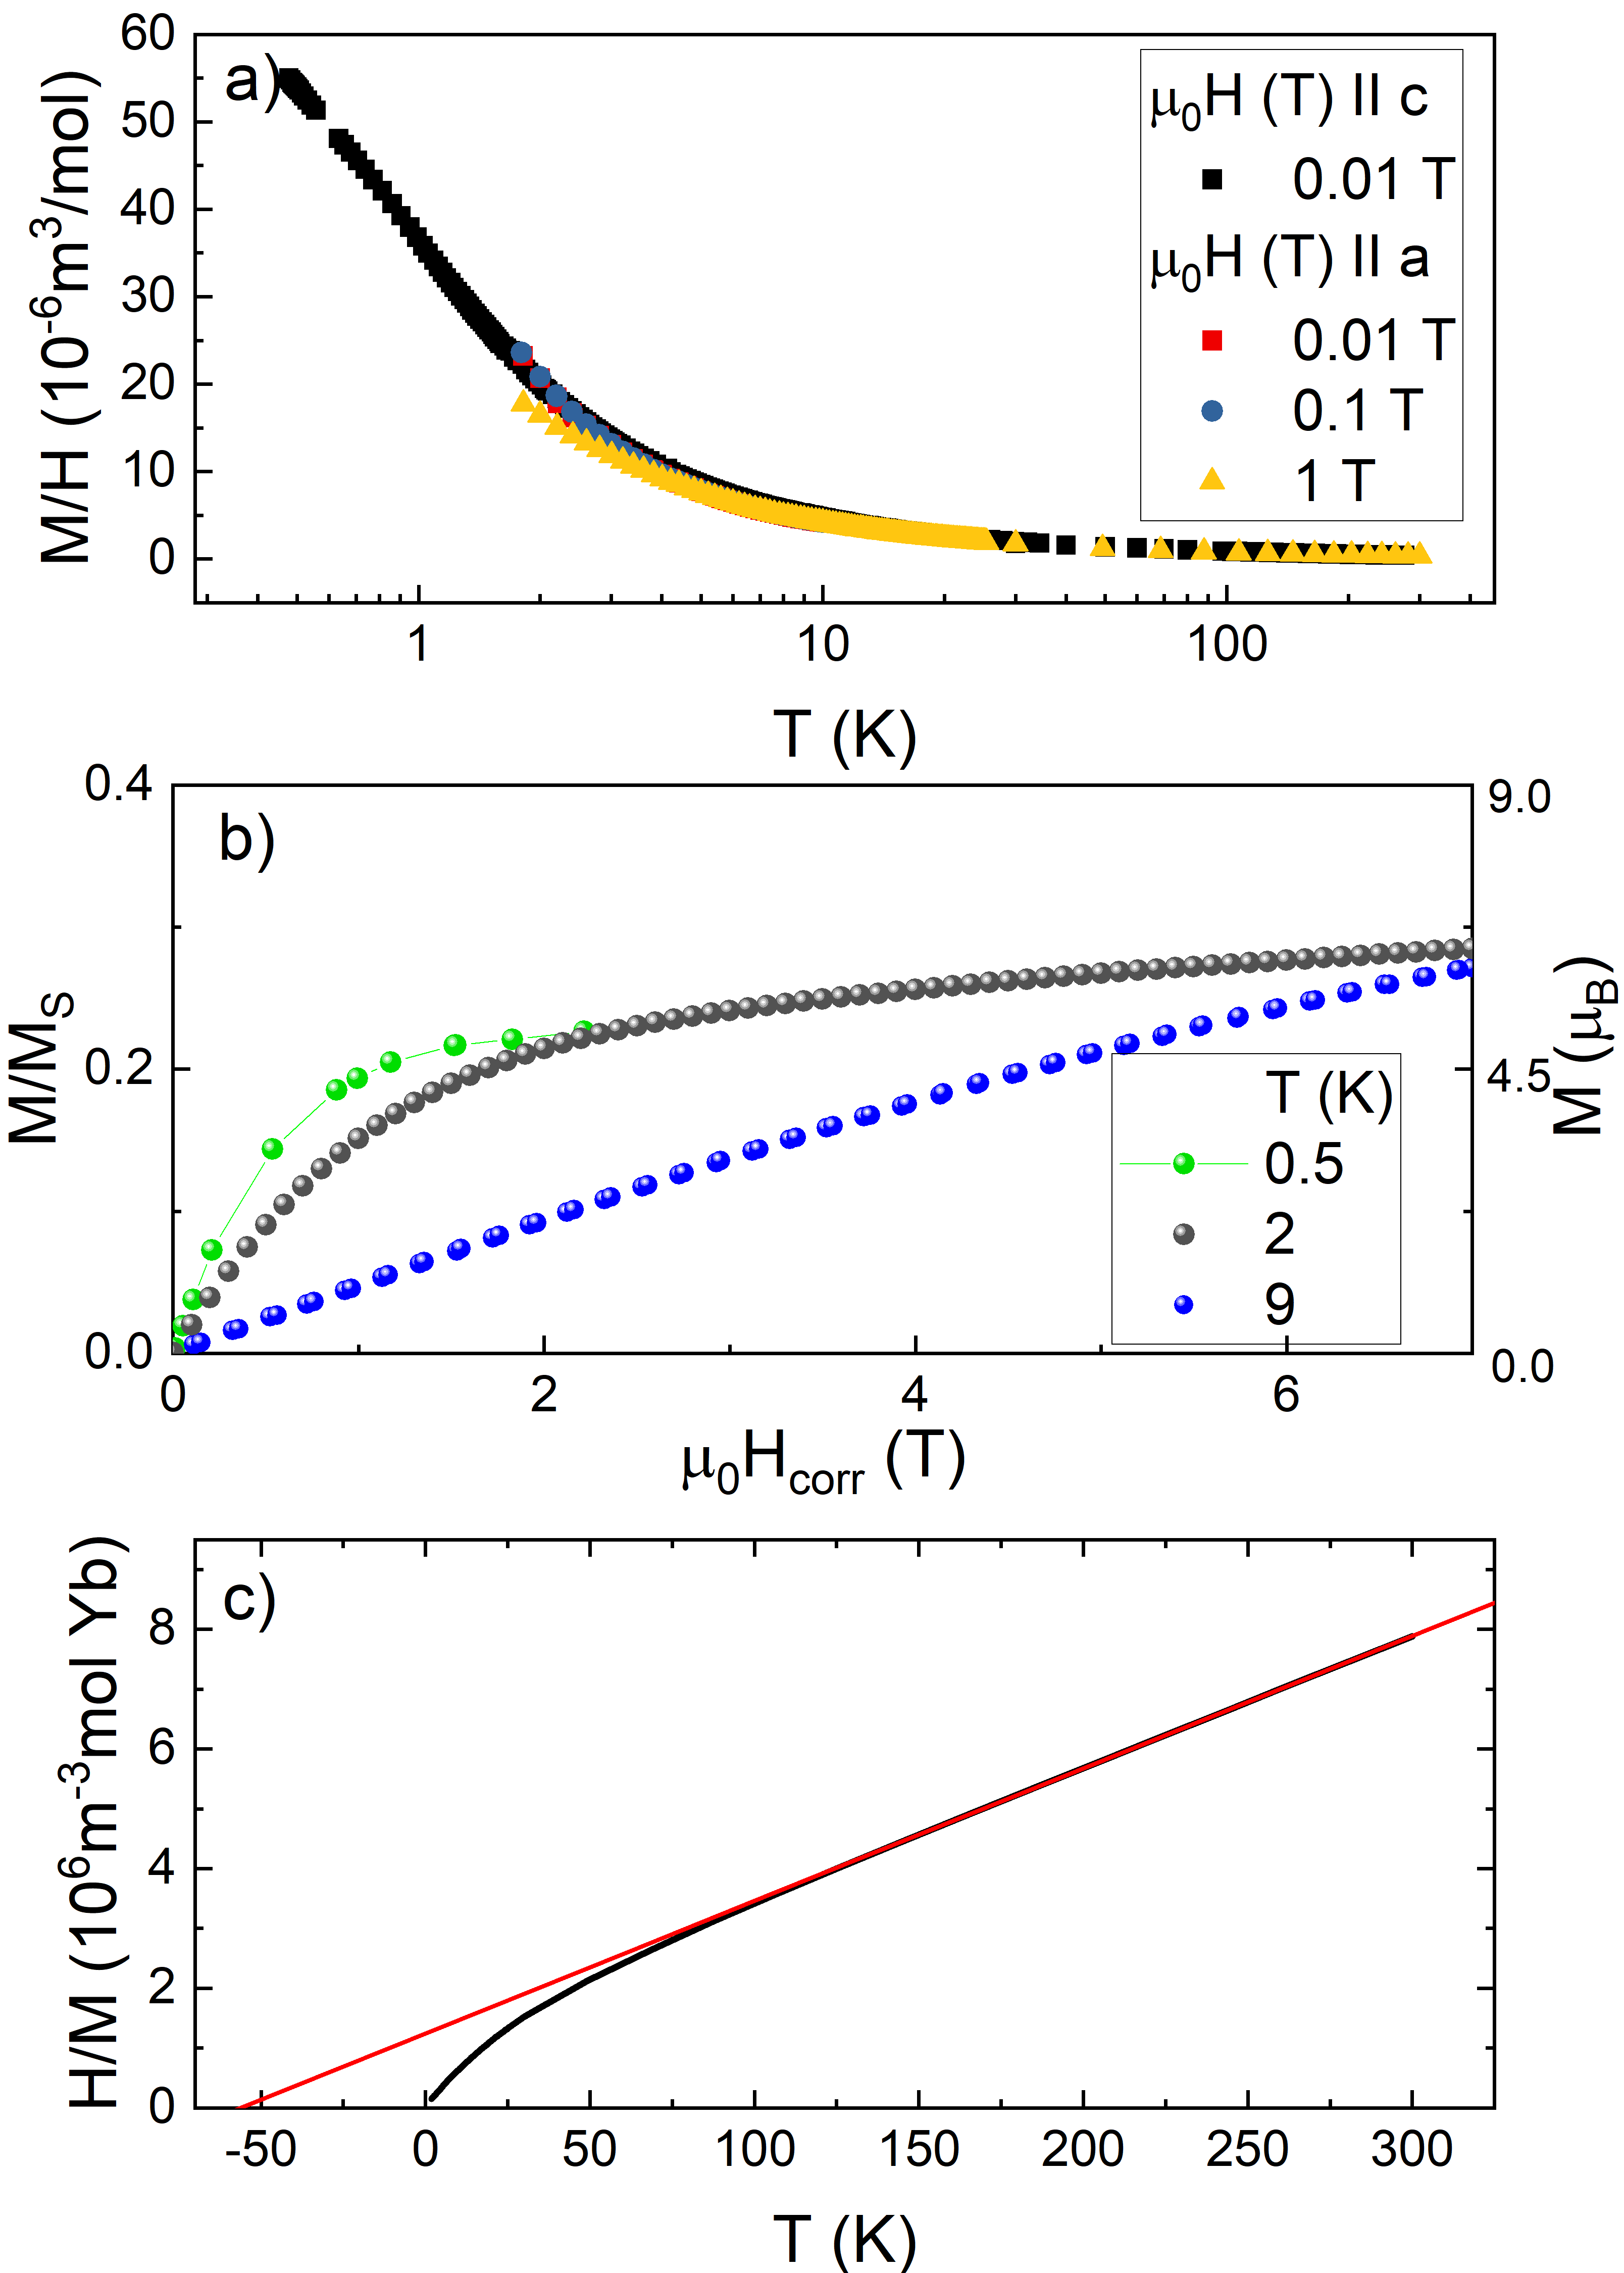
Yb3Cu9(OH)19Br8 presents an interesting candidate as structurally it is very close to the Dirac spin liquid candidate YCu3(OH)6+xBr3-x [19, 5, 6], and thus resides at nearly the same point in the phase diagram (see Fig. 4 c). Notably, with a similarly magnetic crystal field ground state of the rare-earth ion on the site it is worth to study its influence on the ground state properties. In Figure 7 a) we show the magnetic susceptibility versus temperature in a semi-logarithmic scale, for Yb3Cu9(OH)19Br8 at varying field strength applied both along and direction. Again we see no clear magnetic transition. The magnetization versus field is plotted in Fig. 7 b). The measurement at 0.5 K and 2 K show a clear plateau. The magnetic moment of the plateau lies around 6.5 compared to , as expected for full polarization of three Yb3+ and nine Cu2+ magnetic moments. Hence the moment of 6.5 again best corresponds to a 1/3-plateau or 0.33. We show a Curie-Weiss law fit in the range of 100 to 300 K in Fig. 5 c) yielding K. The effective moment amounts to as compared to the expected for the combination of one Yb3+ and three Cu2+ moments, well in line within experimental error.
Accordingly, all superstructure variants around room exhibit a temperature dependence expected for a paramagnetic contribution from all magnetic moments. At low temperatures no clear magnetic transitions are apparent and the magnetic anisotropy is minimal as expected for the Cu but not for the rare-earth cations hinting at their paramagnetic nature. Magnetization plateaus at low temperatures are found, with Dy deviating due to disordered mixed crystals as discussed in the following.
Specific heat
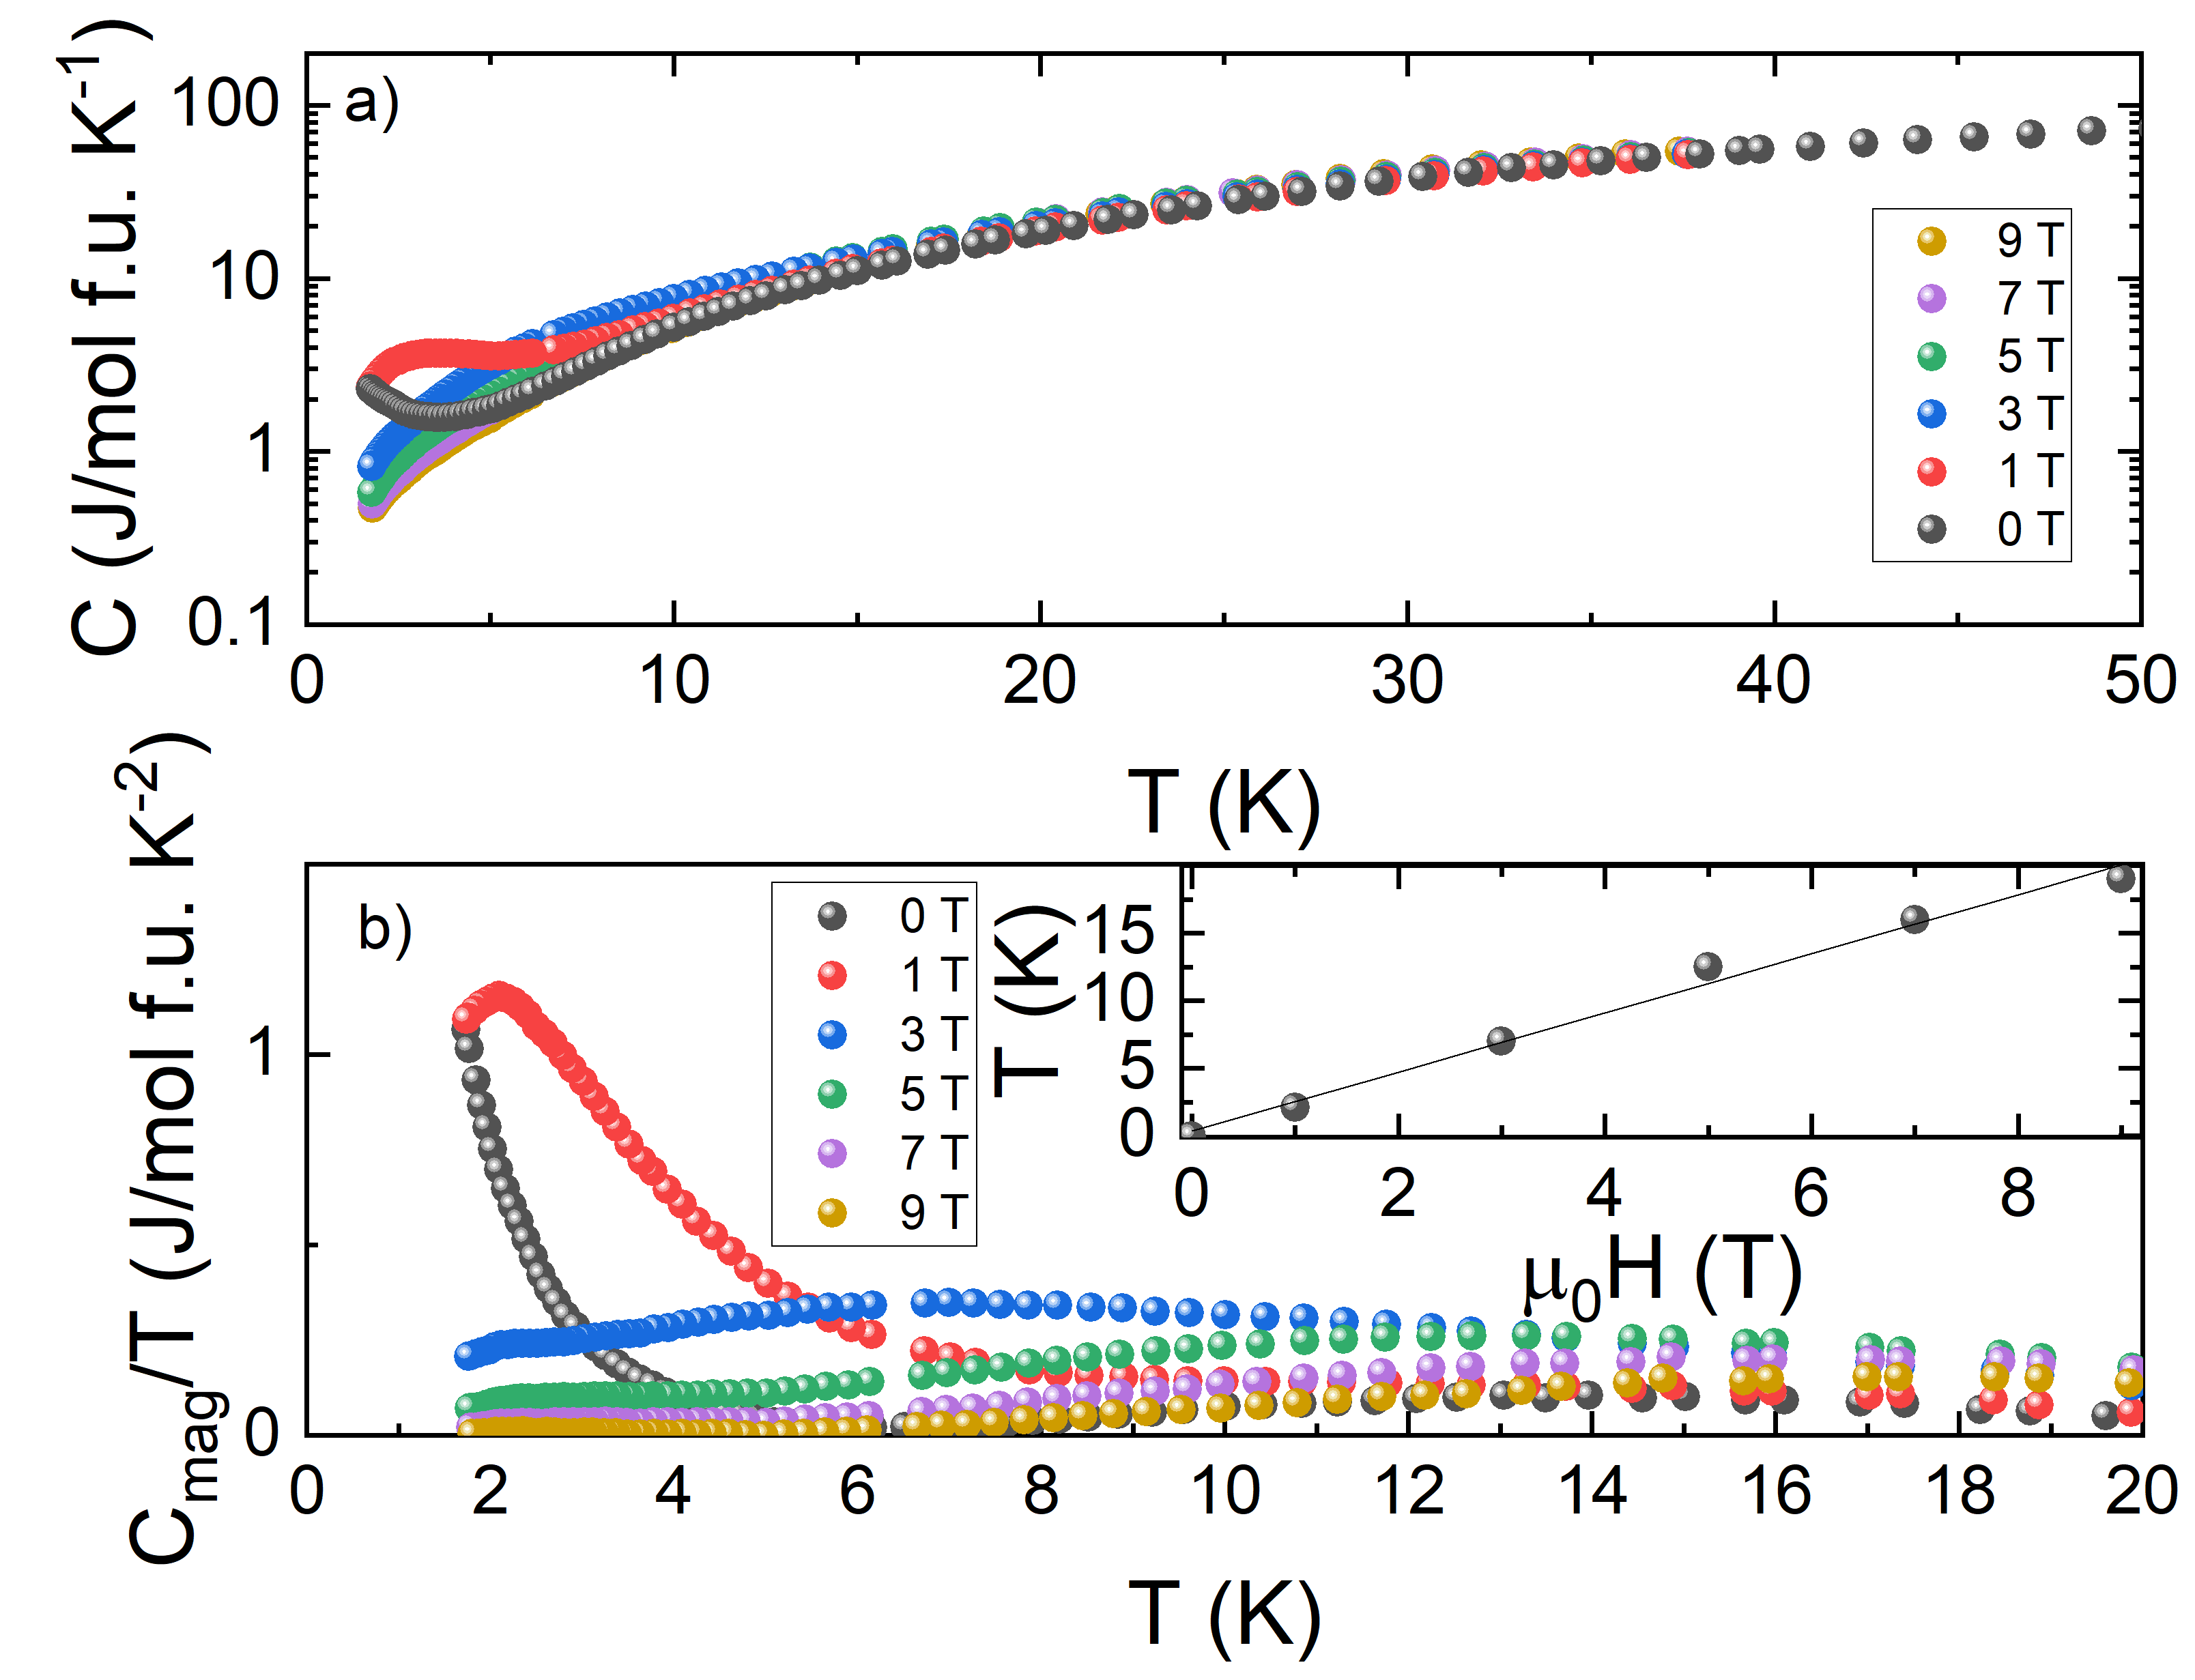
Next, we study the specific heats starting with Dy3Cu9(OH)19Cl8. In Fig. 8 a) the specific heat versus temperature of Dy3Cu9(OH)19Cl8 is displayed in a large temperature range for varying magnetic fields with a semi-logarithmic scale to visualize the maximum developing at around 2.5 K. This maximum strongly shifts with the application of external fields and broadens. In Fig. 8 b) we show the low temperature part of the magnetic contribution to the specific heat divided by temperature . The magnetic contribution was obtained by subtracting the phonon contribution approximated assuming a Debye temperature of 603 K estimated by a linear fit of vs in the temperature range of 5 to 20 K. Early reports of results reported for powder samples of Dy3Cu9(OH)19Cl8 showed it to crystallize in the 1 structure known to exhibit LRO around 15 K. While our crystals showed superstructure reflection, we still find considerable entropy release around 15 K, even in zero field, hinting at impurities of DyCu3(OH)6Cl3 or at a crystal with mixed values leading to site disorder on the Dy site. Notably, the release of magnetic entropy around 2.5 K is hard to estimate since the peak is not yet at its maximum even at our lowest temperature of 1.8 K. If we extrapolate the data in an external field of 1 T assuming a behavior fitting to spin-wave contributions found for the Y case, we find an entropy of around 4.5 J/mol K-1. The magnetic entropy can be estimated via ln, with 3 Dy3+ and 9 Cu2+ we have a total entropy of lnln J/mol f.u. K-1, assuming a crystal field doublet as ground state of the Dy3+ cations. Hence only 6.5% of entropy is released in this magnetic transition. This is less than oberved for the Y system which releases 10% [18, 21]. However, for Dy additional entropy is already released around 15 K in a broad peak. While our single crystal XRD clearly show superstructure reflexes, the entropy release around 15 K is ascribed to a mixed system of 1 and leading to a variation of Cl and OH content as is similarly observed for YCu3(OH)6+xCl3+x [21].
At higher fields a splitting of the Kramer’s doublet ground state of Dy3+ of the rare-earth e.g. Dy3+ ion is expected and for field smaller than the crystal field splitting a shift of the specific heat maximum linear with field may be expected. Via a straightforward linear fit of one can estimate the -factor of the crystal field ground state. This is shown on the inset of Fig. 8, extracted from the maximum in the magnetic contribution in of the main panel. The slope corresponds to a -factor of 3.25.
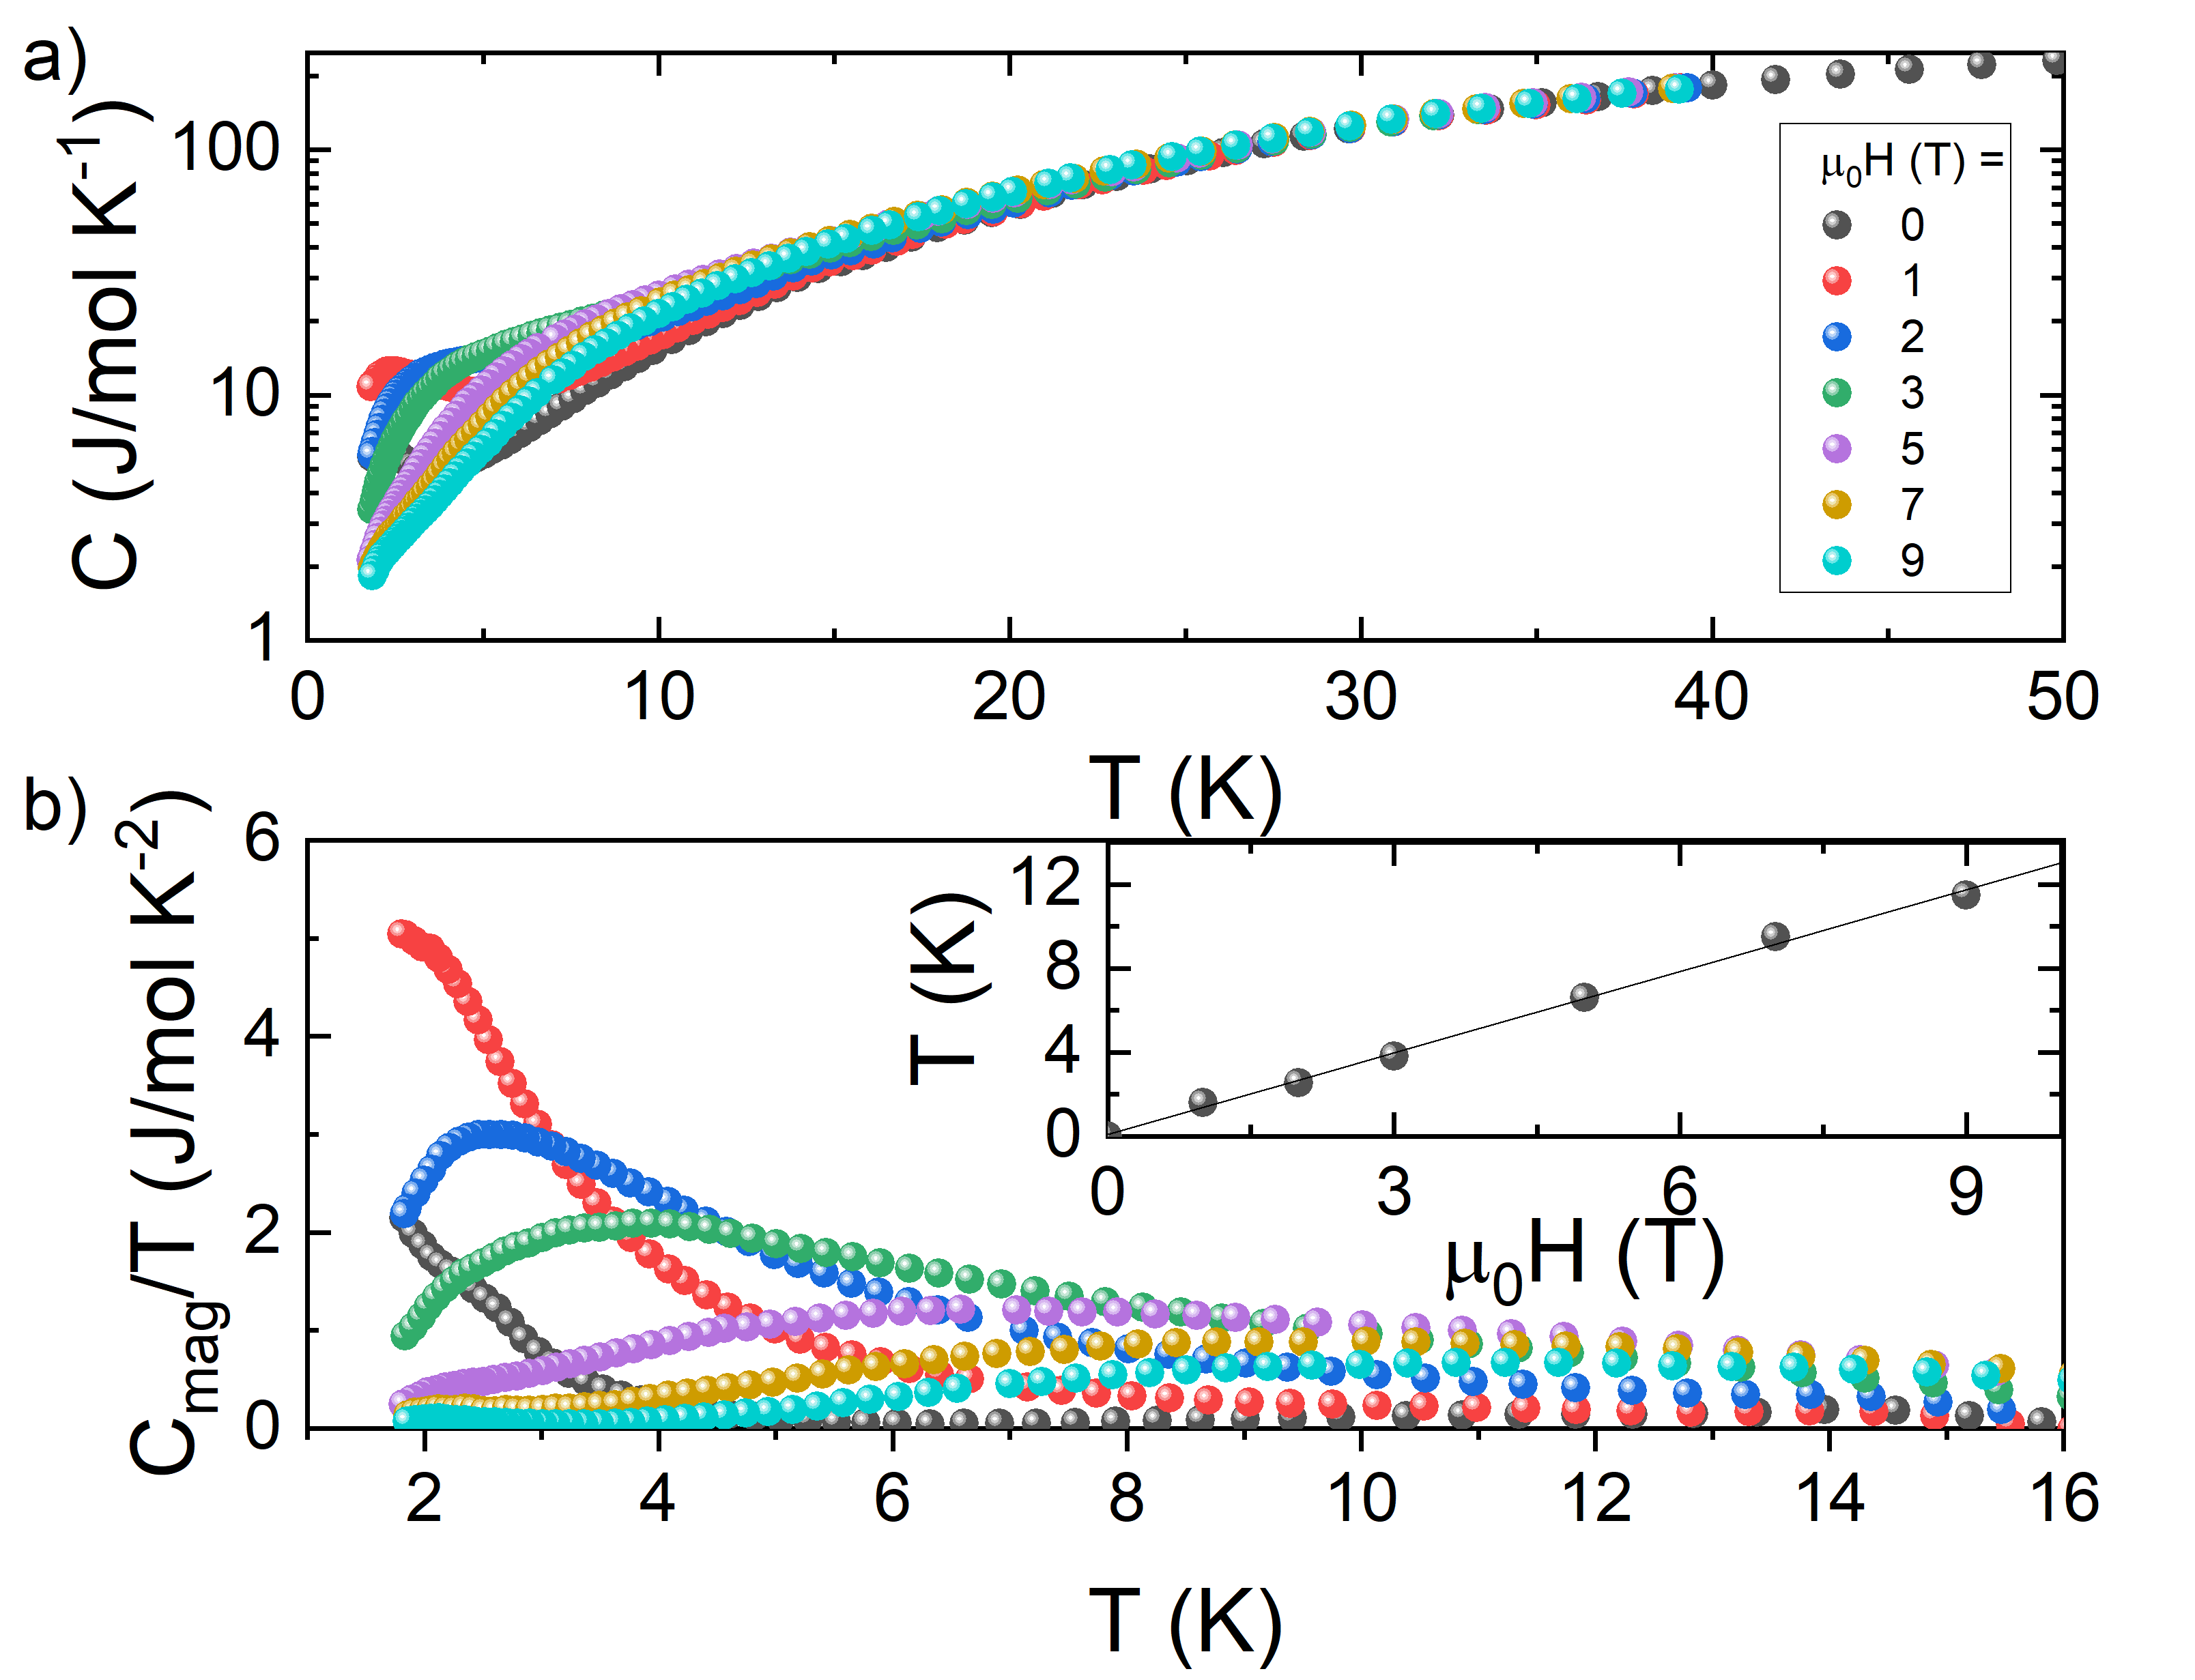
The specific heat data for Er are summarized in Fig. 9 a) as a function of temperature in a large range for varying fields with a semi-logarithmic scale, to visualize the maximum developing around 2.5 K. As for Dy before the maximum strongly shifts with the application of external fields and broadens, but notably less as in accordance with the reduced Landé -factor of Er3+. In Fig. 9 b) we show the low temperature part of the magnetic contribution in the specific heat divided by temperature . As before, the magnetic contribution was estimated by subtracting the phonon contribution with a Debye temperature of 628 K estimated by a linear fit of vs in the temperature range of 5 to 20 K. Notably the release of magnetic entropy is even harder to estimate since our peak even at 1.8 K has not yet reached its maximum and even with 1 T external field we do not see a pronounced maximum. If we extrapolate the 2 T data assuming a behavior fitting to spin-wave order found for the Y case, we find an entropy of around 11.5 J/mol f.u. K-1 corresponding to 17% of lnln J/mol f.u. K-1 again assuming a Kramers doublet as crystal field ground state for Er3+ and of Cu2+. The entropy release is thus similar to that of the Y based system with where a value of 10% was observed.
Displayed in the inset of Fig. 9 is the shift of the maximum of with external magnetic field. From a linear fit of the shift of the maximum we estimate the -factor $of the Kramers doublet ground state to 1.93.
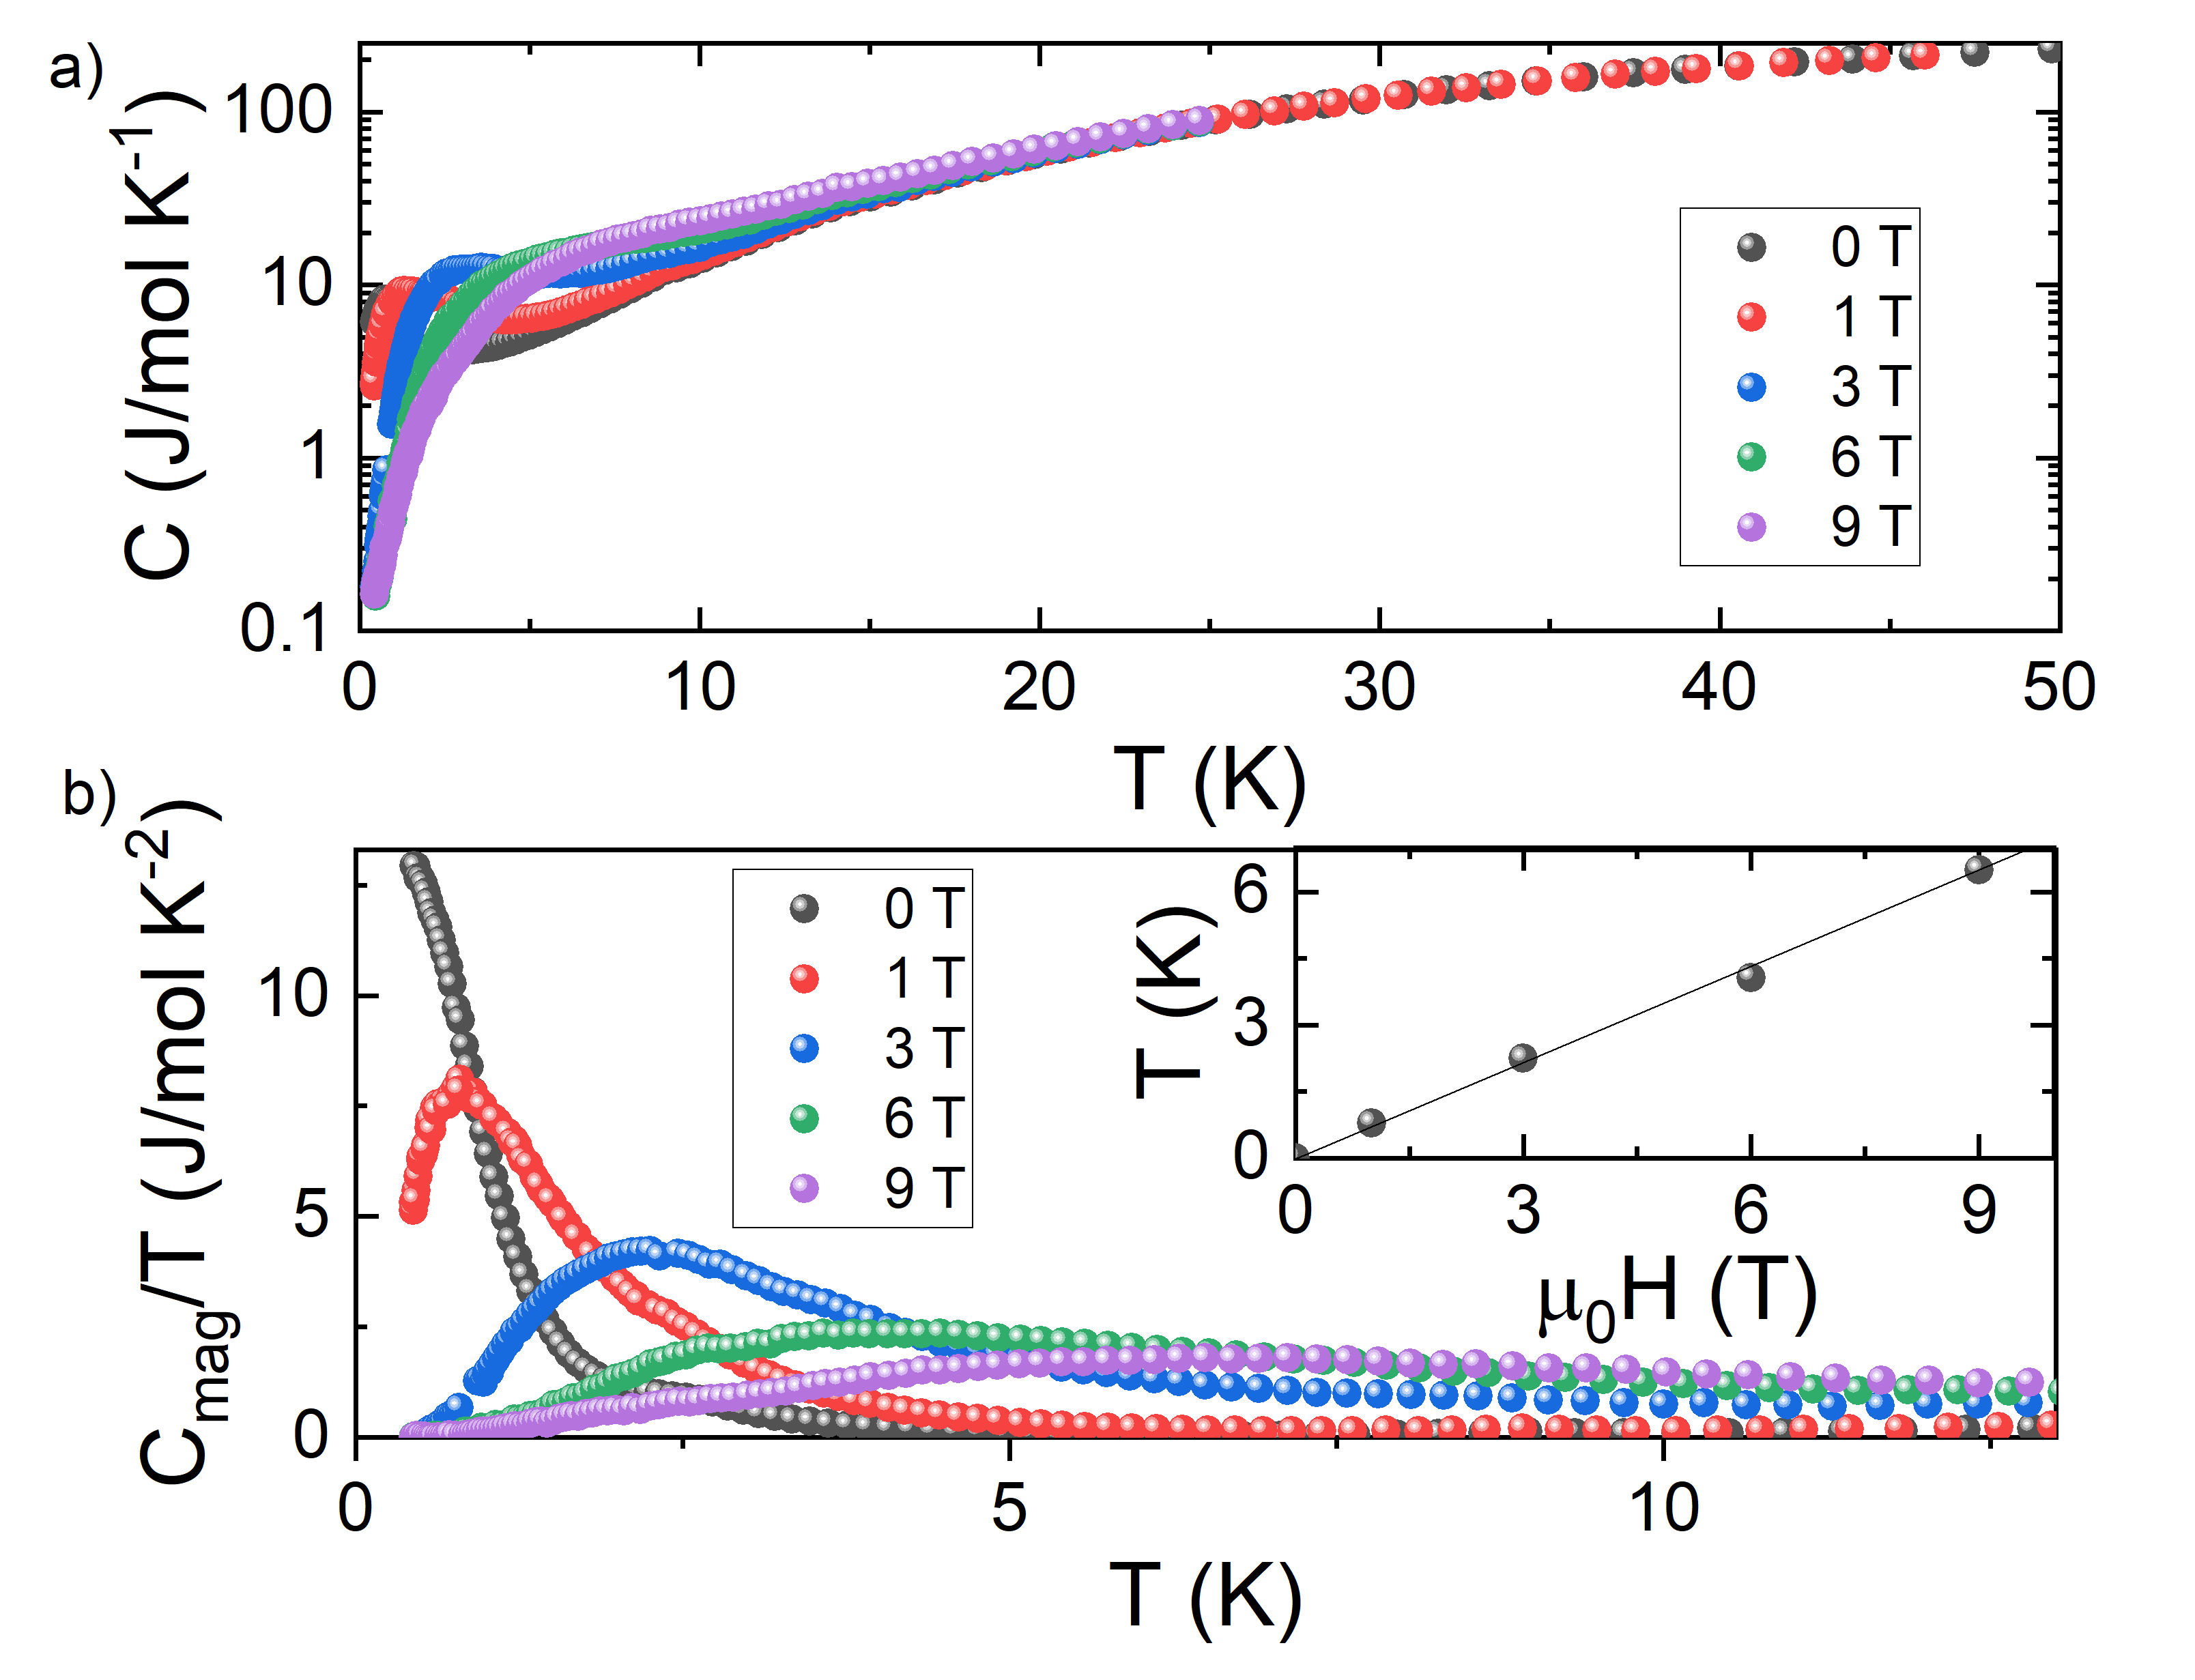
The specific heat versus temperature for Yb is displayed in Fig. 10 a). The specific heat has been measured from 50 K down to 0.4 K and plotted for varying fields on a semi-logarithmic scale to visualize the maximum, again developing at around 2.5 K. Still this maximum strongly shifts with the application of external fields and broadens, but notably even less as in accordance with the again reduced Landé -factor of Yb3+. In Fig. 10 b) we show the low temperature part of the magnetic contribution in the specific heat divided by temperature . in the temperature range from 0.4 K to 20 K was obtained as before by subtracting a phonon contribution to the specific heat assuming a Debye temperature of 592 K from a linear fit of vs in the temperature range of 5 to 20 K. We note that the nuclear contributions to the specific heat of Yb mainly starts below 0.4 K and hence its contribution can be neglected. The release of magnetic entropy is even with an extended temperature range hard to estimate since the peak is not yet at its maximum. But in an external field of 1 T a peak clearly develops. If we extrapolate the 1 T data assuming a behavior as found for Y assuming either spin-wave order, or also fitting to a Dirac SL state found for the Br case, we obtain an entropy of around 12.5 J/mol K, with 10 J/mol K released down to 0.4 K. With Yb3+ we expect an entropy of lnln J/mol K amounting to 18%, again amounting to a similarly low entropy release around 10%.
Looking at the splitting of the Kramer’s doublet ground state of the rare earth of Yb3+ the shift of the specific heat maximum still follows the expected linear trend with field. Via a linear fit shown in the inset of Fig. 10 we estimate the -factor of the Kramers doublet crystal field ground state to be 1.05.
In summary for specific heat we see an uniform reduced release of the magnetic entropy at a transition around 2.5 K for the superstructure systems.
SR Measurements
We investigated the magnetic ground state of Yb3Cu9(OH)19Br8 in more detail by performing SR measurements. Above 2.5 K, the SR relaxation hardly depends on temperature nor on the morphology of the sample. Powder or single crystal samples showed very similar behavior.[13, 21]. When the system is paramagnetic, we expect that we are in the fast fluctuation limit, and the relaxation is dominated by the quasi static, weak and random, nuclear fields. We follow a description of the magnetism as discussed in Ref. [13, 21]. Here, the muon decay asymmetry at high temperature is described by
| (2) |
where
| (3) |
characterizes the formation of OH complexes with a pulsation which depends on the -H distance , the gyromagnetic ratios Mrad/s/T and Mrad/s/T respectively for protons and muons, and a Gaussian broadening due to the other surrounding nuclear spins. The second term in Eq. 2 is a static Kubo-Toyabe relaxation standing for the minority fraction of muon stopping sites, likely close to the Br ions, where they experience a Gaussian distribution of static nuclear fields with a width . The parameter is the initial muon decay asymmetry in our experimental conditions.
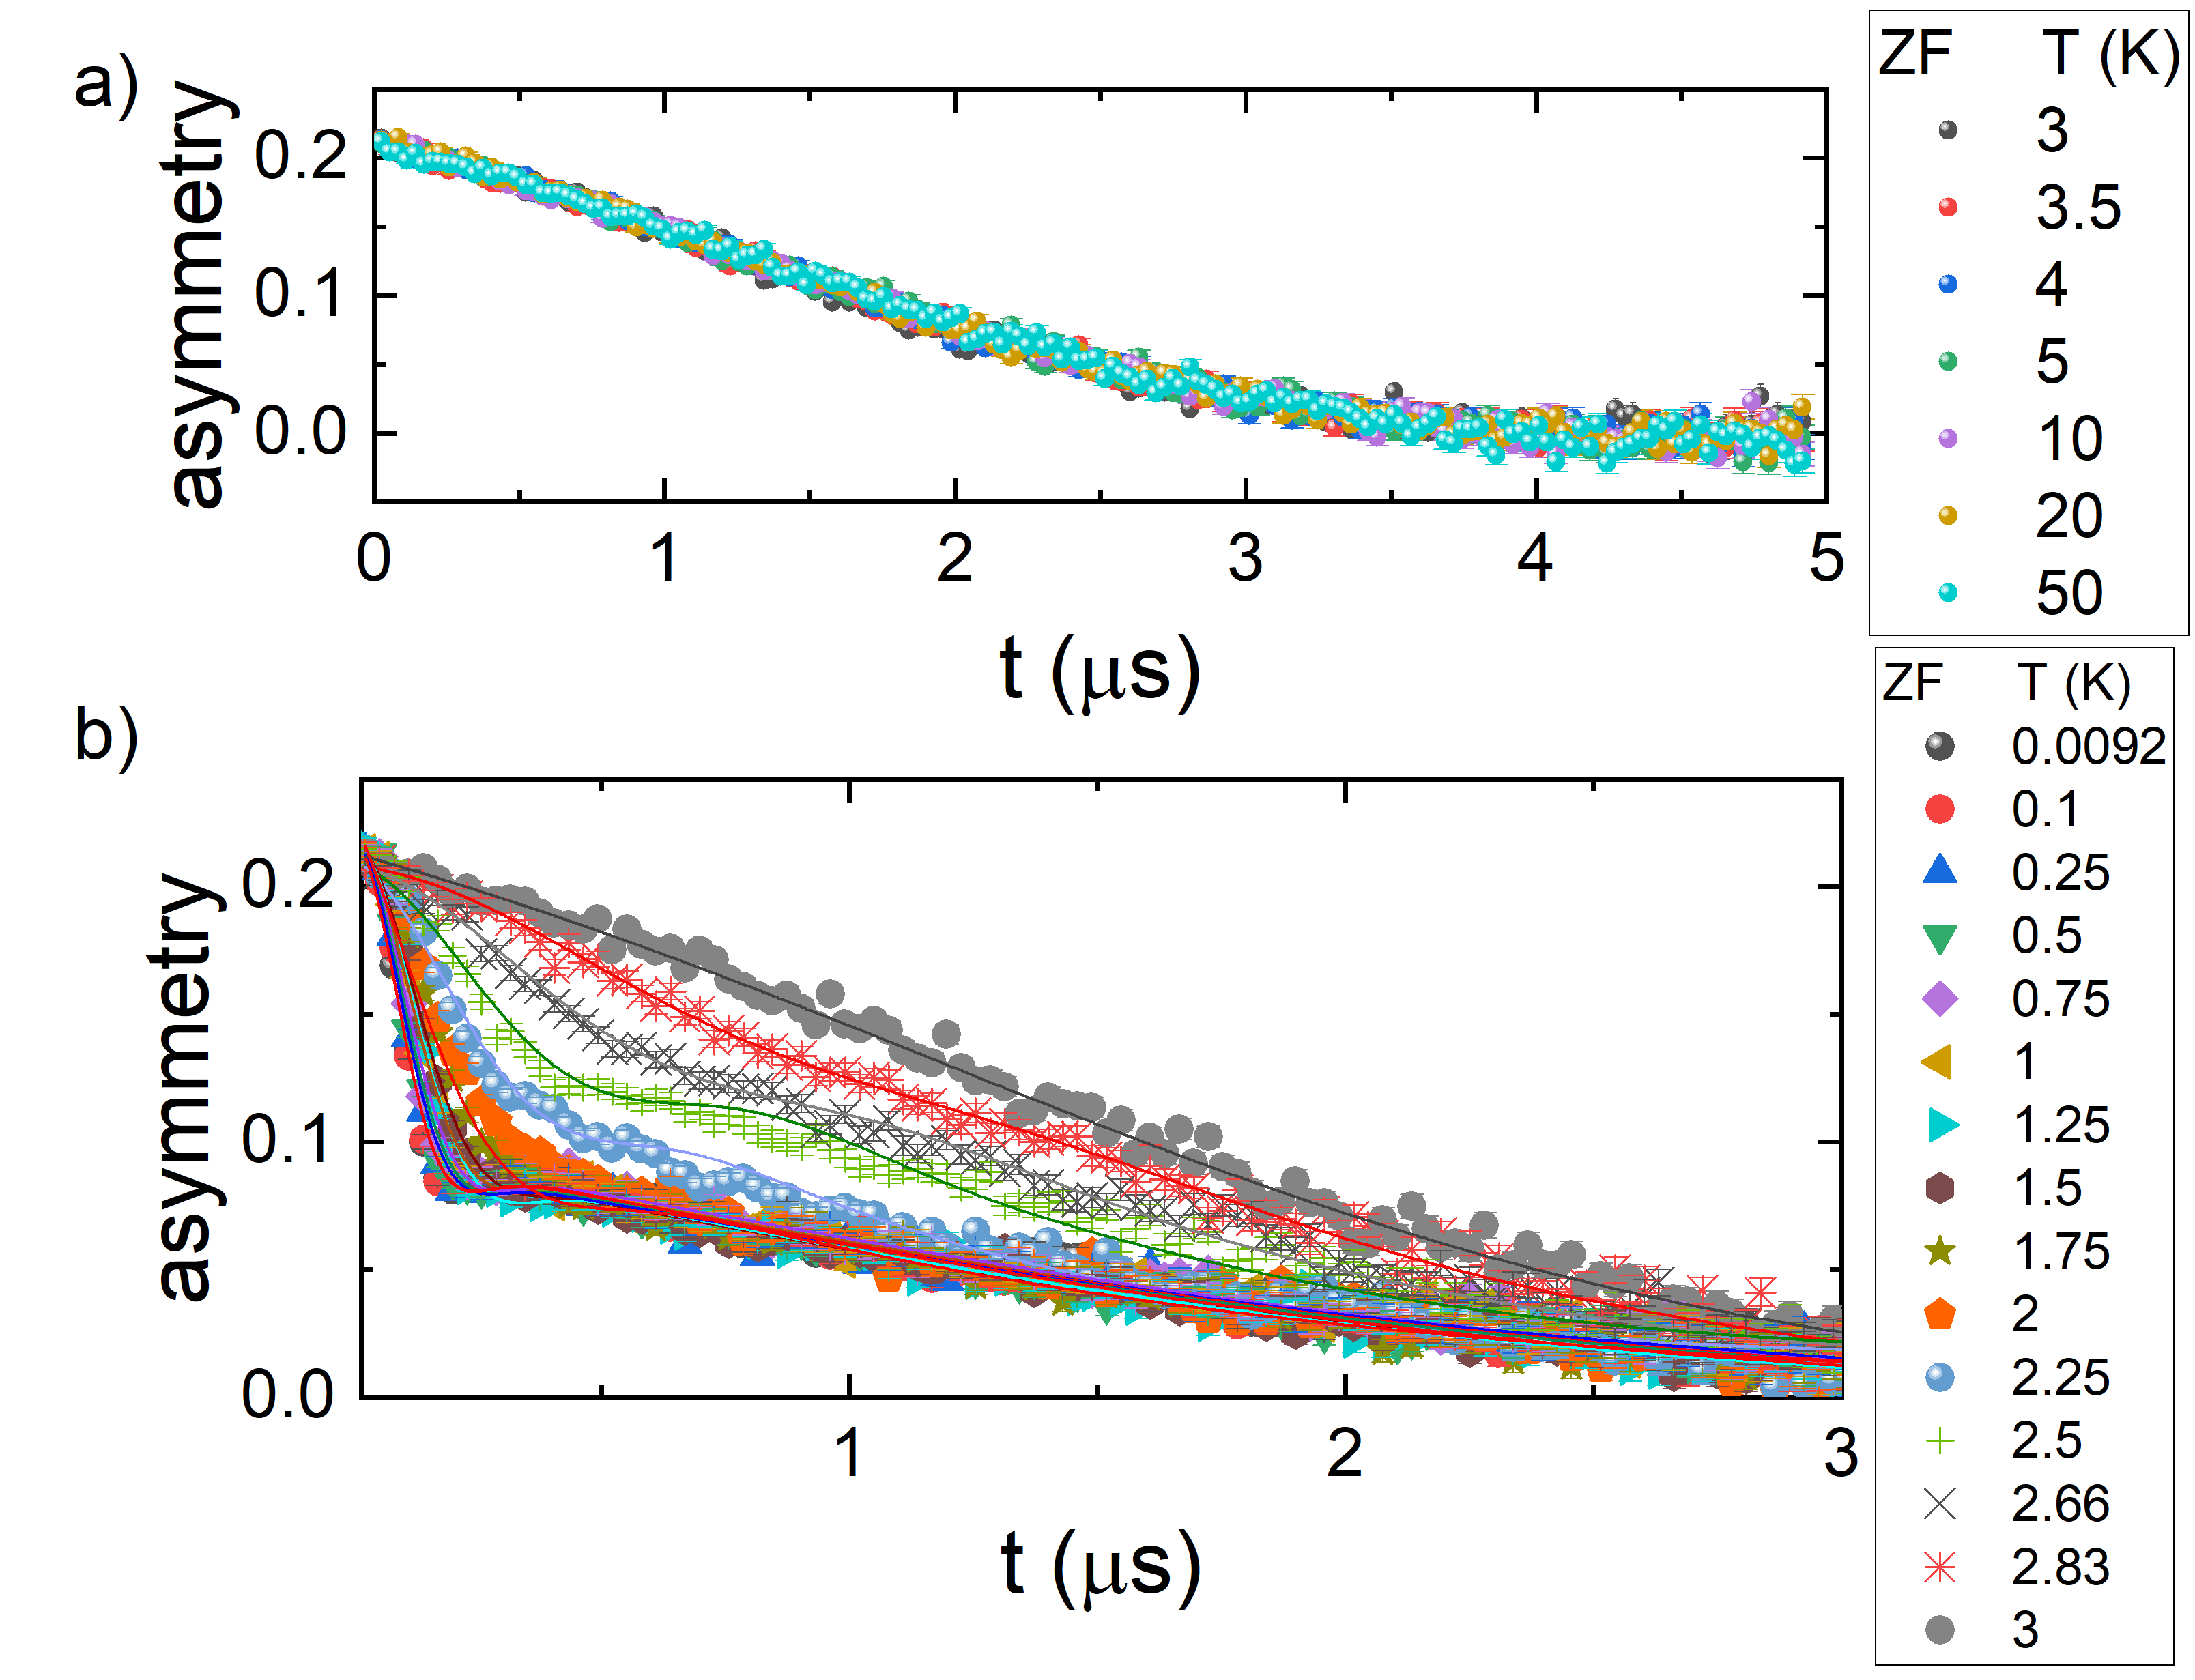
In Figure 11 a) we show the high temperature paramagnetic regime that is temperature independent consistent with a paramagnetic ground state in zero field for Yb3Cu9(OH)19Br8 down to 3 K. The nuclear relaxation parameters in Eq. 2 and Eq. 3 evaluated by fitting the ZF muon asymmetry at 3 K are presented in table 3 with values quite similar to related systems [13, 21].
| Static parameters | Yb3Cu9(OH)19Br8 |
|---|---|
| 75.001.00 | |
| (Mrad.s-1) | 0.560.02 |
| d (Å) | 1.630.02 |
| 0.850.02 | |
| (s-1) | 0.210.02 |
Below 3 K we see a sharp release in entropy, as shown in Fig. 10, and consequently a change in asymmetry attributed to a continuous increase of freezing spins visible in Fig. 11 b). Hence upon cooling, the relaxation from the electronic spins increases progressively and a strongly damped oscillation develops. Notably in case of Y3Cu9(OH)19Cl8 a dip was still visible, while here for Yb3Cu9(OH)19Br8 we cannot see even a single oscillation. Oscillations would indicate a magnetic transition in the single crystal samples. The ordered magnetic fraction can be described using
| (4) |
which accounts for a magnetically frozen spins with an average internal field at the muon sites . The damping parameter encodes the width of the distribution of these internal fields. The last exponential term accounts for residual fluctuations in the frozen phase.
In order to fit the asymmetry over the whole temperature range, we combine both equations 2 and 4 in
| (5) |
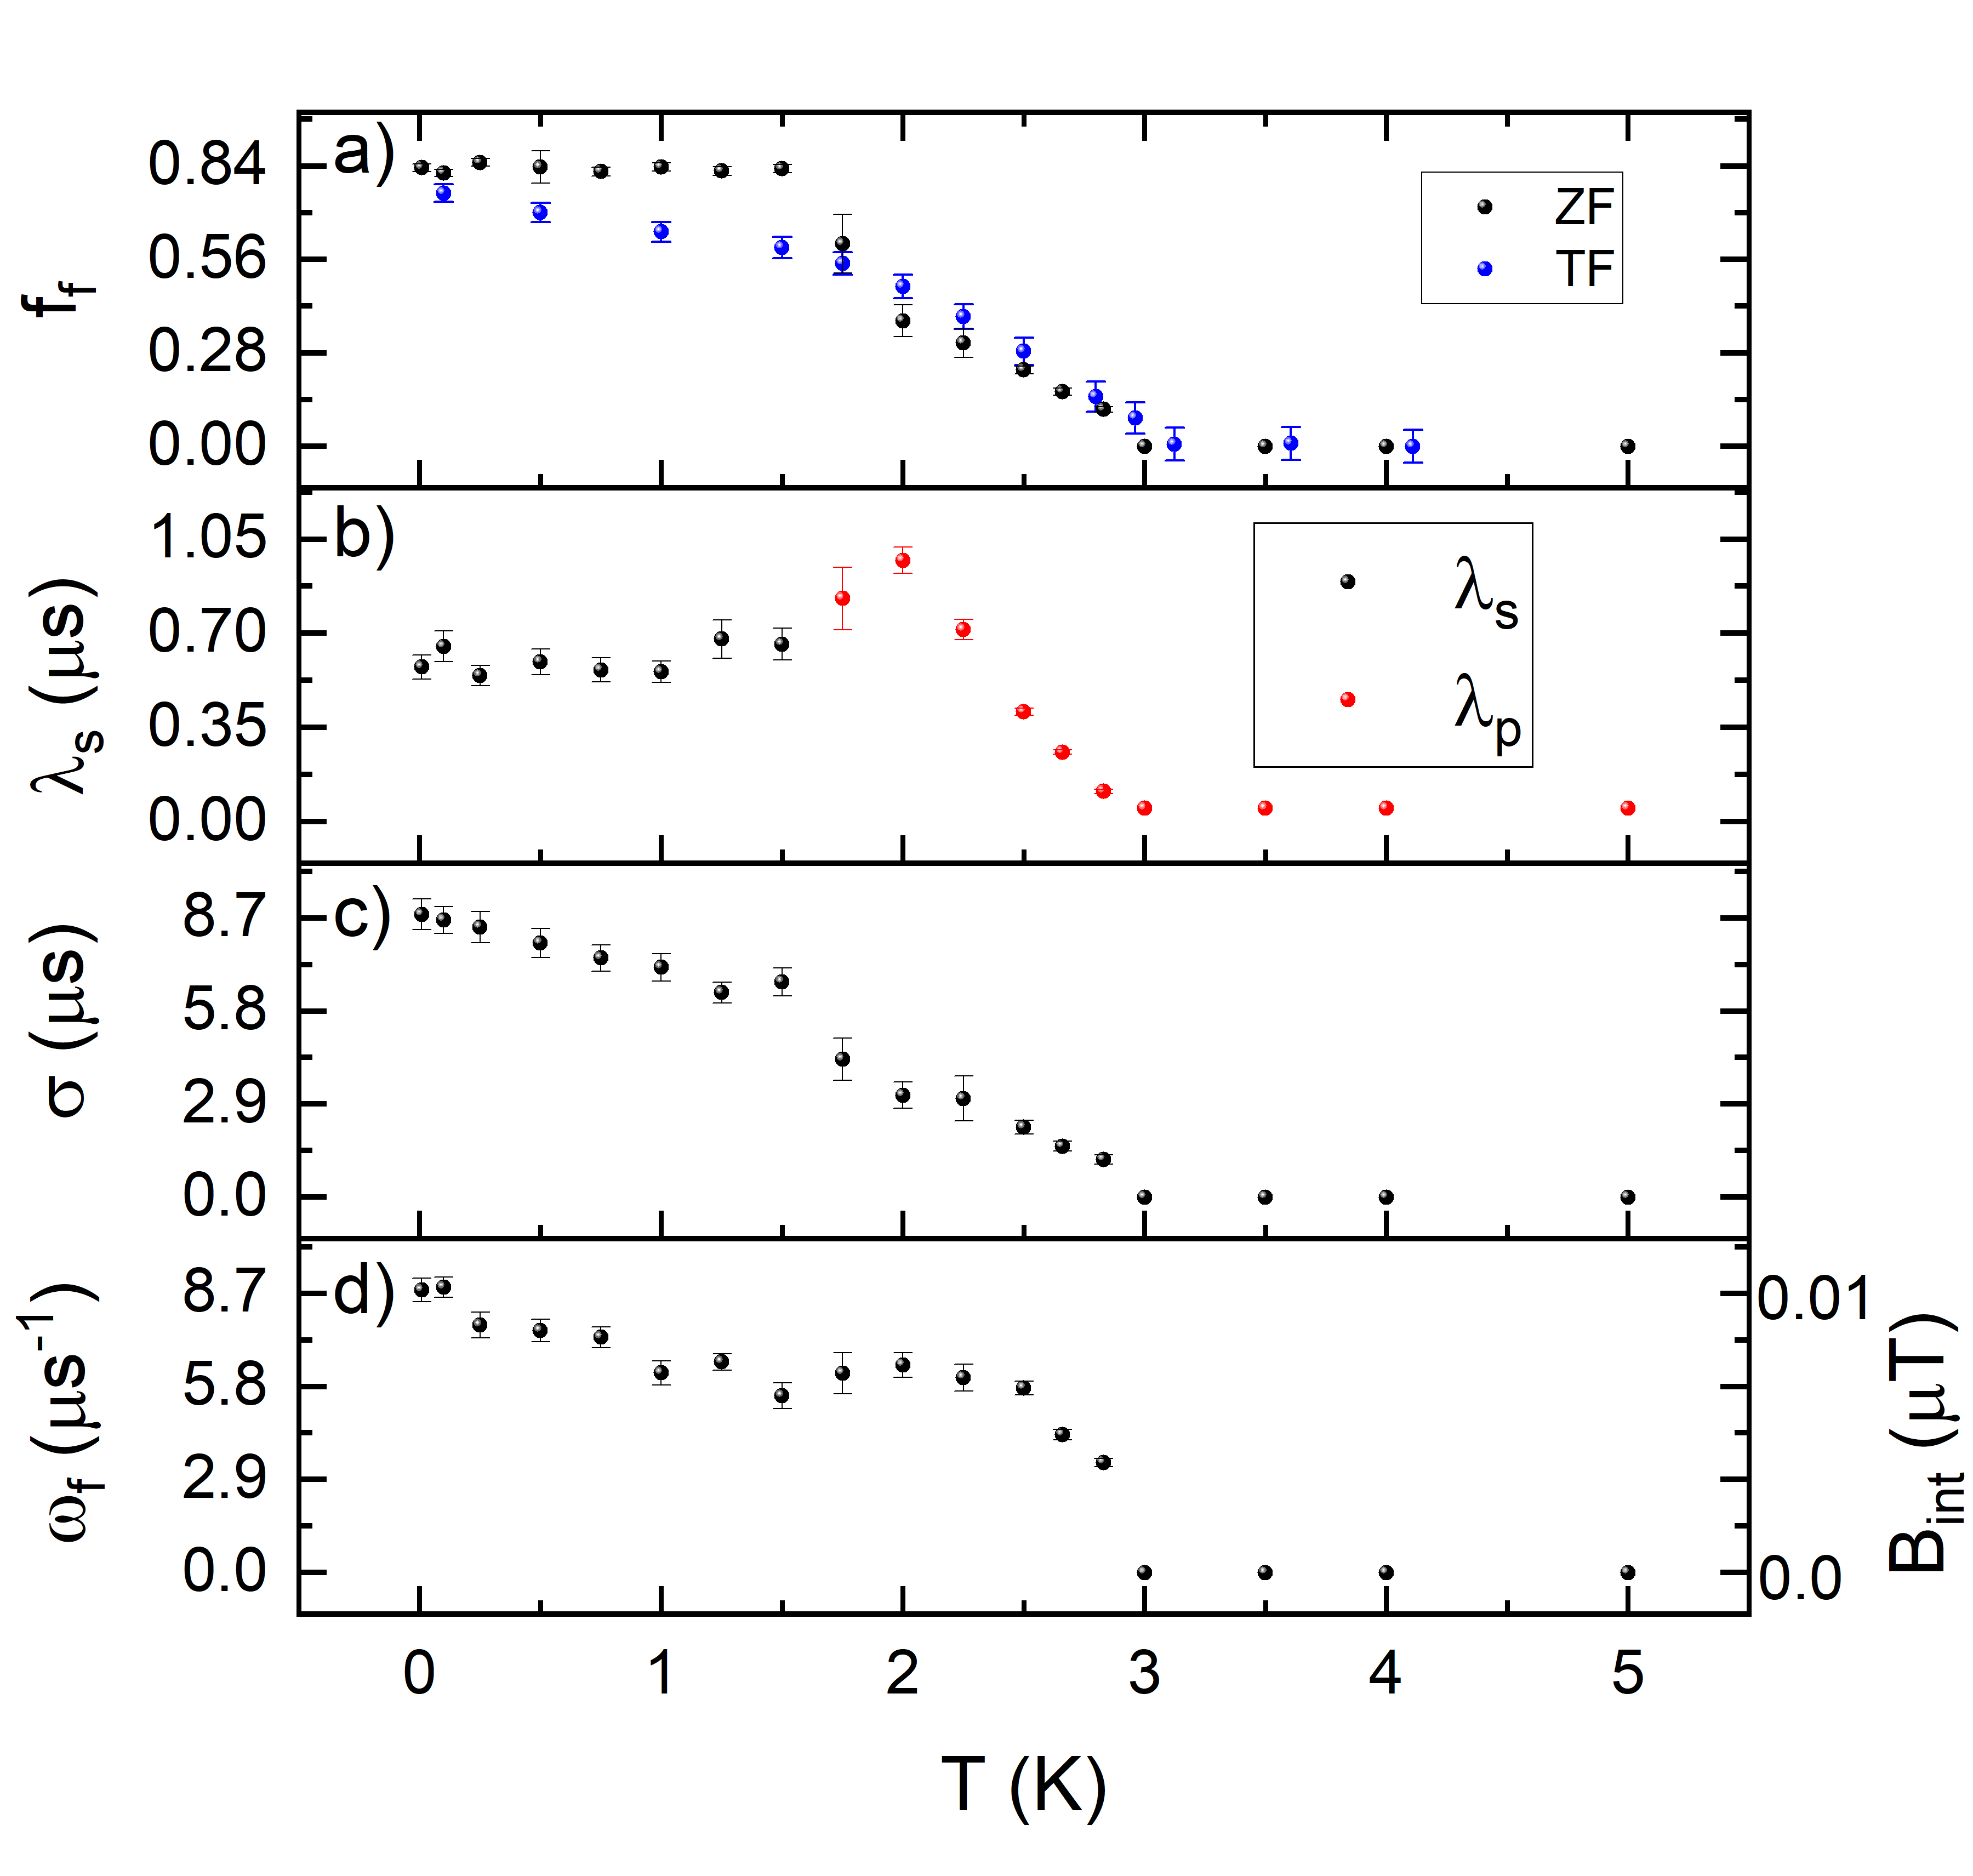
with a switching parameter that tracks the frozen volume fraction from fully frozen for to fully paramagnetic for . All the nuclear parameters are kept constant, so that the only varying parameters shown in Fig. 12 are the frozen fraction , the oscillation frequency and its damping rate, and the relaxation rate or for the paramagnetic or the frozen phase. Using this equation we can describe the entire temperature range as shown in Fig. 11 b). Notably unlike for the Y compound [21] we find no fully ordered state of . Similarly the transition is less pronounced in the relaxation rates. This is in accordance with the absence of a clear dip in the asymmetry and thus our data rather point to an inhomogeneously frozen state than to clear LRO for Yb3Cu9(OH)19Br8.
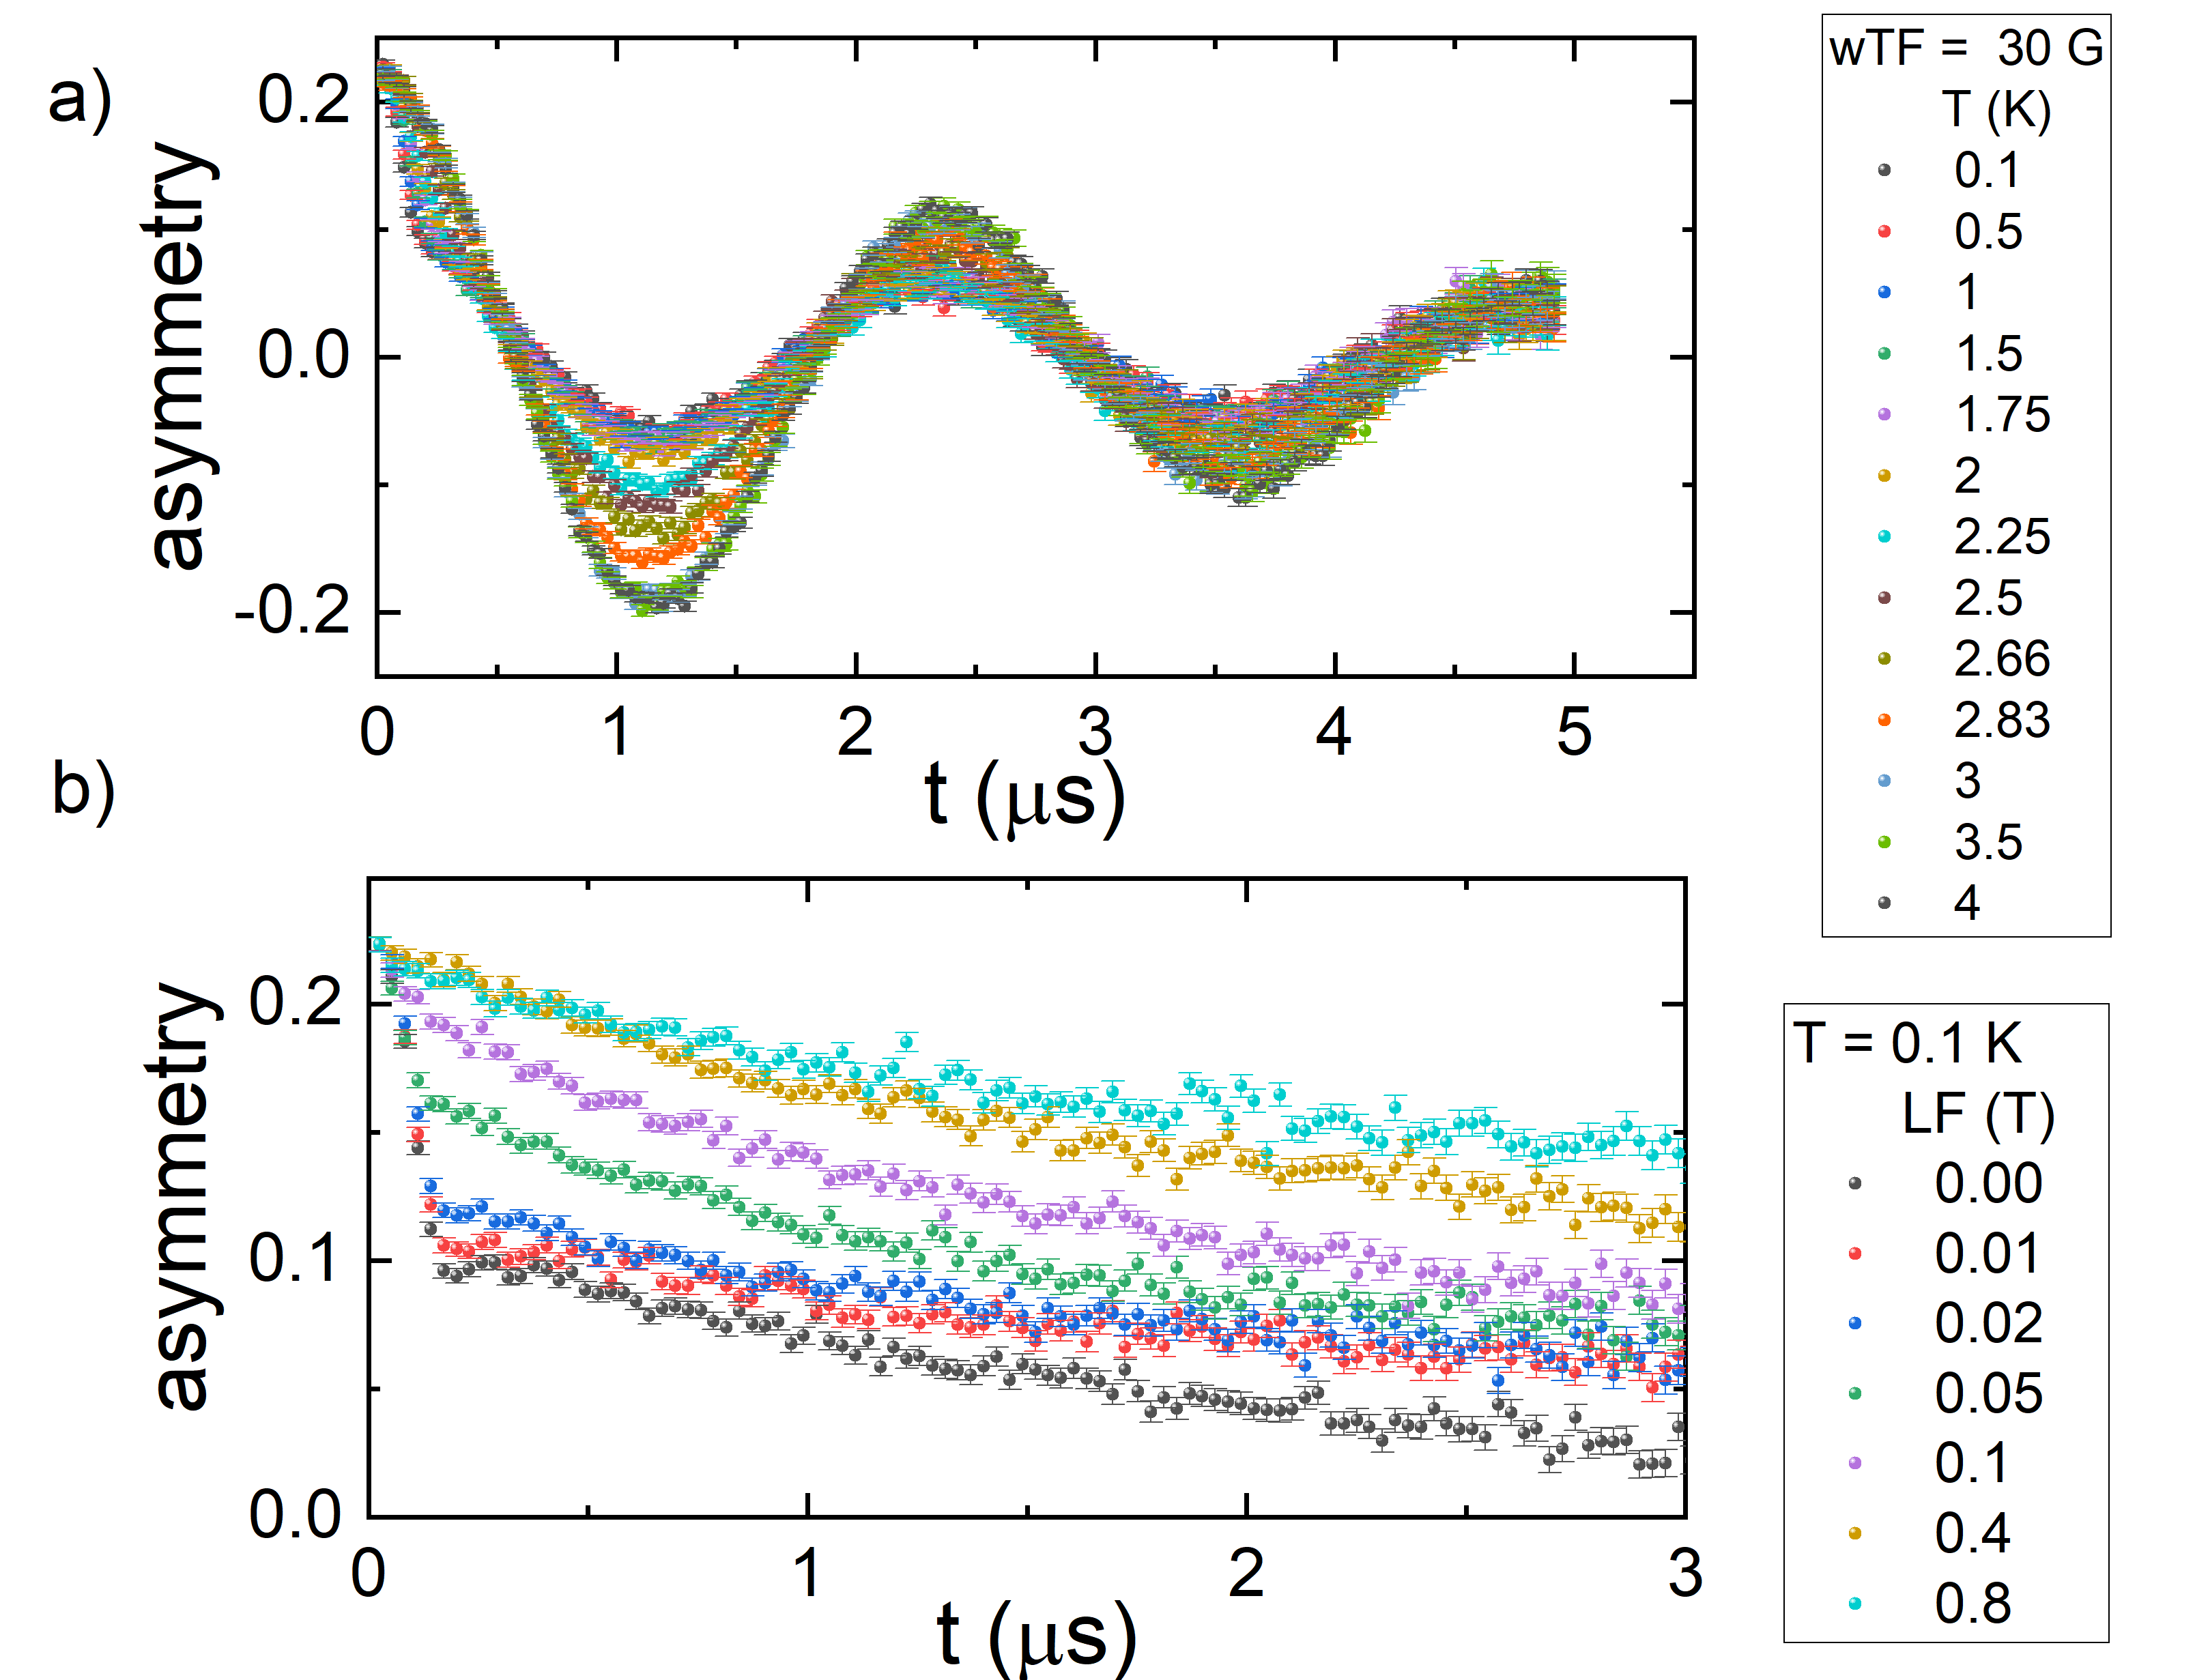
Furthermore, we measured the sample with the application of a weak transverse field (TF), which causes the muon spins to precess in the field. The change of the amplitude, hence the asymmetry with temperature gives additional insights into the fraction of frozen spins. We fitted the polarization in a TF of 30 G (see Fig. 13 a) with a Gaussian damped cosine function representative for a Gaussian distribution of internal fields and show the resulting amplitude change i.e. the frozen fraction in Fig. 12 a) as blue dots. Under this external field we find the same increase of frozen spins around the 3 K transition. However, in ZF we find an additional increase below 1.5 K that is absent in TF. Furthermore, we applied a longitudinal field (LF) at different temperatures. We show the change with increasing LF up to 0.8 T in Fig. 13 b) at 0.1 K. Due to the paramagnetic rare-earth ion we need enhanced external field to decouple our spins. Decoupling is reached at large external fields of 0.4 T, quite unlike the Y case. The remaining slight slope of the data at the highest fields indicates the presence of persistent dynamics even at lowest temperatures. Notably, there are 3 possible reasons for the persistent spin dynamics: 1) fluctuations in the non-frozen fraction 2) fluctuations of the Yb moments 3) fluctuations of the Cu system, i.e. SL like behavior. Here future neutron experiments will shed light on these complex systems, as so far no magnetic Bragg peaks were observed due to the low Cu moment, large rare-earth moments could enable a magnetic structure solution in case of LRO. Furthermore a series of spin wave studies could shed light on the chemical pressure control in these systems.
To summarize, SR measurements indicate a complex magnetic ground state. Already, for Y we find a strongly reduced moment, but clear signs of LRO [21]. Here, we are even closer to the SL state and hence a mix of frozen and fluctuating spins remain down to lowest temperatures likely only realizing short range order.
Phase Diagram
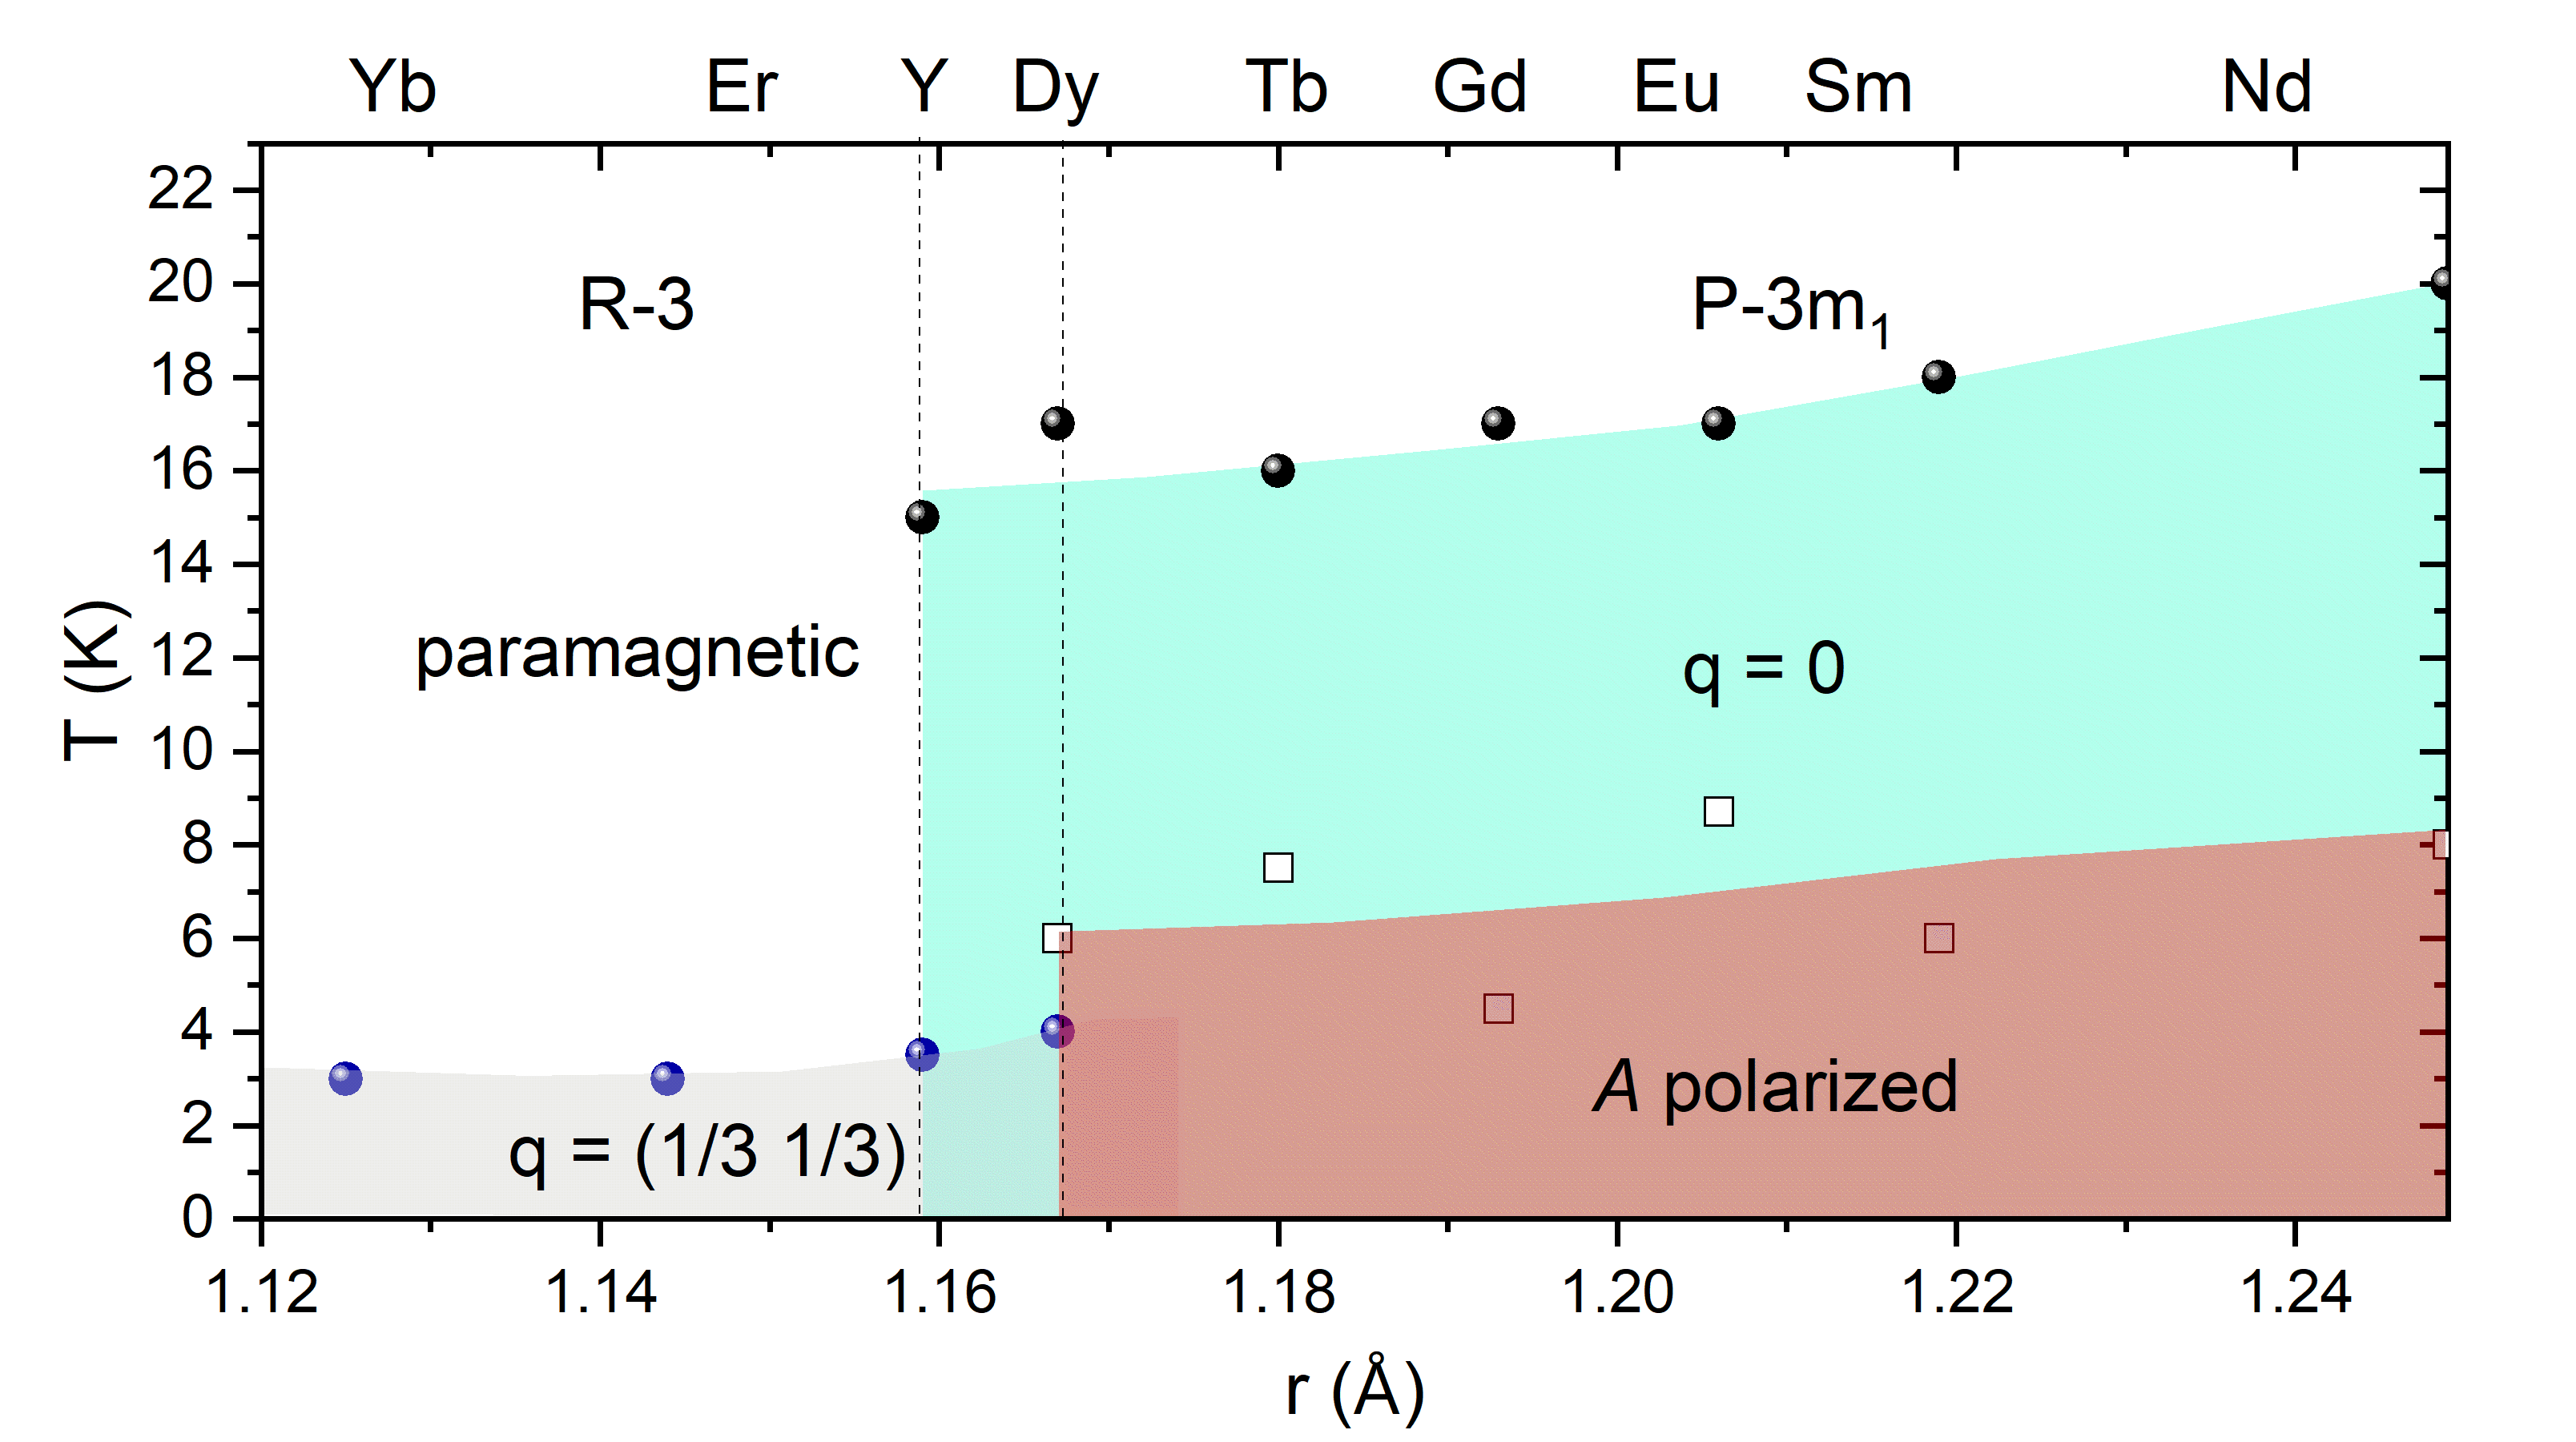
Finally, we summarize and construct the magnetic phase diagram depicted in Fig. 14. For all ions up to Dy the 1 structure is realized with considerable DM interaction and a magnetic transition temperature around 15 K with a propagation vector q = 0 for the magnetic structure. In a second magnetic transition at half of TN the rare-earth ion is polarized whereas for all superstructure variants crystallizing in a structure described by the space group we find a magnetic transition around TN = 2.5 K. For the latter magnetic order is described by an in-plane propagation vector q = (1/3 1/3). The magnetic order remains frustrated and is close to a SL phase, resulting in a largely reduced release of entropy and a 1/3 magnetization plateau even for the ordered systems. Notably in good agreement with the determination of magnetic superexchange interaction we find that with chemical pressure the system distorts more and the couplings thus reduce resulting in a reduction of the magnetic transition temperature TN. Our findings reveal a robust ground state against chemical pressure that can be subtly controlled by the size of the rare-earth ion. The rare-earth ions remain paramagnetic in vanishing external fields. Structural disorder however, appears to easily destabilize this ground state and due to the vicinity to a SL phase induces this ground state. As our SR study reveals no clear LRO for the Yb3Cu9(OH)19Br8 system we presume that here some finite disorder is present. Likely this arises from the quite different synthesis route, where KBr is used as the halide source and crystallization is based on the slow diffusion out of the teflon liner.
Summary
We have shown that phases with composition Cu9(OH)19Cl8 with = Nd, …,Lu can be synthesized. The series realizes a chemical pressure tunable kagome lattice, where the rare-earth ion remains paramagnetic until they are exposed to some stronger magnetism either in form of an external field or due to ordering of the Cu2+ magnetic moments. Starting from Dy clear superstructure reflexes are observed forming a distorted kagome lattice as a consequence of chemical substitution of Cl- by OH-, which has a shorter bond and pulls out the site atom. The distorted kagome has a phase diagram with a large SL phase in the center. All Cu9(OH)19Cl8 are relatively close to the SL phase and negative chemical pressure clearly pushes these systems closer as it leads to large Cu-O-Cu bond angles increasing the superexchange. In addition external pressure control and disorder can bring the system into the SL phase, as the magnetic LRO is fragile, with an uniform reduced moment and low entropy of 10% in all cases. All superstructure variants show a clear 1/3 magnetization plateau that are predicted for the SL ground state. Our detailed characterization on Yb3Cu9(OH)19Br8, a system further away from the SL border than the Y counterpart, but the large moment from Yb allows as to push the 1/3 plateau to low fields of 3 T giving an interesting candidate where future neutron studies will shed light on the complex nature of these ground states.
References
- Balents [2010] L. Balents, Spin liquids in frustrated magnets, Nature 464, 199 (2010).
- Chamorro et al. [2020] J. R. Chamorro, T. M. McQueen, and T. T. Tran, Chemistry of Quantum Spin Liquids, Chemical Reviews 121, 2898 (2020).
- Mendels et al. [2007] P. Mendels, F. Bert, M. A. de Vries, A. Olariu, A. Harrison, F. Duc, J. C. Trombe, J. S. Lord, A. Amato, and C. Baines, Quantum Magnetism in the Paratacamite Family: Towards an Ideal Kagomé Lattice, Phys. Rev. Lett. 98, 077204 (2007).
- Han et al. [2012] T.-H. Han, J. S. Helton, S. Chu, D. G. Nocera, J. A. Rodriguez-Rivera, C. Broholm, and Y. S. Lee, Fractionalized excitations in the spin-liquid state of a kagome-lattice antiferromagnet, Nature 492, 406 (2012).
- Jeon et al. [2024] S. Jeon, D. Wulferding, Y. Choi, S. Lee, K. Nam, K. H. Kim, M. Lee, T.-H. Jang, J.-H. Park, S. Lee, S. Choi, C. Lee, H. Nojiri, and K.-Y. Choi, One-ninth magnetization plateau stabilized by spin entanglement in a kagome antiferromagnet, Nature Physics 20, 435 (2024).
- Zeng et al. [2024] Z. Zeng, C. Zhou, H. Zhou, L. Han, R. Chi, K. Li, M. Kofu, K. Nakajima, Y. Wei, W. Zhang, D. G. Mazzone, Z. Y. Meng, and S. Li, Spectral evidence for dirac spinons in a kagome lattice antiferromagnet, Nature Physics 20, 1097 (2024).
- Puphal et al. [2018] P. Puphal, K. M. Zoch, J. Désor, M. Bolte, and C. Krellner, Kagome quantum spin systems in the atacamite family, Physical Review Materials 2, 063402 (2018).
- Boldrin et al. [2016] D. Boldrin, K. Knight, and A. S. Wills, Orbital frustration in the S = 1/2 kagome magnet vesignieite, BaCu3V2O8(OD)2 (2016), arXiv:1610.01436 [cond-mat.mtrl-sci] .
- Sun et al. [2017] W. Sun, Y.-X. Huang, Y. Pan, and J.-X. Mi, Strong spin frustration and negative magnetization in Cu3(OH)6Cl2 ( = Nd and Sm) with triangular lattices: the effects of lanthanides, Dalton Transactions 46, 9535 (2017).
- Fu et al. [2021a] Y. Fu, M.-L. Lin, L. Wang, Q. Liu, L. Huang, W. Jiang, Z. Hao, C. Liu, H. Zhang, X. Shi, J. Zhang, J. Dai, D. Yu, F. Ye, P. A. Lee, P.-H. Tan, and J.-W. Mei, Dynamic fingerprint of fractionalized excitations in single-crystalline Cu3Zn(OH)6FBr, Nature Communications 2021 12:1 12, 1 (2021a).
- Fu et al. [2021b] Y. Fu, L. Huang, X. Zhou, J. Chen, X. Zhang, P. Chen, S. Wang, C. Liu, D. Yu, H.-F. Li, L. Wang, and J.-W. Mei, Cu3(OH)6Cl2 ( = Gd, Tb, Dy): Heavy lanthanides on spin-1/2 kagome magnets, Chinese Physics B 30, 100601 (2021b).
- Zorko et al. [2019a] A. Zorko, M. Pregelj, M. Gomilšek, M. Klanjšek, O. Zaharko, W. Sun, and J.-X. Mi, Negative-vector-chirality 120°spin structure in the defect- and distortion-free quantum kagome antiferromagnet YCu3(OH)6Cl3, Physical Review B 100, 144420 (2019a).
- Barthélemy et al. [2019] Q. Barthélemy, P. Puphal, K. M. Zoch, C. Krellner, H. Luetkens, C. Baines, D. Sheptyakov, E. Kermarrec, P. Mendels, and F. Bert, Local study of the insulating quantum kagome antiferromagnets YCu3(OH)6OxCl3-x (x=0,1/3), Physical Review Materials 3, 074401 (2019).
- Zorko et al. [2019b] A. Zorko, M. Pregelj, M. Klanjšek, M. Gomilšek, Z. Jagličić, J. S. Lord, J. A. T. Verezhak, T. Shang, W. Sun, and J.-X. Mi, Coexistence of magnetic order and persistent spin dynamics in a quantum kagome antiferromagnet with no intersite mixing, Physical Review B 99, 214441 (2019b).
- Okuma et al. [2017] R. Okuma, T. Yajima, D. Nishio-Hamane, T. Okubo, and Z. Hiroi, Weak ferromagnetic order breaking the threefold rotational symmetry of the underlying kagome lattice in CdCu3(OH)6(NO3)2·H2O, Physical Review B 95, 094427 (2017).
- Yoshida et al. [2017] H. Yoshida, N. Noguchi, Y. Matsushita, Y. Ishii, Y. Ihara, M. Oda, H. Okabe, S. Yamashita, Y. Nakazawa, A. Takata, T. Kida, Y. Narumi, and M. Hagiwara, Unusual Magnetic State with Dual Magnetic Excitations in the Single Crystal of S=1/3 Kagome Lattice Antiferromagnet CaCu3(OH)6ClH2O, Journal of the Physical Society of Japan 86, 033704 (2017).
- Prelovsek et al. [2021] P. Prelovsek, M. Gomilsek, T. Arh, and A. Zorko, Dynamical spin correlations of the kagome antiferromagnet, Physical Review B 103, 014431 (2021).
- Puphal et al. [2017] P. Puphal, M. Bolte, D. Sheptyakov, A. Pustogow, K. Kliemt, M. Dressel, M. Baenitz, and C. Krellner, Strong magnetic frustration in Y3Cu9(OH)Cl8: a distorted kagome antiferromagnet, Journal of Materials Chemistry C 5, 2629 (2017).
- Kremer et al. [2024] R. K. Kremer, S. Bette, J. Nuss, and P. Puphal, Chemo-Structural Disorder in the kagomé spin = 1/2 systems ZnCu3(OH)6Cl2 and YCu3(OH)6Br2[Brx(OH)1-x] (2024).
- Hering et al. [2022] M. Hering, F. Ferrari, A. Razpopov, I. I. Mazin, R. Valentí, H. O. Jeschke, and J. Reuther, Phase diagram of a distorted kagome antiferromagnet and application to Y-kapellasite, npj Computational Materials 8, 1 (2022).
- Chatterjee et al. [2023] D. Chatterjee, P. Puphal, Q. Barthélemy, J. Willwater, S. Süllow, C. Baines, S. Petit, E. Ressouche, J. Ollivier, K. M. Zoch, C. Krellner, M. Parzer, A. Riss, F. Garmroudi, A. Pustogow, P. Mendels, E. Kermarrec, and F. Bert, From spin liquid to magnetic ordering in the anisotropic kagome Y-kapellasite Y3Cu9(OH)19Cl8 : A single-crystal study, Physical Review B 107, 125156 (2023).
- Biesner et al. [2022] T. Biesner, S. Roh, A. Razpopov, J. Willwater, S. Süllow, Y. Li, K. M. Zoch, M. Medarde, J. Nuss, D. Gorbunov, Y. Skourski, A. Pustogow, S. E. Brown, C. Krellner, R. Valentí, P. Puphal, and M. Dressel, Multi-Center Magnon Excitations Open the Entire Brillouin Zone to Terahertz Magnetometry of Quantum Magnets, Advanced Quantum Technologies 5, 2200023 (2022).
- Wang et al. [2023] J. Wang, M. Spitaler, Y.-S. Su, K. Zoch, C. Krellner, P. Puphal, S. Brown, and A. Pustogow, Controlled frustration release on the kagome lattice by uniaxial-strain tuning, Physical Review Letters 131, 256501 (2023).
- Kato et al. [2024] M. Kato, Y. Narumi, K. Morita, Y. Matsushita, S. Fukuoka, S. Yamashita, Y. Nakazawa, M. Oda, H. Hayashi, K. Yamaura, M. Hagiwara, and H. K. Yoshida, One-third magnetization plateau in quantum kagome antiferromagnet, Communications Physics 7, 10.1038/s42005-024-01922-0 (2024).
- Chen et al. [2020] X.-H. Chen, Y.-X. Huang, Y. Pan, and J.-X. Mi, Quantum spin liquid candidate YCu3(OH)6Br2[Br (OH)1-] (x 0.51): With an almost perfect kagomé layer, Journal of Magnetism and Magnetic Materials 512, 167066 (2020).
- Li et al. [2024] S. Li, Y. Cui, Z. Zeng, Y. Wang, Z. Hu, J. Liu, C. Li, X. Xu, Y. Chen, Z. Liu, S. Li, and W. Yu, NMR evidence of spinon localization in the kagome antiferromagnet YCu3(OH)6Br2[Brx(OH)1-x], Physical Review B 109, 104403 (2024).
- Shivaram et al. [2024] B. S. Shivaram, J. Prestigiacomo, A. Xu, Z. Zeng, T. D. Ford, I. Kimchi, S. Li, and P. A. Lee, Non-analytic magnetic response and intrinsic ferromagnetic clusters in a dirac spin liquid candidate (2024).
- Xu et al. [2024] A. Xu, Q. Shen, B. Liu, Z. Zeng, L. Han, L. Yan, J. Luo, J. Yang, R. Zhou, and S. Li, Magnetic ground states in the kagome system YCu3(OH)6[(ClxBr1-x)1-y(OH)y], Physical Review B 110, 085146 (2024).
- Sun et al. [2021] W. Sun, T. Arh, M. Gomilšek, P. Koželj, S. Vrtnik, M. Herak, J.-X. Mi, and A. Zorko, Magnetic ordering of the distorted kagome antiferromagnet Y3Cu9(OH)18[Cl8(OH)] prepared via optimal synthesis, Physical Review Materials 5, 064401 (2021).
- Zeng et al. [2022] Z. Zeng, X. Ma, S. Wu, H.-F. Li, Z. Tao, X. Lu, X.-h. Chen, J.-X. Mi, S.-J. Song, G.-H. Cao, G. Che, K. Li, G. Li, H. Luo, Z. Y. Meng, and S. Li, Possible Dirac quantum spin liquid in the kagome quantum antiferromagnet , Phys. Rev. B 105, L121109 (2022).
- Liu et al. [2022] J. Liu, L. Yuan, X. Li, B. Li, K. Zhao, H. Liao, and Y. Li, Gapless spin liquid behavior in a kagome Heisenberg antiferromagnet with randomly distributed hexagons of alternate bonds, Physical Review B 105, 024418 (2022).
- Lu et al. [2022] F. Lu, L. Yuan, J. Zhang, B. Li, Y. Luo, and Y. Li, The observation of quantum fluctuations in a kagome heisenberg antiferromagnet, Communications Physics 5, 10.1038/s42005-022-01053-4 (2022).
- Hong et al. [2022] X. Hong, M. Behnami, L. Yuan, B. Li, W. Brenig, B. Büchner, Y. Li, and C. Hess, Heat transport of the kagome Heisenberg quantum spin liquid candidate YCu3(OH)6.5Br2.5 : Localized magnetic excitations and a putative spin gap, Physical Review B 106, l220406 (2022).
- Suetsugu et al. [2024] S. Suetsugu, T. Asaba, Y. Kasahara, Y. Kohsaka, K. Totsuka, B. Li, Y. Zhao, Y. Li, M. Tokunaga, and Y. Matsuda, Emergent spin-gapped magnetization plateaus in a spin-1/2 perfect kagome antiferromagnet, Physical Review Letters 132, 226701 (2024).
- Han et al. [2024] L. Han, Z. Zeng, B. Liu, M. Kofu, K. Nakajima, P. Steffens, A. Hiess, Y. Su, and S. Li, Spin excitations arising from anisotropic dirac spinons in ycu3(od)6br2[br0.33(od)0.67] (2024).
- Zheng et al. [2023] G. Zheng, Y. Zhu, K.-W. Chen, B. Kang, D. Zhang, K. Jenkins, A. Chan, Z. Zeng, A. Xu, O. A. Valenzuela, J. Blawat, J. Singleton, P. A. Lee, S. Li, and L. Li, Unconventional magnetic oscillations in kagome mott insulators (2023).
- Lee et al. [2024] C. Lee, W. Lee, S. Lee, T. Yamanaka, S. Jeon, J. Khatua, H. Nojiri, and K.-Y. Choi, Dirac spinons intermingled with singlet states in the random kagome antiferromagnet YCu3(OD)6+xBr (x=0.5), Physical Review B 110, 064418 (2024).
- Catalano et al. [2018] S. Catalano, M. Gibert, J. Fowlie, J. Íñiguez, J.-M. Triscone, and J. Kreisel, Rare-earth nickelates NiO3: thin films and heterostructures, Reports on Progress in Physics 81, 046501 (2018).
- Yen et al. [2007] F. Yen, C. dela Cruz, B. Lorenz, E. Galstyan, Y. Sun, M. Gospodinov, and C. Chu, Magnetic phase diagrams of multiferroic hexagonal MnO3 ( = Er, Yb, Tm, and Ho), Journal of Materials Research 22, 2163 (2007).
- Miyasaka et al. [2003] S. Miyasaka, Y. Okimoto, M. Iwama, and Y. Tokura, Spin-orbital phase diagram of perovskite-type VO3 (=rare-earth ion or Y), Physical Review B 68, 100406 (2003).
- Boldrin et al. [2015] D. Boldrin, B. Fåk, M. Enderle, S. Bieri, J. Ollivier, S. Rols, P. Manuel, and A. S. Wills, Haydeeite: A spin-12kagome ferromagnet, Physical Review B 91, 220408 (2015).
- Kermarrec et al. [2014] E. Kermarrec, A. Zorko, F. Bert, R. H. Colman, B. Koteswararao, F. Bouquet, P. Bonville, A. Hillier, A. Amato, J. van Tol, A. Ozarowski, A. S. Wills, and P. Mendels, Spin dynamics and disorder effects in the s=1/2 kagome heisenberg spin-liquid phase of kapellasite, Physical Review B 90, 205103 (2014).
- Khuntia et al. [2020] P. Khuntia, M. Velazquez, Q. Barthélemy, F. Bert, E. Kermarrec, A. Legros, B. Bernu, L. Messio, A. Zorko, and P. Mendels, Gapless ground state in the archetypal quantum kagome antiferromagnet ZnCu3(OH)6Cl2, Nature Physics 16, 469 (2020).
- Cheng et al. [2022] D.-E. Cheng, Y.-Y. Wang, Y. Sun, H. Liang, D.-D. Wu, Q. Li, X. Sun, and X.-Y. Yue, Structure, magnetism and magnetocaloric effect in a new triangular lattice compound Gd3Cu9(OH)19Cl8, RSC Advances 12, 25890 (2022).
- Mugiraneza and Hallas [2022] S. Mugiraneza and A. M. Hallas, Tutorial: a beginner’s guide to interpreting magnetic susceptibility data with the curie-weiss law, Communications Physics 5, 10.1038/s42005-022-00853-y (2022).
- Sun et al. [2016] W. Sun, Y.-X. Huang, S. Nokhrin, Y. Pan, and J.-X. Mi, Perfect Kagomé lattices in YCu3(OH)6Cl3: a new candidate for the quantum spin liquid state, Journal of Materials Chemistry C 4, 8772 (2016).
- Zheng et al. [2009] X. Zheng, T. Yamashita, M. Hagihala, M. Fujihala, and T. Kawae, Magnetic transitions in botallackite-structure Cu2(OH)3Br and Cu2(OH)3I, Physica B: Condensed Matter 404, 680 (2009).
Methods
Sample Preparation and Composition
Crystals of YCu3(OH)6Cl3 and Y3Cu9(OH)19Cl8 were grown by two different routes following the descriptions provided in Refs. 46, 22, 21: The first route utilized a waterfree hydroflux variant starting from a mixture of 0.6g LiOH, 1.5g BaCl2, 2g Y(NO3)H2O, 1g CuCl2H2O, and 0.6g CuCl which was heated to 240C for four days in a 23 ml teflon lined autoclave. The second route used hydrothermal transport of CuO in a YClH2O solution at elevated temperatures of 240C at the hot end of thick walled Pyrex glass ampoules (=15 mm, =21 mm, mm). Similarly the compounds with the rare earth elements Sm - Eu were grown by hydrothermal transport [7], while Gd - Lu were grown by standard hydrothermal synthesis in a furnace with a temperature gradient as described in detail in Ref. [18], however with 23 ml teflon lined autoclaves. Y3Cu9(OH)19Br8 crystals of the Br family were synthesized following Ref. [25] with an alternation given in detail in Ref. [19]. Gd3Cu9(OH)19Br8 was prepared as described in Ref. [44]. 0.6 g Cu(NO3)3H2O, 1.9 g Y(NO3)6H2O and 2.2 g KBr were mixed and dissolved in 2 mL deionized water. Alternatively 0.4514 g Gd(NOH2O (1 mmol), 0.7248 g Cu(NO3)2 H2O, 0.7203 g NaBr (7 mmol) were dissolved in 1 ml deionized water. We report the first synthesis of Yb3Cu9(OH)19Br8. We used a slurry of 0.754 Cu(NO3)2 3H2O, 0.7866 Yb(NO3)H2O, 1.459 KBr and 2ml H2O. Without further homogenization the slurries were transferred to a 23 mL teflon lined autoclave and heated to 230C for 3 days. All Br synthesis differ from that of the Cl samples as crystallization is rather a consequence of over-saturation and less of supercooling. Temperature variations confirmed this observation since higher temperatures led to a faster concentration change and different Br deficient phases were found. We tested variations of the composition, and the temperature profile and noticed that, for both systems, it is important to apply a temperature above 180C as otherwise the parent compound Cu2(OH)3(Br,Cl) form which can be readily detected since e.g. Cu2(OH)3Br shows a magnetic transition at around 10 K [47]. Notably, perfect quenching of a hot water solution is difficult and tiny impurities of Cu2(OH)3Br often cannot be avoided.
Single Crystal XRD
XRD at room temperature was performed on as grown single crystals of typical lateral sizes of 300 m. The crystals were attached with vacuum grease on a glass capillary. Diffraction data were collected with a Rigaku miniflex II, using graphite-monochromated Mo-Kα radiation ( = 0.71073 Å). The reflection intensities were integrated with the Rigaku software CrysAlis. All the diffraction data show patterns of reverse/obverse twins, typical for rhombohedral symmetry. The crystal structure was solved using Olex2 via the ShelX packages.
.1 Energy Dispersive X-ray
Energy-dispersive X-ray spectra (EDX) were recorded with a NORAN System 7 (NSS212E) detector in a Tescan Vega SEM (TS-5130MM) on flat hexagonal crystals, which were carbon sputtered.
Magnetization and Specific Heat
Magnetization measurements were performed on single crystals at temperatures K using a superconducting quantum interference device (MPMS-XL, Quantum Design) equipped with the He3 option. Specific-heat measurements were carried out, down to = 400 mK in a Physical Properties Measurement System (PPMS, Quantum Design) similarly equipped with the He3 option.
SR Experiments
SR measurements were performed with longitudinal field polarization in the range of 50 down to 0.03 K in zero-field (ZF), weak transverse field (TF), and longitudinal field (LF) on the instrument FLAME installed at the PSI muon facility. A set of of coaligned phase pure single crystals of sizes mm3 with their axis parallel to the initial muon spin direction were used.
Author contributions statement
The project was conceived and all experiments and analysis were carried out by P.P. The He3 measurements were supervised by R.K. SR experiments were conducted at PSI by J.A.K, T.J.H. H.L. and P.P. The manuscript was written by P.P. All authors reviewed the manuscript.
Data availability
The data are available upon request.
Competing interests
The authors declare no competing interests.