Faces of Fairness: Examining Bias in Facial Expression Recognition Datasets and Models
Abstract
Building AI systems, including Facial Expression Recognition (FER), involves two critical aspects: data and model design. Both components significantly influence bias and fairness in FER tasks. Issues related to bias and fairness in FER datasets and models remain underexplored. This study investigates bias sources in FER datasets and models. Four common FER datasets—AffectNet, ExpW, Fer2013, and RAF-DB—are analyzed. The findings demonstrate that AffectNet and ExpW exhibit high generalizability despite data imbalances. Additionally, this research evaluates the bias and fairness of six deep models, including three state-of-the-art convolutional neural network (CNN) models: MobileNet, ResNet, XceptionNet, as well as three transformer-based models: ViT, CLIP, and GPT-4o-mini. Experimental results reveal that while GPT-4o-mini and ViT achieve the highest accuracy scores, they also display the highest levels of bias. These findings underscore the urgent need for developing new methodologies to mitigate bias and ensure fairness in datasets and models, particularly in affective computing applications. See our implementation details at https://github.com/MMHosseini/bias_in_FER.
Index Terms:
Bias, Fairness, Facial Expression Recognition, Facial Affect Analysis, Bias in FER Datasets, Bias in FER Algorithms.1 Introduction
Facial expressions serve as a key non-verbal communication channel for humans [1], allowing them to express emotions and shape behavior, social interactions, and lifestyle [2]. Automated facial expression recognition (FER) has a borad range of applications, including mental health monitoring [3], human-computer interaction (HCI)[4], and surveillance[5]. Deep learning methods have recently achieved significant progress in FER, particularly through the use of convolutional neural networks (CNNs) [6], transformers [7], and large vision-language models [8].
Despite advancements in deep learning, bias and fairness issues in FER systems remain unexplored. Bias refers to prejudices or favoritism toward groups, while fairness ensures impartiality and avoids disparities [9, 10]. Bias can be analyzed in two dimensions: datasets and models [9, 11, 12]. Datasets mainly suffer from missing data, noisy data, labeling problems, imbalanced distribution, scalability, and bias. However, some classification approaches have been proposed to tackle these problems [13, 14, 15]. Dataset bias often arises from demographic imbalances, such as disparities in age, gender, or race [9]. Model bias stems from architecture, training process, and unrepresentative datasets [16, 17, 18, 19]. Bias impacts model performance for underrepresented groups, reduces generalizability, and compromises fairness. Addressing bias in datasets and models is crucial for fairness in FER.
Bias in machine learning can be classified in various ways. Pagano et al. [20] identified three types: (1) pre-existing bias from inequalities in data, (2) technical bias introduced during model design, and (3) emergent bias causing system-level disparities. Pagano’s model argues bias mainly originates from data [21]: underrepresented demographic groups in training data lead to poorer performance. Expanding this theory, Cheong et al. [22] identified three sources: i) dataset bias which is related to imbalanced data, ii) labeling bias that describes incorrect labels, and iii) contextual bias originating from image capture conditions.
Various bias mitigation strategies have been proposed to address these issues: a) pre-processing methods, which focus on data manipulation before training [23, 24], b) in-processing methods, which aim to reduce bias during the training phase [25, 26], and c) post-processing methods, which tend to mitigate bias after the model is trained [20, 21, 27]. Bias mitigation endeavors can target either the data or the algorithms themselves, depending on the source of bias.
Despite the above-mentioned efforts to address bias, there is a notable research gap in automatic FER, particularly in in-the-wild datasets and novel deep models. In-the-wild datasets introduce biases from variations in illumination conditions, camera resolution, background noise, head pose, and gesture, as well as demographic attributes of age, gender, and race [28]. Moreover, many studies have focused on limited sources of bias, primarily examining label distributions or one or two demographic attributes [29, 30, 31]. This approach overlooks the multifaceted nature of bias in FER. Additionally, recent advancements in deep architectures, such as vision transformers [32] and large vision-language models [33, 34], have significantly impacted this field. However, their implications for bias and fairness in FER tasks remain largely unexplored. Fig. 1 shows the approach we utilize different metrics to evaluate various aspects of bias and fairness in the datasets and models.
This research aims to address gaps by examining overlooked aspects of bias and fairness in FER. We provide a comprehensive analysis of bias and fairness in both datasets and deep models. Specifically, we argue that both datasets and models can introduce bias into FER systems. To assess the impact of datasets, we analyze four real-world FER datasets: AffectNet [35], ExpW [5], RAF-DB [36], and Fer2013 [37]. The bias in these datasets is evaluated using three metrics: Richness [38], Evenness [39], and Dominance [40]. Additionally, we investigate inherent biases in the datasets through experiments, as discussed in Sec. 3.1.

In this study, we evaluate six deep models, commonly used for FER tasks. To this aim, we train three CNN models, i.e., MobileNetV1 [41], ResNet-50 [42], XceptionNet [43], and the vision-transformer-based ViT [32] model, using all the aforementioned datasets. From the two large language-vision models, CLIP [33] is fine-tuned using the datasets, while GPT-4o-mini [34] is evaluated without training or fine-tuning. We refer to MobileNetV1 as MobileNet and ResNet-50 as ResNet in the paper. To assess the bias of these models, we leverage four key bias metrics: Equalized Odds [44], Equal Opportunity [44], Demographic Parity [45, 46], and Treatment Equality [47]. These metrics capture aspects of bias and fairness, allowing for a comprehensive evaluation of the six models across multiple attributes. This methodology facilitates a fair and thorough comparison of their respective bias scores.
The experiments conducted in this study show that AffectNet is the most diverse dataset, while RAF-DB ranks the lowest in diversity. Regarding model performance, despite the high accuracy of the GPT-4o-mini and ViT models, they exhibited the highest bias scores when evaluated using the bias metrics. In contrast, ResNet demonstrated the lowest bias score, making it the fairest model among those tested in this study. Our implementation code and more detail about our experiments is reachable at GitHub.
In the remainder of this paper, Sec. 2 provides a review of the literature on bias and fairness in both datasets and algorithms. In continue, Sec. 3 outlines the metrics used for evaluating bias, while Sec. 4 discusses bias scores for the datasets and models. Finally, Sec. 5 concludes this bias study in FER.
2 Literature Review
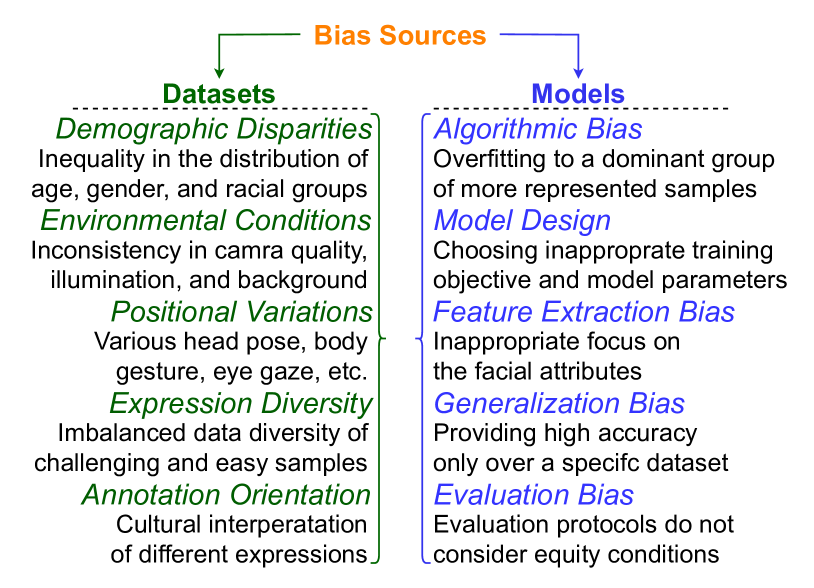
FER has many applications, such as sensitive biometrics [48], where biased data or algorithms can cause irreparable damages. Understanding the sources of bias is essential for effectively addressing its challenges. Bias can originate from both datasets and models. Factors such as data collection and annotation processes, model architecture, objective functions, and evaluation methodologies are among the primary sources of bias. Figure 2 presents a general classification of bias sources. Addressing bias in deep machine learning methods can significantly enhance the reliability and accuracy of FER models. More importantly, developing fair and unbiased deep methods for FER methods potentially ensures equitable treatment across diverse demographic groups [49]. Thus, dealing with bias in FER has recently raised attention from researchers. Examining data distribution in existing FER datasets [50, 51, 52, 30, 53, 22], as well as analyzing the algorithms used in the FER models [28, 54, 21, 55, 27, 56] are the key approaches for studying bias in FER. In the following section, we review recent studies that address bias in FER models and datasets.
2.1 Bias in FER Datasets
Bias in datasets is broadly categorized into representational bias and stereotypical bias [50, 51, 52]. Representational bias focuses mainly on the demographic diversity of data, including age, gender, and race attributes. This bias is evaluated using metrics like Richness, Evenness, and Dominance (for definitions see Sec. 3.1). On the other hand, stereotypical bias investigates the correlation between specific subgroups and their corresponding labels, which can lead to unfair or biased outcomes.
Another categorization of bias in dataset divided them into intrinsic and extrinsic biases [57, 58, 59]. Intrinsic bias inherent to the process of data collection, i.e., the way data are collected, sampled, and labeled. Demographic attributes, such as age, gender, and race, as well as head-pose, gesture, eye-gaze, and expression intensity are studied as intrinsic biases. On the contrary, extrinsic bias refers to the disparities that could affect the model’s performance. For example, lab-controlled datasets can lead to high biases in models, because they are not collected based on the real-world scenarios. Extrinsic bias mainly stems from environmental conditions, such as camera resolution, background noise, illumination, and annotator bias. There are other definitions of bias in dataset. While Cheong et al. [22] grouped bias sources as observed and non-observed sources, Terhorst et al. [60] classified bias sources into demographic and non-demographic groups. Despite all these different bias categorizations, a strong consensus is that demographic attributes, including age, gender, and race, are the most effective sources of bias in dataset that need to be studied.
In the following we review the most notable works on this topic. Dominguez et al. [50] proposed seventeen representational metrics, where they ranked AffectNet [35], ExpW [5], RAF-DB [36], and Fer2013 [37] among the most diverse FER datasets. It is notable that their stereotypical metrics showed different results for this four datasets where they did not achieve good scores and rankings. Another research by Li et al. [30] studied the intrinsic bias among seven different FER datasets and reported that the main reasons for bias in datasets are cultural differences and data collection conditions. Huber et al. [53] studied bias in synthetic facial datasets where they revealed that synthetic datasets follow the same bias patterns as the authentic datasets used for training their corresponding models. Finally, Cheong et al. [22] used a directed acyclic graph (DAG) to explore the relation between sources of bias. They introduced gender and age as the strongest sources of bias in emotion labeling. These experiments highlight the importance of dataset analysis in FER tasks, especially demographic attributes and their correlation with the labels for each subgroup. In Sec. 3.1 we review some common metrics for data analysis, and in Sec. 4.1 demonstrate their results.
2.2 Bias in FER Algorithms
The analysis of bias in FER algorithms involves examining how deep models and algorithms impact various demographic groups, aiming to enhance fairness and improve emotion recognition accuracy. Below, we review recent studies addressing algorithmic bias. While some studies tried to reduce the bias of the model’s using data compensation, some experiments revealed that there are some inherent biases in the models irrelevant to the data.
To mitigate the effects of imbalanced data distribution, Yu et al. [54] utilized unlabeled data in a semi-supervised learning framework. This framework leveraged unlabeled facial data by assigning pseudo-labels to underrepresented samples in the datasets. As a result, their method achieved a more balanced data distribution and improved the overall accuracy of the FER system. In a related study, Kolahdouzi et al. [55] introduced a Hilbert-space kernel to compute the mean distribution of specific demographic groups. To reduce bias, they subtracted a facial image’s embedding from the extracted mean, obscuring sensitive attributes such as age, gender, and race. Furthermore, Liang et al. [27] investigated the influence of facial attributes on model performance. They categorized these attributes into protected attributes (e.g., gender and race) and unprotected attributes (e.g., pose and lighting). Their findings demonstrated that protected attributes affect model performance, contributing to bias in predictions.
In contrast, some researchers argue that biases originate from the models. Dooley et al. [21] hypothesized that bias stems from the architecture of deep models. They employed a joint CNN architecture with one component emphasizing fairness and another focusing on extracting hyperparameters to mitigate bias. Their results indicated that bias remains inherently tied to model architecture. Abdullah et al. [56] conducted experiments focusing on the attention areas allocated to faces by the models. They observed that the attention area assigned to dark-skinned faces was smaller compared to lighter skin tones, revealing an inherent bias in the models. Xu et al. [28] compared a baseline model, ResNet-18 [42], with two disentangled and attribute-aware models. Their experiments demonstrated that data augmentation did not significantly enhance the accuracy of the baseline model. Similarly, Amigo et al. [49] proposed a debiasing variational autoencoder to address bias in models. Their findings showed that, despite training on different datasets, models could perpetuate biases. Furthermore, Dominguez et al. [61] revealed that stereotypical biases are intrinsic to models, regardless of whether the training data is balanced or imbalanced. These findings underscore the importance of studying bias and fairness in both data and algorithms.
2.3 Perspectives
Bias and fairness in facial expression recognition are critical to preventing discrimination, ensuring equitable systems, improving performance across diverse populations, and upholding ethical standards. Real-world FER applications rely on in-the-wild datasets, making it imperative to thoroughly examine commonly used datasets to identify and address bias issues. While some studies have partially investigated these datasets, a more comprehensive exploration of popular FER datasets is needed.
At the same time, recent advancements in model architectures, such as deep convolutional neural networks, vision transformers, and large vision-language models, have significantly improved FER accuracy [62, 63, 64]. However, despite their broad adoption, these models must be rigorously evaluated for fairness and bias mitigation. This study provides an in-depth analysis of bias in four prominent FER datasets—AffectNet, ExpW, Fer2013, and RAF-DB—and assesses six state-of-the-art models, including MobileNet, ResNet, XceptionNet, ViT, CLIP, and GPT-4o-mini.
3 Methodology
Bias and fairness are entangled and multifaceted concepts, with various definitions proposed in the literature (see [65]). Fairness is often described as the absence of favoritism or unjust privilege toward any group [9], while bias refers to prejudice or preferential treatment toward certain cases [50]. In essence, bias pertains to the data, whereas fairness focuses on the algorithms that process it. Numerous metrics have been introduced to measure both bias and fairness in datasets and algorithms (see [50, 66]). In the following sections, we delve into the selected metrics for evaluating datasets and algorithms, aiming to provide a comprehensive understanding of their impact on facial expression recognition.
3.1 Data Analysis
In Sec. 2.1, we explored various classifications of bias, including intrinsic vs. extrinsic, observed vs. non-observed, demographic vs. non-demographic, and representational vs. stereotypical categories. Bias can manifest in many ways, such as through camera inconsistencies, background variations, body posture differences, and, most notably, demographic imbalances. Among these, demographic attributes—age, gender, and race—emerge as the most significant contributors to bias in FER datasets. As a result, these attributes, along with label distribution, warrant the most attention in this study to address bias and promote fairness.
Building on the taxonomy proposed by Dominguez et al. [50], this study analyzes bias in dataset using two major categories of metrics. Representational metrics examine the Richness, Evenness, and Dominance of the dataset, while stereotypical metrics reveal the local and global relationships between attributes.
Richness evaluates the total number of samples within a dataset. More samples lead to a higher Richness score. However, this metric solely considers the quantity of samples, without addressing their distribution across various attributes [38].
We consider as the basic Richness equation where is Richness of dataset and stands for the number of samples correspond to dataset . To have a better understanding and scoring, we normalized the Richness score of each dataset, in the range , through Eq. 1, where is maximum Richness score of all the datasets.
| (1) |
Evenness measures the equity of data distribution across different classes of attributes. It is commonly assessed using the Shannon’s Evenness Index [67], which quantifies how uniformly the samples are distributed in the datasets.
| (2) |
Eq. 2 shows the Shannon’s Evenness Index, where represents the Evenness, refers to the total number of classes, denotes the number of samples in class i, and is total number of samples. indicates a perfectly even distribution, whereas reflects an uneven data distribution.
Dominance measures the extent to which one group holds an advantage over other groups within a dataset. Since this definition gives more score to non-uniform data distribution, we subtracted it from 1, to convert it to the same range and the concept that we are using for the Richness and Evenness metrics. The proposed metric for assessing Dominance is the Simpson’s Dominance Index [40],
| (3) |
which provides a quantitative evaluation of this phenomenon. In this equation, represents Dominance, denotes the total number of classes, is the proportion of samples in each class , and indicates the number of samples in a class, and the total number of samples, respectively. In this metric, a value of signifies that one class dominates entirely, while reflects a more evenly distribution across classes.
Global-Stereotypical and Local-Stereotypical metrics examine the correlation between an attribute and a class label. Global-Stereotypical metrics focus on the overall relationship between an attribute and data distribution, such as the connection between age groups and expression labels. Local-Stereotypical metrics delve into more specific relationships, analyzing the connection between a particular attribute value and a class label. For example, the relationship between the attribute value ’age-group = young’ and the Happy expression.
To investigate the local and global stereotypical metrics across different datasets, we extracted the data distribution for each dataset based on expression labels, as well as demographic attributes, age, gender, and race. The mathematical definition of the data distribution is provided in Eq. 4 as follows:
| (4) |
where represents an attribute selected from expression, age, gender, or race, is any possible value for , is the frequency of , and is the total number of samples. In this study, utilizing DeepFace [68] definitions, age is classified into four ranges: [015], [1632], [3353], and [Over 54], gender is categorized as Woman or Man, and ultimately, six racial groups of White, Black, Asian, Indian, Latinx, and Middle Eastern, are considered.
In addition, we assessed the conditional data distribution of each dataset. Given that each expression class is associated with three attributes—age, gender, and race—we explored the data distribution under both single and joint conditions. This was done using the general distribution equation , where the denominator remains constant across all conditions, allowing us to simplify it to . Equations 5, 6, and 7 present the mathematical formulation of this analysis.
| (5) |
| (6) |
|
|
(7) |
In Eqs. 5, 6, 7, shows the expression, while , , correspond to the facial attributes age, gender, and race, with , , , representing their respective values.
To evaluate the intrinsic biases of each dataset, we designed an experiment where a model is trained to recognize the datasets. In this experiment, each sample was labeled with its corresponding dataset name, for both the training and validation sets. The model was then trained to predict the dataset of each image. High accuracy in this experiment indicates higher intrinsic biases, such as those related to illumination, background noise, camera resolution, gesture, eye gaze, head pose, hair color, and any other hidden bias in the datasets. In other words, a stronger correlation between any pair of datasets reflects a lower intrinsic bias in those datasets.
We conducted an additional experiment to evaluate intrinsic biases by implementing a leave-one-dataset-out approach. In this experiment, we trained a deep model for FER using all except one dataset, which was held out for test. By assessing the model’s performance on the excluded dataset, we aimed to identify potential biases within the dataset itself while also measuring the model’s ability to generalize across different data sources. In this experiment, a lower accuracy suggests bias in the datasets. To ensure a fair comparison, we trained the model on the training sets of all datasets except one, validated its accuracy using their respective validation sets, and tested the bias using the validation set of the excluded (left-out) dataset. If the results of the validation and test experiments show similar accuracies, the model is considered unbiased. If there is a discrepancy, it indicates that the dataset suffers from bias.
To sum up, we extracted statistical data from each dataset and designed two model-based experiments—the dataset recognition model and the leave-one-dataset-out FER model—to assess both intrinsic and extrinsic biases within the datasets.
3.2 Model Analysis
A variety of general metrics have been proposed to evaluate fairness in machine learning models. Verma et al. [65] introduced three categories of fairness parameters: statistical measures, similarity-based measures, and causal reasoning. Additionally, Mittal et al. [66] presented metrics, such as parity-based metrics, score-based metrics, and facial-analysis-specific metrics.
Recent studies have explored various bias and fairness metrics [20, 9, 69]. While some researchers introduced their own metrics, most studies have concentrated on widely recognized metrics such as Equalized Odds [44], Equal Opportunity [44], Demographic Parity [45, 46], Treatment Equality [47]. In this study, we focus on these four metrics and evaluate the bias and fairness of the models. Before delving deeper into these metrics, it is essential to explain the concepts of protected and unprotected groups. Protected groups are privileged against discrimination, while unprotected groups may face exclusion or bias.
Equalized Odds evaluates fairness by examining the positive predicted samples. Specifically, for both protected and unprotected groups, the model should exhibit similar ratios of True Positives (TP) and False Positives (FP). In other words, the likelihood of correctly identifying a positive case or making a False Positive prediction should not depend on the group membership.
| (8) |
where . Equation 8 states that for an attribute , a fair model will produce equal ratios of True Positives (TPs) and False Positives (FPs) for both the protected group () and unprotected group (). For example, consider gender as the attribute, where . A fair model should yield identical TP and FP ratios for females () and males (). This ensures the model’s predictions are not disproportionately influenced by gender, satisfying Equalized Odds.
Equal Opportunity focuses exclusively on the True Positive samples. Specifically, for a protected and an unprotected group, the probability of correctly predicting a positive outcome () should be the same. The key difference between this metric and Equalized Odds is that, while Equalized Odds consider both True Positives () and False Positives (), Equal Opportunity is solely concerned with the True Positive ().
| (9) |
Eq. 9 evaluates the equity in the ratio of TP between the protected () and unprotected () groups.
Demographic Parity, also referred to as statistical parity, examines the independence of predictions from protected attributes. In essence, it evaluates the distribution of positive predictions, irrespective of whether they are TP or FP. This measure expects a uniform distribution of predictions across different groups. Eq. 10 provides a formal definition of Demographic Parity.
| (10) |
For instance, when considering the attribute race, the number of samples predicted as should be balanced across all racial groups, such as Black, White, and Asian.
Treatment Equality examines the distribution of errors across different demographic groups. Specifically, it ensures that the ratio of False Negatives (FNs) to False Positives (FPs) remains consistent between protected and unprotected groups (see Eq. 11).
| (11) |
For example, the ratio of FN to FP should be consistent across all age groups, such as children, young adults, mature adults, and older individuals. Interestingly, some studies choose to evaluate this relationship by calculating the ratio of FPs to FNs instead.
To obtain an evaluation score for fairness (bias score) in each model, we applied the four bias metrics to each expression label. Next, we selected the maximum bias across all expressions as the bias score for that metric (see Eq.12). To assess the bias of each attribute, we averaged the bias scores across the different metrics using Eq.13. Finally, the overall bias of each model was calculated by averaging the bias scores of the attributes (Eq. 14).
| , | (12) |
| , | (13) |
| . | (14) |
In Eq. 12, represents all seven basic expressions (Neutral, Happy, Sad, Surprise, Fear, Disgust, and Anger) [70]. In Eq. 13, denotes the number of bias metrics, while refers to the individual metrics (Equalized Odds, Equal Opportunity, Demographic Parity, and Treatment Equality). In Eq. 14, represents the number of attributes, and refers to all attributes.
To sum up, we employed four well-established bias metrics to evaluate key attributes in facial expression analysis, namely age, gender, and race. Our experiments were conducted on six popular models to assess their fairness. The detailed discussion of the models’ bias will follow in Section 4.
4 Experimental Results
This section explores bias across four well-known FER datasets: AffectNet [35], Fer2013 [37], RAF-DB [36], and ExpW [5]. Additionally, it examines the fairness in six distinct generations of deep models, including three CNN models: MobileNet [41], ResNet [42], XceptionNet [43], as well as three transformer-based models: ViT [32], CLIP [33], and GPT-4o-mini [34].
4.1 Bias in Datasets
Many studies suggest that the primary sources of bias in machine learning models lie in the data itself [10, 9, 11]. Consequently, to investigate bias in FER, it is essential to first examine the datasets. While numerous facial attributes can contribute to bias (see [60]), and a variety of biases can be present within the datasets (see [22, 9]), our focus is on the three most prominent facial attributes. In the following sections, we provide an overview of the datasets used in our study and detail the preprocessing steps we applied. Additionally, we explore the data distribution, attribute correlations, and model-based analysis.
4.1.1 Datasets
Although numerous FER datasets exist, only a few feature in-the-wild facial images. By considering factors such as popularity, number of expression labels, and annotation methods, we selected four datasets for our study: AffectNet [35], Fer2013 [37], RAF-DB [36], and ExpW [5]. All these datasets include at least six Ekman [70] basic expression labels, including Happy, Sad, Surprise, Fear, Disgust, Anger, plus Neutral, manually annotated by annotators.
| RAF-DB | Fer2013 | ExpW | AffectNet | |||||||||||||
| Exp | Age | Gen | Race | Exp | Age | Gen | Race | Exp | Age | Gen | Race | Exp | Age | Gen | Race | |
| Richness | 5.3 | 5.3 | 5.3 | 5.3 | 12.4 | 12.4 | 12.4 | 12.4 | 30.9 | 30.9 | 30.9 | 30.9 | 100 | 100 | 100 | 100 |
| Evenness | 84.2 | 52.9 | 96.4 | 69.7 | 93.0 | 54.5 | 95.7 | 58.0 | 77.1 | 54.4 | 87.0 | 76.6 | 74.0 | 52.8 | 97.3 | 70.8 |
| Dominance | 76.1 | 47.8 | 47.5 | 60.2 | 82.6 | 51.0 | 47.0 | 49.9 | 72.3 | 50.2 | 41.2 | 65.3 | 69.1 | 48.0 | 48.2 | 60.5 |
| Average | 53.9 | 34.0 | 48.4 | 43.7 | 59.6 | 36.2 | 48.6 | 37.0 | 52.4 | 37.4 | 45.3 | 49.9 | 56.0 | 41.9 | 56.8 | 52.1 |
| Diversity | 45 | 45.4 | 46.3 | 51.7 | ||||||||||||
AffectNet is the largest in-the-wild FER dataset, comprising nearly 1 million images, with half of them manually annotated. It includes eight expressions (seven basic expressions plus Contempt), continuous labels (valence-arousal), and additional metadata. Fer2013 contains approximately 36K images, divided into 29K training samples and 3.5K validation samples. However, its small image size (4040 pixels) and grayscale color representation pose limitations. RAF-DB provides both single-label and compound-label subsets, with around 30K facial images and facial landmark annotations. The compound-labeling approach in RAF-DB results in 19 expressions, including the seven basic expressions and 12 compound expressions such as Happily-Surprise and Sadly-Angry. Finally, ExpW is a large-scale FER dataset, featuring over 90K manually annotated facial images. We utilize these datasets in our study to train and evaluate our models.
4.1.2 Data Preprocessing
We used four in-the-wild datasets, each with different image sizes. In the first step, we aligned the images by ensuring the same cropping area, image size, and color domain across all the datasets. To achieve a consistent cropping area, we extended the original crop region by 25 to 35 percent in each dimension for all images. We then used the DeepFace model [71, 72] to process the extended crop and align the facial images across all datasets. Next, we resized all cropped faces to . While three datasets are in the RGB color domain, Fer2013 is grayscale. To address this, we replicated the grayscale layer three times to match the RGB format, ensuring uniformity across the data. Additionally, since the ExpW dataset lacks a validation set, we randomly selected 10 percent of its images to serve as the validation set.
4.1.3 Data Diversity and Distribution
After data processing and achieving a unified format, we used the DeepFace model [68] to extract facial attributes, including age, gender, and race. Ages were classified into four ranges: [015], [1632], [3353], and [Over 54]. DeepFace predicts six racial categories: White, Black, Asian, Indian, Latinx, and Middle Eastern. For gender classification, the model outputs either Woman or Man. Throughout the remainder of this paper, we will use these terms to refer to the attribute values.
In our initial experiment, we assessed the diversity scores of the datasets using the metrics described in Sec. 3.1, namely Richness, Evenness, and Dominance. By applying Eqs. 1, 2, and 3, we derived the diversity scores summarized in Table I. This table presents the diversity scores for each dataset, where the average score is a weighted combination of the attributes. Notably, Richness was assigned a weight of 0.25 because it is a dataset-level metric rather than an attribute-specific one, resulting in the same score across all attributes. The overall diversity score was then calculated as the mean of these weighted averages. Our findings indicate that AffectNet is the most diverse dataset, whereas the other datasets scored below 50 on average out of 100.
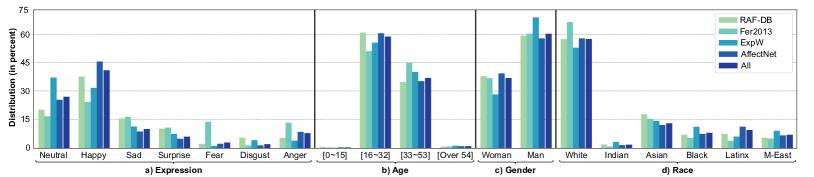
In a subsequent experiment, we applied global-and-local-stereotypical metrics (Eq. 4) to evaluate data bias. Fig. 3-a depicts the expression distribution of datasets, highlighting that Neutral and Happy are the most prevalent, whereas Fear and Disgust are the least represented. Notably, Fer2013 and RAF-DB demonstrate a more balanced distribution of expressions compared to the pronounced imbalances observed in AffectNet and ExpW. Fig. 3-b reveals a pronounced bias in dataset across age groups, with the [1632] and [3353] ranges being significantly overrepresented. In contrast, samples from the [015] and [Over 54] age groups account for less than 5% of the total data in all datasets.
As shown in Fig. 3-c, the number of Man samples is approximately 50% more than Woman, though this gender bias is less pronounced compared to other attributes. Fig. 3-d, on the other hand, highlights a notable racial imbalance, with White samples constituting over 50% of the total across all datasets. The distribution of Asian, Black, Latinx, and Middle Eastern samples is more balanced, while Indian samples remain consistently underrepresented. In conclusion, an examination of the data distribution across four essential attributes—age, gender, race, and expression—uncovers notable imbalances that may introduce bias into the model. Addressing these disparities is vital to ensuring fairness in FER systems.
4.1.4 Attributes Correlation
Building upon the global-and-local-stereotypical analysis, we applied Eq. 5 to explore bias across the data samples. Additionally, examining the correlation between different attributes offers another meaningful approach for data analysis. For this purpose, we focused on expressions as the primary attribute and analyzed their correlation with other facial attributes of age, gender, and race.
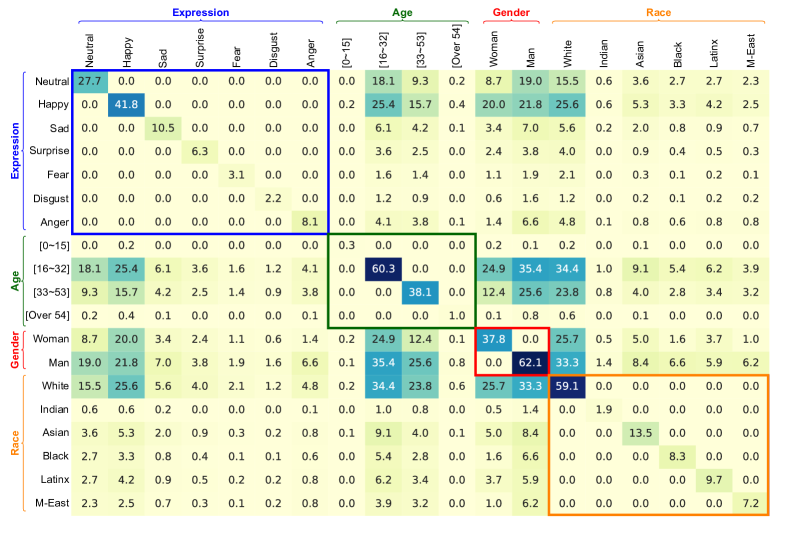
Figure 4 illustrates that 27.7% of the data is labeled Neutral, where 18.1% belong to the [1632] age group, and 9.3% fall within [3353]. In contrast, less than 0.3% of Neutral label corresponds to the two remaining age groups. Regarding gender distribution, Neutral reveals a significant disparity between Man and Woman samples, with the number of Man being more than double that of Woman. For racial distribution within this expression, 15.5% of the samples are associated with White, while the total representation of the other five racial groups is below 13%.
The distribution of Happy exhibits a similar bias toward the age groups [1632] and [3353]. However, no significant gender disparity is observed between Man and Woman. In contrast, bias exists toward White group for this expression. Compared to Happy and Neutral, the bias across attributes is less pronounced for the other expressions, particularly across age groups and racial categories. Among the datasets, ExpW demonstrates the highest bias, while Fer2013 emerges as the least biased.
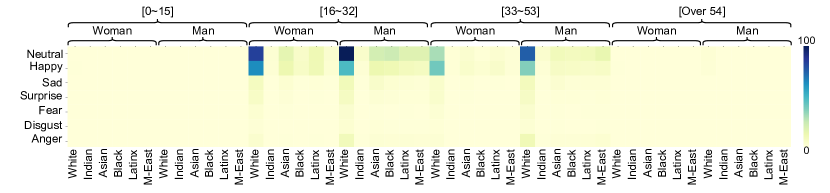
The joint attribute correlation, calculated using Eqs. 6 and 7, offers deeper insights into bias in dataset. Fig. 5 reveals that the Happy and Neutral expressions, [1632] and [3353] age groups, Man, and White are the most correlated values across attributes. Specifically, Happy and Neutral account for 60.7% of the data, 98.6% of the samples fall within the [1653] age range, 62.6% of the samples are labeled as Man, and White dominates with 59.3% of the racial distribution.
4.1.5 Dataset Generality
Based on the data distribution and correlation analysis, we examined demographic biases within the datasets. While demographic disparity is a primary source of bias, other factors such as illumination, head pose, image quality, background settings, lighting effects, and facial accessories also contribute to bias in dataset [58, 59, 73]. These sources of bias vary significantly across different datasets.
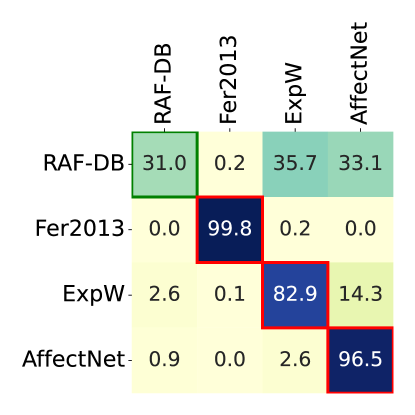
To investigate general bias in FER datasets, we conducted an experiment where a model was trained to identify the dataset to which any given image belongs. Each image was labeled with its respective dataset name, and the XceptionNet model [43] was trained to predict the dataset label. The results, as shown in Fig. 6, reveal biases inherent to FER datasets. While some correlation exists between RAF-DB and two other datsets (ExpW and AffectNet), Fer2013, ExpW, and AffectNet remain uncorrelated. This experiment underscores that differences in data collection methodologies—including image acquisition, processing, cropping, and storage—significantly affect FER datasets. Such biases, stemming from dataset-specific protocols, remain a relatively underexplored drawback in FER research.
| RAF-DB | Fer2013 | ExpW | AffectNet | |
| Validation | 59.0 | 54.1 | 59.0 | 57.0 |
| Test | 60.1 | 71.2 | 44.0 | 45.9 |
An additional experiment was conducted to further investigate the generality and biases inherent in the datasets. In this experiment, one dataset was excluded, and a facial expression recognition model (XceptionNet) was trained using the remaining datasets. To ensure fairness, the model was first evaluated on the unseen validation sets of the datasets included in training. Subsequently, the generalizability of the excluded dataset was assessed by testing the model on its images. Since the excluded dataset was not part of the training process, the results reflect the dataset’s bias. Table II compares the validation accuracies achieved on the included datasets with the test accuracy for the excluded dataset. Both Validation and Test accuracies in the table represent average per-class accuracies. Interestingly, the Test accuracies for RAF-DB and Fer2013 were higher than their Validation accuracies, while the opposite trend was observed for the ExpW and AffectNet datasets. For instance, when AffectNet was excluded, the Validation accuracy across the validation sets of RAF-DB, Fer2013, and ExpW was 57.0%. However, the Test accuracy on the excluded AffectNet dataset dropped to 45.9%. This result suggests that the challenges presented in the AffectNet dataset are not sufficiently captured by RAF-DB, Fer2013, and ExpW. A similar pattern was observed when the ExpW dataset was excluded. Conversely, for RAF-DB and Fer2013, the Validation accuracies were lower than their respective Test accuracies, demonstrating an inverse trend. Based on these findings, we conclude that the generalizability of the AffectNet and ExpW datasets is higher than that of RAF-DB and Fer2013. This indicates that RAF-DB and Fer2013 exhibit more inherent biases compared to AffectNet and ExpW.
4.2 Fairness of Models
After analyzing bias in the FER data, we further investigate bias and fairness within the models. As mentioned, four bias metrics are used to evaluate six deep models with different architectures. In the following sections, we describe our training methodology and then discuss the accuracy and bias of each model.
4.2.1 Training and Implementation Details
In this experiment, we selected six deep learning architectures, including both CNN- and transformer-based models: MobileNet, ResNet, XceptionNet, ViT, CLIP, and GPT-4o-mini. MobileNet was used as a baseline CNN model due to its streamlined feed-forward structure without residual connections, making it computationally efficient for mobile and embedded applications. ResNet and XceptionNet, incorporating residual connections, were chosen for their ability to mitigate the vanishing gradient problem and improve model accuracy. Among the transformer-based models, ViT represented a state-of-the-art approach for computer vision tasks, leveraging self-attention mechanisms instead of traditional convolutional operations. CLIP, a large vision-language model designed for multi-modal learning, enabled joint processing of images and text. Lastly, GPT-4o-mini, a lightweight variant of GPT-4, was included for its capability to efficiently handle both NLP and vision tasks.
The experiment was conducted using Python 3.8.10, TensorFlow 2.9.2 [74], and the Hugging Face [75] libraries. Four Nvidia 1080 GPUs with 8 GB and 12 GB of memory were utilized. As a preprocessing step, image dimensions were fixed at . We conducted experiments on each dataset and model separately and also merged the training and validation sets of all datasets for subsequent experiments. Notably, after merging the datasets, we obtained 404,755 training samples and 22,858 validation samples.
In the first experiment, we fully trained four models, including MobileNet, ResNet, XceptionNet, and ViT, using each dataset and then evaluated their accuracy over their corresponding validation set. In the next experiment, we concatenated training sets, trained all the models, and evaluated them using the concatenated validation set. All four models were trained for 30 epochs with a fixed batch size of 35. The Adam optimizer was used with a learning rate of for MobileNet, ResNet, and XceptionNet, and for the ViT model. The two other Adam parameters were set to beta-1 = and beta-2 = for all models. Notably, we selected the categorical cross-entropy loss function for our training process.
Aside from the ViT model, we also leveraged two other transformer-based models, CLIP and GPT-4o-mini. These two models are large vision-language models capable of handling multiple tasks. Since CLIP is trained on multi-modal datasets and is open-source, we fine-tuned its decision-making head using each training set of different datasets, and their combined version. Then we evaluated its accuracy and fairness on each dataset and the concatenated version. We used the Adam optimizer with a learning rate of , beta-1 of , and beta-2 of . Additionally, we selected the categorical cross-entropy loss function for fine-tuning this model over 30 epochs with a batch size of 35.
GPT-4o-mini is another transformer-based vision-language model included in this research. However, since it is not open-source, we did not train or fine-tune it for this specific task. To evaluate this model and compare its accuracy and fairness with the other models, we only evaluated it using the validation set of each dataset and their combined version. We prompted all the facial images of the validation set into this model and asked it to assign one of the seven expressions used in this study. The prompt we used was: ”What is the expression of this person among happy, sad, surprise, fear, disgust, anger, and neutral, in only one word? Try to find one of these expressions, but if your prediction is out of these expressions, select the closest expression to it (among the 7 aforementioned expressions). If you cannot determine any expression, randomly select one of the mentioned expressions. If the predicted expression is another word in the family of the aforementioned expressions (happy, sad, surprise, fear, disgust, anger, neutral) change it to the corresponding word. For example, fearful is equal to fear, disgusted is equal to disgust, angry is equal to anger, surprised is equal to surprise, scared is equal to fear, and so on. If you randomly select an expression, do not need to explain, only generate the expression name. We can leverage this data for comparing their accuracy, and more importantly, models’ bias over each group of data, on over different demographic attributes, age, gender, and race.
4.2.2 Facial Expression Recognition
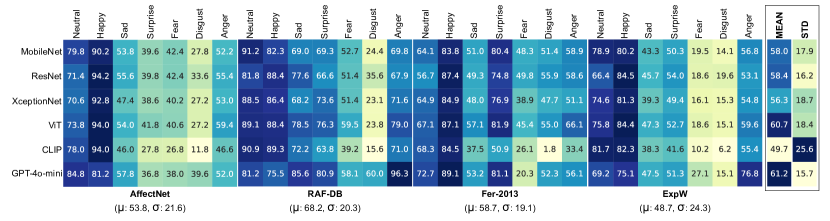
Figure 7 shows the accuracy of each model across the datasets, categorized by expression. The results highlight a noticeable bias toward Neutral and Happy expressions, where they achieved significantly higher accuracy scores compared to the other expressions, in all the models. When comparing the expression distribution in Figure 4 with the accuracy results in Figure 7, it becomes evident that data imbalance contributes to this bias. Nonetheless, the models displayed an ability to partially compensate for this imbalance. For example, although the ratio of Disgust to Happy data samples was highly skewed (), the accuracy gap between these two expressions was considerably narrower (), suggesting that the models made efforts to mitigate this bias during training.
| Neu | Hap | Sad | Sur | Fea | Dis | Ang | Mean | STD | |
| MobileNet | 66.6 | 86.8 | 53.2 | 60.1 | 45.6 | 31.0 | 57.5 | 57.3 | 17.4 |
| ResNet | 73.8 | 84.1 | 48.0 | 60.2 | 38.2 | 24.4 | 54.0 | 54.7 | 20.4 |
| XceptionNet | 77.3 | 82.3 | 51.5 | 61.3 | 44.8 | 24.7 | 57.7 | 57.1 | 19.6 |
| ViT | 75.3 | 86.7 | 56.5 | 64.0 | 42.8 | 25.1 | 64.3 | 59.2 | 20.4 |
| CLIP | 79.7 | 85.1 | 44.1 | 45.1 | 25.8 | 9.4 | 43.8 | 47.5 | 25.8 |
| GPT-4o-mini | 72.6 | 79.5 | 56.8 | 62.9 | 27.6 | 34.9 | 62.1 | 56.6 | 17.5 |
The average accuracy for each dataset, represented by in Fig. 7, demonstrates a correlation between dataset Richness and complexity. Richer datasets tend to be more challenging, leading to lower average accuracies. The last two columns of this figure, labeled Mean and STD, summarize the mean accuracy and standard deviation for each model. These results show GPT-4o-mini achieved the highest accuracy while maintaining the lowest standard deviation. This performance can be attributed to GPT-4o-mini’s extensive pretraining across diverse tasks and modalities, enabling it to extract features particularly well-suited for vision tasks. While this suggests GPT-4o-mini may be the fairest model, subsequent experiments reveal it exhibits significant biases.
In contrast to GPT-4o-mini, the CLIP model showed the worst performance, with an average accuracy below 50% and a high standard deviation exceeding 25%. These results indicate that the CLIP model is not well-optimized for FER tasks in its current form. Training the entire model, rather than just fine-tuning its decision-making head, could potentially improve its performance. Lastly, among the fully trained models (MobileNet, ResNet, XceptionNet, and ViT), ViT achieved the highest accuracy score, while ResNet exhibited the lowest standard deviation. Based solely on high accuracy and low standard deviation metrics, the models can be ranked from least to most accurate models as follows: GPT-4o-mini, ViT, ResNet, MobileNet, XceptionNet, and CLIP. We will discuss this ranking in the next sections, when we extract the metric-based bias scores.
Another experiment for FER models involved training each model using the training samples from all datasets and evaluating their performance on all validation sets. Fig. 8 displays the confusion matrix for these general models across all validation sets. At first glance, it is clear that Fear and Disgust are the most challenging expressions for all models, with none achieving more than 50% accuracy in predicting them.
A closer analysis reveals significant confusion among certain expressions. For instance, pairs like Sad-Neutral, Disgust-Neutral, and Disgust-Anger pose considerable challenges, with erroneous predictions in the range of [18.8-35.3] percent, while zero values would be expected. While Fig. 7 showed GPT-4o-mini as the top performer across various datasets, the general model results, summarized in Table III, indicate that the ViT model achieved the highest average accuracy in this experiment. Additionally, MobileNet had the lowest standard deviation, indicating more consistency in its predictions. For further details on the experiments, please visit our GitHub.
So far, we have assessed the models’ accuracy to evaluate their robustness against bias stemming from imbalanced data distribution. Our findings indicate that, overall, GPT-4o-mini and ViT are the most accurate models, while CLIP performed poorly. Although these results suggest that GPT-4o-mini and ViT might be the least biased models, subsequent experiments reveal different outcomes. In the next step, we will apply various bias metrics to further analyze the models’ biases across different attributes.
4.2.3 Bias Analysis
To investigate bias, we combined the training sets of all four datasets into a unified training set, applying the same approach to the validation sets. Four models—MobileNet, ResNet, XceptionNet, and ViT—were trained on the unified training set, and their bias scores were evaluated using the unified validation set. Additionally, the CLIP model was fine-tuned on the training set, and its bias scores were calculated using the validation set. For the GPT-4o-mini model, bias scores were directly quantified using the validation set without any additional training or fine-tuning. This section first explores bias across different attributes and expressions for each model, followed by a comparison of the models’ overall bias. It is notable that all the four bias metrics used Eq. 12 for their calculations.
| Neu | Hap | Sad | Sur | Fea | Dis | Ang | Max | Mean | STD | ||
| Age | 4.9 | 2.1 | 1.1 | 0.3 | 1.0 | 2.0 | 1.1 | 4.9 | 1.7 | 1.3 | |
| Gender | 7.7 | 12.7 | 2.2 | 2.3 | 0.1 | 5.9 | 2.8 | 12.7 | 4.8 | 3.9 | |
| MobileNet | Race | 11.6 | 9.0 | 7.1 | 5.9 | 2.2 | 7.7 | 4.7 | 11.6 | 6.8 | 2.8 |
| Age | 6.7 | 1.8 | 0.7 | 0.4 | 1.7 | 0.6 | 2.1 | 6.7 | 1.9 | 2.0 | |
| Gender | 6.9 | 11.6 | 0.8 | 2.3 | 0.5 | 2.8 | 4.4 | 11.6 | 4.1 | 3.6 | |
| ResNet | Race | 10.1 | 6.3 | 7.1 | 4.7 | 1.4 | 5.0 | 3.4 | 10.1 | 5.4 | 2.5 |
| Age | 5.1 | 2.0 | 0.9 | 0.5 | 1.9 | 1.0 | 1.1 | 5.1 | 1.7 | 1.4 | |
| Gender | 7.2 | 12.2 | 2.1 | 2.5 | 0.9 | 3.2 | 2.9 | 12.2 | 4.4 | 3.6 | |
| XceptionNet | Race | 10.2 | 7.9 | 6.3 | 5.7 | 1.4 | 5.2 | 2.8 | 10.2 | 5.6 | 2.7 |
| Age | 4.7 | 2.0 | 0.5 | 0.7 | 0.8 | 1.4 | 2.8 | 4.7 | 1.8 | 1.3 | |
| Gender | 9.5 | 13.4 | 0.5 | 2.9 | 0.4 | 2.8 | 4.8 | 13.4 | 4.8 | 4.4 | |
| ViT | Race | 13.1 | 9.6 | 9.1 | 6.0 | 1.5 | 4.3 | 5.2 | 13.1 | 6.9 | 3.5 |
| Age | 7.3 | 2.8 | 0.1 | 0.9 | 2.7 | 0.1 | 2.6 | 7.3 | 2.3 | 2.3 | |
| Gender | 8.4 | 11.0 | 1.3 | 2.2 | 1.2 | 0.1 | 6.7 | 11.0 | 4.4 | 3.9 | |
| CLIP | Race | 12.5 | 7.4 | 7.4 | 4.9 | 4.7 | 1.1 | 5.6 | 12.5 | 6.2 | 3.2 |
| Age | 3.3 | 1.3 | 2.2 | 0.5 | 1.2 | 0.6 | 4.1 | 4.1 | 1.8 | 1.2 | |
| Gender | 6.1 | 9.4 | 1.7 | 3.1 | 1.2 | 1.4 | 9.7 | 9.7 | 4.6 | 3.4 | |
| GPT-4o-mini | Race | 10.3 | 8.1 | 5.4 | 6.2 | 2.2 | 3.3 | 9.7 | 10.3 | 6.4 | 2.8 |
| Neu | Hap | Sad | Sur | Fea | Dis | Ang | Max | Mean | STD | ||
| Age | 8.3 | 2.0 | 4.0 | 5.2 | 4.6 | 0.4 | 1.5 | 8.3 | 3.7 | 2.4 | |
| Gender | 1.8 | 11.8 | 4.4 | 4.4 | 1.1 | 7.7 | 4.6 | 11.8 | 5.1 | 3.3 | |
| MobileNet | Race | 3.2 | 16.5 | 17.9 | 20.5 | 6.8 | 14.4 | 4.8 | 20.5 | 12.0 | 6.4 |
| Age | 9.5 | 3.0 | 1.8 | 4.9 | 3.8 | 2.3 | 0.7 | 9.5 | 3.7 | 2.6 | |
| Gender | 1.2 | 9.5 | 0.4 | 4.5 | 3.8 | 2.2 | 9.0 | 9.5 | 4.3 | 3.3 | |
| ResNet | Race | 5.6 | 14.9 | 21.3 | 21.2 | 8.8 | 15.1 | 2.9 | 21.3 | 12.8 | 6.7 |
| Age | 8.5 | 4.3 | 0.6 | 6.8 | 6.0 | 1.3 | 3.1 | 8.5 | 4.3 | 2.6 | |
| Gender | 1.2 | 10.9 | 0.8 | 4.9 | 2.6 | 9.0 | 8.5 | 10.9 | 5.4 | 3.7 | |
| XceptionNet | Race | 6.1 | 15.7 | 16.1 | 19.2 | 10.4 | 11.0 | 5.7 | 19.2 | 12.0 | 4.7 |
| Age | 5.8 | 1.6 | 4.3 | 3.7 | 4.4 | 0.1 | 1.4 | 5.8 | 3.0 | 1.8 | |
| Gender | 4.3 | 11.9 | 7.1 | 8.3 | 3.6 | 5.5 | 11.0 | 11.9 | 7.3 | 2.9 | |
| ViT | Race | 4.6 | 17.1 | 24.9 | 25.2 | 11.1 | 9.6 | 10.4 | 25.2 | 14.7 | 7.3 |
| Age | 7.3 | 1.7 | 3.1 | 9.4 | 6.6 | 4.4 | 0.2 | 9.4 | 4.6 | 3.0 | |
| Gender | 2.8 | 9.0 | 2.8 | 7.9 | 7.4 | 7.4 | 15.4 | 15.4 | 7.5 | 3.9 | |
| CLIP | Race | 6.5 | 12.0 | 21.4 | 15.4 | 27.3 | 7.6 | 13.0 | 27.3 | 14.7 | 6.8 |
| Age | 4.5 | 0.0 | 6.5 | 5.8 | 0.6 | 9.6 | 2.7 | 9.6 | 4.2 | 3.1 | |
| Gender | 1.0 | 6.9 | 3.0 | 10.7 | 13.6 | 14.9 | 17.9 | 17.9 | 9.7 | 5.8 | |
| GPT-4o-mini | Race | 4.9 | 15.3 | 11.2 | 28.9 | 14.9 | 11.5 | 10.5 | 28.9 | 13.8 | 6.9 |
The first metric, Equalized Odds, examines the fairness of True Positive (TP) and False Positive (FP) rates across different groups. Table IV highlights that the Neutral and Happy expressions were the most biased, with nearly all maximum biases for age, gender, and race originating from these two expressions. For the Age attribute, Surprise emerged as the least biased expression, whereas for Gender and Race attributes, Fear showed the lowest bias. The Max column of this table reveals that the Age attribute consistently exhibited the lowest bias across all models. In contrast, Gender displayed the highest bias in four out of six models. However, for the CLIP and GPT-4o-mini models, Race was the most biased attribute. The Mean and STD columns further emphasize that, on average, Race was the most biased attribute across all models, while Age demonstrated the least bias. When comparing the Mean and STD values among the models, the Equalized Odds metric indicates that the ViT model was the most biased overall, while ResNet demonstrated the lowest bias score.
| Neu | Hap | Sad | Sur | Fea | Dis | Ang | Max | Mean | STD | ||
| Age | 5.0 | 0.9 | 0.9 | 0.3 | 1.0 | 3.1 | 1.1 | 5.0 | 1.7 | 1.5 | |
| Gender | 8.4 | 15.6 | 0.7 | 2.3 | 0.1 | 7.4 | 2.9 | 15.6 | 5.3 | 5.1 | |
| MobileNet | Race | 9.1 | 8.0 | 6.9 | 5.4 | 1.9 | 8.1 | 2.9 | 9.1 | 6.0 | 2.5 |
| Age | 6.5 | 0.8 | 0.8 | 0.1 | 1.7 | 1.0 | 2.2 | 6.5 | 1.8 | 1.9 | |
| Gender | 7.3 | 13.9 | 1.0 | 2.3 | 0.1 | 3.1 | 4.5 | 13.9 | 4.6 | 4.3 | |
| ResNet | Race | 7.2 | 7.6 | 7.0 | 4.6 | 0.8 | 4.4 | 3.4 | 7.6 | 5.0 | 2.2 |
| Age | 5.1 | 0.3 | 1.3 | 0.4 | 2.0 | 1.3 | 1.2 | 5.1 | 1.6 | 1.5 | |
| Gender | 8.6 | 14.9 | 2.6 | 2.4 | 0.5 | 3.4 | 3.2 | 14.9 | 5.0 | 4.6 | |
| XceptionNet | Race | 10.0 | 9.5 | 6.8 | 5.4 | 1.6 | 4.8 | 2.6 | 10.0 | 5.8 | 2.9 |
| Age | 4.6 | 0.1 | 0.4 | 0.5 | 0.9 | 1.6 | 2.8 | 4.6 | 1.5 | 1.5 | |
| Gender | 11.3 | 16.1 | 0.1 | 2.8 | 0.3 | 3.1 | 5.0 | 16.1 | 5.5 | 5.5 | |
| ViT | Race | 13.5 | 9.9 | 9.0 | 6.4 | 1.2 | 3.7 | 5.3 | 13.5 | 7.0 | 3.8 |
| Age | 6.5 | 1.8 | 0.2 | 1.1 | 2.7 | 0.1 | 2.9 | 6.5 | 2.1 | 2.0 | |
| Gender | 10.6 | 13.9 | 0.0 | 2.5 | 0.9 | 0.1 | 6.8 | 13.9 | 4.9 | 5.1 | |
| CLIP | Race | 11.9 | 5.9 | 7.6 | 4.2 | 4.6 | 1.2 | 4.5 | 11.9 | 5.7 | 3.0 |
| Age | 3.6 | 0.6 | 1.6 | 0.6 | 1.3 | 0.4 | 4.4 | 4.4 | 1.7 | 1.4 | |
| Gender | 8.4 | 12.8 | 0.1 | 3.3 | 1.2 | 0.6 | 9.5 | 12.8 | 5.1 | 4.6 | |
| GPT-4o-mini | Race | 5.5 | 9.5 | 5.5 | 6.8 | 2.3 | 2.9 | 9.8 | 9.8 | 6.0 | 2.7 |
| Neu | Hap | Sad | Sur | Fea | Dis | Ang | Max | Mean | STD | ||
| Age | 1.1 | 1.3 | 7.9 | 6.6 | 5.2 | 3.5 | 0.3 | 7.9 | 3.7 | 2.7 | |
| Gender | 1.9 | 26.4 | 12.4 | 14.3 | 1.6 | 8.7 | 6.5 | 26.4 | 10.2 | 7.9 | |
| MobileNet | Race | 28.4 | 46.8 | 38.8 | 19.9 | 21.7 | 11.0 | 54.3 | 54.3 | 31.5 | 14.4 |
| Age | 8.4 | 3.3 | 11.0 | 11.3 | 14.1 | 13.6 | 5.1 | 14.1 | 9.5 | 3.8 | |
| Gender | 11.4 | 10.4 | 6.5 | 12.8 | 9.3 | 1.2 | 16.0 | 16.0 | 9.6 | 4.3 | |
| ResNet | Race | 49.7 | 28.0 | 23.8 | 14.2 | 44.0 | 32.8 | 25.4 | 49.7 | 31.1 | 11.3 |
| Age | 1.5 | 11.4 | 0.6 | 1.7 | 14.5 | 17.3 | 1.5 | 17.3 | 6.9 | 6.6 | |
| Gender | 3.0 | 22.5 | 10.3 | 12.3 | 1.5 | 5.4 | 0.2 | 22.5 | 7.8 | 7.2 | |
| XceptionNet | Race | 35.7 | 48.2 | 14.5 | 24.9 | 33.9 | 29.8 | 19.1 | 48.2 | 29.4 | 10.4 |
| Age | 0.7 | 3.9 | 1.0 | 1.6 | 3.4 | 24.2 | 11.5 | 24.2 | 6.6 | 7.9 | |
| Gender | 7.7 | 34.8 | 2.8 | 4.9 | 1.0 | 16.0 | 16.2 | 34.8 | 11.9 | 10.8 | |
| ViT | Race | 29.5 | 61.7 | 44.8 | 22.8 | 19.5 | 31.4 | 43.5 | 61.7 | 36.1 | 13.6 |
| Age | 6.5 | 8.3 | 6.3 | 2.0 | 23.5 | 0.0 | 1.8 | 23.5 | 6.9 | 7.3 | |
| Gender | 1.0 | 15.2 | 4.9 | 1.1 | 1.7 | 3.2 | 33.6 | 33.6 | 8.6 | 11.1 | |
| CLIP | Race | 8.8 | 23.2 | 29.0 | 29.1 | 26.3 | 4.4 | 9.4 | 29.1 | 18.5 | 9.8 |
| Age | 6.2 | 6.3 | 15.8 | 1.9 | 4.2 | 14.1 | 5.1 | 15.8 | 7.6 | 4.8 | |
| Gender | 5.3 | 8.2 | 9.0 | 7.7 | 1.6 | 43.5 | 45.3 | 45.3 | 17.2 | 17.3 | |
| GPT-4o-mini | Race | 48.4 | 61.0 | 13.5 | 46.6 | 26.6 | 27.0 | 39.8 | 61.0 | 37.5 | 14.9 |
Another metric we introduced in Sec.3.2 is Equal Opportunity, which focuses on the ratio of TP predictions across different groups. Information about this metric is provided in Table V. Unlike Equalized Odds, this table shows that the Happy expression was not the most biased in terms of Equal Opportunity. For the Age attribute, Neutral ranked highest in bias, while for Gender and Race attributes, Happy and Surprise expressions exhibited the highest bias scores, respectively. Examining the Max, Mean, and STD columns of this table reveals that Race is the most bias-affected attribute across all models. Based on this metric, GPT-4o-mini exhibited the highest bias, while ResNet and MobileNet achieved the lowest bias scores. Comparing the Mean values from Tables IV and V, it becomes evident that Equal Opportunity demonstrates more bias than Equalized Odds. For instance, the bias range for Age in Equalized Odds was [1.7-2.3], while Equal Opportunity showed a higher bias range of [3-4.6].
Demographic Parity analyzes the likelihood of any group receiving a particular outcome. The data in Table VI shows that, compared to other bias metrics, Demographic Parity results in lower bias scores. For the Age attribute, the highest bias was observed in the Neutral expression, while Happy, Sad, and Surprise had minimal effects on the Demographic Parity of Age. In contrast, Happy was the most biased expression for the Gender attribute, while Fear and Sad showed the least bias. For the Race attribute, Neutral and Happy were the primary sources of bias, while Fear exhibited the lowest bias across all models. Although the Max column highlights higher biases for the Gender attribute, the Mean column underscores Race as the most biased attribute overall. As with the other bias metrics, Age remained the least biased attribute. The Mean and STD columns illustrate that for the Age attribute, the CLIP model was the most biased model, while for Gender and Race, the ViT model was the most biased model. Overall, considering the Mean bias scores, the ViT model emerged as the most biased, while ResNet demonstrated the least bias.
The final bias measure we examined is Treatment Equality, which assesses the distribution of misclassified samples across different groups. Table VII demonstrates that Treatment Equality resulted in higher bias scores. A detailed expression-level analysis shows that Sad, Fear, and Disgust were the main sources of bias for the Age attribute. While Happy and Anger exhibited the highest biases for the Gender attribute, Happy significantly influenced the bias score for Race in three out of the six models. Among the attributes, Race had the highest bias scores, while Age exhibited the lowest. This trend was consistent with our findings in the Equalized Odds and Equal Opportunity metrics. Comparing the Max column in Table VII with the Max columns in Tables IV, V, and VI shows that Treatment Equality exhibited higher bias scores across all attributes. In a model-wise comparison of Treatment Equality, CLIP showed the lowest bias score, while the highest bias was observed in GPT-4o-mini.
| Eq-Od | Eq-Op | De-Pa | Tr-Eq | Mean | Bias Score | ||
| Age | 4.9 | 8.3 | 5.0 | 7.9 | 6.5 | ||
| Gender | 12.7 | 11.8 | 15.6 | 26.4 | 16.6 | ||
| MobileNet | Race | 11.6 | 20.5 | 9.1 | 54.3 | 23.8 | 15.6 |
| Age | 6.7 | 9.5 | 6.5 | 14.1 | 9.2 | ||
| Gender | 11.6 | 9.5 | 13.9 | 16.0 | 12.7 | ||
| ResNet | Race | 10.1 | 21.3 | 7.6 | 49.7 | 22.1 | 14.6 |
| Age | 5.1 | 8.5 | 5.1 | 17.3 | 9.0 | ||
| Gender | 12.2 | 10.9 | 14.9 | 22.5 | 15.1 | ||
| XceptionNet | Race | 10.2 | 19.2 | 10.0 | 48.2 | 21.9 | 15.3 |
| Age | 4.7 | 5.8 | 4.6 | 24.2 | 9.8 | ||
| Gender | 13.4 | 11.9 | 16.1 | 34.8 | 19.0 | ||
| ViT | Race | 13.1 | 25.2 | 13.5 | 61.7 | 28.3 | 19.0 |
| Age | 7.3 | 9.4 | 6.5 | 23.5 | 11.6 | ||
| Gender | 11.0 | 15.4 | 13.9 | 33.6 | 18.4 | ||
| CLIP | Race | 12.5 | 27.3 | 11.9 | 29.1 | 20.2 | 16.7 |
| Age | 4.1 | 9.6 | 4.4 | 15.8 | 8.4 | ||
| Gender | 9.7 | 17.9 | 12.8 | 45.3 | 21.4 | ||
| GPT-4o-mini | Race | 10.3 | 28.9 | 9.8 | 61.0 | 27.5 | 19.1 |
To sum up, we analyzed the bias of the models for each attribute and expression, followed by a model-based bias comparison. Based on our experiments, the ViT model showed the highest bias in the Equalized Odds and Demographic Parity metrics, while GPT-4o-mini exhibited significant bias in the Equal Opportunity and Treatment Equality metrics. On the other hand, ResNet was the most robust model against bias in three out of four bias metrics.
To generate a unique mathematical bias score, we utilized Eqs. 13 and 14 to calculate the final bias score for each model. Table VIII presents the bias scores of each model across different attributes and bias metrics. As outlined in Eq. 12, we used the maximum bias score of each model (i.e., the Max column from Tables IV, V, VI, and VII) as the bias score for each model. In the next step, we calculated the average bias score for each model across all attributes using Eq. 13 (the average of each row in Table VIII). Finally, the overall bias score for each model was obtained by averaging the bias scores for each attribute by Eq. 14. In conclusion, the results showed that GPT-4o-mini was the most biased model, followed by ViT in second place. Additionally, this table highlights that residual-based models, including ResNet and XceptionNet, were the least biased models. Ultimately, our experiments rank the models from the most biased to the least biased as follows: GPT-4o-mini, ViT, CLIP, MobileNet, XceptionNet, and ResNet. Notably, this research focused solely on the FER task, and the observed bias in the models could be evaluated on different tasks, potentially yielding varying bias scores.
5 Discussion and Future Works
This research presented a comprehensive analysis of bias and fairness in FER. We examined four in-the-wild datasets (AffectNet, ExpW, Fer2013, and RAF-DB) and six popular deep models (MobileNet, ResNet, XceptionNet, ViT, CLIP, and GPT-4o-mini). We mainly focused on studying bias in demographic attributes, including age, gender, and race, as well as label distribution.
Based on the experiments conducted in this research, bias was examined in both datasets and models. Initially, bias within the datasets was analyzed using the Richness, Evenness, and Dominance metrics. The results indicated that ExpW is the most biased dataset, whereas AffectNet was identified as the least biased. Additionally, six state-of-the-art models were evaluated using four bias metrics: Equalized Odds, Equal Opportunity, Demographic Parity, and Treatment Equality. The findings revealed that, despite achieving high accuracy, the GPT-4o-mini and ViT models exhibited the highest levels of bias.
The contributions of this research are pivotal for advancing fairness in FER tasks. Below, we outline several open research directions in FER that can build on this study to address bias and promote fair decision-making:
-
•
Investigating non-demographic sources of bias, such as illumination, background noise, head pose, gestures, eye gaze, and hair color, within datasets and their impact on fairness of models.
-
•
Reporting the bias score of trained models for FER tasks alongside their accuracy, which enables a comprehensive evaluation, ensuring both the effectiveness and fairness of the models.
-
•
Comparing the biases present in lab-controlled datasets versus in-the-wild datasets, and analyzing their influence on model training and fairness outcomes.
-
•
Exploring face generator models as potential sources of bias in future datasets and developing fair data generation methods to address these issues.
-
•
Developing more robust FER models by incorporating fairness constraints into the loss function during training. Future work could examine methods for implementing such constraints and their effects on model accuracy.
-
•
Analyzing the evolution of bias throughout the different stages of model development, including pretraining, training, fine-tuning, and domain adaptation.
-
•
Exploring the role of self-supervised learning methods in reducing bias within datasets and evaluating how they can contribute to fair model development.
-
•
Evaluating video-based datasets and models, where temporal dynamics between sequences are critical, to mitigate bias in video-based FER tasks.
-
•
Investigating bias in multi-modal models that leverage data from diverse sources such as images, text, video, audio, and physiological signals.
This research highlighted the significance of considering bias and fairness in FER tasks. Establishing a foundation for enhancing the equity of FER models is essential. These improvements have the potential to benefit critical applications, including human-computer interaction (HCI), mental health monitoring, and surveillance. Future studies will focus on proposing methods to address bias in FER tasks while maintaining high accuracy.
References
- [1] A. Schirmer, I. Croy, K. Liebal, and S. R. Schweinberger, “Non-verbal effecting–animal research sheds light on human emotion communication,” Biological Reviews, 2024.
- [2] R. J. Dolan, “Emotion, cognition, and behavior,” Science, vol. 298, no. 5596, pp. 1191–1194, 2002.
- [3] F. Jiang, X. Fu, and X. Zeng, “Facial expression recognition in mental health monitoring: A review,” Neurocomputing, vol. 392, pp. 128–143, 2020.
- [4] M. Pantic and L. J. Rothkrantz, “Toward an affect-sensitive multimodal human-computer interaction,” Proceedings of the IEEE, vol. 91, no. 9, pp. 1370–1390, 2003.
- [5] Z. Zhang, P. Luo, C. C. Loy, and X. Tang, “From facial expression recognition to interpersonal relation prediction,” International Journal of Computer Vision, vol. 126, no. 5, pp. 550–569, 2018.
- [6] R. A. Borgalli and S. Surve, “A hybrid optimized learning framework for compound facial emotion recognition,” in International Conference on Cognitive Computing and Cyber Physical Systems. Springer, 2025, pp. 447–459.
- [7] N. S. Fatima, G. Deepika, A. Anthonisamy, R. J. Chitra, J. Muralidharan, M. Alagarsamy, and K. Ramyasree, “Enhanced facial emotion recognition using vision transformer models,” Journal of Electrical Engineering & Technology, pp. 1–10, 2025.
- [8] I. Saadi, A. Hadid, D. W. Cunningham, A. Taleb-Ahmed, and Y. El Hillali, “Leveraging vision language models for facial expression recognition in driving environment,” in 9th international Workshop on Sensor-Based Activity Recognition and Artificial Intelligence (iWOAR 2024), 2024.
- [9] N. Mehrabi, F. Morstatter, N. Saxena, K. Lerman, and A. Galstyan, “A survey on bias and fairness in machine learning,” ACM computing surveys (CSUR), vol. 54, no. 6, pp. 1–35, 2021.
- [10] S. Barocas, M. Hardt, and A. Narayanan, Fairness and machine learning: Limitations and opportunities. MIT Press, 2023.
- [11] H. Suresh and J. V. Guttag, “A framework for understanding unintended consequences of machine learning,” arXiv preprint arXiv:1901.10002, vol. 2, no. 8, p. 73, 2019.
- [12] E. Ferrara, “Fairness and bias in artificial intelligence: A brief survey of sources, impacts, and mitigation strategies,” Sci, vol. 6, no. 1, p. 3, 2023.
- [13] S. N. Estiri, A. H. Jalilvand, S. Naderi, M. H. Najafi, and M. Fazeli, “A low-cost stochastic computing-based fuzzy filtering for image noise reduction,” in 2022 IEEE 13th International Green and Sustainable Computing Conference (IGSC). IEEE, 2022, pp. 1–6.
- [14] A. Shams, K. Becker, D. Becker, S. Amirian, and K. Rasheed, “Evolutionary cnn-based architectures with attention mechanisms for enhanced image classification,” Artificial Intelligence: Machine Learning, Convolutional Neural Networks and Large Language Models, vol. 1, p. 107, 2024.
- [15] A. Ganj, M. Ebadpour, M. Darvish, and H. Bahador, “Lr-net: a block-based convolutional neural network for low-resolution image classification,” Iranian Journal of Science and Technology, Transactions of Electrical Engineering, vol. 47, no. 4, pp. 1561–1568, 2023.
- [16] H. Liang, J. O. Caro, V. Maheshri, A. B. Patel, and G. Balakrishnan, “Linking convolutional kernel size to generalization bias in face analysis cnns,” in Proceedings of the IEEE/CVF Winter Conference on Applications of Computer Vision, 2024, pp. 4705–4715.
- [17] J. O. Caro, Y. Ju, R. Pyle, S. Dey, W. Brendel, F. Anselmi, and A. Patel, “Local convolutions cause an implicit bias towards high frequency adversarial examples,” arXiv preprint arXiv:2006.11440, 2020.
- [18] D. Dablain, B. Krawczyk, and N. Chawla, “Towards a holistic view of bias in machine learning: bridging algorithmic fairness and imbalanced learning,” Discover Data, vol. 2, no. 1, p. 4, 2024.
- [19] V. Veeramachaneni, “Large language models: A comprehensive survey on architectures, applications, and challenges,” Advanced Innovations in Computer Programming Languages, vol. 7, no. 1, pp. 20–39, 2025.
- [20] T. P. Pagano, R. B. Loureiro, F. V. Lisboa, R. M. Peixoto, G. A. Guimarães, G. O. Cruz, M. M. Araujo, L. L. Santos, M. A. Cruz, E. L. Oliveira et al., “Bias and unfairness in machine learning models: a systematic review on datasets, tools, fairness metrics, and identification and mitigation methods,” Big data and cognitive computing, vol. 7, no. 1, p. 15, 2023.
- [21] S. Dooley, R. Sukthanker, J. Dickerson, C. White, F. Hutter, and M. Goldblum, “Rethinking bias mitigation: Fairer architectures make for fairer face recognition,” Advances in Neural Information Processing Systems, vol. 36, 2024.
- [22] J. Cheong, S. Kalkan, and H. Gunes, “Causal structure learning of bias for fair affect recognition,” in Proceedings of the IEEE/CVF Winter Conference on Applications of Computer Vision, 2023, pp. 340–349.
- [23] J. Jiang, M. Wang, B. Xiao, J. Hu, and W. Deng, “Joint recognition of basic and compound facial expressions by mining latent soft labels,” Pattern Recognition, vol. 148, p. 110173, 2024.
- [24] M. M. Hosseini and M. Jamzad, “Facial mark detection and removal using graph relations and statistics,” in 2017 Iranian Conference on Electrical Engineering (ICEE). IEEE, 2017, pp. 2223–2228.
- [25] D. Yang, K. Yang, M. Li, S. Wang, S. Wang, and L. Zhang, “Robust emotion recognition in context debiasing,” arXiv preprint arXiv:2403.05963, 2024.
- [26] J. Yu, Z. Wei, and Z. Cai, “Exploring facial expression recognition through semi-supervised pretraining and temporal modeling,” arXiv preprint arXiv:2403.11942, 2024.
- [27] H. Liang, P. Perona, and G. Balakrishnan, “Benchmarking algorithmic bias in face recognition: An experimental approach using synthetic faces and human evaluation,” in Proceedings of the IEEE/CVF International Conference on Computer Vision, 2023, pp. 4977–4987.
- [28] T. Xu, J. White, S. Kalkan, and H. Gunes, “Investigating bias and fairness in facial expression recognition,” in European Conference on Computer Vision. Springer, 2020, pp. 506–523.
- [29] J. Deuschel, B. Finzel, and I. Rieger, “Uncovering the bias in facial expressions,” arXiv preprint arXiv:2011.11311, 2020.
- [30] S. Li and W. Deng, “A deeper look at facial expression dataset bias,” IEEE Transactions on Affective Computing, vol. 13, no. 2, pp. 881–893, 2020.
- [31] Y. Chen and J. Joo, “Understanding and mitigating annotation bias in facial expression recognition,” in Proceedings of the IEEE/CVF International Conference on Computer Vision, 2021, pp. 14 980–14 991.
- [32] A. Dosovitskiy, L. Beyer, A. Kolesnikov, D. Weissenborn, X. Zhai, T. Unterthiner, M. Dehghani, M. Minderer, G. Heigold, S. Gelly et al., “An image is worth 16x16 words: Transformers for image recognition at scale,” arXiv preprint arXiv:2010.11929, 2020.
- [33] A. Radford, J. W. Kim, C. Hallacy, A. Ramesh, G. Goh, S. Agarwal, G. Sastry, A. Askell, P. Mishkin, J. Clark et al., “Learning transferable visual models from natural language supervision,” in International conference on machine learning. PMLR, 2021, pp. 8748–8763.
- [34] J. Achiam, S. Adler, S. Agarwal, L. Ahmad, I. Akkaya, F. L. Aleman, D. Almeida, J. Altenschmidt, S. Altman, S. Anadkat et al., “Gpt-4 technical report,” arXiv preprint arXiv:2303.08774, 2023.
- [35] A. Mollahosseini, B. Hasani, and M. H. Mahoor, “Affectnet: A database for facial expression, valence, and arousal computing in the wild,” IEEE Transactions on Affective Computing, vol. 10, no. 1, pp. 18–31, 2017.
- [36] S. Li, W. Deng, and J. Du, “Reliable crowdsourcing and deep locality-preserving learning for expression recognition in the wild,” in Proceedings of the IEEE conference on computer vision and pattern recognition, 2017, pp. 2852–2861.
- [37] I. J. Goodfellow, D. Erhan, P. L. Carrier, A. Courville, M. Mirza, B. Hamner, W. Cukierski, Y. Tang, D. Thaler, D.-H. Lee et al., “Challenges in representation learning: A report on three machine learning contests,” in International conference on neural information processing. Springer, 2013, pp. 117–124.
- [38] L. Jost, “Entropy and diversity,” Oikos, vol. 113, no. 2, pp. 363–375, 2006.
- [39] M. O. Hill, “Diversity and evenness: a unifying notation and its consequences,” Ecology, vol. 54, no. 2, pp. 427–432, 1973.
- [40] E. SIMPON, “Measurement of diversity,” Nature, vol. 688, p. 163, 1949.
- [41] A. G. Howard, M. Zhu, B. Chen, D. Kalenichenko, W. Wang, T. Weyand, M. Andreetto, and H. Adam, “Mobilenets: Efficient convolutional neural networks for mobile vision applications,” arXiv preprint arXiv:1704.04861, 2017.
- [42] K. He, X. Zhang, S. Ren, and J. Sun, “Deep residual learning for image recognition,” in Proceedings of the IEEE conference on computer vision and pattern recognition, 2016, pp. 770–778.
- [43] F. Chollet, “Xception: Deep learning with depthwise separable convolutions,” in Proceedings of the IEEE conference on computer vision and pattern recognition, 2017, pp. 1251–1258.
- [44] M. Hardt, E. Price, and N. Srebro, “Equality of opportunity in supervised learning,” Advances in neural information processing systems, vol. 29, 2016.
- [45] C. Dwork, M. Hardt, T. Pitassi, O. Reingold, and R. Zemel, “Fairness through awareness,” in Proceedings of the 3rd innovations in theoretical computer science conference, 2012, pp. 214–226.
- [46] M. J. Kusner, J. Loftus, C. Russell, and R. Silva, “Counterfactual fairness,” Advances in neural information processing systems, vol. 30, 2017.
- [47] R. Berk, H. Heidari, S. Jabbari, M. Kearns, and A. Roth, “Fairness in criminal justice risk assessments: The state of the art,” Sociological Methods & Research, vol. 50, no. 1, pp. 3–44, 2021.
- [48] L. Igene, A. Hossain, M. Z. U. Chowdhury, H. Rezaie, A. Rollins, J. Dykes, R. Vijaykumar, A. Komaty, S. Marcel, S. Schuckers et al., “Face liveness detection competition (livdet-face)-2024,” in 2024 IEEE International Joint Conference on Biometrics (IJCB). IEEE, 2024, pp. 1–9.
- [49] G. Amigo, P. R. Perea, and R. J. Marks, “Mitigating algorithmic bias on facial expression recognition,” arXiv preprint arXiv:2312.15307, 2023.
- [50] I. Dominguez-Catena, D. Paternain, and M. Galar, “Metrics for dataset demographic bias: A case study on facial expression recognition,” IEEE Transactions on Pattern Analysis and Machine Intelligence, 2024.
- [51] I. Dominguez-Catena, M. Galar, and D. Paternain, “Gender stereotyping impact in facial expression recognition,” in Joint European Conference on Machine Learning and Knowledge Discovery in Databases. Springer, 2022, pp. 9–22.
- [52] I. Dominguez-Catena, D. Paternain, and M. Galar, “Assessing demographic bias transfer from dataset to model: A case study in facial expression recognition,” arXiv preprint arXiv:2205.10049, 2022.
- [53] M. Huber, A. T. Luu, F. Boutros, A. Kuijper, and N. Damer, “Bias and diversity in synthetic-based face recognition,” in Proceedings of the IEEE/CVF Winter Conference on Applications of Computer Vision, 2024, pp. 6215–6226.
- [54] J. Yu, Z. Cai, R. Li, G. Zhao, G. Xie, J. Zhu, W. Zhu, Q. Ling, L. Wang, C. Wang et al., “Exploring large-scale unlabeled faces to enhance facial expression recognition,” in Proceedings of the IEEE/CVF Conference on Computer Vision and Pattern Recognition, 2023, pp. 5803–5810.
- [55] M. Kolahdouzi and A. Etemad, “Toward fair facial expression recognition with improved distribution alignment,” in Proceedings of the 25th International Conference on Multimodal Interaction, 2023, pp. 574–583.
- [56] S. M. S. Abdullah, S. R. Zeebaree, and M. B. Abdulrazzaq, “Effects of different datasets, models, face-parts on accuracy and performance of intelligent facial expression recognition systems,” International Journal of Intelligent Systems and Applications in Engineering, vol. 12, no. 15s, pp. 366–381, 2024.
- [57] S. M. Mavadati, M. H. Mahoor, K. Bartlett, P. Trinh, and J. F. Cohn, “Disfa: A spontaneous facial action intensity database,” IEEE Transactions on Affective Computing, vol. 4, no. 2, pp. 151–160, 2013.
- [58] N. Srinivas, K. Ricanek, D. Michalski, D. S. Bolme, and M. King, “Face recognition algorithm bias: Performance differences on images of children and adults,” in Proceedings of the IEEE/CVF conference on computer vision and pattern recognition workshops, 2019, pp. 0–0.
- [59] R. Singh, P. Majumdar, S. Mittal, and M. Vatsa, “Anatomizing bias in facial analysis,” in Proceedings of the AAAI Conference on Artificial Intelligence, vol. 36, no. 11, 2022, pp. 12 351–12 358.
- [60] P. Terhörst, J. N. Kolf, M. Huber, F. Kirchbuchner, N. Damer, A. M. Moreno, J. Fierrez, and A. Kuijper, “A comprehensive study on face recognition biases beyond demographics,” IEEE Transactions on Technology and Society, vol. 3, no. 1, pp. 16–30, 2021.
- [61] I. Dominguez-Catena, D. Paternain, A. Jurio, and M. Galar, “Less can be more: representational vs. stereotypical gender bias in facial expression recognition,” Progress in Artificial Intelligence, pp. 1–21, 2024.
- [62] M. Rodrigo, C. Cuevas, and N. García, “Comprehensive comparison between vision transformers and convolutional neural networks for face recognition tasks,” Scientific reports, vol. 14, no. 1, p. 21392, 2024.
- [63] N. AlDahoul, M. J. T. Tan, H. R. Kasireddy, and Y. Zaki, “Exploring vision language models for facial attribute recognition: Emotion, race, gender, and age,” arXiv preprint arXiv:2410.24148, 2024.
- [64] Z. Zhao, Y. Cao, S. Gong, and I. Patras, “Enhancing zero-shot facial expression recognition by llm knowledge transfer,” arXiv preprint arXiv:2405.19100, 2024.
- [65] S. Verma and J. Rubin, “Fairness definitions explained,” in Proceedings of the international workshop on software fairness, 2018, pp. 1–7.
- [66] S. Mittal, P. Majumdar, M. Vatsa, and R. Singh, “On bias and fairness in deep learning-based facial analysis,” in Handbook of Statistics. Elsevier, 2023, vol. 48, pp. 169–221.
- [67] C. E. Shannon, “A mathematical theory of communication,” The Bell system technical journal, vol. 27, no. 3, pp. 379–423, 1948.
- [68] S. I. Serengil and A. Ozpinar, “Hyperextended lightface: A facial attribute analysis framework,” in 2021 International Conference on Engineering and Emerging Technologies (ICEET). IEEE, 2021, pp. 1–4. [Online]. Available: https://doi.org/10.1109/ICEET53442.2021.9659697
- [69] A. Chouldechova, “Fair prediction with disparate impact: A study of bias in recidivism prediction instruments,” Big data, vol. 5, no. 2, pp. 153–163, 2017.
- [70] P. Ekman and W. V. Friesen, “Constants across cultures in the face and emotion.” Journal of personality and social psychology, vol. 17, no. 2, p. 124, 1971.
- [71] S. Serengil and A. Ozpinar, “A benchmark of facial recognition pipelines and co-usability performances of modules,” Bilisim Teknolojileri Dergisi, vol. 17, no. 2, pp. 95–107, 2024. [Online]. Available: https://dergipark.org.tr/en/pub/gazibtd/issue/84331/1399077
- [72] S. I. Serengil and A. Ozpinar, “Lightface: A hybrid deep face recognition framework,” in 2020 Innovations in Intelligent Systems and Applications Conference (ASYU). IEEE, 2020, pp. 23–27. [Online]. Available: https://ieeexplore.ieee.org/document/9259802
- [73] A. M. Udefi, S. Aina, A. R. Lawal, and A. I. Oluwarantie, “An analysis of bias in facial image processing: A review of datasets,” International Journal of Advanced Computer Science and Applications, vol. 14, no. 5, 2023.
- [74] M. Abadi, A. Agarwal, P. Barham, E. Brevdo, Z. Chen, C. Citro, G. S. Corrado, A. Davis, J. Dean, M. Devin et al., “Tensorflow: Large-scale machine learning on heterogeneous distributed systems,” arXiv preprint arXiv:1603.04467, 2016.
- [75] T. Wolf, L. Debut, V. Sanh, J. Chaumond, C. Delangue, A. Moi, P. Cistac, T. Rault, R. Louf, M. Funtowicz et al., “Transformers: State-of-the-art natural language processing,” in Proceedings of the 2020 conference on empirical methods in natural language processing: system demonstrations, 2020, pp. 38–45.