The Impact of 12C()16O Reaction on the Presupernova Evolution and Supernova Explodability of Massive Stars
Abstract
Among the uncertainties of stellar evolution theory, we investigate how the 12C()16O reaction rate affects the evolution of massive stars for the initial masses of 13 - 40 M⊙ and the solar metallicity. We show that the explodability of these stars, i.e., which of a neutron star (NS) or a black hole (BH) is formed, is sensitive to the strength of convective shell burning of C and O, and thus the mass fractions of C ((C)) and O in the shell. For the small 12C()16O reaction rate that yields larger (C), (C) is further enhanced by mixing of C from the overlying layer and then C shell burning is strengthened. The extra heating by C shell burning tends to prevent the contraction of outer layers and decrease the compactness parameter at = 2.5 M⊙. This effect leads to the formation of smaller mass cores of Si and Fe and steeper density and pressure gradients at the O burning shell in the presupernova models. If the pressure gradient there is steeper, the model is more likely to explode to form a NS rather than a BH. We describe the pressure gradient against with and the density drop with , where and are non-dimensional variables to describe the stellar structure. We estimate the critical values of and at the O-burning shell above which the model is more likely to explode. We conclude that the smaller 12C()16O reaction rate makes the mass range of that forms a NS larger.
1 Introduction
In the Universe, stars are formed with various masses, evolve, and die. Understanding the nature and evolution of stars is essentially crucial in understanding the evolution of the Universe (e.g., Arnett, 1996). Extensive studies on spherical stars have shown that the evolution of stars are basically determined by their Zero-Age Main-Sequence masses (e.g., Hayashi et al., 1962). In particular, stars with 8 M⊙ evolve through hydrostatic nuclear burning and end their lives as core-collapse supernovae (e.g., Nomoto et al., 2013).
The exact explosion mechanism of core-collapse supernovae has not been well understood and the important properties of the explosion, e.g., the kinetic energy, has not been well-reproduced despite the extensive hydrodynamical simulations (e.g., Sugimoto & Nomoto, 1980). Possible sources of difficulties in the core-collapse supernova modeling include the complicated physical processes, such as neutrino transport during core-collapse and the difficulty in numerical treatment of those processes.
Another source of difficulty would be inaccuracies of the progenitor’s evolution and presupernova structure (e.g., Branch & Wheeler, 2017). Such inaccuracies may stem from uncertainties in the complicated evolution processes, which include mass loss (e.g., Renzo et al., 2017), convection (e.g., Woosley et al., 2002), rotation (e.g., Heger et al., 2008; Chatzopoulos et al., 2016), magnetic fields (e.g., Maeder & Stahler, 2009), and nuclear reactions (e.g., Weaver & Woosley, 1993; Sallaska et al., 2013; Fields et al., 2018).
A possible example of such inaccuracies of progenitor’s evolution is the “mass-gap” problem of black holes (BHs). The current stellar evolution theory predicts that stars of 140 M⊙ 300 M⊙ undergo thermonuclear explosions triggered by electron-positron pair-creation instability and are disrupted completely without leaving the compact object (Barkat et al., 1967, pair-instability supernova: PISN) 111For discussion on PISNe in this section, we assume that stars have low enough metallicities for a wind-type mass loss to be negligible (see, e.g., Limongi & Chieffi, 2015, for the wind effect on the core mass)..
In close binary systems, stars with form He stars with (He) = 65 - 140 M⊙, which undergo PISNe. The upper mass limit of BHs formed from (He) 65 M⊙ has been estimated to be 50 M⊙, while the lower mass limit of BHs from (He) 140 M⊙ is 140 M⊙ (Woosley, 2017). Therefore, the “mass-gap” of M⊙ due to PISNe has been predicted to exist for BHs in close binary systems.
However, the gravitational-wave (GW) signal GW190521 detected by LIGO/Virgo seems to originate from a merger of binary BHs ( M⊙ and M⊙; Abbott et al. 2020). The probability that at least one of them falls in the BH mass-gap due to PISNe is 99.0%.
This is a challenge to the stellar evolution theory. It has motivated many attempts to examine the effects of uncertainties involved in the stellar evolution, such as the reaction rate (Farmer et al., 2019, 2020; Costa et al., 2021), rotation (Marchant & Moriya, 2020; Mapelli et al., 2020), Super-Eddington accretion(van Son et al., 2020), magnetic fields(Keszthelyi et al., 2020) convection and overshooting(Renzo et al., 2020; Woosley & Heger, 2021; Kaiser et al., 2020).
Among those attempts is the study of the effects of the uncertainty of the 12CO reaction rate (Farmer et al., 2019, 2020; Costa et al., 2021). Those works have found that if the 12CO rate is smaller, the mass range of PISNe and thus the BH mass gap move to higher masses. The upper limit of the BH mass is 59, 71, and 94 M⊙, if the rate is smaller by 1, 2, and 3, respectively (Farmer et al., 2020).
To explain the observed BH masses of GW190521, the 12CO rate might be significantly smaller than the currently adopted in the stellar evolution calculations, although some combination with other effects might be necessary.
Motivated by these works, we study the effect of the 12CO rate on the evolution of massive stars. The effect of the 12CO rate has been studied on nucleosynthesis yields (Weaver & Woosley, 1993; Tur et al., 2007; West et al., 2013), carbon burning (Sukhbold et al., 2016; Sukhbold & Adams, 2020), and compactness (Sukhbold & Woosley, 2014). In the present work, we study the effects of this rate on the stellar structure and evolution through Fe core-collapse more systematically. In particular, we will focus on how the rate uncertainly affects the presupernova structure and the explodability, i.e., whether the progenitors explode or collapse (O’Connor & Ott, 2011; Ugliano et al., 2012; Ertl et al., 2016; Müller et al., 2016).
More specifically, to clarify the mass and the rate dependencies, we evolve stars with M⊙ from the ZAMS to Fe core-collapse with MESA by changing the 12CO rate in the range of . Effects on nucleosynthesis yields, including metallicity effects, will be reported in the forthcoming paper.
The uncertainties in the stellar structure and evolution also stem from the difference in computer codes and numerical methods. Thus our aim of the present study includes the comparison of our MESA results with other numerical results obtained with different codes such as Kepler (Weaver & Woosley, 1993; Sukhbold & Woosley, 2014), FRANEC (Chieffi & Limongi, 2020), and previous results by MESA (Farmer et al., 2016).
In Section 2, we describe the models and some basic definitions used in this work including non-dimensional variables and . In Section 3, we present the evolution of H and He burning and discuss the effect of 12CO rate on the mass fraction of 12C during He burning and the C ignition stages. In Section 4, we study how this reaction rate affects the evolution from C burning to the Fe core-collapse and the presupernova core structure for 28, 25 and 30 M⊙. In Section 5, we study the explodability of the presupernova models for all ranges of and studied here, showing the criterion of the explodability including the critical values of and . We then show how the mass range of stars to form a neutron star (NS) (or a BH) depends on the 12CO rate. In Section 6, summaries and discussion are given.
2 Models and Parameters
We employ the Modules for Experiments in Stellar Astrophysics (MESA, version 12778; Paxton et al. 2011, 2013, 2015, 2018, 2019; Jermyn et al. 2023) to evolve massive stars from ZAMS to Fe core-collapse. The packages “25M_pre_ms_to_core_collapse” (examples in the test suite directory of MESA) are modified to build our models.
2.1 Reactions and Nuclear Network
| Element | Element | ||||
|---|---|---|---|---|---|
| n | 1 | 1 | S | 31 | 34 |
| H | 1 | 2 | Cl | 35 | 37 |
| He | 3 | 4 | Ar | 35 | 38 |
| Li | 7 | 7 | K | 39 | 43 |
| Be1 | 7 | 10 | Ca | 39 | 44 |
| B | 8 | 8 | Sc | 43 | 46 |
| C | 12 | 13 | Ti | 44 | 48 |
| N | 13 | 15 | V | 47 | 51 |
| O | 14 | 18 | Cr | 48 | 57 |
| F | 17 | 19 | Mn | 51 | 56 |
| Ne | 18 | 22 | Fe | 52 | 58 |
| Na | 21 | 24 | Co | 55 | 60 |
| Mg | 23 | 26 | Ni | 55 | 61 |
| Al | 25 | 28 | Cu | 59 | 62 |
| Si | 27 | 30 | Zn | 60 | 64 |
| P | 30 | 32 |
-
1
8Be is not included.
To study nucleosynthesis, we adopt a large nuclear reaction network consisting of 128 isotopes (mesa_128.net, Paxton et al. 2011; Timmes 1999; Timmes et al. 2000). The isotopes included in this network are listed in Table 1. Farmer et al. (2016) studied the evolution with several sizes of network and concluded that 127 isotopes are needed to get convergence of various quantities of stellar models at the 10% level.
For weak interactions, the tabulation of Langanke & Martínez-Pinedo (2000); Oda et al. (1994); Fuller et al. (1985) are adopted. In this work, the reaction rates of 3 from Angulo et al. (1999), 12CO from Kunz et al. (2002), and the 12C+12C rate from Tumino et al. (2018) are adopted. Other reaction rates are taken from REACLIB (Cyburt et al., 2010).
Regarding the uncertainty of the 12CO rate, all direct measurements of this reaction rate have been performed at the energies higher than E 891 keV (Hammer et al., 2005), which is much higher than the energy (E 300 keV) corresponding to the temperature during helium burning (An et al., 2015).
The cross-section decreases exponentially at low energies, resulting from the small Coulomb penetrability. Therefore, it is necessary to extrapolate from the high energy to obtain the reaction rate in the astrophysics environment. However, most estimates are still far from the uncertainty of better than 10% required by stellar models (e.g., Woosley et al., 2002).
| -3 | -2 | -1 | 0 | 1 | 2 | 3 | |
|---|---|---|---|---|---|---|---|
| fC12α | 0.37 | 0.52 | 0.72 | 1 | 1.28 | 1.93 | 2.69 |
Since the uncertainty of the reaction rate follows the log-normal distribution, we can calculate the lower and upper rates given by for 12CO to cover 99% of the probability distribution of the rate (Sallaska et al., 2013). The here is defined by the following formula:
| (1) |
where and represent the high and low rates of the reactions, respectively. In the present work, we use to represent the uncertainty of the 12CO rate. We also show the value of the multipliers corresponding to each in Table 2.
M⊙
2.2 Input Physics
We calculate the evolution of 82 models in this work. For 0, we evolve stars with the initial masses of M⊙ for a mass interval of 1 M⊙. We also evolve stars with 20, 23, 25, 28, 30, 32, 35, 38, and 40 M⊙ for =1, 2, and 3.
For the convection zone, we use the mixing-length theory with the ratio between the mixing-length and the pressure scale height of 3.0 when the mass fraction of hydrogen is larger than 0.5 and 1.5 for other stage. We adopt the exponential scheme with 0.004 and 0.01 for the overshooting. The Dutch scheme is adopted for the mass loss with Dutch_scaling_factor=0.5. Three main mass loss prescriptions included in Dutch wind are from de Jager et al. (1988) for cool stars, Vink et al. (2001) for hot hydrogen-rich stars, and Nugis & Lamers (2000) for Wolf-Rayet stars.
For the initial elemental abundances, we assume the He mass fraction of and the H mass fraction of . Here, denotes the sum of the initial mass fractions of heavy elements, i.e., C and heavier elements. We assume the solar abundance ratios from Anders & Grevesse (1989) for isotopic abundance ratios among heavy elements.
2.3 Basics of Stellar Evolution
In this section, we describe some relations and definitions, which will be used later.
2.3.1 U-V Curves
The hydrostatic equilibrium of a spherical star gives two non-dimensional quantities, which has been defined in, e.g., Schwarzschild (1958), Hayashi et al. (1962), Sugimoto & Nomoto (1980), Nomoto (1984), Sugimoto & Fujimoto (2000) and Kippenhahn et al. (2013):
| (2) |
| (3) |
From Equations (2) and (3), we obtain as
| (4) |
Differentiating Equations (2) and (3), we also obtain
| (5) |
| (6) |
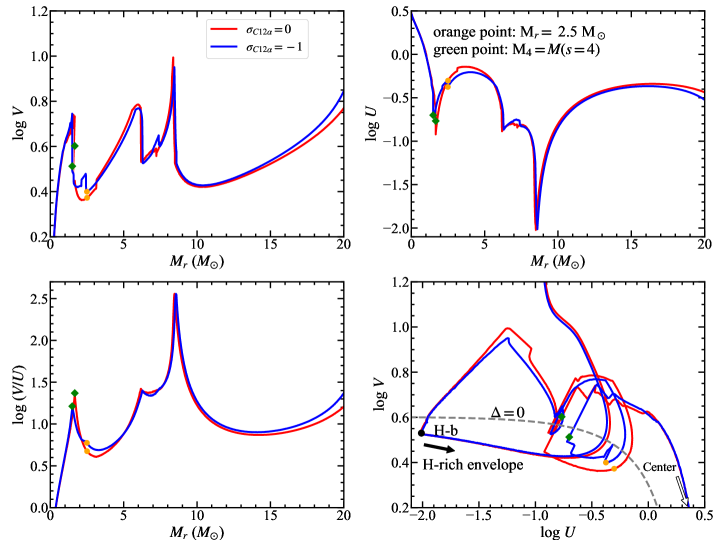
Here and , respectively, show the steepness of the gradients of log and log against log , which are crucially important for the explodability of stars as will be discussed later (Section 5.3). Note also that is the ratio between the local density at the enclosed mass and the mean density within the sphere of radius . If is very small (i.e., is very large), it indicates the existence of almost a density jump, which is also critical for explodability. is the ratio between gravitational energy and thermal energy.
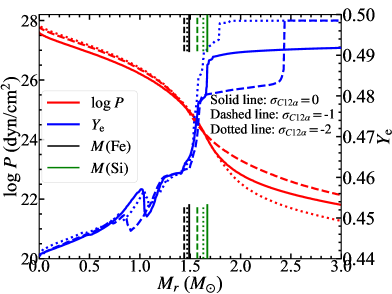
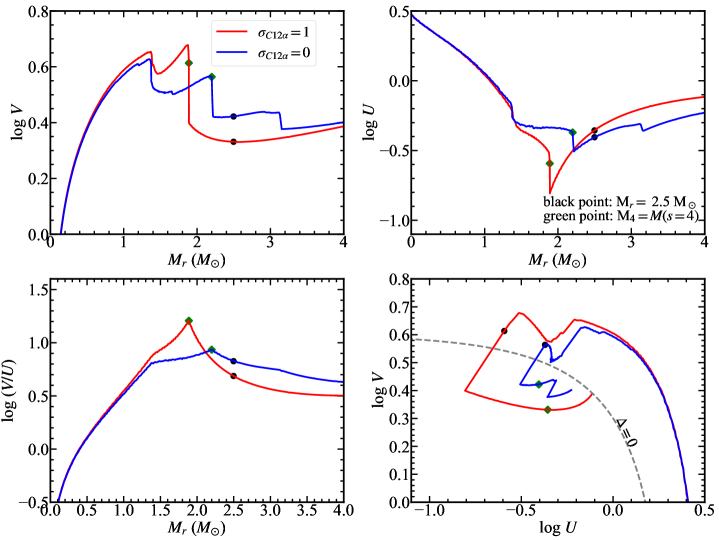
Figure 1 shows the curves of the 28 M⊙ star at the final stage when the central temperature reaches log (K) = 10.0. Here, we show the curves for and . Although the two curves look similar, important differences exist between the two cases, as will be discussed in Section 4.2.4.
In the log - log plot, we show the star’s center with the white arrow. The location of the hydrogen burning shell at 8.5 M⊙ and the direction of the H-rich envelope are indicated by the black point and arrow. The dashed line indicates the curve of (Sugimoto & Nomoto, 1980). The loop of the log - log curve shows a relatively large jump across . The location of the above jump is typically a nuclear burning shell at the core edge. This jump from large to small in the deep core is critical for explodability.
The black points indicate the place where M⊙, while the green squares show the place where , which is defined in Equation (14). These points will be discussed in later sections.
2.3.2 Negative Specific Heat
Another important quantity related to hydrostatic equilibrium is the effective mass () giving the relation between the central quantities and the mass (Nomoto & Hashimoto, 1988).
| (7) |
where the and are the central pressure and density, respectively; is a dimensionless mass that depends on the polytropic index in the central region as 10.73 and 16.14 for 1.5 and 3, respectively (Sugimoto & Nomoto, 1980).
Here the density () and pressure () are related by the polytropic index as
| (8) |
As will be discussed in later sections, corresponds to the core mass enclosed within the most active nuclear burning shell.
For an ideal gas of , where is the mean molecular weight, H the unit of atomic mass, and k the Boltzmann constant, Equation (7) gives
| (9) |
The specific entropy
| (10) |
is then given at the center as
| (11) |
where C1, C2, and C3 are additional constants. Equation 11 shows that for the same (i.e., for roughly the same nuclear burning stage), is higher (and is lower) for larger , i.e., higher is necessary to sustain larger mass against self-gravity. When the nuclear reaction is not active, the stellar core loses entropy by radiation and neutrinos and thus decreases. Equation (11) shows that both and increase as decreases for given as shown by
| (12) |
Equation (12) (Nomoto & Hashimoto, 1988) implies that the stellar core has the negative specific heat. The increase in means the stellar core contracts and releases gravitational energy, part of which goes into internal energy and the rest goes into radiation and neutrino losses.
3 Hydrogen Burning and Helium burning
3.1 Hydrogen Burning
| (Initial) | ||||
|---|---|---|---|---|
| (M⊙) | (M⊙) | (M⊙) | (M⊙) | (M⊙) |
| 13 | 0.17 | 0.60 | 0.64 | 12.36 |
| 14 | 0.19 | 0.79 | 0.83 | 13.17 |
| 15 | 0.22 | 0.98 | 1.02 | 13.98 |
| 16 | 0.25 | 1.43 | 1.48 | 14.52 |
| 17 | 0.29 | 1.81 | 1.86 | 15.14 |
| 18 | 0.33 | 1.66 | 1.71 | 16.29 |
| 19 | 0.37 | 2.49 | 2.55 | 16.45 |
| 20 | 0.39 | 2.51 | 2.58 | 17.42 |
| 21 | 0.42 | 2.75 | 2.82 | 18.18 |
| 22 | 0.46 | 2.87 | 2.94 | 19.06 |
| 23 | 0.51 | 2.93 | 3.01 | 19.99 |
| 24 | 0.55 | 4.07 | 4.15 | 19.85 |
| 25 | 0.61 | 3.88 | 3.97 | 21.03 |
| 26 | 0.62 | 4.61 | 4.70 | 21.30 |
| 27 | 0.69 | 4.96 | 5.06 | 21.94 |
| 28 | 0.78 | 5.76 | 5.85 | 22.15 |
| 29 | 0.89 | 5.76 | 5.86 | 23.14 |
| 30 | 0.99 | 6.07 | 6.17 | 23.83 |
| 31 | 1.11 | 7.60 | 7.70 | 23.93 |
| 32 | 1.23 | 7.85 | 7.97 | 24.03 |
| 33 | 1.35 | 8.37 | 8.51 | 24.49 |
| 34 | 1.48 | 8.50 | 8.63 | 25.37 |
| 35 | 1.62 | 9.69 | 9.81 | 25.19 |
| 36 | 1.77 | 10.62 | 10.74 | 25.26 |
| 37 | 1.91 | 11.25 | 11.38 | 25.62 |
| 38 | 2.06 | 12.06 | 12.12 | 25.88 |
| 39 | 2.22 | 12.12 | 12.24 | 26.76 |
| 40 | 2.38 | 12.85 | 12.97 | 27.03 |
M⊙
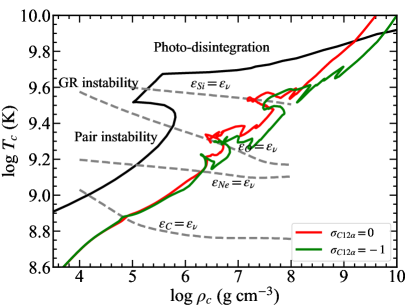
We evolve the stars from H burning with 0.70, 0.28, and 0.02 through the Fe core-collapse for 0 and 1. Figure 2 shows the evolution of stars of 28 M⊙ in the central density and temperature diagram. The blue dashed lines show the ignition lines of C burning (for (C) ), Ne burning, O burning and Si burning, where the energy generation rate by nuclear burning equals the energy loss rate by neutrino emissions. In the region on the left of the black line, stars are dynamically unstable due to the electron-positron pair creation (indicated as “pair instability”) (Ohkubo et al. 2009), general relativistic effects (“GR instability”) (see, e.g., Osaki 1966), and the photo-disintegration of matter in nuclear statistical equilibrium (NSE) at 0.5 (“photo-disintegration”) (Ohkubo et al. 2009).
H burning forms a He core. When the mass fractions of H at the center becomes , which is the end of H burning, we define the He core mass, (He), as an enclosed mass, , at the He core boundary where where changes inwardly from to .
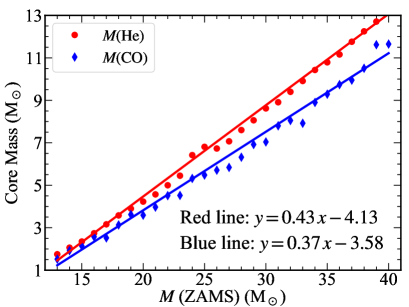
In Figure 3, we show (He) (M⊙) as a function of by the red points. We obtain the gray straight line of
| (15) |
by fitting the red points. (Of course, the (He) - relation does not depend on .)
Some deviations from the line may be due to different spatial and temporal resolutions in some models, which would affect the convective overshooting and thus the convective core mass. Our (He) - relation is in good agreement with other works (e.g., Sukhbold & Woosley, 2014).
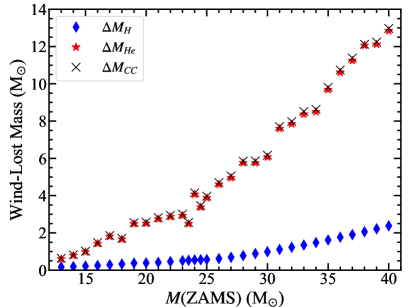
For 0.02, the wind mass loss is important during H and He burning. The accumulated lost masses at the end of H burning , He burning , and Fe core-collapse , are summarized in Table 3 and Figure 4.
3.2 Helium Burning
He burning synthesizes mainly 12C and 16O. As He) decreases, the central temperature increases to be high enough for the 12CO reaction to convert 12C to 16O.
We define the CO core mass, (CO), as at the CO core boundary where He) inwardly decreases below . We show (CO) as a function of by the blue points in Figure 3. We obtain the green straight line of
| (16) |
by fitting the blue points.
| 0 | 1 | ||||
|---|---|---|---|---|---|
| Stages | log (yr) | Convective Region () | log (yr) | Convective Region () | Comment |
| He EX | 4 | (12C)=0.176 | 4 | (12C)=0.264 | |
| C CB | 3 - 1 | radiative | 3 - 1 | radiative | |
| 1st C SB | 1 - 0 | radiative | 2 - 1 | radiative | CO core contraction |
| C EX | 0 | 0.3 | NeO core rapid contraction | ||
| 2nd C SB | 0 - | 1.7 - 4.0 | 1 - 0.1 | 1.2 - 3.2 | |
| Ne CB | - | 0.0 - 0.1 | 0.2 - | 0.0 - 0.1 | |
| Ne SB | - | 0.1 - 1.0 | 0.1 - 0.6 | ||
| O CB | - | 0.0 - 0.6 | - | 0.0 - 0.9 | |
| 3rd C SB | - | 2.2 - 6.5 | 0.1 - | 2.0 - 7.0 | Most important difference |
| 1st O SB | - | 0.9 - 1.5 | - | 0.9 - 1.5 | |
| 2nd O SB | - | 1.5 - 2.2 | - | 1.2 - 1.8 | |
| 3rd O SB | - | 1.7 - 2.2 | - | 1.2 - 2.0 | Bottom of O SB gives (Si) |
| Si CB | - | 0.0 - 0.4 | - | 0.0 - 1.0 | |
| 1st Si SB | - | 0.4 - 0.8 | - | 0.8 - 1.2 | |
| 2nd Si SB | - | 0.9 - 1.5 | - | 1.2 - 1.5 | Bottom of Si SB gives (Fe) |
-
•
CB, SB, and EX denote central burning, shell burning, and exhaustion stages, respectively.
M⊙,
M⊙,
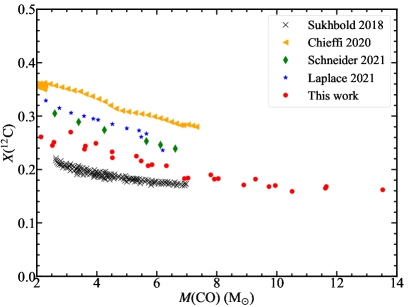
(12C) after He burning mainly depends on and is an important quantity for later stellar evolution, as will be discussed in Section 4. We thus compare (12C) in our work with others. As shown in Figure 5, (12C) in our models behaves similarly to other MESA works from Laplace et al. (2021) and Schneider et al. (2021). On the other hand, our result is located between those calculated by the KEPLER code (Sukhbold et al., 2018) and the FRANEC code (Chieffi & Limongi, 2020). These differences stem not only from different sources of the 12CO rate but also depend on other effects such as convective overshooting during the late phase of core He burning, 3D convective mixing in shell burning, as well as the binary stripping effect which is discussed in (Schneider et al., 2021).
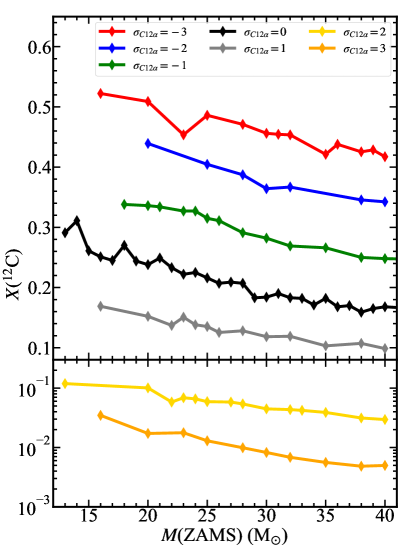
Figure 6 shows (12C) at the center when (4He) becomes lower than 10-4 as functions of and . We note that the effect of on (12C) is much larger than that of . For example, (12C) decreases from 0.51 to 0.02 as increases from to 3 for 20 M⊙.
3.3 Carbon Ignition
After the core He burning, the CO core contracts. Figure 2 shows that the evolution of the central density and temperature reaches the dashed line of the ignition of C burning (12C+12C), where the nuclear energy generation rate () is equal to the energy loss rate by neutrino emissions (). However, that the C ignition line is obtained for (12C) = 0.5. With smaller (12C), C burning is less energetic because depends on (12C)2. If (12C) is smaller than a certain value, . Then, C burning does not form a convective core and proceeds radiatively.
| -3 | -2 | -1 | 0 | 1 | |
|---|---|---|---|---|---|
| 26 | 24 | 22 | 20 | 16 |
Figure 6 shows that (12C) is smaller for larger and larger 12CO rate. Thus C burning proceeds radiatively for stars with 20 M⊙ in our models (also Chieffi & Limongi, 2020; Chieffi et al., 2021) as seen in Table 5 and will be discussed in detail in our forthcoming paper. For the 28 M⊙ stars, no convective core of C burning is formed for both and as seen in Figure 7.
4 Carbon Burning to Fe core-collapse
In the following subsections, we study how the 12CO rate affects the presupernova core structure and the explodability (e.g., Weaver & Woosley, 1993; Timmes et al., 1996) by comparing the evolutionary features for several cases. We particularly focus on the stars with = 28 M⊙, 25 M⊙, and 35 M⊙ because of the following reasons. Hereafter, we call these stars as the “28 M⊙ star”, “25 M⊙ star”, and “35 M⊙ star”, respectively.
(1) The evolution of the 28 M⊙ star is a typical case in which shows a large difference between 0 and .
(2) The evolution of the 25 M⊙ star shows a rather small difference between 0 and , but there appears an important difference near the final stages of evolution. A significant difference occurs at earlier stages for .
(3) The evolution of the 35 M⊙ star is a typical case where a significant difference appears for 1.
We discuss the 28 M⊙ models in detail, and the 25 M⊙ and 35 M⊙ models in short for comparisons.
M⊙
4.1 Chemical Evolution of M⊙ Star
After He exhaustion, the star evolves through the gravitational contraction of the core and nuclear burning at the center and outer shells until the formation of the Fe core, as shown in Figure 2.
M⊙
M⊙
M⊙
M⊙
M⊙
These evolutionary stages are summarized in Table 4 for the 28 M⊙ star, where CB, SB, and EX denote central burning, shell burning, and exhaustion stages, respectively. Here the time
| (17) |
is measured from the final stage at where the central density reaches log (K) = 10.0. The evolutionary behavior and the time depend on the 12CO rate as seen from the comparison between 0 and 1 in Table 4.
The following figures show the evolutionary changes in various stellar quantities in the 28 M⊙ star from He burning to the beginning of Fe core-collapse. The dependence on the 12CO rate is seen from the comparison between 0 and 1 in these figures.
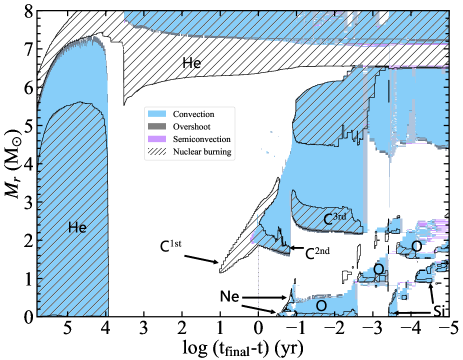
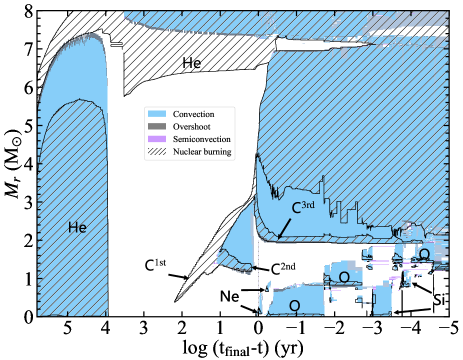
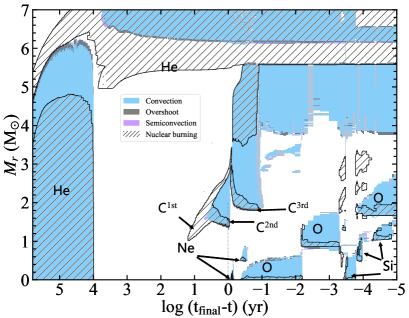
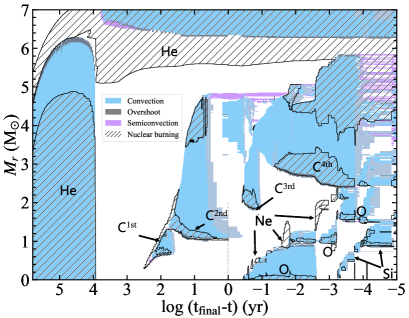
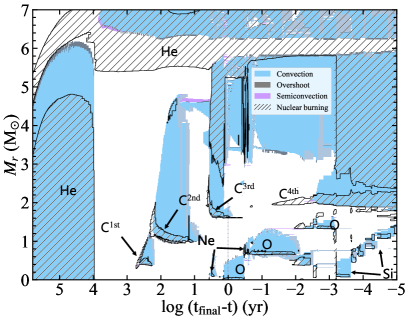
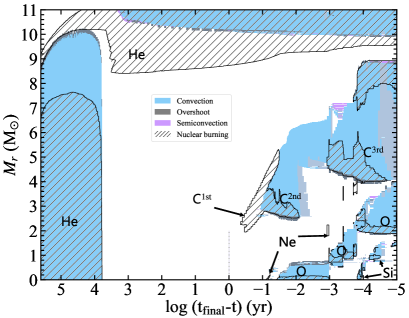
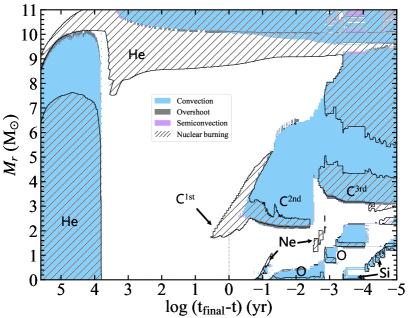
Figures 7 show Kippenhahn Diagrams. The inner part of M⊙ is shown. Nuclear burning (at the center and outer shells) produces a convective region as indicated by the blue region. The hatched region shows where the energy generation rate of nuclear reactions are larger than the neutrino loss rate. We should see that several convective shells are formed, which largely affect the stellar structure and evolution, as will be discussed in later sections.
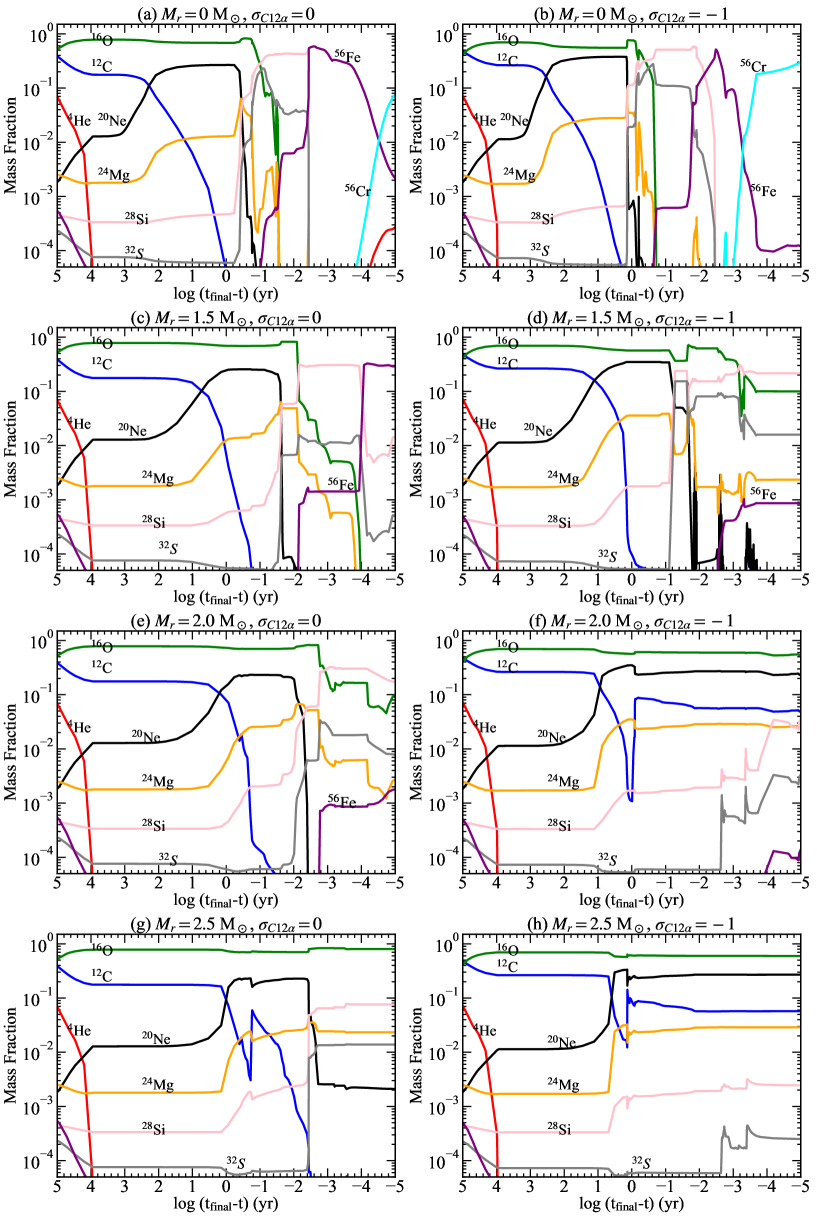
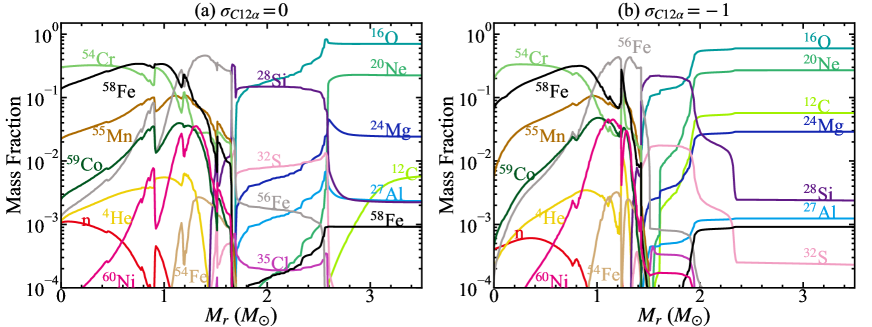
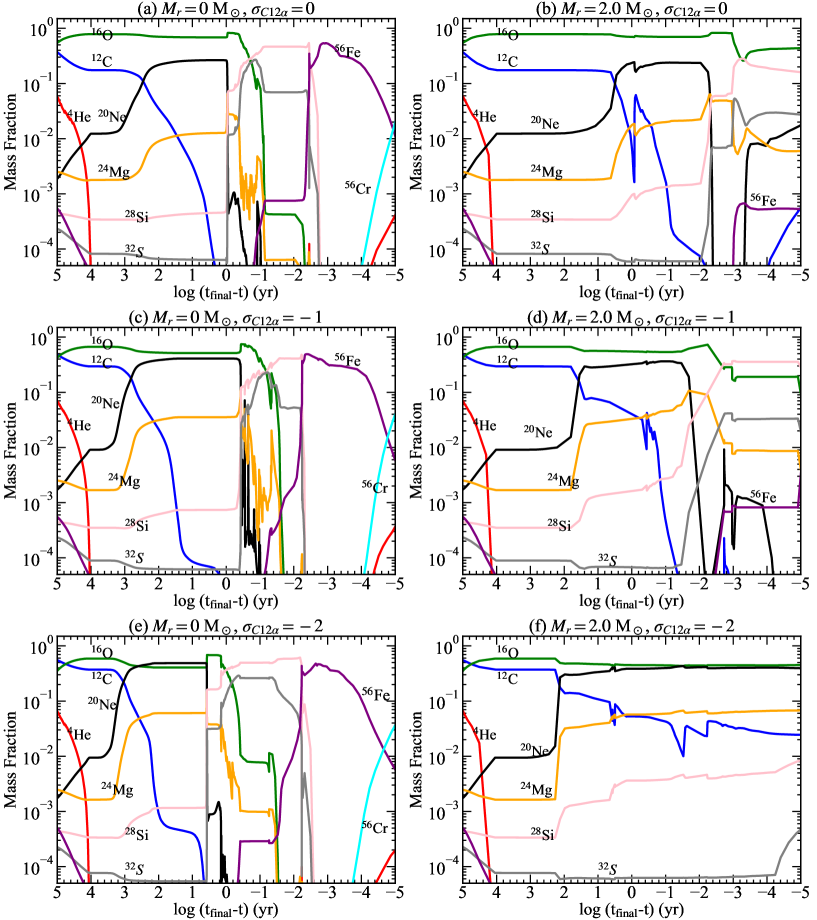
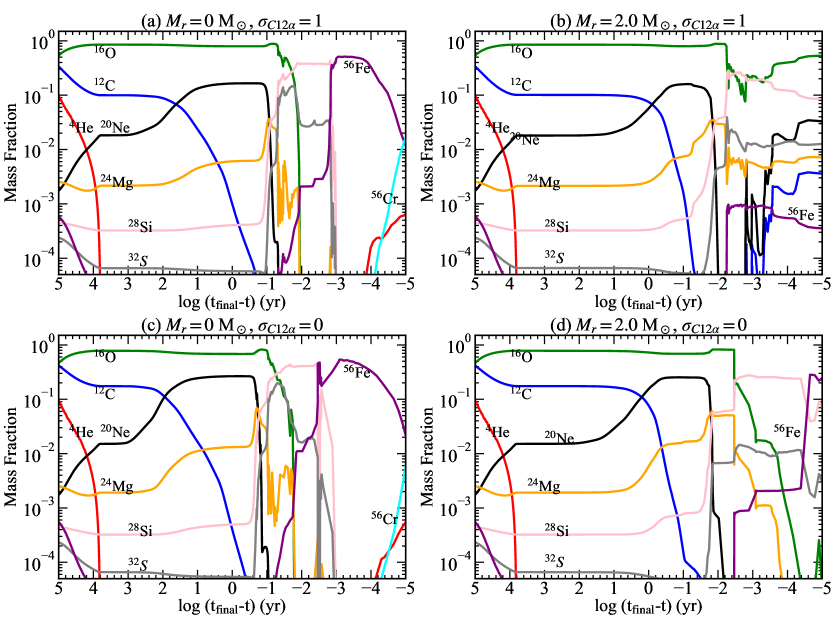
Figure 8 shows the time evolution of the mass fractions of some isotopes at the center (Figure 8 (a, b)), M⊙ (Figure 8 (c, d)), M⊙ (Figure 8 (e, f)), and M⊙ (Figure 8 (g, h)) for the 28 M⊙ star from He burning through Fe core-collapse for 0 (Figure 8 (a, c, e, g)), and (Figure 8 (b, d, f, h)). In the following subsections, the chemical evolution of the central core is described as shown in the abundance evolution at the center (Figure 8 (a, b)). Then, the evolution of the outer layers and the burning of carbon and oxygen shells will be discussed.
4.1.1 Central Carbon Burning
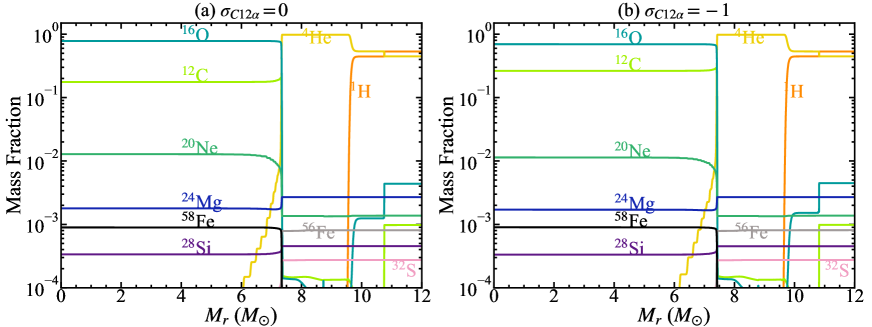
The abundance distributions before C burning are shown in Figure 9. Note (12C) in the CO core is smaller for (left) than that for (right).
As shown by decreasing (12C) at the center in Figure 8, significant C burning takes place at yr. As seen from Kippenhahan diagrams (Figs. 7), no convective core appears, i.e., C burns radiatively because the neutrino energy loss rate exceeds the energy generation rate for 20 M⊙ (see Table 5 and subsection 3.3). As a result, the CO core continues to contract as seen in the smooth increase in and in Figure 2. There is no large difference in the central evolution between 0 and during central C burning.
4.1.2 ONeMg Core Contraction and Neon Burning
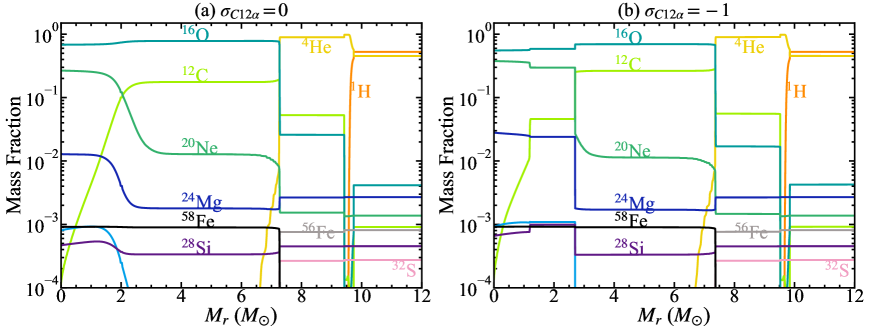
After C-exhaustion in the central region, an ONeMg core composed of O, Ne, Mg, and Na are formed. The abundance distributions in the central ONeMg core around yr are shown in Figures 10.
4.1.3 Oxygen Burning
After Ne exhaustion, an OSi core composed of O, Mg, Si, and S is formed. O burning takes place around yr (Figs. 8(a, b)), forming a convective core for both and .
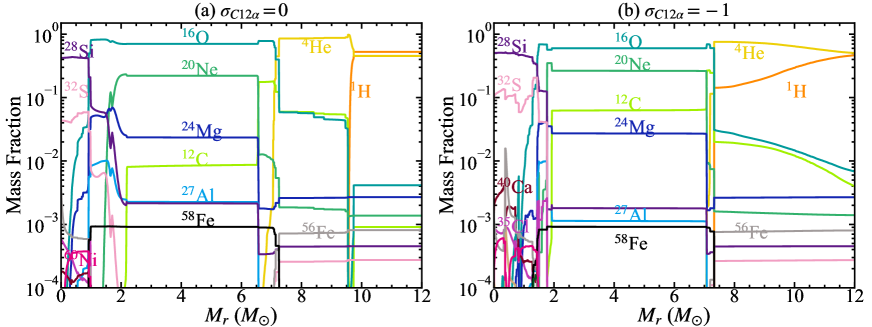
Then, a Si-rich core composed of Si, S, Ar, and Ca is formed. Abundance distributions with the Si-rich core are shown in Figure 11 at yr for (left) and yr for (right).
4.1.4 Silicon Burning and Fe Core Contraction
Si burning takes place convectively for both (Figure 8(a, c)) and (Figure 8(b)), and a Fe core is formed. The Fe core contraction is accelerated by photo-disintegration of Fe-peak species and becomes dynamically unstable. We stop our calculations at log (K) = 10.0 () because the reaction rates provided by the database (REACLIB) of MESA reach only log (K) = 10.0.
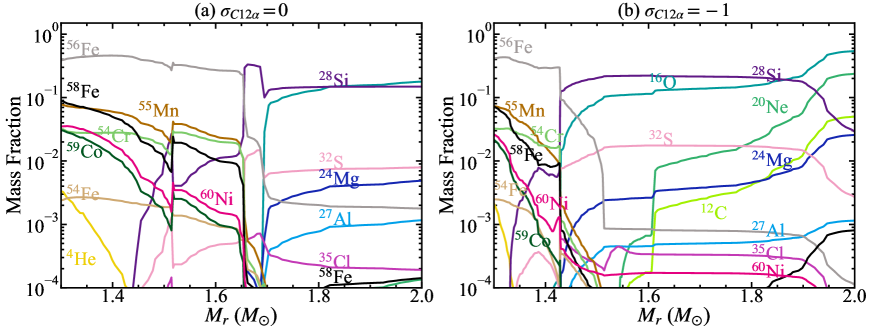
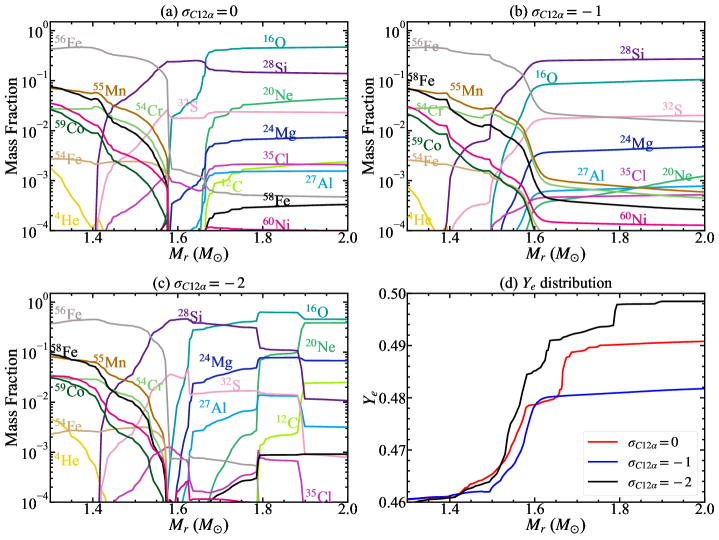
The abundance distributions at the final stage of are shown in Figure 12, and the detailed distributions in the Fe core are shown in Figure 13 for both . (The distribution will be shown later in Figure 22.)
The Fe core masses (Fe) at the boundary with (Si) are 1.51 M⊙ and 1.36 M⊙ for and , respectively.
M⊙
M⊙
4.1.5 Carbon Shell Burning
The difference in the evolution between and more clearly appears in C shell burning (C SB in Table 4) compared with central core burning, as seen in Kippenhahan diagrams (Figs. 7) and summarized in Table 4. In this subsection, we describe the differences which can be seen mostly in the abundance patterns in Figures 8. Differences in physical quantities will be described in the next subsection.
(1) First C Shell Burning (1st C SB) in the CO Core: As discussed in the earlier subsection, the CO core contracts even during central C burning. As a result of the temperature increase in the outer shell, the energy generation rate of C burning exceeds the neutrino loss rate ( 0) around yr and yr for and 0, respectively (Table 4); Figure 7). The first C shell burning takes place radiatively.
(2) Second C Shell Burning (2nd C SB) in the ONeMg Core: As the ONeMg core contracts around yr, the second C shell burning is ignited and produces a convective shell for both . This is seen from the decrease in (12C) at 1.5 and 2.0 M⊙ in Figures 8(c)-(f).
(3) The third C Shell Burning (3rd C SB): The 3rd C shell burning behavior depends clearly on .
(3-1) For , C shell-burning forms a convective shell at yr. It extends from M⊙ to 6.9 M⊙ and mixes some C from the outer layer into the convective shell as seen from the increase in (12C) at M⊙ and 2.5 M⊙ in Figure 8(f) and (h), respectively. Owing to this enhancement of (12C), C shell burning is reactivated and continues to be active through collapse with the convective shell extended from 2.0 M⊙ (Figure 7).
(3-2) For , on the other hand, such convective mixing does not occur at yr because of smaller (12C) during earlier C shell burning, Thus no increase in (12C) is seen at M⊙ in Figure 8(e). Then C is exhausted at yr.
Such a difference in the convective C shell between and stems from the difference in the C/O ratio after the He burning, and leads to an important difference in the later evolution.
As will be discussed in subsection 4.2.4 on curves, the existence of active C-shell burning at M⊙ makes (Equation 7) smaller for than 0. This makes the mass of the heavier element core larger for than as will be shown in § 4.2.4.
In fact, for , the layer around 2.0 M⊙ becomes a part of the Si-rich core after yr (Figure 8(e)). For , on the other hand, those layers are still O-rich with some C (Figure 8(f)).
Similar differences are seen around 1.5 M⊙. For , O burns out after yr and the layer becomes part of a Fe core after yr (Figure 8(c)). For , on the other hand, O shell burning maintains its activity until the collapse and the layer is OSi-rich (Figure 8(d)). This makes the Fe core mass for (1.51 M⊙) larger than for (1.36 M⊙) as seen in Figure 13.
4.2 Thermal and Dynamical Evolution of M⊙ Star
In association with the chemical evolution of the M⊙ star as described in the earlier subsection, the thermal and dynamical structures of the star evolve as follows with the significant dependence on .
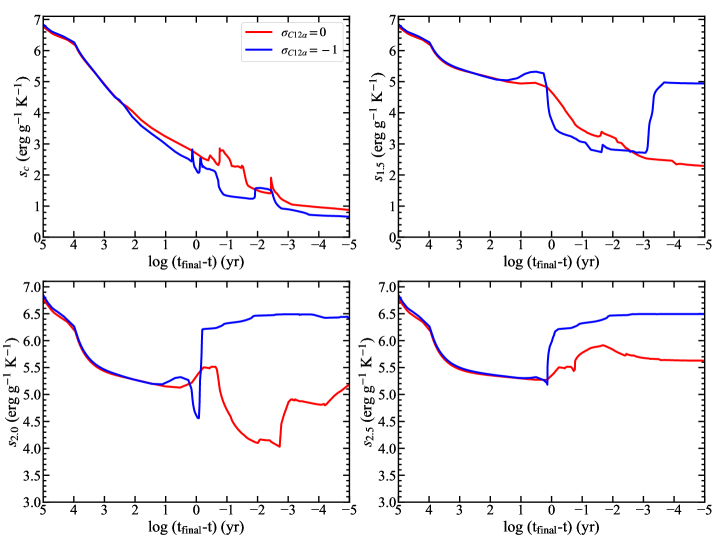
4.2.1 Evolution of Entropy and Temperature
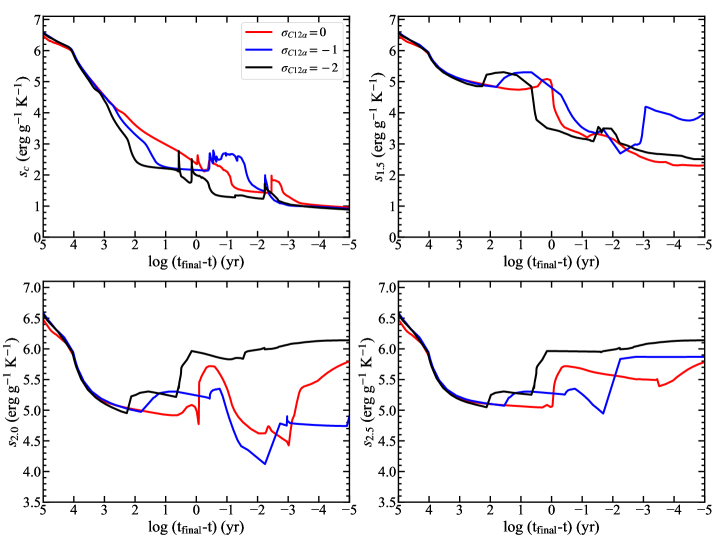
Figure 14 shows the evolution of specific entropy at the center (), 1.5 M⊙ (), 2.0 M⊙ (), and 2.5 M⊙ () for 0 and 1.
M⊙

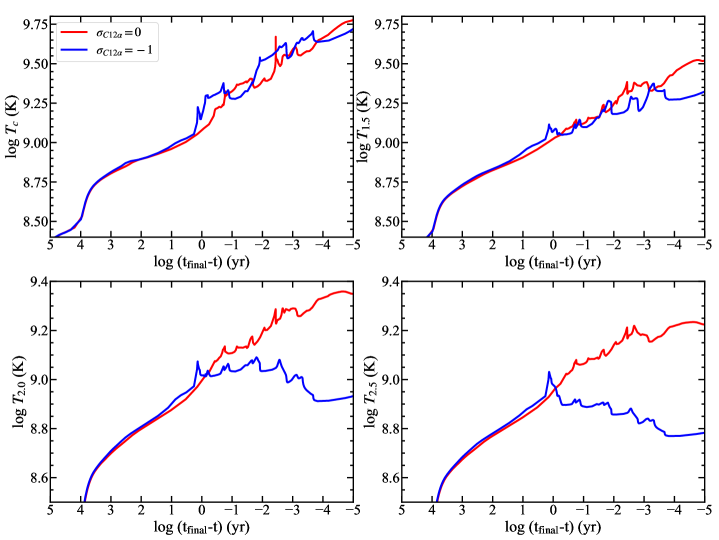
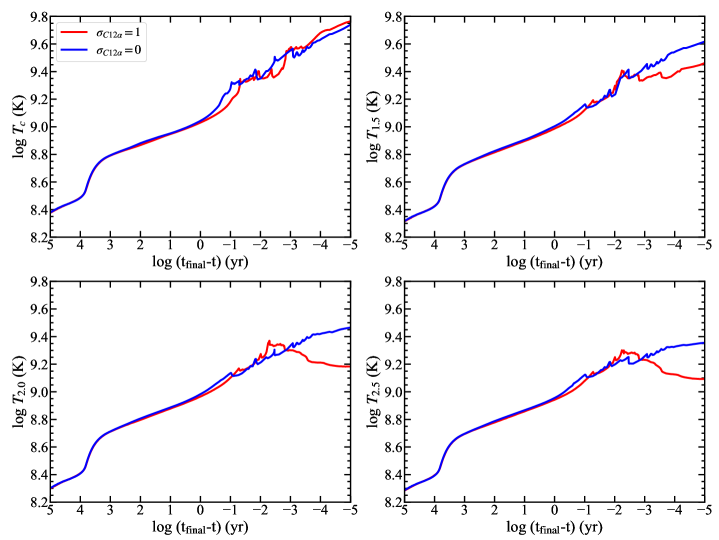
Figure 15 shows the evolution of temperatures at the center (), 1.5 M⊙ (), 2.0 M⊙ () and 2.5 M⊙ () for both cases of .
Even during central C-burning ( yr), decreases because the neutrino energy loss rate exceeds the nuclear energy generation rate. Then the CO core contracts to increase because of the gravothermal effect (Equation 11 - 12).
M⊙
M⊙
Around yr, carbon in the central region is almost exhausted (Figure 8). Subsequent contraction of the ONeMg core leads to the increase in the core temperatures (, , , and ) (Figure 15). Then, the first C-shell burning is ignited radiatively for both cases of (Figure 7).
The second C-shell burning forms a convective shell for both cases (Table4). The resulting heating is higher for than 0 as seen in the slightly higher and around yr. This is because of larger (12C) in although the difference is not so large.
A large difference between the two cases of appears around yr near the end of central C-burning (Figure 8(a)).
For (the blue lines), C-shell burning keeps a large convection zone above 2.0 M⊙ as seen from the increase in and (the blue lines) near yr. Such enhancement of occurs because (12C) is enhanced by mixing of outer C into the convective shell around yr (Figure 8(f)). This convective C-shell burning continues to exist through Fe core-collapse. Because of this heating, the increase in is slow and is almost constant, in contrast to the increase in and due to core contraction through Fe core-collapse.
For (the red lines), on the other hand, (12C) at 2.0 M⊙ is not enhanced (Figure 8(e)), so that the increase in is small from to yr. It even decreases after yr due to the neutrino energy loss. Then and continue to increase as in and .
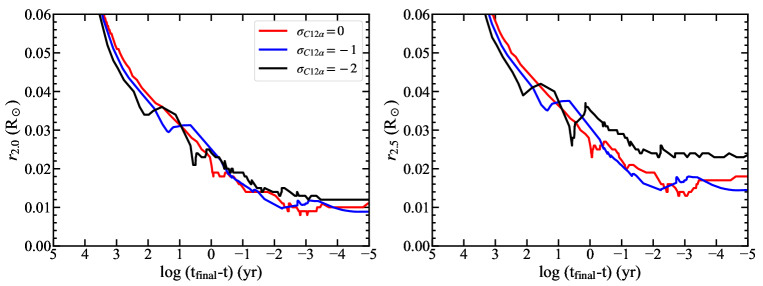
4.2.2 Evolution of Radius and Density
The difference in the heating effect of C-shell burning appears in the difference in the evolution of core structure between the two cases.
Figure 16 shows the evolution of radius at 2.0 M⊙ () and 2.5 M⊙ () for 0 (the red line) and (the blue lines).
The obvious differences appear at yr, where stays almost constant for (blue), while decreases along (red). This is due to the heating effect of C-shell burning above 2.0 M⊙.
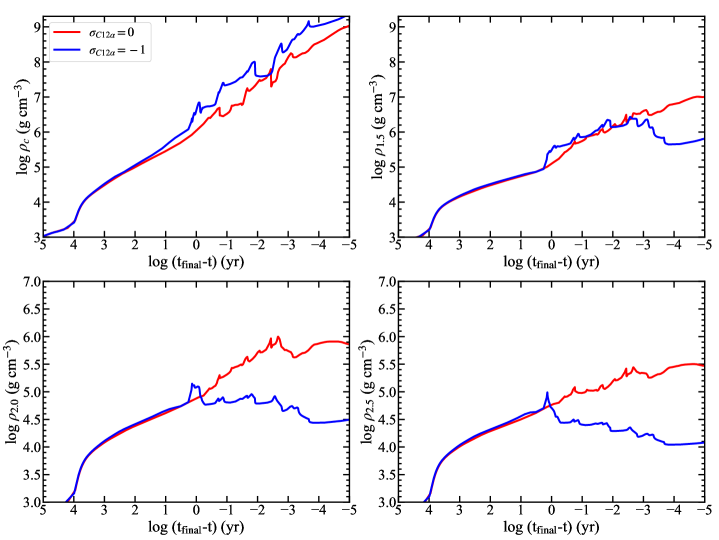
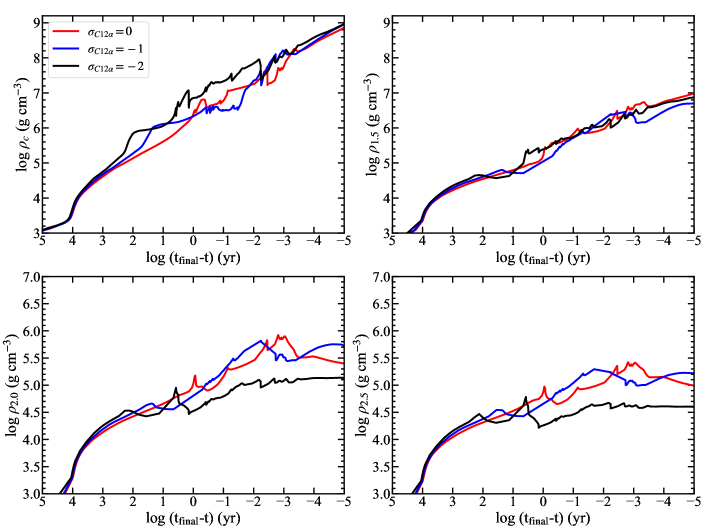
Figures 17 show the evolution of the density at the center (), 1.5 M⊙ (), 2.0 M⊙ () and 2.5 M⊙ ().
For both cases of , and continue to increase. For (red), and continue to increase through the collapse. For (blue), on the other hand, keeps almost constant and even decreases.
These evolutions result in a rather large difference in the Fe core structure as will be discussed in subsection 4.2.5. We emphasize that enhancement of (12C) in the C shell burning causes such large differences in the thermal and dynamic structure of the presupernova core.
M⊙
M⊙
M⊙
4.2.3 Effects of Oxygen Shell Burning
In the earlier sections, we have discussed the effect of O-shell burning on the core structure in detail. In Figure 14, 15 and 17 show a obvious increase in and decrease in and after log -3.8 yr. These changes show that the expansion of the shell near 1.5 M⊙ originate from the earlier mixes of O in 1.5 M⊙, which has been mentioned in section 4.1.4.
M⊙
M⊙
M⊙
4.2.4 U-V Curves
Nuclear Shell Burning and U-V Curves:
Nuclear shell burning has an important effect on the structure and evolution of stars because shell burning forms a sharp increase (almost a jump) in entropy and a convective shell. This is seen in the enhancement of and (Figure 14) due to C burning (log yr) and also due to O-burning (log ). Such an enhancement produces a sharp gradient of entropy as well as other physical quantities against and . This enhancement depends on .
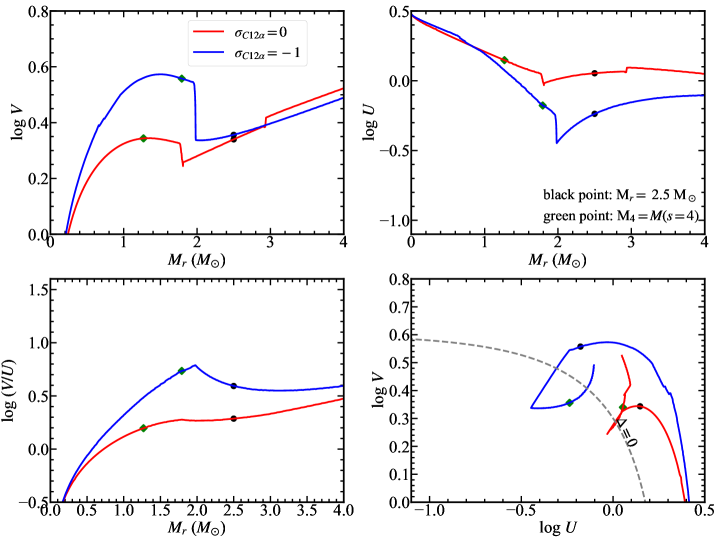
The strength of nuclear shell burning and the shell location can easily be seen in the curves: See Figures 1 and 20 for the curves of the whole star and that of the inner part ( 0 - 4 M⊙) at the collapse (), respectively. Hereafter, we discuss the curves of only the inner part ( 0 - 4 M⊙).
As seen from Equations 2, 3, and 4, the peaks of and indicate the locations of the steeper gradients of and against log compared with the surrounding regions, while the peaks of and indicate the location of the steeper gradients of and against log .
The loop of the log - log curve shows a relatively large jump across (Equation 6), where is minimum and thus, physical quantities have steep gradients concerning . This implies that the location of the above jump is the core edge in , which is the location of a nuclear burning shell.
The location of the bottom of the nuclear burning shell is indicated by the peaks of , because nuclear shell burning produces a large entropy jump, thus creating a larger gradient of physical quantities concerning . The effect of the larger entropy jump in (blue) than 0 (red) appears in the larger peak values of (i.e., more centrally condensed) and , the smaller minimum value of (i.e., more extended), and the larger loop of in the blue lines than in the red lines.
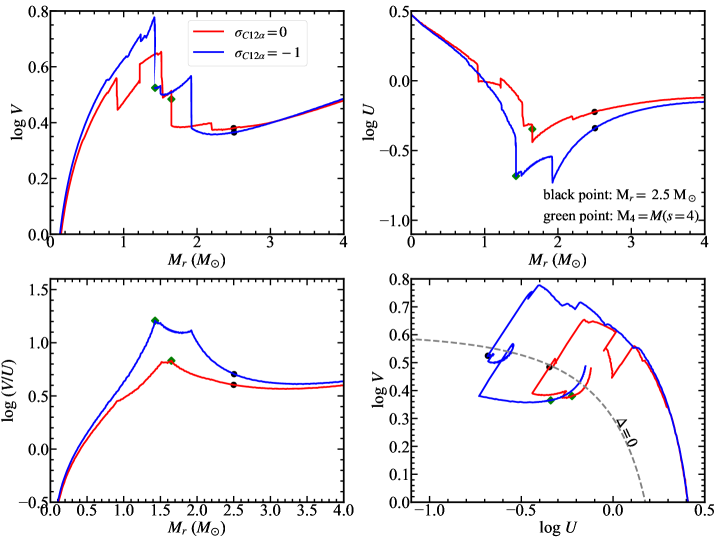
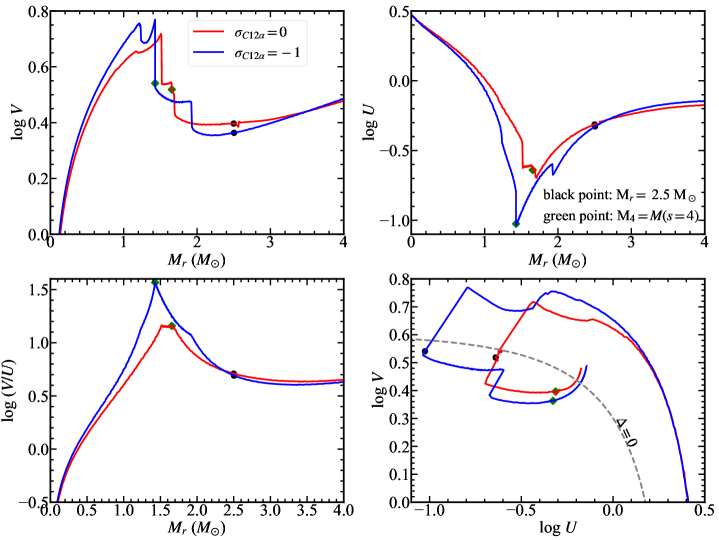
Figures 18, 19, and 20 show the time evolution of the curves around yr, yr, and , respectively. At yr, strongest nuclear shell burning appears at 2.0 M⊙ for , which is the bottom of convective C burning shell. At yr, the location of strongest nuclear burning shell moves to 1.5 M⊙, which is O shell burning.
We note that these figures show that the maximum values of , 1/ and are larger in than 0. This is mainly due to stronger C-shell burning with larger C).
, , Core Masses, and :
Among these many peaks in the curves, at the maximum () is the mass contained below the strongest burning shell. 222Hereafter, we denote the maximum , i.e., , as . Since appears at the most active nuclear burning shell, which forms the steepest pressure gradient, can be regarded as in Equation 7. Then is strongly related to the evolution of the core as described in Equation 7, thus being useful to discuss the explodability in the subsequent sections.
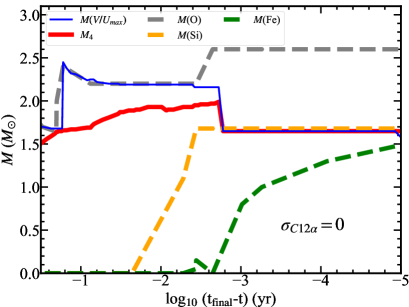
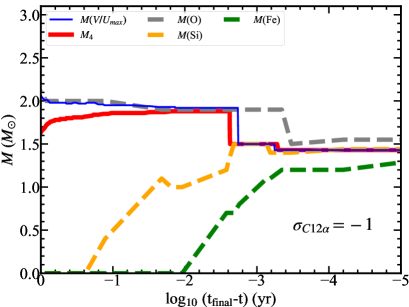
To see the dependence of on , Figure 21 shows the time evolution of core masses of Fe ((Fe)), Si ((Si)), and O ((O)), (), and for = 28 M⊙ with (left) and (right). It is seen that is smaller for than 0, mainly because of strong C-shell burning at 2 M⊙. This smaller produces the smaller core masses of O, Si, and Fe. We also note that (Si) (i.e., at the O-burning shell) and are almost identical to near the final stage so that these masses are smaller for than 0.
The effect of smaller (and thus ) for than 0 can be seen in the evolution of log - log (Figure 2). Here is smaller (and thus is higher for the same ) for than 0 according to Equations 11 and 9. Such evolutions of smaller and higher (at the same ) are seen in Figures 14 and 17, respectively.
Regarding the explodability, the maximum values of log are 1.6 and 1.1 for and 0, respectively, which show the difference in the steepness of log with respect to as seen in Figure 22 below. This indicates that the star with is easier to explode, as will be discussed later.
Thus, the curves are handy diagrams to indicate the location of the critical points, such as the strongest nuclear shell burning and by showing “quantitatively” the gradients of quantities with respect to and .
4.2.5 Presupernova Structure and Compactness
M⊙
M⊙
M⊙
M⊙,
M⊙,
M⊙,
M⊙
M⊙
M⊙
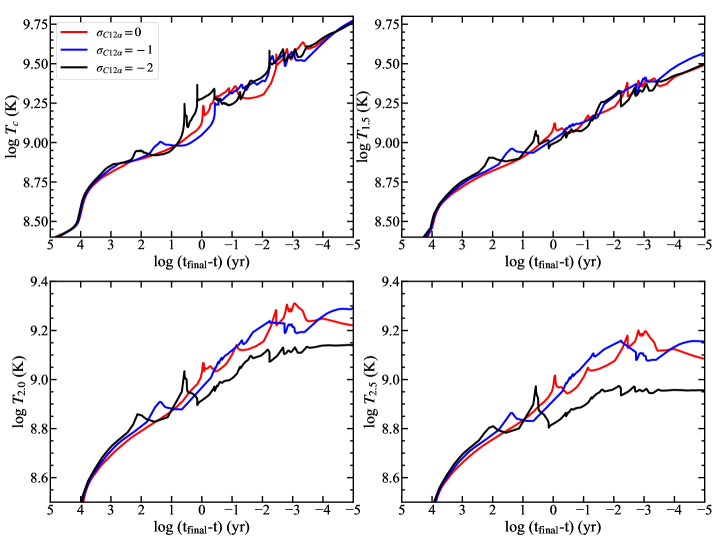
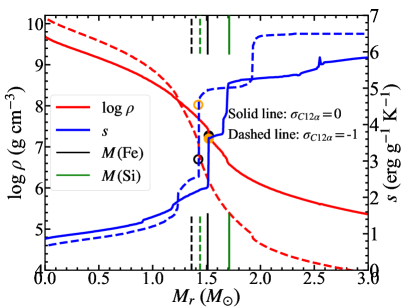
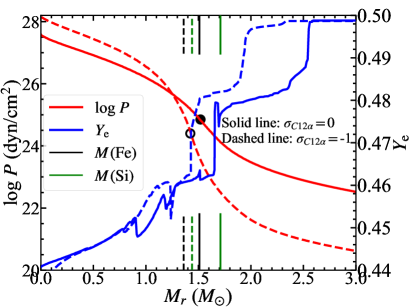
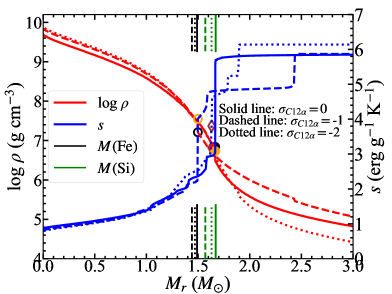
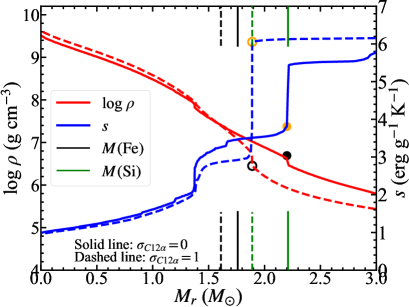
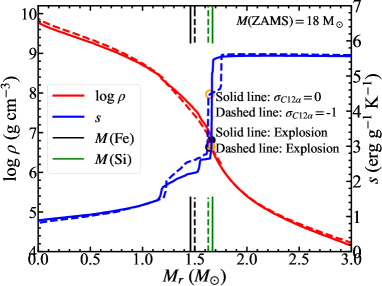
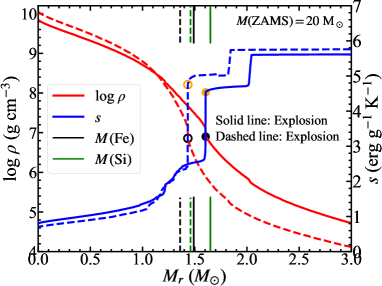
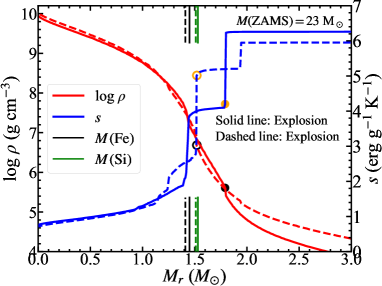
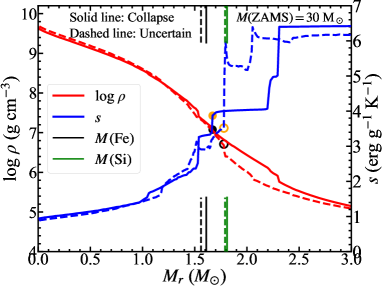
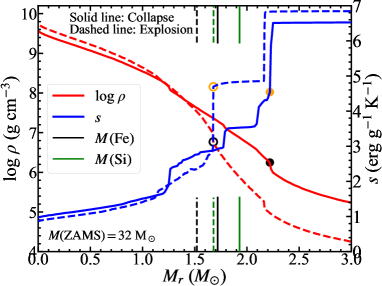
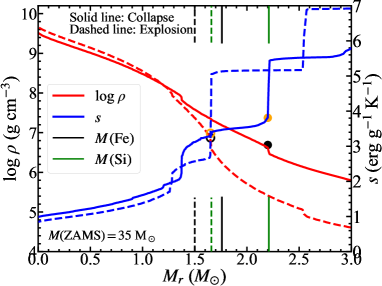
Figure 22 (left) shows distributions of the log and at the beginning of the collapse ( yr: ), i.e., at log (K) = 10.0, where the dashed lines and solid lines represent and , respectively. The green lines and black lines show the outer edges of the Si core and Fe core, respectively, which are defined as the locations where the energy generation rates of shell O burning and shell Si burning is the highest. Similar distributions of log and are shown in Figure 22 (right).
It is seen that the gradients of log and log with respect to are much steeper for than . Also, log is higher and is lower for than 0 because of smaller (i.e., smaller ) for as discussed in the subsection 4.2.4 on the curves based on Equations 11 and 9.
The steepest gradient of log with respect to corresponds to the maximum log () (Figure 20) and is marked by cyan () and black () filled circles. The corresponding steepest points in log (filled circles) and (open circles) are also indicated. We note that at is close to 4 but not exactly 4 (see also Figure 40 in the later section). However, is almost identical to because of the extremely sharp gradient of due to entropy production by O-shell burning.
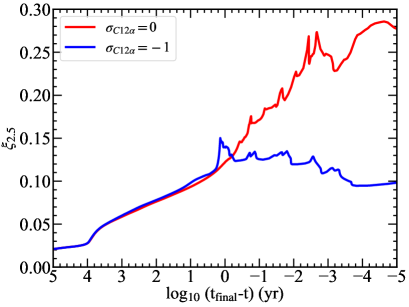
The difference in the core structure also appears in the evolution of the compactness parameter after yr (Figure 23). For (red), continues to increase to reach 0.28 at yr. For (blue), on the other hand, decreases from 0.15 to 0.10 at yr. It is obvious that the core with (red) is much more compact with larger than (blue). The difference in stems exactly from the difference in the evolution of radius, where stays almost constant as shown in Figure 16.
Such a difference in the density and pressure distributions and the compactness parameter would lead to significant differences in the core-collapse hydrodynamics and the explodability, as well as associated explosive nucleosynthesis.
4.3 Evolutions of 25 and 35 M⊙ Stars
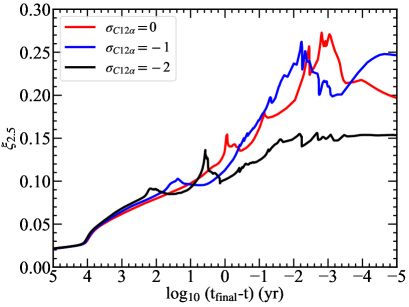
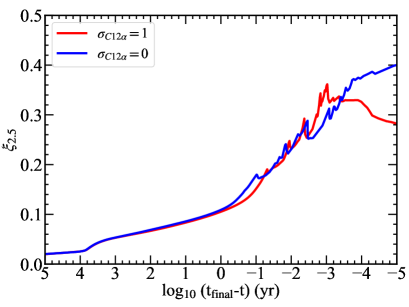
For the 28 M⊙ star, we have shown how the evolution of is affected by . We also have investigated how the effect of depends on . In Figure 24, we show that the evolution of in the 25 M⊙ stars for three cases of 0, 1 and . We also show in Figure 25 the evolution of in the 35 M⊙ stars for the cases of 0 and 1. This figure shows the effect of the case of a very low C/O ratio originating from a large and a large 12CO rate. In the following sections, we will discuss the evolutions of the 25 and 35 M⊙ stars to clarify how these differences in appear.
4.3.1 Chemical Evolution of M⊙ Star
The following figures show the chemical evolution of the 25 M⊙ stars for 0, 1 and 2. Figure 26 shows Kippenhahn diagrams. The time
is measured from the final stage of (denoted as in the axes of Figures) where the central temperature reaches log (K) 10.0 as in the 28 M⊙ star.
Reaction rate dependence:
Figure 27 shows the evolution of the mass fractions of several isotopes at the center (left) and 2.0 M⊙ (right) from He burning through Fe core-collapse. It is seen that the chemical evolution at the center (a, c, e) does not much depend on , while the evolution at 2.0 M⊙ (b, d, f) is affected by owing to the strength of C shell burning ( 100.6 - 10-0.5 yr). and O shell burning ( 10-2 - 10-3 yr).
When He is exhausted in the core ( 104.5), (12C) at 2.0 M⊙ is larger for smaller . For , (12C) is large enough for the C burning convective shell to reach the overlying C-rich layer. Resulting convective mixing enhances (12C) and make C-shell burning active. For and , such C-mixing does not occur and 12C is exhausted at 2.0 M⊙. Then, C-shell burning becomes inactive. Such inactivity of C-shell burning for in the 25 M⊙ star is different from the 28 M⊙ star in which C-shell burning is active until core-collapse for .
The main difference in C-shell burning with from and 0 is that, because of larger (12C) after He exhaustion in , C shell burning at 2.0 M⊙ is active and convective during the evolution from central O burning to Fe core-collapse (Figure 26). Resultant heating of shell burning causes the expansion of the outer layer as seen from and (Figure 30) and and (Figure 31).
Figures 23 and 24 show the mass-dependence of for = 25 and 28 M⊙, respectively. There appears to be a difference at 10-3.5 yr for .
M⊙
This difference stems from O-shell burning. For the 25 M⊙ star, convective mixing of fresh O from the outer layer occurs at the shell near = 2.0 M⊙ as seen from the almost constant (O) in Figure 27(b). Then O-shell burning continues to be active. This is different from the 28 M⊙ star with where O shell burning is weak because (O) 0.1 at 2.0 M⊙ around yr (Figure 8(e)). Such a difference in O-shell burning leads to the difference in between the 25 and 28 M⊙ stars even for the same .
M⊙
M⊙
M⊙
M⊙
4.3.2 Thermal and Dynamical Evolution of 25 M⊙ Star
Entropy:
Figure 28 shows the evolution of specific entropy at the center (), 1.5 M⊙ (), 2.0 M⊙ (), and 2.5 M⊙ ().
We should note that is enhanced around yr for (black) owing to the mixing of C. This is similar to the increase in in the 28 M⊙ star with .
Note also that the decrease in during - yr for (blue) and after for (red) are originated from the increase in owing to O-mixing (see Figure 27 (b) and (d)). Such an increase is also seen in the 28 M⊙ star in after with and after with .
Temperature:
Figure 29 shows the evolution of temperature at the center (), 1.5 M⊙ (), 2.0 M⊙ () and 2.5 M⊙ ().
Note that reaches the O-burning temperature for (red) and (blue). For , and increase slowly staying at the C-burning temperature.
Radius:
Figure 30 shows the evolution of radius at 2.0 M⊙ () and 2.5 M⊙ (). These radii generally decrease during the core contraction. However, increases for at yr because of the heating effect of C shell burning. This is the reason that the compactness parameter of decreases during that period (Figure 23 (right)).
Density:
Figure 31 shows the evolution of densities at the center (), 1.5 M⊙ (), 2.0 M⊙ (), and 2.5 M⊙ (). These figures show that the evolution of the density at each layer of the 25 M⊙ stars is not so different between 0 and 1, in contrast to the large difference for the 28 M⊙ star. As a result, the density and entropy distributions at are not so different between and (Figure 32).
For , on the other hand, the density evolution and the final distributions of the density and entropy are different, being similar to the 28 M⊙ stars with as seen in Figures 32.
4.3.3 Presupernova Structure and U-V Curves of 25 M⊙ Stars
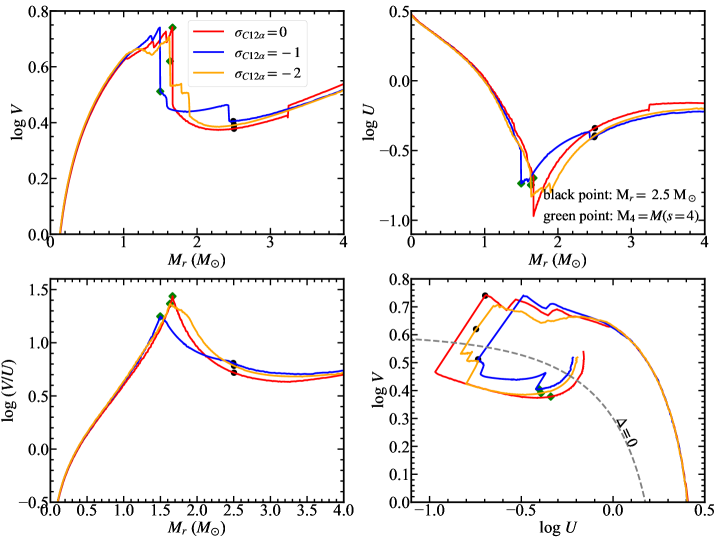
Behaviors of shell burning at are shown in the curves in Figure 33. For and -2, maximum of -curves appears near = 1.7 M⊙, which is the bottom of the O burning shell. On the other hand, maximum for appears between the O-burning shell and the Si-burning shell ( = 1.5 M⊙). Similar to the 28 M⊙ models, these peaks in -curves are located at and correspond to the steepest gradient of log with respect to (see Fig 32). The maximum values of log in 25 M⊙ models are 1.44, 1.25, and 1.37 for 0, , and , respectively. As will be discussed later, these values of the steepness are marginal for the criterion of the explosion vs. collapse.
M⊙
4.3.4 Evolution of 35 M⊙ Stars
M⊙,
M⊙,
M⊙
M⊙
M⊙
For 35 M⊙ stars, we investigate the case of , i.e., the effect of the low C/O ratio. Figure 25 shows that increases up to 0.4 for but decreases down to 0.28 for from to 10-5 yr.
As shown in Figure 36 of Kippenhahn diagrams, the behavior of C shell burning is similar between these cases. Both models ignite C shell burning at 2 M⊙ and the convection extends to 6.5 M⊙. After yr, the C burning shell moves to 4.7 M⊙ (4.0 M⊙) and forms an oxygen core of (O) = 4.0 M⊙ (3.2 M⊙) for ().
Owing to the low (12C) in both models, the heating effect of C shell burning is weak. In Figure 25, evolutions of do not show a large difference between the two models up to yr.
However, decrease after yr for . This is due to the heating effect of O shell burning, which extends from = 2.0 to 4.0 M⊙. Figure 37 (b) shows that (16O) at 2 M⊙ decreases from yr to yr due to O shell burning and increases after yr due to mixing of oxygen from outer layers. After O shell burning is ignited, the layers above 2.0 M⊙ begin to expand as seen from the time evolution of log at 2.0 M⊙ and 2.5 M⊙ in Figure 38.
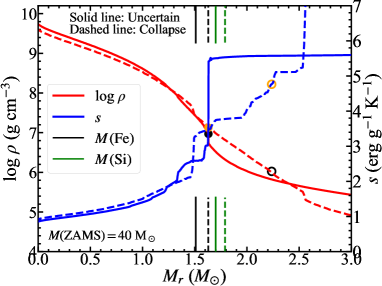
The core structure (log and ) at the final stage for these two models are compared in Figure 35. The steepest gradient of density and specific entropy occurs around 3-4 erg g-1 K-1 just below the O burning shell. We conclude that the heating effect of O shell burning is important when and where (12C) is low enough.
5 Dependence of Explodability on and 12CO Rate
We calculate the evolution of massive stars for various combinations of and and obtain the compactness parameter (Equation 13) at the final stage of evolution () when log (K) = 10.0 (see Tables A). has been suggested to be useful to evaluate the explodability of massive stars (Ugliano et al., 2012; Sukhbold & Woosley, 2014; Müller et al., 2016; Ertl et al., 2016; Sukhbold et al., 2018; Ertl et al., 2020).
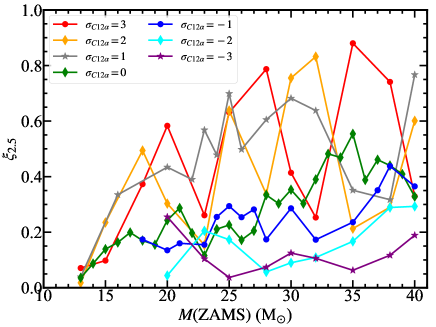
Figure 40 shows how depends on from -3 to +3 and for 13 - 40 M⊙. The dependence on the 12CO rate has also been studied by Sukhbold & Woosley (2014). Our results cover a wider range of the reaction rate, i.e., to . Figure 40 shows complicated dependences of on and , but the details of the dependencies are shown in the following figures with discussion.
5.1 Compactness Parameter and Shell Burning
As a source of such complicated dependences, the effect of C shell burning on is important (Chieffi & Limongi, 2020). We have investigated in sections 4.1.5 and 4.2.2 how the mixing of C and resultant C shell burning cause the difference in between = 0 and as summarized below.
The evolution of for = -1 and 0 (Figure 23) is simply the evolution of 1/ as shown in Figure 16. During the evolution until yr, the shell at 2.5 M⊙ simply contracts, i.e., decreases, so that increases for both .
Around yr, the contraction of the shell stops for because (C) at 2.0 M⊙ is enhanced (Figure 8 (f)) by convective mixing and C shell burning heats up to cause slight expansion of the overlying layers (see Figure 14 for enhancement of and ). Thus 1/ and slightly decrease.
For , such enhancement of (C) and does not occur and C is depleted in the convective shell (Figure 8 (e)) to cease C shell burning. Thus 1/ and continue to increase (Figs. 16 and 23). The temporal decreases in 1/ and around yr are caused by the activation of O shell burning.
Such a difference in the evolution of and (C) are also found for 25 M⊙ and to 0 as seen in Figure 24.
5.2 Compactness Parameter and
The effect of C shell burning on appears not only in the dependence as described in subsection 5.1 above, but also on the dependence. As seen in Figure 40, changes non-monotonically with the as has been investigated in several works (e.g., Sukhbold & Woosley, 2014; Sukhbold et al., 2018; Chieffi & Limongi, 2020).
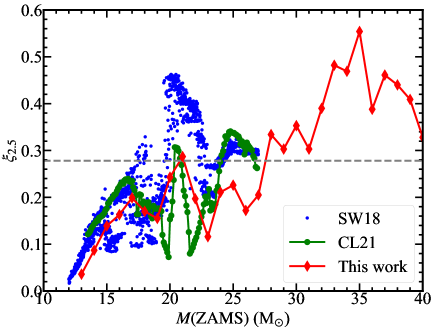
Figure 41 compares our as a function of for = 0 (red) with those from Sukhbold et al. (2018) (blue) and Chieffi et al. (2021) (green). Dependencies on are basically similar.
generally increases with as seen in Figure 41. For larger , the mass fraction of the shell of is smaller. For nearly homologous models, the density structure as a function of is similar at the same stage. The shell of smaller is deeper and is smaller. Thus tends to be larger for larger .
However, the dependence of on is not monotonic. For example, the green (Chieffi et al., 2021) points in Figure 41 show the decrease of with for several mass ranges. Chieffi et al. (2021) discussed such a change as follows. At the mass ranges of 17.4 - 19.4 and 20.3 - 21 , the heating effect of convective C shell burning is strong enough to decrease . Thus, the three peaks are formed at 19.4, 21.0, and 25 . Our results shown by the red-line in Figure 41 are basically similar, although the peak value of around 25 is smaller.
For the peak of around 21 in Figure 41, Chieffi & Limongi (2020) discussed the relation with the critical mass . As mentioned in § 3.3, for stars with increasing , core C burning changes from convective to radiative around because of the decreasing C/O ratio. This transition may cause a sharp change in with as discussed by Chieffi & Limongi (2020) for (Figure 41).
The critical mass is larger for smaller (Table 5), so that the peak of appears at larger as compared in Figure 42.
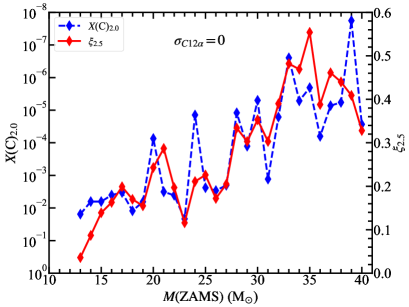
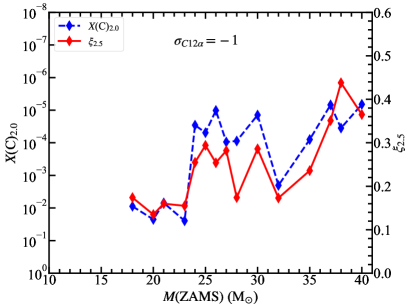
To examine whether such C mixing affects the compactness parameter for other stars, we compare (C)2.0 and as a function of in Figure 42 for and . Here (C)2.0 denotes (12C) at 2.0 M⊙. (Note, in the vertical axis of Figure 42, (C)2.0 decreases upward, while increases upward.)
We find a good correlation between and (C)2.0, thus concluding that the non-monotonicity of is mainly determined by the behavior of the C burning shell, which is related to (12C) near the bottom of the C burning shell (around 2.0 M⊙). For higher , the effect of O shell burning is significant.
5.3 Explodability
5.3.1 Criteria for Explodability
The compactness parameter has been suggested to be a criterion of the explodability of presupernova models (Ugliano et al., 2012; Müller et al., 2016). Based on the 1D hydrodynamical simulations of neutrino-driven supernova models, a two-parameter criterion in the - plane for the explodability has been proposed by Ertl et al. (2016) and Ertl et al. (2020). Here is defined in Equation 14.
We plot all of our 99 models with the combination of and in the - plane of Figure 43, where and are given in Table LABEL:tab:structure. We adopt the line of 333We do not use the separation line of proposed by Müller et al. (2016), because among our 99 models there is only one “collapse” model, which seems too small. from Ertl et al. (2016) and draw in this plane. According to the hydrodynamical simulations by Ertl et al. (2016), models above this line are likely to form BHs without much mass ejection and models below this line are likely to explode to form NSs.
Note the presupernova models adopted by Ertl et al. (2016) are different from ours and we need hydrodynamical simulations of core-collapse for our own models. Nevertheless, we assume that the line of divides the BH formation and the NS formation for our presupernova models with different . For simplicity in the present paper, we call the models above this line “collapse” models and indicate them with black markers. We call the models below this line as “explosion” models and indicate them with color markers. Different shapes and colors are used for different s.
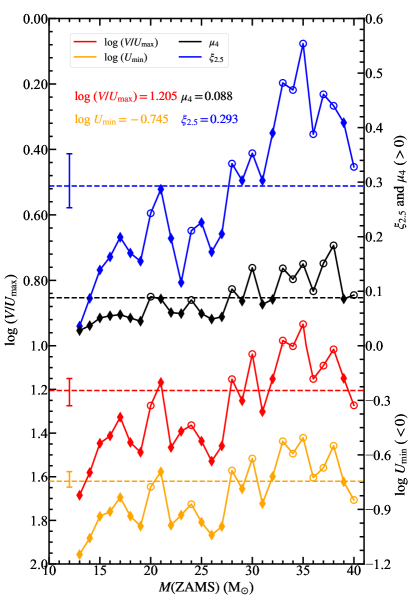
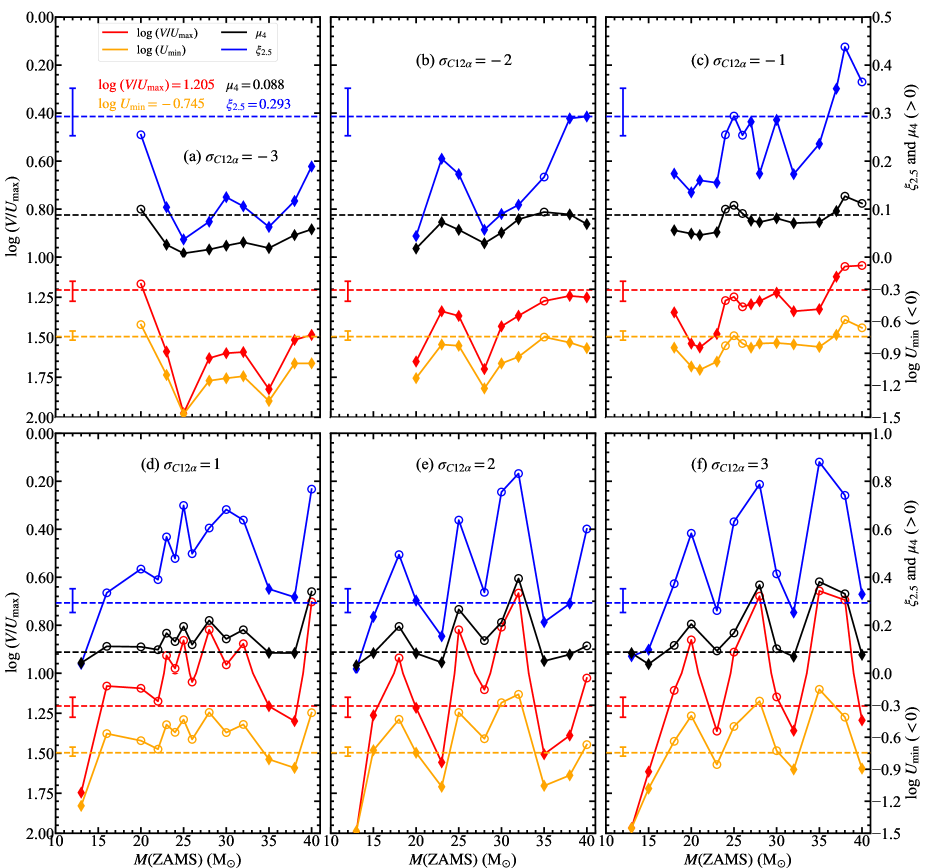
In Tables LABEL:tab:structure and LABEL:tab:core_mass, we indicate “explosion” or “collapse” for each model. To show clearly how the separation between “explosion” or “collapse” depend on model parameters ( and ) and model properties (, , 444 denotes ., and ), we plot in Figures 44 and 45 these model properties as a function of for to +3.
In these figures, of the left Y-axis decreases upward. On the right Y-axis, the scale of the positive value part for and is different from the negative value part for log . The filled diamonds indicate “explosion” models, while open circles indicate “collapse” models. These explosion and collapse models are predicted by the results of Figure 43.
We find that “explosion” and “collapse” can be separated by the critical values of 0.088 , , log , and log . In Figures 44 and 45, these critical values are shown by the dashed lines with the uncertainty bars.
For models outside the uncertainty bars, the numbers of correct predictions of “explosion” and “collapse”, and false predictions (“false”) for , , , and are given in Table 6 for from -3 to +3. The uncertainty bars are chosen to make the fraction of “false” prediction less than 5 %. (Remember that the total number of models is 99). Inside the uncertainty bars, the final fate of the model is regarded as “uncertain”, where the numbers of correct and false predictions are also given in Table 6. These uncertainties may be related to the uncertainties of presupernova models and hydrodynamical simulations. To make the uncertainties smaller, we need core-collapse calculations using our own presupernova models calculated in this paper, which will be done in the forthcoming study.
| prediction | “explosion” | “collapse” | “false” | “uncertain” | |
| correct | false | ||||
| 54 | 42 | 3 | 0 | 0 | |
| 41 | 31 | 5 | 11 | 11 | |
| 45 | 31 | 5 | 11 | 7 | |
| 50 | 32 | 5 | 7 | 5 | |
, , , and show similar dependencies on (ZAMS). As discussed in Section 4.2.4, and are the steepest gradients of log and log with respect to in the CO core. is also the average gradient. Thus, the compactness parameter is closely related to the gradients of pressure and density in the presupernova core. This is the reason why larger and , smaller and tend to collapse. As shown in Figure 22, the core-collapse models would more easily explode with the steeper gradients of pressure and density.
During the core-collapse and bounce, the mass accretion onto the collapse object produces lamb pressure against the bouncing shock and the accretion rate would be lower if the density structure is steeper. This would make the explosion easier to occur. Also, the shock wave generated at the bounce and propagates outward would be more strengthened at the steeper gradient, which would also make the explosion easier.
Although would be a good measure of “collapse” vs. “explosion”, we propose that and are physically reasonable measures of the explodability.
5.3.2 Explodability and 12CO Rate
Figures 44 and 45 and Table 6 show the dependence of the explodability on . For smaller , generally, and tend to be larger, while and tend to smaller. Thus, a larger number of models tend to undergo explosions for smaller ,
The dependence of “collapse vs. explosion” on also depends on as seen in these figures. For , e.g., the dependence is different because the effect of O shell burning is dominant over C shell burning. How affects the presupernova structures and will be shown for in the next section.

5.4 Presupernova Structure and 12CO Rate
5.4.1 Oxygen Shell Burning, , and
Figures 46 show how affects the presupernova structures of the density and entropy and the locations of for = 18 - 40 M⊙ with (solid lines) and (dashed lines). It is indicated whether these models are “collapse” or “explosion” (or “uncertain”). The lines and marks are the same as used in Figure 22 for = 28 M⊙.
These figures show that is located in most cases at the sharp increase in , which is produced by O shell burning (i.e., at the outer edge of the Si core (Si)). When shell burning is active, the released heat prevents the contraction of the outer layers and the density there remains almost constant and even decreases as seen in Figure 17. On the other hand, the inner core continues to increase the density of the inner core. This creates a very steep density gradient, almost a density jump, and a decrease in , which is the ratio between and the mean density of the inner core.
For example, two density jumps are produced by C shell burning and O shell burning at 1.95 M⊙ and 1.44 M⊙, respectively, in the 28 M⊙ star for (Figure 22). These two density jumps correspond to the sharp jumps of , two valley points of , and the highest peak and knee points of in Figure 20.
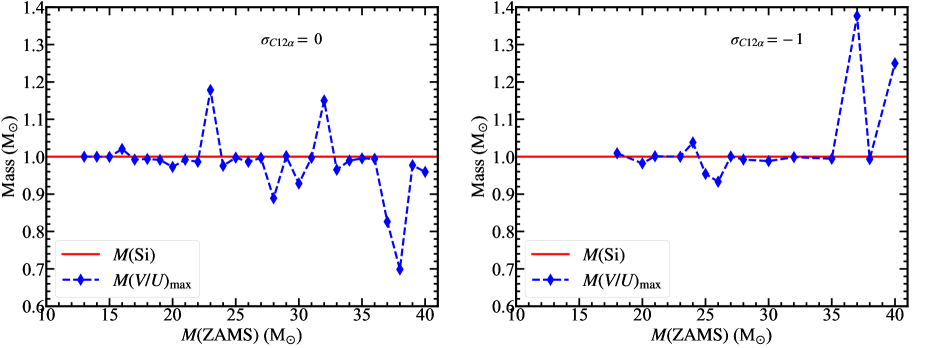
Thus, the steepest gradient of density is created by the most active shell burning, mostly oxygen burning. This implies (Si). For , (Si) tends to be smaller than those for , which would affect the explodability as has been discussed for = 28 M⊙.
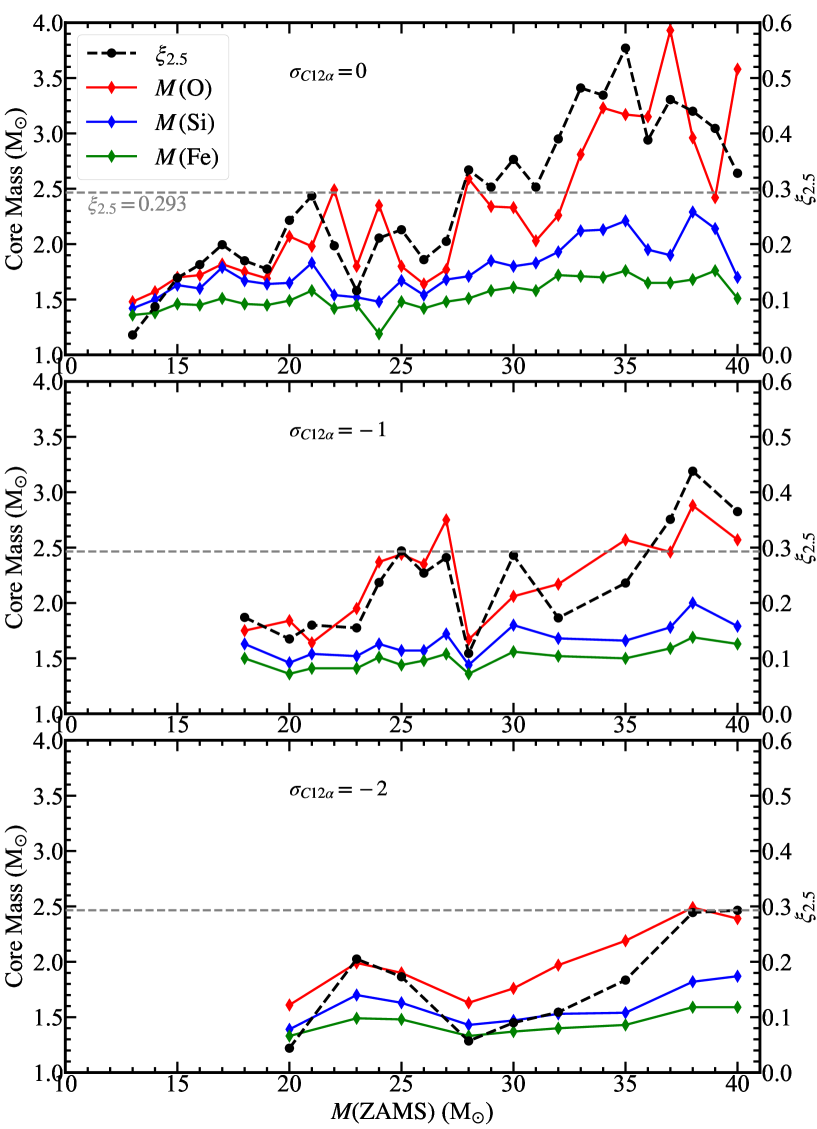
5.4.2 Core Masses and
Given the importance of these core masses for the explodability, Figure 47 shows the masses of Fe core , Si core , and O core , as well as as a function of at the final stages () for 0, 1 and . The data for all models are also listed in Table LABEL:tab:structure and LABEL:tab:core_mass. As mentioned earlier, the boundaries of , , and are defined at the location where the energy generation rates of the Si-burning shell, O-burning shell, and C-burning shell are the highest.
In these figures, and change with non-monotonously. Their changes are similar, which implies that is mainly affected by C shell burning, as discussed earlier. For smaller , tends to be smaller because is larger in the deeper region, as has been shown in Figure 42 for 28 M⊙. Then the smaller leads to the formation of smaller and .
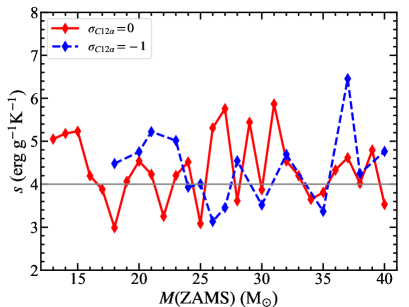
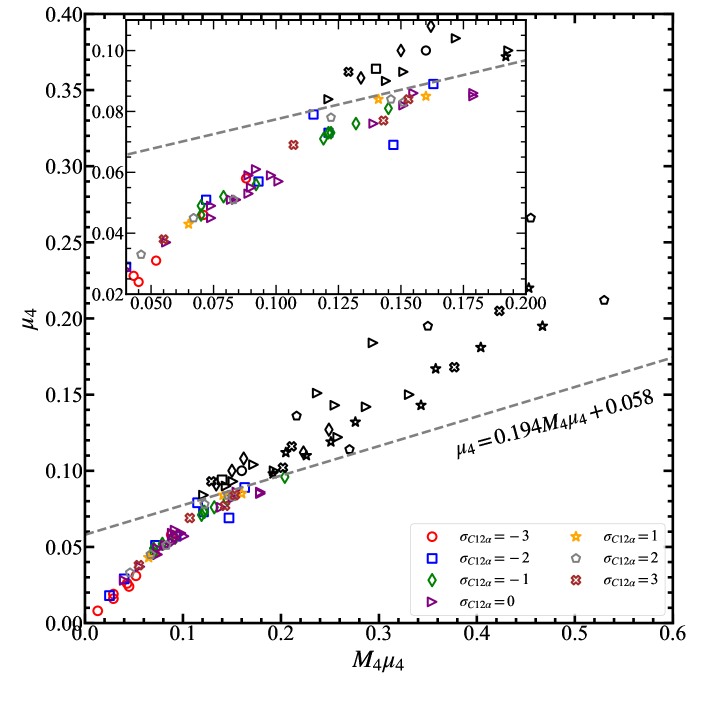
Figure 48 shows normalized by , which shows that is almost identical to except for a few . This is because O-shell burning is the strongest shell burning at the onset of collapse and forms a very steep increase in entropy (Figure 22) and thus the steepest gradients of pressure and density as discussed above for Figure 46.
Figure 49 shows the entropy at , which ranges from (erg g-1 K-1) 3 to 6 including 4. Thus except for a few (see Table LABEL:tab:structure). This is also due to the entropy jump at the O burning shell.
As discussed in Section 4.2.4, . Therefore, smaller for smaller leads to smaller and thus higher for the same (Equation 9 and 11).

5.4.3 Density Profiles and
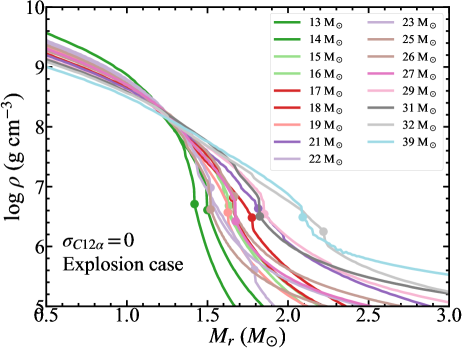
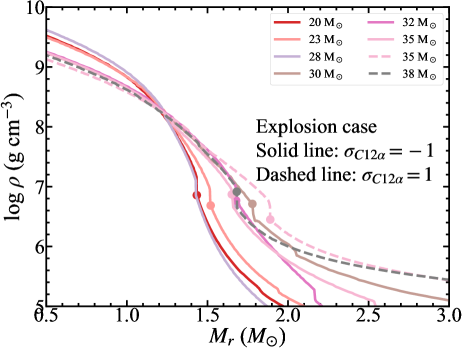
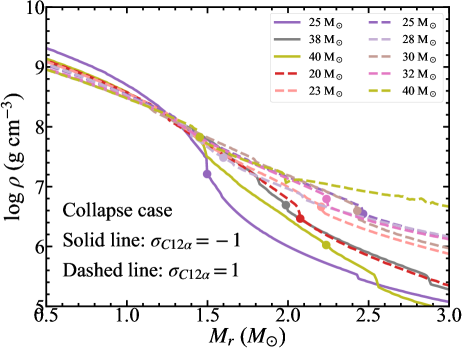
Figures 50 show the density profiles at the final pre-collapse models (i.e., at log (K) 10.0) for 0, -1 and 1, On top figures, models for “explosion” (left) and “collapse” (right) are shown for . At the bottom, models for “explosion” (left) and “collapse” (right) are shown for -1 (solid lines) and 1 (dashed lines). The points on the lines show the location of .
By comparing the models with the same , () is smaller and thus is lower for smaller . This means that the density distribution concerning tends to be steeper for smaller . Also, the “explosion” models (left) tend to have a steeper density structure than the “collapse” models (right). This suggests that models with smaller explode more easily, although the exact explodability depends on the behavior of C shell burning.
To judge whether the modes are “explosion” or “collapse”, Burrows & Vartanyan (2021), Wang et al. (2022), Boccioli et al. (2023) and Boccioli et al. (2025) have suggested that the models with stronger density jumps at the Si/O interface are more likely to explode and the location of this density jump may be the initial boundary of the proto-NS based on their 2D and 3D simulations of the core collapse. This is consistent with our findings of the importance of , but our results can provide the quantitative criterion, i.e., the critical steepness of the density for the “explosion vs. collapse”.
6 Summary and Discussion
Among the uncertainties of stellar evolution theory, we investigate how the 12C()16O reaction rate affects the evolution of massive stars through the beginning of the Fe core collapse. We adopt stars with the initial masses of 13 - 40 M⊙ and the solar metallicity. For the reaction rate, we adopt , and 3, i.e., by a factor of 0.37, 0.52, 0.78, 1, 1.28, 1.93, and 2.69 of the standard rate.
Comparison between and 0 is made particularly in detail for the evolution of the 28 M⊙ stars. For 25 M⊙, models with , , and 0 are compared, and for the 35 M⊙ models, and are examined. For the explodability, models with the whole range of and are calculated.
We find the following differences:
(1) Smaller leads to the synthesis of a larger mass fraction of C, (C), which makes C shell burning stronger. Then, the convection zone extends to mix C from the overlying layer, further strengthening C shell burning. The extra heating by C shell burning tends to prevent the contraction of outer layers and decrease the compactness parameter at = 2.5 M⊙.
(2) This effect leads to the formation of smaller mass cores of Si and Fe and the steeper density and pressure gradients at the O burning shell in the presupernova models.
(3) This difference affects the explodability of the models, i.e., whether a NS or a BH is formed, The steeper pressure gradient results in more likely the explosion forming a NS rather than a BH.
(4) We describe the pressure gradient against with and the density drop with , where and are non-dimensional variables to describe the stellar structure (Equation. 2 and 3).
(5) By applying the Ertl-criterion for explodability, we estimate the critical values of and at the O-burning shell above which the model is more likely to explode.
(6) We conclude that the smaller 12C()16O reaction rate makes the mass range of that forms a NS larger.
(7) The dependencies of the compactness parameter on and the reaction rate is consistent with the earlier results by Sukhbold & Woosley (2014) and Chieffi & Limongi (2020) but our study covers a much wider range of input parameters.
(8) In view of the importance of the overshooting of C shell burning to enhance (C) by mixing fresh C, multi-D simulations of convective overshooting (Cristini et al., 2019; Rizzuti et al., 2022) are critically important.
In the forthcoming papers, we will present the explodability by hydrodynamical calculations of collapse for our progenitor models with different rather than using the Ertl-criterion. We will also present how the detailed nucleosynthesis yields depend on .
7 Acknowledgements
This work was supported by the National Natural Science Foundation of China under Grant Nos. 11988101 and the National Key R&D Program of China No. 2024YFA1611900. W. Y. X. is supported by the Cultivation Project for LAMOST Scientific Payoff and Research Achievement. W. Y. X. thanks Xianfei Zhang and Shaolan Bi for their financial support (the grants 12073006, 12090040 and 12090042 from the National Natural Science Foundation of China) and also their help in using MESA. K. N. is supported by the World Premier International Research Center Initiative (WPI), MEXT, Japan, and the Japan Society for the Promotion of Science JSPS KAKENHI Grant Numbers JP20K04024, JP21H044pp, and JP23K03452. We would like to thank Marco Limongi and Raphael Hirschi for useful discussion.
Appendix A Property of Explosion
| log | log | log | fate | |||||||
|---|---|---|---|---|---|---|---|---|---|---|
| (M⊙) | (M⊙) | (M⊙) | ||||||||
| -3 | 20 | 1.167 | 0.696 | -0.632 | 1.531 | 1.597 | 0.100 | 0.160 | 0.255 | uncertain |
| 23 | 1.590 | 0.723 | -1.104 | 1.680 | 1.677 | 0.026 | 0.043 | 0.104 | explosion | |
| 25 | 1.975 | 0.803 | -1.471 | 1.545 | 1.544 | 0.008 | 0.013 | 0.037 | explosion | |
| 28 | 1.631 | 0.779 | -1.158 | 1.793 | 1.762 | 0.016 | 0.029 | 0.074 | explosion | |
| 30 | 1.600 | 0.745 | -1.135 | 1.877 | 1.868 | 0.024 | 0.045 | 0.125 | explosion | |
| 32 | 1.593 | 0.764 | -1.116 | 1.863 | 1.687 | 0.031 | 0.052 | 0.106 | explosion | |
| 35 | 1.825 | 0.809 | -1.348 | 1.654 | 1.504 | 0.019 | 0.029 | 0.063 | explosion | |
| 38 | 1.517 | 0.795 | -0.996 | 1.523 | 1.529 | 0.046 | 0.071 | 0.117 | explosion | |
| 40 | 1.486 | 0.799 | -0.995 | 1.512 | 1.511 | 0.058 | 0.088 | 0.189 | explosion | |
| -2 | 20 | 1.652 | 0.756 | -1.134 | 1.395 | 1.394 | 0.018 | 0.025 | 0.044 | explosion |
| 23 | 1.338 | 0.754 | -0.819 | 1.667 | 1.662 | 0.073 | 0.121 | 0.205 | explosion | |
| 25 | 1.367 | 0.707 | -0.830 | 1.631 | 1.631 | 0.057 | 0.093 | 0.173 | explosion | |
| 28 | 1.699 | 0.821 | -1.230 | 1.633 | 1.386 | 0.029 | 0.040 | 0.057 | explosion | |
| -2 | 30 | 1.432 | 0.763 | -0.996 | 1.429 | 1.429 | 0.051 | 0.072 | 0.090 | explosion |
| 32 | 1.366 | 0.749 | -0.934 | 1.956 | 1.463 | 0.079 | 0.115 | 0.109 | explosion | |
| 35 | 1.274 | 0.754 | -0.749 | 1.354 | 1.489 | 0.094 | 0.140 | 0.167 | explosion | |
| 38 | 1.242 | 0.705 | -0.800 | 1.830 | 1.826 | 0.089 | 0.163 | 0.289 | uncertain | |
| 40 | 1.251 | 0.683 | -0.852 | 2.377 | 2.112 | 0.069 | 0.147 | 0.293 | uncertain | |
| -1 | 18 | 1.345 | 0.715 | -0.848 | 1.645 | 1.631 | 0.056 | 0.092 | 0.174 | explosion |
| 20 | 1.540 | 0.795 | -1.025 | 1.434 | 1.434 | 0.049 | 0.070 | 0.135 | explosion | |
| 21 | 1.564 | 0.807 | -1.056 | 1.542 | 1.541 | 0.046 | 0.070 | 0.160 | explosion | |
| 23 | 1.480 | 0.735 | -0.979 | 1.520 | 1.515 | 0.052 | 0.079 | 0.155 | explosion | |
| 24 | 1.244 | 0.713 | -0.770 | 1.692 | 1.692 | 0.073 | 0.124 | 0.237 | uncertain | |
| 25 | 1.248 | 0.741 | -0.736 | 1.498 | 1.498 | 0.108 | 0.162 | 0.294 | uncertain | |
| 26 | 1.310 | 0.740 | -0.809 | 1.465 | 1.471 | 0.091 | 0.134 | 0.254 | uncertain | |
| 27 | 1.294 | 0.693 | -0.848 | 1.721 | 1.721 | 0.076 | 0.132 | 0.282 | uncertain | |
| 28 | 1.566 | 0.769 | -1.035 | 1.429 | 1.428 | 0.044 | 0.063 | 0.109 | explosion | |
| 30 | 1.222 | 0.657 | -0.804 | 1.779 | 1.779 | 0.081 | 0.145 | 0.286 | uncertain | |
| 32 | 1.338 | 0.724 | -0.817 | 1.678 | 1.678 | 0.071 | 0.119 | 0.173 | explosion | |
| 35 | 1.325 | 0.729 | -0.841 | 1.651 | 1.657 | 0.073 | 0.121 | 0.236 | explosion | |
| 37 | 1.122 | 0.688 | -0.728 | 2.450 | 2.119 | 0.096 | 0.204 | 0.351 | uncertain | |
| 38 | 1.058 | 0.634 | -0.586 | 1.987 | 1.958 | 0.127 | 0.249 | 0.438 | collapse | |
| 40 | 1.052 | 0.684 | -0.662 | 2.237 | 1.988 | 0.112 | 0.223 | 0.365 | collapse | |
| 0 | 13 | 1.685 | 0.814 | -1.148 | 1.420 | 1.417 | 0.028 | 0.040 | 0.036 | explosion |
| 14 | 1.581 | 0.820 | -1.058 | 1.500 | 1.497 | 0.037 | 0.056 | 0.087 | explosion | |
| 15 | 1.447 | 0.751 | -0.938 | 1.629 | 1.625 | 0.051 | 0.082 | 0.139 | explosion | |
| 16 | 1.413 | 0.748 | -0.912 | 1.633 | 1.627 | 0.055 | 0.090 | 0.163 | explosion | |
| 17 | 1.327 | 0.672 | -0.834 | 1.776 | 1.776 | 0.057 | 0.101 | 0.199 | explosion | |
| 18 | 1.443 | 0.779 | -0.937 | 1.660 | 1.660 | 0.051 | 0.084 | 0.170 | explosion | |
| 19 | 1.488 | 0.749 | -0.992 | 1.626 | 1.626 | 0.045 | 0.074 | 0.155 | explosion | |
| 20 | 1.274 | 0.708 | -0.776 | 1.605 | 1.605 | 0.090 | 0.144 | 0.243 | explosion | |
| 21 | 1.168 | 0.644 | -0.693 | 1.815 | 1.802 | 0.086 | 0.155 | 0.287 | uncertain | |
| 22 | 1.466 | 0.773 | -0.987 | 1.519 | 1.519 | 0.061 | 0.092 | 0.197 | explosion | |
| 23 | 1.392 | 0.777 | -0.931 | 1.791 | 1.514 | 0.059 | 0.089 | 0.116 | explosion | |
| 24 | 1.364 | 0.722 | -0.871 | 1.444 | 1.444 | 0.084 | 0.121 | 0.211 | explosion | |
| 25 | 1.437 | 0.742 | -0.970 | 1.666 | 1.666 | 0.059 | 0.098 | 0.226 | explosion | |
| 26 | 1.529 | 0.798 | -1.041 | 1.519 | 1.519 | 0.049 | 0.074 | 0.172 | explosion | |
| 27 | 1.459 | 0.755 | -0.994 | 1.675 | 1.673 | 0.053 | 0.089 | 0.205 | explosion | |
| 28 | 1.153 | 0.715 | -0.686 | 1.520 | 1.656 | 0.104 | 0.172 | 0.334 | uncertain | |
| 29 | 1.252 | 0.711 | -0.787 | 1.853 | 1.848 | 0.082 | 0.151 | 0.303 | uncertain | |
| 30 | 1.038 | 0.655 | -0.620 | 1.671 | 1.786 | 0.143 | 0.255 | 0.353 | collapse | |
| 31 | 1.302 | 0.717 | -0.868 | 1.825 | 1.819 | 0.076 | 0.139 | 0.303 | uncertain | |
| 32 | 1.152 | 0.637 | -0.719 | 2.220 | 2.114 | 0.085 | 0.179 | 0.390 | collapse | |
| 33 | 0.984 | 0.610 | -0.525 | 2.046 | 2.024 | 0.142 | 0.287 | 0.482 | collapse | |
| 34 | 1.002 | 0.618 | -0.593 | 2.108 | 2.108 | 0.122 | 0.258 | 0.469 | collapse | |
| 35 | 0.934 | 0.628 | -0.506 | 2.200 | 2.200 | 0.150 | 0.331 | 0.554 | collapse | |
| 36 | 1.152 | 0.686 | -0.725 | 1.939 | 1.936 | 0.100 | 0.193 | 0.388 | collapse | |
| 37 | 1.091 | 0.660 | -0.671 | 1.570 | 1.570 | 0.151 | 0.237 | 0.461 | collapse | |
| 38 | 1.016 | 0.664 | -0.550 | 1.600 | 1.600 | 0.184 | 0.294 | 0.440 | collapse | |
| 0 | 39 | 1.149 | 0.658 | -0.748 | 2.091 | 2.082 | 0.086 | 0.179 | 0.409 | collapse |
| 40 | 1.273 | 0.691 | -0.848 | 1.631 | 1.631 | 0.093 | 0.151 | 0.328 | uncertain | |
| +1 | 13 | 1.746 | 0.775 | -1.243 | 2.363 | 1.498 | 0.043 | 0.065 | 0.039 | explosion |
| 16 | 1.080 | 0.678 | -0.566 | 2.595 | 1.840 | 0.112 | 0.205 | 0.335 | uncertain | |
| 20 | 1.094 | 0.625 | -0.632 | 2.076 | 2.058 | 0.110 | 0.226 | 0.434 | collapse | |
| 22 | 1.175 | 0.694 | -0.712 | 1.947 | 1.947 | 0.098 | 0.192 | 0.390 | collapse | |
| 23 | 0.926 | 0.623 | -0.482 | 2.206 | 2.146 | 0.167 | 0.358 | 0.568 | collapse | |
| 24 | 0.980 | 0.636 | -0.554 | 2.075 | 2.093 | 0.132 | 0.276 | 0.478 | collapse | |
| 25 | 0.863 | 0.601 | -0.434 | 2.466 | 2.391 | 0.195 | 0.467 | 0.699 | collapse | |
| 26 | 1.055 | 0.614 | -0.620 | 2.109 | 2.109 | 0.119 | 0.251 | 0.498 | collapse | |
| 28 | 0.819 | 0.631 | -0.367 | 1.599 | 2.057 | 0.220 | 0.453 | 0.605 | collapse | |
| 30 | 0.965 | 0.614 | -0.556 | 2.430 | 2.397 | 0.143 | 0.343 | 0.682 | collapse | |
| 32 | 0.877 | 0.592 | -0.480 | 2.239 | 2.239 | 0.181 | 0.404 | 0.638 | collapse | |
| 35 | 1.206 | 0.678 | -0.807 | 1.890 | 1.888 | 0.085 | 0.160 | 0.351 | uncertain | |
| 38 | 1.299 | 0.719 | -0.887 | 1.682 | 1.682 | 0.084 | 0.141 | 0.317 | uncertain | |
| 40 | 0.703 | 0.596 | -0.370 | 1.452 | 1.885 | 0.340 | 0.642 | 0.767 | collapse | |
| +2 | 13 | 1.993 | 0.822 | -1.480 | 2.428 | 1.404 | 0.033 | 0.046 | 0.018 | explosion |
| 15 | 1.263 | 0.669 | -0.722 | 2.597 | 1.738 | 0.084 | 0.146 | 0.235 | explosion | |
| 18 | 0.936 | 0.674 | -0.432 | 1.405 | 1.796 | 0.195 | 0.350 | 0.494 | collapse | |
| 20 | 1.216 | 0.666 | -0.745 | 1.831 | 1.831 | 0.083 | 0.151 | 0.303 | uncertain | |
| 23 | 1.557 | 0.813 | -1.064 | 1.482 | 1.480 | 0.045 | 0.067 | 0.154 | explosion | |
| 25 | 0.819 | 0.629 | -0.368 | 1.384 | 1.714 | 0.266 | 0.455 | 0.638 | collapse | |
| 28 | 1.103 | 0.702 | -0.614 | 1.578 | 1.587 | 0.136 | 0.216 | 0.337 | uncertain | |
| 30 | 0.808 | 0.570 | -0.276 | 2.593 | 2.506 | 0.212 | 0.530 | 0.755 | collapse | |
| 32 | 0.666 | 0.501 | -0.198 | 2.603 | 2.172 | 0.395 | 0.859 | 0.832 | collapse | |
| 35 | 1.506 | 0.794 | -1.055 | 1.630 | 1.630 | 0.051 | 0.083 | 0.213 | explosion | |
| 38 | 1.389 | 0.759 | -0.957 | 1.567 | 1.570 | 0.078 | 0.122 | 0.290 | uncertain | |
| 40 | 1.030 | 0.645 | -0.669 | 2.358 | 2.358 | 0.114 | 0.270 | 0.601 | collapse | |
| +3 | 13 | 1.967 | 0.730 | -1.452 | 2.414 | 1.823 | 0.084 | 0.153 | 0.071 | explosion |
| 15 | 1.615 | 0.819 | -1.081 | 1.458 | 1.458 | 0.038 | 0.055 | 0.098 | explosion | |
| 18 | 1.107 | 0.646 | -0.638 | 1.810 | 1.810 | 0.116 | 0.211 | 0.373 | collapse | |
| 20 | 0.861 | 0.621 | -0.399 | 1.674 | 2.065 | 0.205 | 0.423 | 0.583 | collapse | |
| 23 | 1.362 | 0.765 | -0.856 | 1.386 | 1.385 | 0.093 | 0.129 | 0.261 | uncertain | |
| 25 | 0.912 | 0.583 | -0.499 | 2.260 | 2.251 | 0.168 | 0.377 | 0.631 | collapse | |
| 28 | 0.679 | 0.546 | -0.261 | 1.789 | 1.867 | 0.368 | 0.686 | 0.787 | collapse | |
| 30 | 1.148 | 0.683 | -0.726 | 1.973 | 1.973 | 0.102 | 0.202 | 0.414 | collapse | |
| 32 | 1.359 | 0.770 | -0.902 | 1.487 | 1.553 | 0.069 | 0.107 | 0.253 | explosion | |
| 35 | 0.657 | 0.506 | -0.151 | 2.596 | 2.696 | 0.381 | 1.028 | 0.880 | collapse | |
| 38 | 0.695 | 0.591 | -0.412 | 1.529 | 1.888 | 0.331 | 0.626 | 0.741 | collapse | |
| 40 | 1.294 | 0.728 | -0.893 | 1.859 | 1.859 | 0.077 | 0.143 | 0.329 | uncertain |
Appendix B Information of Cores
| (M⊙) | (Fe) (M⊙) | (Si) (M⊙) | (O) (M⊙) | (CO) (M⊙) | (He) (M⊙) | |
|---|---|---|---|---|---|---|
| 3 | 20 | 1.45 | 1.77 | 2.19 | 4.26 | 6.43 |
| 23 | 1.69 | 1.52 | 1.44 | 5.19 | 5.54 | |
| 25 | 1.34 | 1.38 | 1.54 | 4.76 | 8.50 | |
| 28 | 1.38 | 1.51 | 1.79 | 3.46 | 6.36 | |
| 30 | 1.49 | 1.63 | 1.88 | 7.97 | 9.18 | |
| 32 | 1.45 | 1.58 | 1.75 | 8.23 | 9.55 | |
| 35 | 1.40 | 1.51 | 1.66 | 8.58 | 9.89 | |
| 38 | 1.41 | 1.54 | 1.64 | 10.06 | 10.08 | |
| 40 | 1.41 | 1.50 | 1.65 | 11.79 | 13.00 | |
| 2 | 20 | 1.33 | 1.39 | 1.61 | 2.41 | 6.57 |
| 23 | 1.49 | 1.70 | 1.99 | 4.99 | 7.22 | |
| 25 | 1.48 | 1.63 | 1.90 | 5.88 | 8.37 | |
| 28 | 1.33 | 1.43 | 1.63 | 5.93 | 7.71 | |
| 30 | 1.37 | 1.47 | 1.76 | 5.55 | 8.22 | |
| 32 | 1.40 | 1.53 | 1.97 | 3.69 | 7.50 | |
| 35 | 1.43 | 1.54 | 2.19 | 7.46 | 9.51 | |
| 38 | 1.59 | 1.82 | 2.49 | 10.55 | 10.60 | |
| 40 | 1.59 | 1.87 | 2.39 | 11.33 | 11.73 | |
| 1 | 18 | 1.50 | 1.63 | 1.75 | 3.73 | 5.77 |
| 20 | 1.36 | 1.46 | 1.84 | 4.30 | 6.42 | |
| 21 | 1.41 | 1.54 | 1.64 | 4.57 | 6.87 | |
| 23 | 1.41 | 1.52 | 1.95 | 5.33 | 6.07 | |
| 24 | 1.51 | 1.63 | 2.37 | 5.65 | 6.51 | |
| 25 | 1.44 | 1.57 | 2.44 | 5.85 | 7.58 | |
| 26 | 1.48 | 1.57 | 2.35 | 5.86 | 8.56 | |
| 27 | 1.54 | 1.72 | 2.75 | 6.61 | 8.21 | |
| 28 | 1.36 | 1.44 | 1.67 | 6.69 | 7.32 | |
| 30 | 1.56 | 1.80 | 2.06 | 7.78 | 8.42 | |
| 32 | 1.52 | 1.68 | 2.17 | 7.42 | 8.71 | |
| 35 | 1.50 | 1.66 | 2.57 | 7.42 | 11.06 | |
| 37 | 1.59 | 1.78 | 2.46 | 8.36 | 12.15 | |
| 38 | 1.69 | 2.00 | 2.88 | 10.99 | 13.07 | |
| 40 | 1.63 | 1.79 | 2.57 | 10.47 | 13.29 | |
| 0 | 13 | 1.36 | 1.42 | 1.48 | 2.30 | 3.83 |
| 14 | 1.38 | 1.50 | 1.57 | 2.63 | 4.22 | |
| 15 | 1.46 | 1.63 | 1.70 | 2.92 | 4.60 | |
| 16 | 1.45 | 1.60 | 1.72 | 3.19 | 4.93 | |
| 17 | 1.51 | 1.79 | 1.82 | 3.42 | 5.40 | |
| 18 | 1.46 | 1.67 | 1.75 | 3.54 | 5.63 | |
| 19 | 1.45 | 1.64 | 1.69 | 4.41 | 6.34 | |
| 20 | 1.49 | 1.65 | 2.07 | 4.30 | 6.52 | |
| 21 | 1.58 | 1.83 | 1.98 | 4.53 | 6.76 | |
| 22 | 1.42 | 1.54 | 2.49 | 4.86 | 6.04 | |
| 23 | 1.45 | 1.52 | 1.80 | 4.94 | 5.66 | |
| 24 | 1.19 | 1.48 | 2.35 | 5.74 | 7.01 | |
| 0 | 25 | 1.48 | 1.67 | 1.80 | 5.71 | 7.13 |
| 26 | 1.42 | 1.54 | 1.64 | 5.99 | 7.53 | |
| 27 | 1.48 | 1.68 | 1.77 | 6.66 | 8.35 | |
| 28 | 1.51 | 1.71 | 2.59 | 6.74 | 8.79 | |
| 29 | 1.58 | 1.85 | 2.34 | 7.43 | 9.04 | |
| 30 | 1.61 | 1.80 | 2.33 | 7.97 | 9.92 | |
| 31 | 1.58 | 1.83 | 2.03 | 8.26 | 9.77 | |
| 32 | 1.72 | 1.93 | 2.26 | 9.18 | 10.17 | |
| 33 | 1.71 | 2.12 | 2.81 | 8.91 | 10.74 | |
| 34 | 1.70 | 2.13 | 3.23 | 9.31 | 12.20 | |
| 35 | 1.76 | 2.21 | 3.17 | 8.59 | 12.62 | |
| 36 | 1.65 | 1.95 | 3.15 | 9.88 | 12.40 | |
| 37 | 1.65 | 1.90 | 3.93 | 10.41 | 13.12 | |
| 38 | 1.68 | 2.29 | 2.96 | 15.51 | 13.69 | |
| 39 | 1.76 | 2.14 | 2.42 | 12.60 | 14.76 | |
| 40 | 1.51 | 1.70 | 3.58 | 11.56 | 14.08 | |
| +1 | 13 | 1.35 | 1.50 | 1.57 | 2.31 | 3.87 |
| 16 | 1.56 | 1.72 | 2.00 | 3.28 | 5.17 | |
| 20 | 1.70 | 2.07 | 2.24 | 4.55 | 6.66 | |
| 22 | 1.67 | 1.95 | 2.67 | 5.30 | 7.47 | |
| 23 | 1.77 | 2.21 | 2.60 | 5.58 | 7.88 | |
| 24 | 1.71 | 2.10 | 2.39 | 5.76 | 7.20 | |
| 25 | 1.88 | 2.47 | 2.93 | 6.07 | 8.17 | |
| 26 | 1.79 | 2.12 | 2.45 | 6.36 | 8.34 | |
| 28 | 1.81 | 2.19 | 3.16 | 7.43 | 10.12 | |
| 30 | 1.90 | 2.44 | 2.84 | 7.98 | 9.99 | |
| 32 | 1.98 | 2.45 | 3.57 | 8.71 | 10.92 | |
| 35 | 1.61 | 1.89 | 5.07 | 9.72 | 12.02 | |
| 38 | 1.53 | 1.74 | 4.85 | 10.86 | 12.81 | |
| 40 | 2.11 | 3.33 | 4.72 | 11.88 | 14.76 | |
| +2 | 13 | 1.34 | 1.41 | 1.47 | 2.39 | 3.97 |
| 15 | 1.54 | 1.74 | 1.87 | 2.82 | 4.57 | |
| 18 | 1.67 | 1.92 | 2.39 | 3.85 | 4.91 | |
| 20 | 1.57 | 1.84 | 2.00 | 4.48 | 5.50 | |
| 23 | 1.36 | 1.48 | 1.58 | 5.47 | 6.55 | |
| 25 | 1.86 | 2.36 | 3.75 | 6.20 | 7.58 | |
| 28 | 1.58 | 1.74 | 2.49 | 7.25 | 8.81 | |
| 30 | 2.09 | 2.66 | 4.58 | 8.12 | 10.07 | |
| 32 | 2.26 | 3.19 | 5.00 | 8.81 | 10.66 | |
| 35 | 1.46 | 1.63 | 1.76 | 9.48 | 11.52 | |
| 38 | 1.46 | 1.76 | 2.69 | 11.01 | 12.89 | |
| 40 | 1.85 | 2.37 | 3.37 | 11.96 | 14.25 | |
| +3 | 13 | 1.54 | 1.67 | 2.01 | 2.34 | 3.69 |
| 15 | 1.36 | 1.46 | 1.53 | 2.79 | 3.33 | |
| 18 | 1.60 | 1.82 | 2.94 | 3.90 | 4.61 | |
| 20 | 1.76 | 2.07 | 3.43 | 4.56 | 5.54 | |
| +3 | 23 | 1.37 | 1.58 | 2.08 | 5.54 | 6.81 |
| 25 | 1.85 | 2.25 | 4.16 | 6.30 | 7.88 | |
| 28 | 2.09 | 2.99 | 5.26 | 7.42 | 9.26 | |
| 30 | 1.66 | 1.99 | 5.50 | 8.03 | 9.83 | |
| 32 | 1.42 | 1.57 | 4.77 | 8.99 | 10.47 | |
| 35 | 2.52 | 3.10 | 6.54 | 10.00 | 12.25 | |
| 38 | 2.39 | 2.81 | 6.48 | 11.01 | 12.88 | |
| 40 | 1.59 | 1.86 | 6.91 | 11.73 | 13.76 |
References
- Abbott et al. (2020) Abbott, R., Abbott, T. D., Abraham, S., et al. 2020, The Astrophysical Journal, 900, L13, doi: 10.3847/2041-8213/aba493
- An et al. (2015) An, Z.-D., Chen, Z.-P., Ma, Y.-G., et al. 2015, Phys. Rev. C, 92, 045802, doi: 10.1103/PhysRevC.92.045802
- Anders & Grevesse (1989) Anders, E., & Grevesse, N. 1989, Geochimica et Cosmochimica Acta, 53, 197, doi: 10.1016/0016-7037(89)90286-X
- Angulo et al. (1999) Angulo, C., Arnould, M., Rayet, M., et al. 1999, Nuclear Physics A, 656, 3 , doi: https://doi.org/10.1016/S0375-9474(99)00030-5
- Arnett (1996) Arnett, D. 1996, Supernovae and Nucleosynthesis: An Investigation of the History of Matter from the Big Bang to the Present
- Barkat et al. (1967) Barkat, Z., Rakavy, G., & Sack, N. 1967, Phys. Rev. Lett., 18, 379, doi: 10.1103/PhysRevLett.18.379
- Boccioli et al. (2025) Boccioli, L., Gogilashvili, M., Murphy, J., & O’Connor, E. P. 2025, MNRAS, 537, 1182, doi: 10.1093/mnras/staf066
- Boccioli et al. (2023) Boccioli, L., Roberti, L., Limongi, M., Mathews, G. J., & Chieffi, A. 2023, ApJ, 949, 17, doi: 10.3847/1538-4357/acc06a
- Branch & Wheeler (2017) Branch, D., & Wheeler, J. C. 2017, Supernova Explosions, doi: 10.1007/978-3-662-55054-0
- Burrows & Vartanyan (2021) Burrows, A., & Vartanyan, D. 2021, Nature, 589, 29, doi: 10.1038/s41586-020-03059-w
- Chatzopoulos et al. (2016) Chatzopoulos, E., Couch, S. M., Arnett, W. D., & Timmes, F. X. 2016, The Astrophysical Journal, 822, 61, doi: 10.3847/0004-637X/822/2/61
- Chieffi & Limongi (2020) Chieffi, A., & Limongi, M. 2020, ApJ, 890, 43, doi: 10.3847/1538-4357/ab6739
- Chieffi et al. (2021) Chieffi, A., Roberti, L., Limongi, M., et al. 2021, ApJ, 916, 79, doi: 10.3847/1538-4357/ac06ca
- Costa et al. (2021) Costa, G., Bressan, A., Mapelli, M., et al. 2021, MNRAS, 501, 4514, doi: 10.1093/mnras/staa3916
- Cristini et al. (2019) Cristini, A., Hirschi, R., Meakin, C., et al. 2019, MNRAS, 484, 4645, doi: 10.1093/mnras/stz312
- Cyburt et al. (2010) Cyburt, R. H., Amthor, A. M., Ferguson, R., et al. 2010, The Astrophysical Journal Supplement Series, 189, 240, doi: 10.1088/0067-0049/189/1/240
- de Jager et al. (1988) de Jager, C., Nieuwenhuijzen, H., & van der Hucht, K. A. 1988, A&AS, 72, 259
- Ertl et al. (2016) Ertl, T., Janka, H. T., Woosley, S. E., Sukhbold, T., & Ugliano, M. 2016, ApJ, 818, 124, doi: 10.3847/0004-637X/818/2/124
- Ertl et al. (2020) Ertl, T., Woosley, S. E., Sukhbold, T., & Janka, H. T. 2020, ApJ, 890, 51, doi: 10.3847/1538-4357/ab6458
- Farmer et al. (2016) Farmer, R., Fields, C. E., Petermann, I., et al. 2016, ApJS, 227, 22, doi: 10.3847/1538-4365/227/2/22
- Farmer et al. (2020) Farmer, R., Renzo, M., de Mink, S. E., Fishbach, M., & Justham, S. 2020, The Astrophysical Journal, 902, L36, doi: 10.3847/2041-8213/abbadd
- Farmer et al. (2019) Farmer, R., Renzo, M., de Mink, S. E., Marchant, P., & Justham, S. 2019, The Astrophysical Journal, 887, 53, doi: 10.3847/1538-4357/ab518b
- Fields et al. (2018) Fields, C. E., Timmes, F. X., Farmer, R., et al. 2018, ApJS, 234, 19, doi: 10.3847/1538-4365/aaa29b
- Fuller et al. (1985) Fuller, G. M., Fowler, W. A., & Newman, M. J. 1985, ApJ, 293, 1, doi: 10.1086/163208
- Hammer et al. (2005) Hammer, J., Fey, M., Kunz, R., et al. 2005, Nucl. Phys. A, A758, doi: 10.1016/j.nuclphysa.2005.05.066
- Hayashi et al. (1962) Hayashi, C., Hōshi, R., & Sugimoto, D. 1962, Progress of Theoretical Physics Supplement, 22, 1, doi: 10.1143/PTPS.22.1
- Heger et al. (2008) Heger, A., Langer, N., & Woosley, S. E. 2008, Astrophysical Journal, 528, 368, doi: 10.1086/308158
- Jermyn et al. (2023) Jermyn, A. S., Bauer, E. B., Schwab, J., et al. 2023, ApJS, 265, 15, doi: 10.3847/1538-4365/acae8d
- Kaiser et al. (2020) Kaiser, E. A., Hirschi, R., Arnett, W. D., et al. 2020, MNRAS, 496, 1967, doi: 10.1093/mnras/staa1595
- Keszthelyi et al. (2020) Keszthelyi, Z., Meynet, G., Shultz, M. E., et al. 2020, Monthly Notices of the Royal Astronomical Society, 493, 518, doi: 10.1093/mnras/staa237
- Kippenhahn et al. (2013) Kippenhahn, R., Weigert, A., & Weiss, A. 2013, Stellar Structure and Evolution, doi: 10.1007/978-3-642-30304-3
- Kunz et al. (2002) Kunz, R., Fey, M., Jaeger, M., et al. 2002, ApJ, 567, 643, doi: 10.1086/338384
- Langanke & Martínez-Pinedo (2000) Langanke, K., & Martínez-Pinedo, G. 2000, Nucl. Phys. A, 673, 481, doi: 10.1016/S0375-9474(00)00131-7
- Laplace et al. (2021) Laplace, E., Justham, S., Renzo, M., et al. 2021, A&A, 656, A58, doi: 10.1051/0004-6361/202140506
- Limongi & Chieffi (2015) Limongi, M., & Chieffi, A. 2015, in in Chemical and dynamical evolution of the Milky Way and the Local Group, 15
- Maeder & Stahler (2009) Maeder, A., & Stahler, S. 2009, Physics Today, 62, 52, doi: 10.1063/1.3226770
- Mapelli et al. (2020) Mapelli, M., Spera, M., Montanari, E., et al. 2020, The Astrophysical Journal, 888, 76, doi: 10.3847/1538-4357/ab584d
- Marchant & Moriya (2020) Marchant, P., & Moriya, T. J. 2020, A&A, 640, L18, doi: 10.1051/0004-6361/202038902
- Müller et al. (2016) Müller, B., Heger, A., Liptai, D., & Cameron, J. B. 2016, MNRAS, 460, 742, doi: 10.1093/mnras/stw1083
- Nomoto (1984) Nomoto, K. 1984, ApJ, 277, 791, doi: 10.1086/161749
- Nomoto & Hashimoto (1988) Nomoto, K., & Hashimoto, M. 1988, Phys. Rep., 163, 13, doi: 10.1016/0370-1573(88)90032-4
- Nomoto et al. (2013) Nomoto, K., Kobayashi, C., & Tominaga, N. 2013, ARA&A, 51, 457, doi: 10.1146/annurev-astro-082812-140956
- Nugis & Lamers (2000) Nugis, T., & Lamers, H. J. G. L. M. 2000, A&A, 360, 227
- O’Connor & Ott (2011) O’Connor, E., & Ott, C. D. 2011, in APS Division of Nuclear Physics Meeting Abstracts, APS Meeting Abstracts, CG.005
- Oda et al. (1994) Oda, T., Hino, M., Muto, K., Takahara, M., & Sato, K. 1994, Atomic Data and Nuclear Data Tables, 56, 231, doi: https://doi.org/10.1006/adnd.1994.1007
- Ohkubo et al. (2009) Ohkubo, T., Nomoto, K., Umeda, H., Yoshida, N., & Tsuruta, S. 2009, ApJ, 706, 1184, doi: 10.1088/0004-637X/706/2/1184
- Osaki (1966) Osaki, Y. 1966, PASJ, 18, 384
- Paxton et al. (2011) Paxton, B., Bildsten, L., Dotter, A., et al. 2011, ApJS, 192, 3, doi: 10.1088/0067-0049/192/1/3
- Paxton et al. (2013) Paxton, B., Cantiello, M., Arras, P., et al. 2013, ApJS, 208, 4, doi: 10.1088/0067-0049/208/1/4
- Paxton et al. (2015) Paxton, B., Marchant, P., Schwab, J., et al. 2015, ApJS, 220, 15, doi: 10.1088/0067-0049/220/1/15
- Paxton et al. (2018) Paxton, B., Schwab, J., Bauer, E. B., et al. 2018, ApJS, 234, 34, doi: 10.3847/1538-4365/aaa5a8
- Paxton et al. (2019) Paxton, B., Smolec, R., Schwab, J., et al. 2019, ApJS, 243, 10, doi: 10.3847/1538-4365/ab2241
- Renzo et al. (2020) Renzo, M., Cantiello, M., Metzger, B. D., & Jiang, Y. F. 2020, ApJ, 904, L13, doi: 10.3847/2041-8213/abc6a6
- Renzo et al. (2017) Renzo, M., Ott, C. D., & Shore, S. N. 2017, A&A, 603, A118, doi: 10.1051/0004-6361/201730698
- Rizzuti et al. (2022) Rizzuti, F., Hirschi, R., Georgy, C., et al. 2022, MNRAS, 515, 4013, doi: 10.1093/mnras/stac1981
- Sallaska et al. (2013) Sallaska, A. L., Iliadis, C., Champange, A. E., et al. 2013, ApJS, 207, 18, doi: 10.1088/0067-0049/207/1/18
- Schneider et al. (2021) Schneider, F. R. N., Podsiadlowski, Ph., & Müller, B. 2021, A&A, 645, A5, doi: 10.1051/0004-6361/202039219
- Schwarzschild (1958) Schwarzschild, M. 1958, Structure and evolution of the stars.
- Sugimoto & Fujimoto (2000) Sugimoto, D., & Fujimoto, M. Y. 2000, ApJ, 538, 837, doi: 10.1086/309150
- Sugimoto & Nomoto (1980) Sugimoto, D., & Nomoto, K. 1980, Space Sci. Rev., 25, 155, doi: 10.1007/BF00212318
- Sukhbold & Adams (2020) Sukhbold, T., & Adams, S. 2020, MNRAS, 492, 2578, doi: 10.1093/mnras/staa059
- Sukhbold et al. (2016) Sukhbold, T., Ertl, T., Woosley, S. E., Brown, J. M., & Janka, H. T. 2016, ApJ, 821, 38, doi: 10.3847/0004-637X/821/1/38
- Sukhbold & Woosley (2014) Sukhbold, T., & Woosley, S. E. 2014, ApJ, 783, 834, doi: 10.1088/0004-637X/783/1/10
- Sukhbold et al. (2018) Sukhbold, T., Woosley, S. E., & Heger, A. 2018, ApJ, 860, 93, doi: 10.3847/1538-4357/aac2da
- Timmes (1999) Timmes, F. X. 1999, ApJS, 124, 241, doi: 10.1086/313257
- Timmes et al. (2000) Timmes, F. X., Hoffman, R. D., & Woosley, S. E. 2000, ApJS, 129, 377, doi: 10.1086/313407
- Timmes et al. (1996) Timmes, F. X., Woosley, S. E., & Weaver, T. A. 1996, ApJ, 457, 834, doi: 10.1086/176778
- Tumino et al. (2018) Tumino, A., Spitaleri, C., La Cognata, M., et al. 2018, Nature, 557, 687, doi: 10.1038/s41586-018-0149-4
- Tur et al. (2007) Tur, C., Heger, A., & Austin, S. M. 2007, ApJ, 671, 821, doi: 10.1086/523095
- Ugliano et al. (2012) Ugliano, M., Janka, H.-T., Marek, A., & Arcones, A. 2012, ApJ, 757, 69, doi: 10.1088/0004-637X/757/1/69
- van Son et al. (2020) van Son, L. A. C., De Mink, S. E., Broekgaarden, F. S., et al. 2020, ApJ, 897, 100, doi: 10.3847/1538-4357/ab9809
- Vink et al. (2001) Vink, J. S., de Koter, A., & Lamers, H. J. G. L. M. 2001, A&A, 369, 574, doi: 10.1051/0004-6361:20010127
- Wang et al. (2022) Wang, T., Vartanyan, D., Burrows, A., & Coleman, M. S. B. 2022, MNRAS, 517, 543, doi: 10.1093/mnras/stac2691
- Weaver & Woosley (1993) Weaver, T. A., & Woosley, S. E. 1993, Phys. Rep., 227, 65, doi: 10.1016/0370-1573(93)90058-L
- West et al. (2013) West, C., Heger, A., & Austin, S. M. 2013, ApJ, 769, 2, doi: 10.1088/0004-637X/769/1/2
- Woosley (2017) Woosley, S. E. 2017, The Astrophysical Journal, 836, 244, doi: 10.3847/1538-4357/836/2/244
- Woosley & Heger (2021) Woosley, S. E., & Heger, A. 2021, ApJ, 912, L31, doi: 10.3847/2041-8213/abf2c4
- Woosley et al. (2002) Woosley, S. E., Heger, A., & Weaver, T. A. 2002, Reviews of Modern Physics, 74, 1015, doi: 10.1103/RevModPhys.74.1015