Ferromagnetic Resonance in a Magnetically Dilute Percolating Ferromagnet: An Experimental and Theoretical Study
Abstract
Ferromagnetic resonance (FMR) serves as a powerful probe of magnetization dynamics and anisotropy in percolating ferromagnets, where short-range interactions govern long-range magnetic order. We apply this approach to Ga1-xMnxN (%), a dilute ferromagnetic semiconductor, combining FMR and superconducting quantum interference device magnetometry. Our results confirm the percolative nature of ferromagnetism in (Ga,Mn)N, with a Curie temperature K, and reveal that despite magnetic dilution, key features of conventional ferromagnets are retained. FMR measurements establish a robust uniaxial anisotropy, dictated by Mn3+ single-ion anisotropy, with an easy-plane character at low Mn content. While excessive line broadening suppresses FMR signals below 9 K, they persist up to 70 K, indicating the presence of non-percolating ferromagnetic clusters well above . The temperature dependence of the FMR intensity follows that of the magnetization, underscoring the stability of these clusters. Analysis of the FMR linewidth provides insights into relaxation processes, revealing large Gilbert damping due to the low magnetization of the system. Strikingly, atomistic spin model simulations reproduce the experimentally observed resonance fields, anisotropy trends, and linewidth evolution with remarkable accuracy. This agreement underscores the predictive power of our modeling approach in describing percolating ferromagnets. This study advances the understanding of percolating ferromagnetic systems, demonstrating that FMR is a key technique for probing their unique dynamic and anisotropic properties. Our findings contribute to the broader exploration of dilute ferromagnets and provide new insights into percolating ferromagnetic systems, which will be relevant for spintronic opportunities.
I Introduction
The application of direct spin control in optoelectronic devices would be a large technological step forward. In this context dilute ferromagnetic semiconductors (DFS) have emerged as a subject of substantial research interest, due to their ability to blend the functionalities of semiconductorsinsulators and the spin degrees of freedom [1, 2], thus paving the way to technological applications [3]. Within the systems being considered [4], (Ga,Mn)N or Ga1-xMnxN, with representing the fraction of manganese ions distributed randomly on gallium sites, has gained substantial interest. This is mainly due to the high thermal stability of the wide band gap GaN host, that makes it suitable for use in extreme environments, such as outer space or harsh industrial settings.
Despite numerous attempts [5] the room temperature ferromagnetism (FM) of DFS remains an elusive goal of materials science. In the case of Mn doped GaN the main reason is the insulating character of both GaN:Mn [6] and (Ga,Mn)N mixed crystals [7, 8, 9], which precludes magnetic coupling via itinerant carriers. In the wurtzite GaN lattice Mn is tetrahedrally coordinated by 4 neighboring nitrogen ions. In the absence of other intentional doping or charged point defects Mn assumes a neutral acceptor oxidation state, Mn3+ ( configuration) [10, 11], for which the effective coupling mechanism is short-range ferromagnetic superexchange [12, 7, 13], confirmed for up to at least 25 near neighbors [14].
It is this superexchange coupling which induces the FM phase in (Ga,Mn)N, though its short range character and rather low Mn concentrations (not exceeding % [15] and typically below 10%) results in a percolating character of the ferromagnetism [16, 17, 18] realized in (Ga,Mn)N only at the low end of cryogenic temperatures [19, 13, 20, 21, 22]. This situation is very different from that of the canonical DFS (Ga,Mn)As [23, 24], for which a robust global FM state can be stabilized up to above 170 K [25] by the hole-mediated long-range coupling for the same range of Mn compositions [2].
There are a few profound implications of the percolating form of FM in (Ga,Mn)N to our study. Whereas all of the spins are expected to be coupled at , only a fraction of the spins present in the material supports the FM state at nonzero temperatures. Starting from high temperatures, Mn spins form clusters of various shape and sizes and the Curie temperature , marks that temperature at which the first infinite, percolating ("wall-to-wall") FM cluster forms. Therefore, at nonzero temperatures such a magnetic system is expected to behave as an ensemble of infinite and finite FM clusters (macrospins), characterized by a wide range of blocking temperatures and relaxation times.
This makes the magnetism, in general, and , in particular, to depend on the characteristic measurement time () of the experimental technique in use. Similar to the blocking behavior in magnetically granular systems, the longer the , the lower the characteristic temperature (in this case ), as more macrospins are given sufficient amount of time to reach equilibrium, in which they average out their contributions to the measured magnetic properties (e.g. magnetic moment in case of magnetometry). Interestingly, this phenomenon is also observed in (Ga,Mn)As, where, due to various technological factors [26, 27] or deliberate measurement design [28, 29, 30], the material can be pushed toward the localization limit of holes. At this boundary, magnetic coupling is maintained only on mesoscopic scales [31, 32, 28, 33].
Another important factor is that Mn ions in GaN retain their single-ion magnetic anisotropy (SIMA), which is only weakly modified by their mutual FM coupling. Mn3+ ions in GaN adopt a high-spin configuration (, ), with the state being the ground state. In the paramagnetic regime, a strong uniaxial magnetic anisotropy (UMA) emerges at low temperatures, differentiating the magnetic response depending on whether the external magnetic field is applied parallel or perpendicular to the hexagonal -axis of the GaN crystal, i.e., or , respectively. This anisotropy arises from the trigonal distortion inherent to the wurtzite GaN lattice structure.
In the ideal tetrahedral cooridination the ratio of the hexagonal lattice parameters . In pure GaN and at low Mn concentrations, , resulting in UMA with an easy-plane character, favoring spin alignment within the basal plane and making the -axis the hard axis. However, upon increasing Mn concentration, the situation changes significantly. For Mn content, , exceeding about 10%, a transition to an elongated tetrahedron is anticipated in (Ga,Mn)N [20], which leads to a tensile trigonal distortion capable of reversing the easy magnetization direction to the -axis.
Between these two regimes, an intriguing scenario may arise where the trigonal distortion is marginal, effectively nullifying UMA. Under such conditions, a significantly weaker threefold magnetic anisotropy could be potentially observed, originating from the static Jahn-Teller (JT) effect. This effect displaces N ions surrounding Mn ion, thereby lowering the local site symmetry of the Mn ion [34, 35]. Although the JT-related anisotropy is relatively weak, it plays a pivotal role in magnetization switching processes in FM (Ga,Mn)N [36].
To quantify the magnetic properties of paramagnetic Mn3+ in GaN one can use the crystal-field model (CFM) [37, 38, 39] developed originally for Cr2+ in II-VI semiconductors [40, 41, 42] and adopted to Mn3+ in GaN [38, 34, 43, 44, 45, 36]. However, this exact quantum-mechanical approach to the magnetism of Mn in GaN becomes computationally challenging, as the Hamiltonian matrix size grows exponentially with the number of interacting neighboring Mn ions considered. To overcome this limitation, a classical approximation - an atomistic spin model [46] - has been successfully applied to (Ga,Mn)N. In this framework, employed also in this study, the stochastic Landau–Lifshitz–Gilbert (sLLG) method is used to describe the precessional dynamics of spins, represented as classical vectors [47, 36].
Prior studies have definitively shown the importance of investigating static micro-magnetic properties in (Ga,Mn)N layers [43, 21, 13, 7]. The manipulation of magnetic anisotropy in (Ga,Mn)N using electric fields was successfully demonstrated in both the paramagnetic [44] and FM case [36]. Furthermore, using the spin Hall magnetoresistance technique [48], the spectrum of (Ga,Mn)N functionalities was recently supplemented by the demonstration of efficient generation and detection of spin currents in Pt/(Ga,Mn)N structures up to 50 K [49], i.e., well above the Curie temperature established upon magnetometry method. Despite these advancements, our understanding of the dynamics and relaxation processes of magnetization within (Ga,Mn)N, along with the intricate physics governing magnetic anisotropy, remains in its infancy. To address these shortcomings, the ferromagnetic resonance (FMR) technique is employed, a highly precise method renowned for its capability to probe the dynamic magnetic properties of ferromagnetic thin films [50].
FMR is the ideal method for comprehensively assessing fundamental characteristics, including absolute values of magnetic anisotropies, Curie temperature, magnetoelastic coupling coefficients, and parameters describing magnetization relaxation [51]. While FMR techniques have been instrumental in exploring the dynamics and relaxation processes of magnetization in other DFS [51, 52, 53, 54], the realm of (Ga,Mn)N remains largely uninvestigated in this context. This is primarily due to the fact that, unlike Mn2+ ( configuration), the paramagnetic Mn3+ ion in GaN tetrahedral coordination is EPR silent in typical X-band spectrometers. Consequently much of the information available today on the properties of the Mn3+ state in GaN was established by optical spectroscopy [38, 39] and low-temperature and high-field magnetometry [38, 34, 43, 55]. In this context, the robust FM state observed in (Ga,Mn)N [21] allows us to address the material using classical EPR equipment by studying FMR, the collective response of the otherwise EPR-silent Mn3+ ions. Our study, therefore, aims to expand the pool of understanding of this dilute magnetic percolating system well beyond the limits of static SQUID measurements ( of the order of seconds) into the realm of GHz, specific to FMR technique.
In this work, we concentrate on a thorough investigation of magnetic properties of the insulating ferromagnetic Ga1-xMnxN layer with an Mn concentration of % by applying the FMR technique and superconducting quantum interference device (SQUID) magnetometry. Our primary focus lies in analyzing the temperature dependence of the resonance field and its correlation with the angular orientation of the applied magnetic field. This approach allows us to determine critical parameters such as the Curie temperature, the effective -factor, and magnetic anisotropy constants across varying temperatures. Moreover, our investigation extends to explore the temperature and angular-dependent line width of the signal. This analysis is crucial in unveiling valuable insights into material inhomogeneities and relaxation mechanisms in (Ga,Mn)N.
II Methods
II.1 Experiment
II.1.1 Samples
(Ga,Mn)N layers with various thicknesses up to about 1 m are grown by the molecular beam epitaxy (MBE) technique on fully relaxed GaN templates (about 2m thick) deposited by MOVPE on -plane 0.3 - 0.4 mm thick Al2O3 substrates, following the specifications elaborated previously to obtain single phase epitaxial layers without traceable amounts of other magnetic phases [20, 22]. The surface quality of the layers was monitored in situ during growth using reflection high-energy electron diffraction. High quality and single phase of the material are confirmed by high-resolution X-ray diffraction.
II.1.2 Experimental procedures
Magnetic measurements are performed in a Quantum Design superconducting quantum interference device (SQUID) MPMS-XL magnetometer with a low field option to measure magnetic properties at magnetic fields up to 70 kOe and temperatures between 2 and 400 K. Strict protocols are followed to avoid artifacts and limitations of volume SQUID magnetometry of thin films deposited on bulky substrates [56, 57, 58]. Measurements of a bare GaN template substrate serve as a reference signal to eliminate the interference of disturbing low-temperature magnetic anisotropy of commercial sapphire substrates [59]. The remaining relevant details are given in Appendix A.
Ferromagnetic resonance experiments are conducted with use of a BRUKER EMX plus spectrometer operating at 9.5 GHz ( eV) and equipped with an Oxford Instruments 910 Cryostat enabling temperature control from 3 to 300 K and 360 deg sample rotation with respect to the static external magnetic field . The recorded FMR signal is the magnetic field derivative of the absorbed microwave power that is proportional to the imaginary part of the AC magnetic susceptibility .

II.2 Numerical simulations
The experimental data are modeled using an atomistic spin model [46] combined with the stochastic Landau-Lifshitz-Gilbert (sLLG) equation [47, 36]. Simulations are performed on a system consisting of 9860 randomly distributed Mn spins in a wurtzite lattice, with in-plane periodic boundary conditions to model a large thin film. The classical spin Hamiltonian accounts for Zeeman energy, magnetocrystalline anisotropy, and ferromagnetic superexchange interactions between Mn ions taken exactly up to the 14th coordination sphere [18]. The spin dynamics are governed by the sLLG equation, and the magnetization and FMR response are computed as a function of external magnetic field and temperature. A Monte Carlo method is employed to simulate thermo-remnant magnetization. [60, 61].
Of particular importance in this study is an attempt to model FMR measurements. To this end the simulation box is numerically subjected to an AC magnetic field [62], and the resonance field and line-width are extracted from the simulation results. Details of the simulation methodology, including the full Hamiltonian, equations of motion, and parameter values, are provided in Appendix B.
III RESULTS AND DISCUSSIONS
III.1 Magnetic characterization
The Curie temperature, , is the main parameter describing any ferromagnetic material [63], yet its determination has remained a challenge despite numerous advances in this field. The challenge grows in magnetically dilute materials when the critical features become smeared over a wide temperature range. In this study, we employ the thermoremnant magnetization (TRM) measurements as the least cumbersome method of the determination of in DFS, regardless of the range of the FM interaction [21, 64, 22, 65].
To acquire TRM data the sample is initially field-cooled in a magnetic field of kOe [blue squares in Fig. 1 (a)]. After quenching the field at K the TRM is recorded during warming [green bullets in Fig. 1 (a)]. The temperature at which TRM vanishes indicates the K in this film. More in-depth experimental considerations pertinent to this technique are outlined in Appendix A.
Exemplary magnetization curves, , obtained for the same sample at K are shown in Fig. 1 (b) as solid symbols. Despite being in the FM state, the sample exhibits a considerable rounded dependence at low magnetic fields [19, 20, 21, 22, 66, 45, 36]. This behavior arises directly from the significant magnetic dilution and short-range character of the superexhange interaction, both giving rise to the percolative nature of the FM coupling.
On a microscopic level, this effect manifests itself as a broad distribution of ferromagnetically coupled clusters of varying sizes, meaning that at weak magnetic fields, hysteresis involves only a fraction of the spins. At this level of dilution, (Ga,Mn)N does not form a uniform ferromagnetic phase below . Moreover, the data indicate that magnetization does not fully saturate even at fields as high as 70 kOe. This behavior arises from the significant contribution of the weakly saturating orbital moment to the total magnetic moment of Mn3+ ions [67].
The results of the simulations of the corresponding magnetizations, TRM() in Fig. 1 (a) and in Fig. 1 (b), are represented by open symbols. Given the relatively simplified assumptions underlying our computational approach, this level of agreement can be considered aa a significant achievement. Notably, the calculated Curie temperature differs from the experimentally determined value by only a factor of two.
A particularly good correspondence is observed for the dependence, especially at high magnetic fields. The main quantitative discrepancies arise near , as highlighted in the inset of Fig. 1 (b), and in the simulation of TRM(). In general, the simulations tend to overestimate in the low-field regime. This discrepancy likely stems from the limitations of our current model, which does not fully account for the complexity of the real Mn distribution in (Ga,Mn)N. The primary simplification lies in the assumption of an ideal wurtzite GaN environment surrounding each Mn ion, where the magnetic response is treated within the single-ion anisotropy approach. While the model includes spin-spin interactions, it assumes that each Mn ion remains embedded in a locally undisturbed crystalline field. As a result, the computation scheme does not incorporate local symmetry breaking induced by neighboring Mn3+ ions [35]. This effect modifies the anisotropy landscape and becomes particularly relevant at low fields, where the Zeeman energy is small.
III.2 Temperature dependence of the FMR
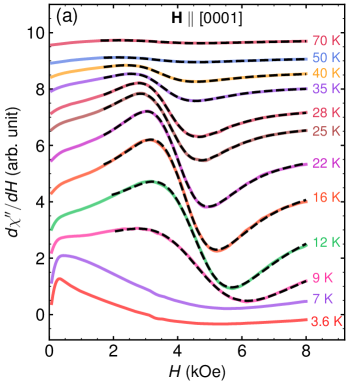
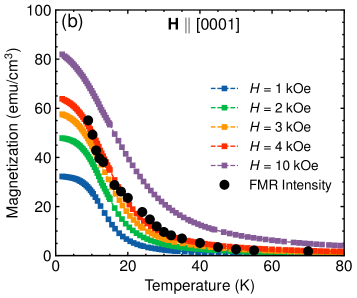
Fig. 2 (a) depicts the temperature dependence of the ferromagnetic resonance spectra when is applied along the out-of-plane direction (). The hard direction was chosen to minimize the effects of superposition of the FMR signal with the cyclotron resonance (CR) background signal stemming from the conducting GaN template. In contrast to SQUID results, at low temperatures (up to 7 K) only a strong CR and a very weak defect-related paramagnetic signal at are visible. Ferromagnetic signatures start to appear around K and their integrated intensity gradually decreases with increasing temperature to disappear entirely above K. The lack of FMR signals below K is due to the very fast relaxation rate of the magnetization which makes the FMR signal too broad to be detected. This will be discussed in detail in Section III.4.
In order to compare the FMR results with the magnetization measured with SQUID at nonzero magnetic fields we fit the signals with the derivative of a Lorentzian function:
| (1) |
to establish the amplitude , , and the half width at half maximum (HWHM) at each temperature. In the fits we also include the influence of the substrate free electron absorption, which at high enough fields can be approximated by the sum of a decreasing exponential function and a linear increase with . The fits are denoted by black dashed lines in Fig. 2 (a). The FMR intensity, , is then calculated as and is directly proportional to the magnitude of the ferromagnetic moment. In the absence of magnetocrystalline anisotropy it would be possible to obtain absolute values of magnetization from the in- and out-of-plane FMR measurements. This is not the case here. Therefore, we adjust the established intensity of the FMR signal to the magnetization value determined from SQUID at 3 kOe and 55 K. As shown in Fig. 2 (b) a close correspondence is observed between the values measured between and 4 kOe and (black circles) derived from the FMR data. In both cases the transition temperature exceeds . The fact that the FMR signal persists up to K is attributed to the magnetic field ( kOe) applied in the FMR experiment, which acts against thermal fluctuations [52, 68], and the presence of non-percolating ferromagnetic clusters above .
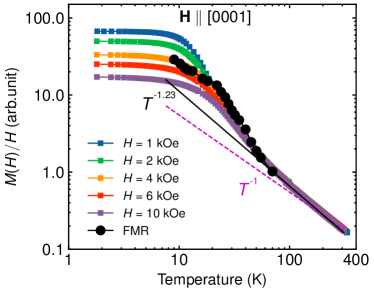
To substantiate this scenario we re-draw the magnetometry and FMR results in a double logarithmic scale, Fig. 3, since in amorphous systems with a wide range of exchange integrals the above their specific coupling temperature is expected to be proportional to [69, 70]. Obviously, for non-interacting systems (the Curie law) and this dependency is marked by a dashed line in Fig. 3. However, the presence of interactions tends to form spin pairs and higher order complexes which reduce/enhance the magnetization with respect to for antiferromagnetic/ferromagnetic coupling among the spins. As a result for random antiferromagnets. Here Mn- or Co-based II-VI dilute magnetic semiconductors are good examples [71, 72, 73]. Analogously, for ferromagnetic coupling, and (Ga,Mn)N is the prime example here [21]. Our magnetometry data plotted in Fig. 3 follow the same trend as in [21] yielding for K (marked by the solid black line). This behavior is obeyed at high temperatures independently of the magnitude of , at least within 1 to 10 kOe range. However, below 70 K the whole group of curves deviates up from the trend, and start to fan-out below 30 K, though not signalizing any critical behavior around . The FMR results follow the same trend. In particular they align within data obtained for or 4 kOe. The former finding confirms that proxies the of (Ga,Mn3+)N. This is only the case as long as the Mn3+ ions form sufficiently large ferromagneticaly ordered clusters - macrospins - which absorb coherently the microwave energy.
The pertinent question arises about the size of these FM-coupled entities. The direct quantum-mechanical computations of Ga0.97MnN with nearest neighbors complexes taken into account up to the forth order (that is pairs, triplets and quartets) [45] showed only marginal improvement over the case of non-interacting Mn3+ singles. This proves that the FM-like macrospins puddles must contain Mn ions.

III.3 Magnetocrystalline anisotropy
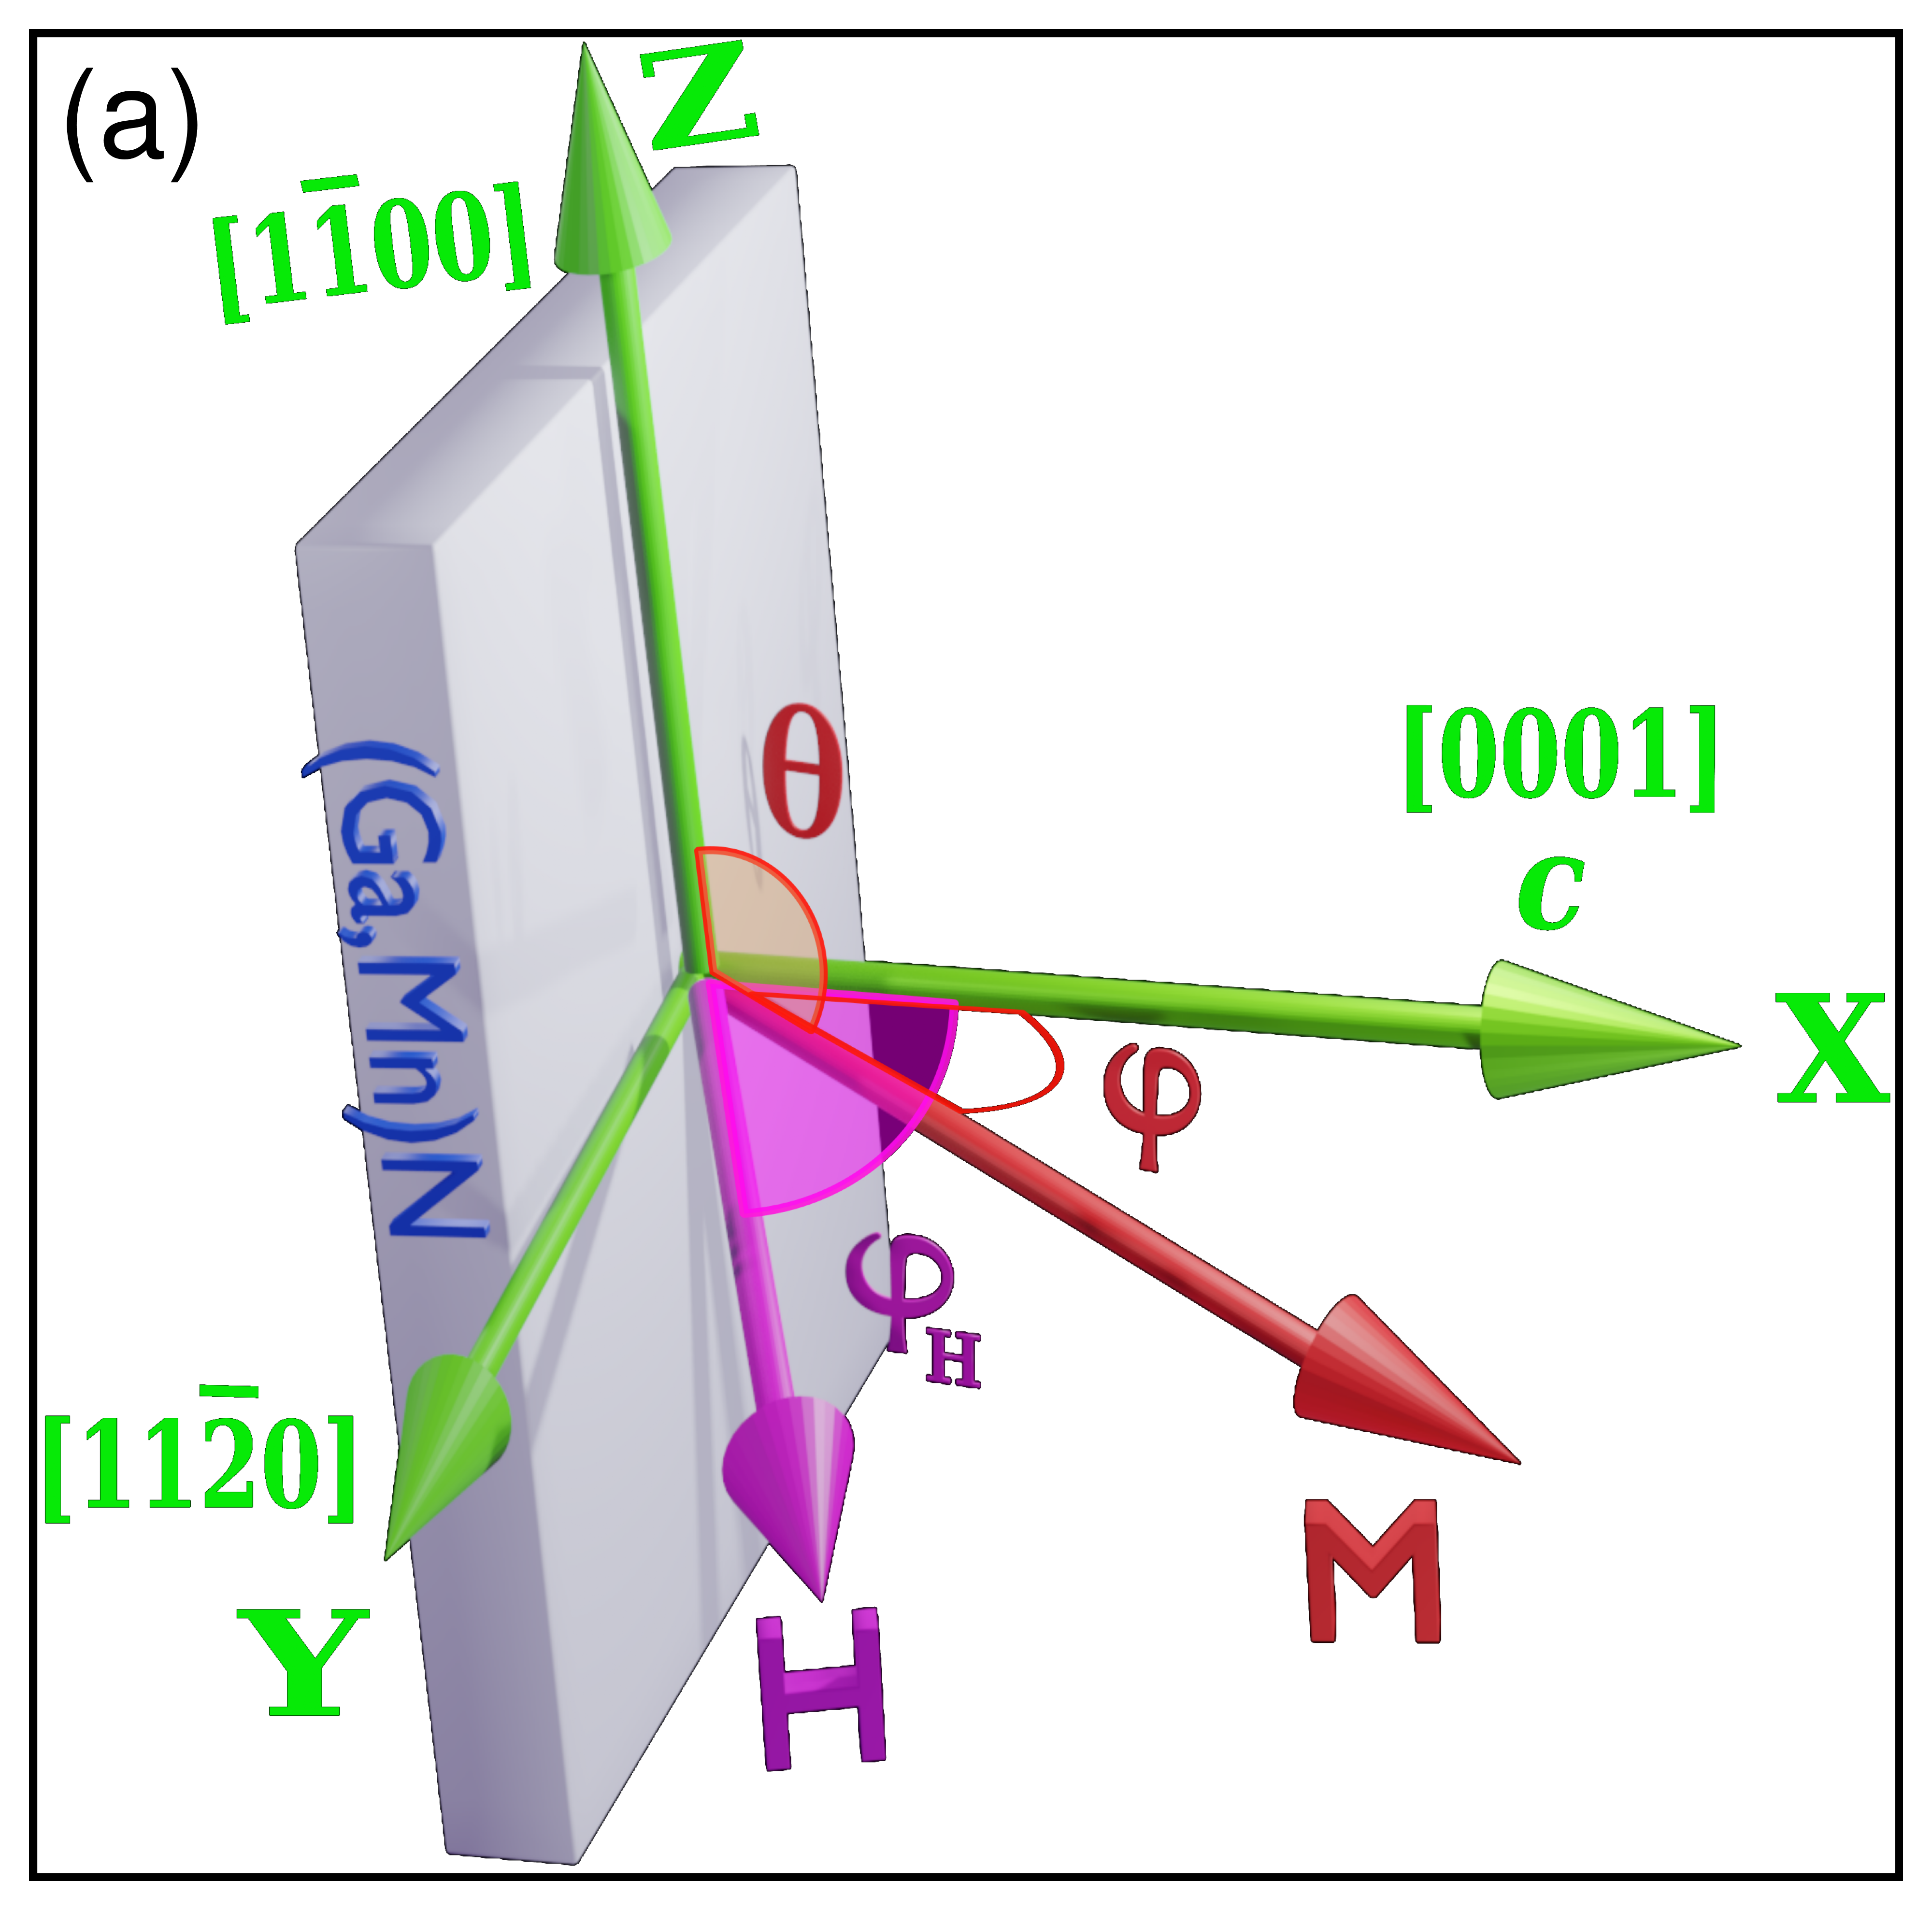
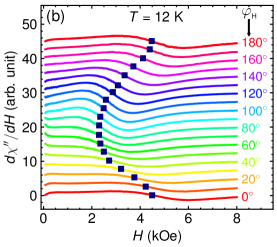
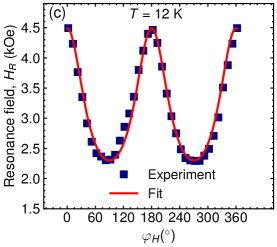
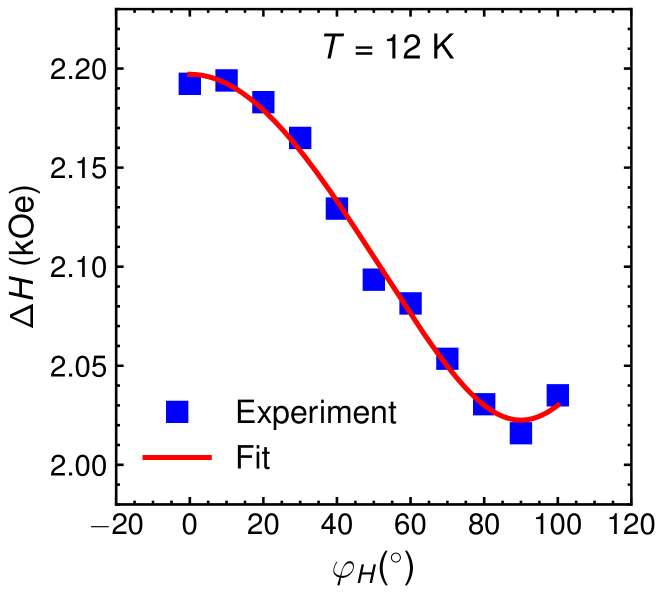
Ferromagnetic resonance is the easiest experimental technique to investigate magnetocrystalline anisotropy. For this purpose we have chosen to rotate the external magnetic field in the (100) plane, which contains all the relevant crystallographic directions, including the cubic axes along which static Jahn-Teller distortions occur [74]. However, the low temperature line broadening and the background cyclotron resonance of the GaN template precludes angular dependent investigations below 12 K. The experimental geometry is shown schematically in Fig. 4 (a). Selected FMR spectra recorded for different orientations of the applied magnetic field are presented in Fig. 4 (b), while the angular dependence of the determined resonance fields is given in Fig. 4 (c) (symbols). The solid line in Fig. 4 (c) is calculated with the use of the Smit-Beljers equation [75]:
| (2) |
where 9.5 GHz is the uniform mode resonance frequency, is the effective spectroscopic splitting factor, is the Bohr magneton, and are the polar and azimuthal angles of the magnetization vector, M, defined in Fig. 4 (a), and is the anisotropic part of the magnetic free energy density. The equilibrium angles of M () are determined by minimizing . In the coordinate system of Fig. 4 (a) is given by:
| (3) |
Here, the first term describes the Zeeman energy, whereas the second term is a combination of the thin film demagnetization energy and the uniaxial magnetocrystalline anisotropy energy along the [0001] axis. We adhere to the standard convention that the sign of the uniaxial anisotropy is opposite to that defined in the electron paramagnetic resonance Hamiltonian [50]. Higher order terms in are omitted. Since for the magnetization vector also lies in the (100) rotation plane. Defining an effective uniaxial anisotropy field as:
| (4) |
we obtain the following equations:
| (5) |
| (6) |
which can be solved analytically. The relation between and is given by:
| (7) |
The best fit of Eqs:(5)-(7) to the experimental data is shown by solid line in Fig. 4 (c). It yields kOe and . The uniaxial anisotropy energy density, determined by subtracting the magnetization value obtained from SQUID measurements at 4 kOe and K, is .
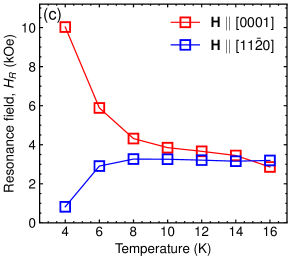
The temperature dependence of the uniaxial anisotropy is obtained from FMR signals at two orientations of the applied magnetic field: () and (). The temperature dependencies of for these two field orientations are shown in Fig. 5 (a). With increasing temperature the resonance fields monotonically approach the value corresponding to , characteristic of non-interacting Mn3+ ions, as shown by the temperature dependence of the effective -factor in the inset. This findings is consistent with the magnetic vs. data (Fig. 3), where deviations from the high-temperature trend occur at approximately the same temperature at which -factor starts to deviate from 2, indicating the onset of detectable ferromagnetic coupling among some Mn3+ ions.
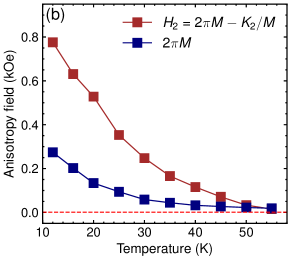
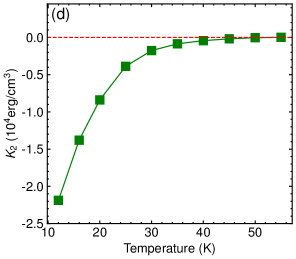
The temperature dependence of the effective anisotropy fields determined from the data presented in Fig. 5 (a) is shown in Fig. 5 (b), together with that of demagnetization fields obtained from SQUID measurements at kOe (Fig. 2 (b)). These two dependencies allow us to approximate the temperature behavior of the uniaxial magnetocrystalline energy density which is shown in Fig. 5 (d). As can be seen, is negative in accordance with the fact that the [0001] crystallographic axis ( axis) of GaN is the hard magnetization direction in (Ga,Mn)N. With increasing temperature the absolute value of decreases monotonically to zero.
Figure 5 (c) illustrates the temperature dependence of the resonance field obtained from numerical simulations. As in the experimental data, we analyze two configurations: H applied along the out-of-plane [0001] direction and the in-plane direction. The simulation results qualitatively reproduce the experimental trends shown in Fig. 5 (c), albeit in about four times narrower temperature range. However, the same pronounced anisotropy in is observed at low temperatures between the two directions, with the out-of-plane configuration exhibiting significantly larger resonance fields. This anisotropy gradually diminishes with increasing temperature, and converges to approximately the same value as observed in the experiment, about 3.3 kOe.
The low value of the uniaxial anisotropy constant as compared to those reported for various ferromagnetic transition metals showing room temperature ferromagnetism (e.g. Ref.[50] and references therein) is easily explained bearing in mind the rather moderate magnetic moment resulting both from the low Mn concentration as well as the partial quenching of the spin–orbit interaction (which is the main source of anisotropy in non-metallic ferromagnets) by the Jahn-Teller effect [74]. As the 4-th order terms in the magnetic free energy density are usually an order of magnitude weaker than the uniaxial terms, the lack of such anisotropy terms in the experimental data is not unexpected.
Interestingly, no influence of the static Jahn-Teller distortion on the dependence is observed, contrary to expectations. Specifically, no broadening of the FMR signals is detected along the cubic axes directions (detailed in the next Section). This result suggests a transition from a static Jahn-Teller effect, previously reported at 2 K [74], to a dynamic regime at K, where cubic distortion directions are averaged. This observation is intriguing and warrants further investigation.
III.4 FMR linewidth and relaxation in (Ga,Mn)N
The investigation of the FMR linewidth () can give valuable information on the relaxation rate of the magnetization as well as potential inhomogeneities of the studied system. is expressed as:
| (8) |
Here, the first term represents the contribution to originating from the intrinsic damping of the magnetization precession, while the second term takes into account the contribution related to magnetic and/or structural inhomogeneities in the system. is both frequency and angularly dependent and is given by [76]:
| (9) |
where is the Gilbert damping parameter. In the rotation plane it simplifies to [77]:
| (10) |
One should, therefore, expect minimum linewidths only for two magnetic field directions, since only for in-plane and out-of-plane orientations of . Instead, the angular dependence of the linewidth measured at 12 K and shown in Fig. 6 resembles that of (Fig. 4 (c)), with maximum and minimum values at and , respectively. Such a dependence is expected for inhomogeneous line broadening, arising from a distribution of magnetic moments and anisotropy fields within the sample, which can be expressed as [78]:
| (11) |
The fit of experimental data with Eqs.(8) and (11) presented by the solid line in Fig. 6 gives Oe and Oe. In the fit the angular dependence of is neglected. It is evident that the main contribution to the linewidth is due to intrinsic damping. The Gilbert parameter determined from is about 4 for H along [0001] at 12 K and does not differ much from the values found for typical ferromagnetic metals [50]. The reason for the untypically broad linewidth is the low value of magnetization [ emu/cm3, as indicated in Fig. 2 (b)], which enters in the denominator of Eq.(10). This explains also the unusually high value of the parameter = 0.68 as compared to typical values observed in diluted magnetic systems and metals [50, 79, 80].

The contribution of to the total linewidth at 12 K is at most 6%, despite the large value of the anisotropy field (=0.77 kOe). This results from the small ratio of 8.2%, which points to a rather homogeneous distribution of Mn ions in the sample.
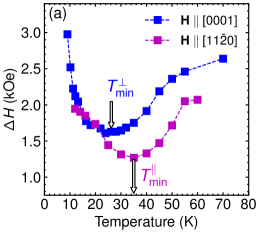
Fig. 7 (a) illustrates the temperature dependence of measured for applied along the out-of-plane [0001] and in-plane [110] directions. As shown, the linewidth narrows with increasing temperature in both configurations, reaching minimum values at approximately 26 K and 35 K, as marked in the figure. This narrowing is only partly due to decreasing anisotropy fields [shown in Fig. 5 (b)], but is mostly due to a reduction of the the Gilbert damping parameter with increasing temperature. The temperature dependence of extracted from the experimental data is presented in Fig. 7 (c) for in- and out-of-plane magnetic field directions. As can be seen, the damping parameter decreases monotonically with increasing temperature and is consistently greater for the magnetic field applied along the hard axis than for the in plane orientation. The anisotropy of contributes to the observed difference in the temperature dependencies of the in-plane and out-of-plane linewidths shown in Fig. 7 (a).
The sharp increase in linewidths above the minimum temperatures, up to about 55 K, is attributed to enhanced homogeneous damping associated with the decreasing magnetization of individual clusters, as described by Eq.(10). These clusters contain Mn3+ ions that remain sufficiently strongly coupled to produce a detectable FMR signal at temperatures well above 12 K, the Curie temperature of the film determined from direct magnetization measurements.
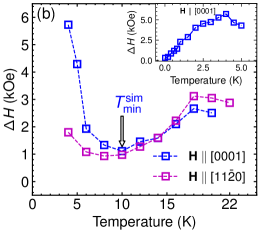
The observed trend in is typical for many ferromagnetic systems [77, 81, 82, 83]. The same trend is visible in Fig. 7 (b) which illustrates the temperature dependence of obtained from simulations. Similar to experimental observations a significant broadening of is noted at lower temperatures. As the temperature increases, narrows, reaching a minimum value of 1 kOe at approximately at 10 K denoted by . Upon further temperature increase, slightly broadens again, reaching a maximum at 18 K. Although the obtained values differ from the experimental ones, they are comparable if presented in reduced temperature .
IV Summary
In this study, we have thoroughly investigated the magnetic anisotropy and relaxation dynamics in percolating ferromagnetic semiconductor Ga1-xMnxN film with % using ferromagnetic resonance (FMR) and magnetometry. Our results confirm the ferromagnetic nature of the material, dominated by Mn3+ ions, which for this Mn dilution yields a clear ferromagnetic response below K.
While the FMR signal is absent at low temperatures ( K) due to excessive line broadening that prevents detection, the signal persists up to 70 K, revealing the presence of non-percolating FM clusters (macrospins) above . The temperature dependence of the signal intensity mirrors that of the magnetization up to 55 K, suggesting that the magnetic characteristics of the clusters remain relatively stable across this temperature range. Furthermore, the evolution of the FMR signal with temperature provides direct evidence of the progressive fragmentation of the percolating ferromagnetic network into isolated macrospins.
A crucial observation from our study is that while (Ga,Mn)N exhibits percolative ferromagnetism, it retains essential features of conventional ferromagnetic materials, particularly in its resonance behavior. The dominance of uniaxial anisotropy with the easy axis perpendicular to the -axis across the whole temperature range studied here confirms the dominant role of Mn3+ single ion magnetic anisotropy. Despite prior reports suggesting the possible influence of static Jahn-Teller distortions, our FMR results do not show evidence of such effects, implying a transition from a static to a dynamic Jahn-Teller regime at the temperatures studied here.
Our atomistic spin model simulations qualitatively reproduce the experimentally observed trends, providing further insights into the nature of ferromagnetic interactions in this dilute system. While the agreement between experiment and simulation is satisfactory, further refinements in modeling Mn-Mn interactions, especially in the presence of short-range disorder, are necessary for more accurate predictions. The combined use of SQUID and FMR techniques allows us to bridge the gap between static and dynamic magnetic properties, illustrating the complex yet highly informative nature of percolating ferromagnetic semiconductors.
In summary, our study confirms that FMR serves as a powerful complementary technique to magnetometry for probing the magnetic behavior of percolating ferromagnetic systems like (Ga,Mn)N. The persistence of FMR signals above highlights the role of non percolating ferromagnetic clusters. Our findings provide new insights into the interplay between magnetization dynamics, anisotropy, and percolation effects in (Ga,Mn)N, contributing to the broader understanding of percolating ferromagnetic systems and their potential relevance for spintronic applications, even well above .
V Acknowledgments
The work is supported by the National Science Centre (Poland) through project OPUS 2018/31/B/ST3/03438.
Appendix A Magnetometry details
The recorded signals from the (Ga,Mn)N films are weak, below 10-6 emu at remanence, and significantly smaller than the signals from the substrate at high magnetic fields [84]. The samples are measured both in perpendicular and in-plane orientations, i. e. with or , respectively.
The magnetothermal properties are examined in weak static magnetic fields using standard field-cooled (FC) and thermo-remanent magnetization (TRM) procedures. Special care is taken to ensure an extremely weak residual magnetic field (estimated to be approximately 0.15 Oe) during the TRM measurements. To achieve this condition, the entire system, including the sample, is degaussed at 300 K prior to the TRM measurements by applying an oscillating magnetic field gradually reduced to zero. Subsequently, the sample is field cooled from 300 to 2 K. We underline here that the near-zero field conditions at the base temperature, K, are established by a soft quench of the MPMS’s superconducting magnet. This procedure is carried out using the magnet reset option of the MPMS-XL system.
In this respect (Ga,Mn)N and other strongly dilute compounds in which randonly distributed magnetic species are coupled by a short range interaction constitute a class on their own, for which the correct methodology of determination is yet to be firmly established. Earlier studies of criticality in (Ga,Mn)N showed that all the traditional magnetometric approaches, such as the temperature dependence of: AC-susceptibility, the inverse of the static susceptibility, disappearance of the coercive field , as well as of the thermoremnant magnetization give nearly the same values of the critical temperature [21, 22]. Some small discrepancies among these values are caused by a smeared character of the Curie transition in dilute systems, either due to the formation of magnetic clusters [85] or to the presence of a nonzero variance in the Mn distribution [21].
Appendix B Simulation details
In this Appendix, we provide detailed descriptions of the numerical simulation methodology outlined in the main text, including the complete Hamiltonian, the equations of motion, and the parameter values used in the simulations. The experimental results are modeled in the frame of an atomistic spin model [46] supplemented with stochastic Landau-Lifshitz-Gilbert (sLLG) equation. We use a simulation box of about 25 × 25 × 5 nm3 consisting of approximately 124820 wurtzite lattice cation sites on which the dynamics of 9860 randomly distributed Mn spins () is simulated. In-plane periodic boundary conditions are implemented to model a large thin film. We follow the procedure presented in [36].
We use the following Hamiltonian:
| (12) |
which consists of the Zeeman energy, magnetocrystalline energy and ferromagnetic superexchange interaction between Mn ions. Here, describes the normalized local magnetic moment of Mn ion located at site with magnitude , where , and is the Bohr magneton. The magnetocrystalline energy is composed of trigonal and Jahn-Teller anisotropies [47, 36], with , , . Finally, the Mn ions are coupled through a ferromagnetic superexchange interaction of Heisenberg form. We take into account interactions up to the nearest neighbors approximated by , with being the distance between ions and .
To calculate the magnetization as a function of external magnetic field at a nonzero temperature we initialize the system at a high magnetic field in a completely random spin state. The spin system evolves according to the sLLG equation [47, 36].
| (13) |
where and are the gyromagnetic ratio and the precession damping term, respectively. The total effective magnetic field acting on -th spin consists of the Zeeman, exchange and anisotropy field and the thermal field ([86, 46, 87]. Here represents thermal fluctuations (a nonzero temperature) in the system and is modeled as random magnetic field generated in every sLLG iteration according to:
| (14) |
where is a 3D Gaussian random vector with a standard deviation of 1 and mean of zero, and ns is the integration time step. The simulation is advanced over time and is computed after the system has reached a steady state. This steady-state spin configuration then serves as the initial condition for the subsequent simulation step with a slightly reduced . The iterative reduction of and corresponding steady-state measurements enable us to construct a detailed curve.
All the numerical results presented in this study are obtained with meV, Å, = 0.05 meV/atom, = 0.75 meV/atom, and .
To calculate the temperature dependence of we initialize at K the same numerical box with all the spins aligned in the easy plane, that is perpendicular to -axis. To reproduce the TRM data, a very weak field Oe is set along the direction of the spins. However, for this simulation, we use a Monte Carlo approach to thermally equilibrate the spins. The system is iterated with a sufficient number of Monte Carlo steps per site (MCS/site) [60], where for each MCS, a trial spin orientation change is proposed, and the change in energy is calculated. The trial move is accepted or rejected based on the Metropolis criterion. The system is considered to have reached equilibrium once the magnetization stabilizes, showing no significant fluctuations. After determining the resulting , the simulation proceeds with the temperature increment, at which the previous spin configuration is taken as the starting one. The procedure is repeated until the full curve is established [61].

To model FMR, we add a sinusoidal magnetic field () with a frequency GHz to the external field ensuring that [62]. First, we start with a completely random spin orientation and a very high magnetic field kOe. The system is allowed to evolve within the sLLG frame until it reaches a steady state, at which we calculate the microwave power absorbed during FMR: , where is the number of Mn ions and is simulation time [62]. Next, this steady-state spin configuration is used as the initial condition for the next simulation step, in which the external field is slightly reduced. This process is repeated iteratively, until reaches zero. Exemplary simulation data are depicted in Fig. 8 by open symbols.
The resonance field and the line-width of the simulated FMR are determined at the given by fitting the collision-broadened Lorentzian line-shape function [88]:
| (15) |
to the modeled . A result of such a fit is represented by solid line in Fig. 8. The entire process is repeated for temperatures ranging from 2 to 22 K.
Technically, in the sLLG simulations, the code is parallelized by dividing the simulation region into sections, with each processor handling a specific part of the system. Computations are accelerated using graphics processing units (GPUs), and Euler’s method is employed as the integration scheme. Since a higher temperature introduces more disturbance in the system, the initialization and averaging steps of the sLLG simulations are adjusted as specified in table 1.
| Temperature | Number of | Number of |
|---|---|---|
| (K) | initialization steps | averaging steps |
| 0.01 to 0.40 | ||
| 0.60 | ||
| 0.80 to 1.00 | ||
| 1.50 | ||
| 2.00 | ||
| 2.50 | ||
| 3.00 to 3.50 | ||
| 4 to 22 |
References
- Ohno [1998] H. Ohno, Making nonmagnetic semiconductors ferromagnetic, Science 281, 951 (1998).
- Dietl et al. [2000] T. Dietl, H. Ohno, F. Matsukura, J. Cibert, and D. Ferrand, Zener model description of ferromagnetism in zinc-blende magnetic semiconductors, Science 287, 1019 (2000).
- Pearton et al. [2003] S. Pearton, C. Abernathy, D. Norton, A. Hebard, Y. Park, L. Boatner, and J. Budai, Advances in wide bandgap materials for semiconductor spintronics, Mater. Sci. Eng. R. 40, 137 (2003).
- Dietl et al. [2001] T. Dietl, H. Ohno, and F. Matsukura, Hole-mediated ferromagnetism in tetrahedrally coordinated semiconductors, Phys. Rev. B 63, 195205 (2001).
- Dietl et al. [2015] T. Dietl, K. Sato, T. Fukushima, A. Bonanni, M. Jamet, A. Barski, S. Kuroda, M. Tanaka, P. N. Hai, and H. Katayama-Yoshida, Spinodal nanodecomposition in semiconductors doped with transition metals, Rev. Mod. Phys. 87, 1311 (2015).
- Iwinska et al. [2019] M. Iwinska, M. Zajac, B. Lucznik, M. Fijalkowski, M. Amilusik, T. Sochacki, E. Litwin-Staszewska, R. Piotrzkowski, I. Grzegory, and M. Bockowski, Iron and manganese as dopants used in the crystallization of highly resistive HVPE-GaN on native seeds, Jpn. J. Appl. Phys. 58, SC1047 (2019).
- Bonanni et al. [2011] A. Bonanni, M. Sawicki, T. Devillers, W. Stefanowicz, B. Faina, Tian Li, T. E. Winkler, D. Sztenkiel, A. Navarro-Quezada, M. Rovezzi, R. Jakieła, A. Grois, M. Wegscheider, W. Jantsch, J. Suffczyński, F. D’Acapito, A. Meingast, G. Kothleitner, and T. Dietl, Experimental probing of exchange interactions between localized spins in the dilute magnetic insulator (Ga,Mn)N, Phys. Rev. B 84, 035206 (2011).
- Yamamoto et al. [2013] T. Yamamoto, H. Sazawa, N. Nishikawa, M. Kiuchi, T. Ide, M. Shimizu, T. Inoue, and M. Hata, Reduction in buffer leakage current with Mn-doped GaN buffer layer grown by metal organic chemical vapor deposition, Jpn. J. Appl. Phys. 52, 08JN12 (2013).
- Janicki et al. [2017] L. Janicki, G. Kunert, M. Sawicki, E. Piskorska-Hommel, K. Gas, R. Jakiela, D. Hommel, and R. Kudrawiec, Fermi level and bands offsets determination in insulating (Ga,Mn)N/GaN structures, Sci. Rep. 7, 41877 (2017).
- Kreissl et al. [1996] J. Kreissl, W. Ulrici, M. El-Metoui, A. -M. Vasson, A. Vasson, and A. Gavaix, Neutral manganese acceptor in GaP: An electron-paramagnetic-resonance study, Phys. Rev. B 54, 10508 (1996).
- Dietl [2008a] T. Dietl, Origin and control of ferromagnetism in dilute magnetic semiconductors and oxides (invited), J. Appl. Phys. 103, 07D111 (2008a).
- Blinowski et al. [1996] J. Blinowski, P. Kacman, and J. A. Majewski, Ferromagnetic superexchange in Cr-based diluted magnetic semiconductors, Phys. Rev. B 53, 9524 (1996).
- Sawicki et al. [2012] M. Sawicki, T. Devillers, S. Gałęski, C. Simserides, S. Dobkowska, B. Faina, A. Grois, A. Navarro-Quezada, K. N. Trohidou, J. A. Majewski, T. Dietl, and A. Bonanni, Origin of low-temperature magnetic ordering in Ga1-xMnxN, Phys. Rev. B 85, 205204 (2012).
- Śliwa and Dietl [2024] C. Śliwa and T. Dietl, Tight-binding theory of spin-spin interactions, Curie temperatures, and quantum hall effects in topological (Hg,Cr)Te in comparison to nontopological (Zn,Cr)Te and (Ga,Mn)N, Phys. Rev. B 110, 165201 (2024).
- Piskorska-Hommel and Gas [2024] E. Piskorska-Hommel and K. Gas, (Ga,Mn)N—Epitaxial growth, structural, and magnetic characterization—Tutorial, J. Appl. Phys. 135, 071101 (2024).
- I. Ya. Korenblit et al. [1973] I. Ya. Korenblit, E. F. Shender, and B. I. Shklovsky, Percolation approach to the phase transition in the very dilute ferromagnetic alloys, Phys. Lett. A 46, 275 (1973).
- Bergqvist et al. [2004] L. Bergqvist, O. Eriksson, J. Kudrnovský, V. Drchal, P. Korzhavyi, and I. Turek, Magnetic percolation in diluted magnetic semiconductors, Phys. Rev. Lett. 93, 137202 (2004).
- Bonanni et al. [2021] A. Bonanni, T. Dietl, and H. Ohno, Dilute magnetic materials, in Handbook on Magnetism and Magnetic Materials, edited by J. M. D. Coey and S. S. P. Parkin (Springer, Berlin, 2021).
- Sarigiannidou et al. [2006] E. Sarigiannidou, F. Wilhelm, E. Monroy, R. M. Galera, E. Bellet-Amalric, A. Rogalev, J. Goulon, J. Cibert, and H. Mariette, Intrinsic ferromagnetism in wurtzite (Ga,Mn)N semiconductor, Phys. Rev. B 74, 041306(R) (2006).
- Kunert et al. [2012] G. Kunert, S. Dobkowska, Tian Li, H. Reuther, C. Kruse, S. Figge, R. Jakiela, A. Bonanni, J. Grenzer, W. Stefanowicz, J. von Borany, M. Sawicki, T. Dietl, and D. Hommel, Ga1-xMnxN epitaxial films with high magnetization, Appl. Phys. Lett. 101, 022413 (2012).
- Stefanowicz et al. [2013] S. Stefanowicz, G. Kunert, C. Simserides, J. A. Majewski, W. Stefanowicz, C. Kruse, S. Figge, Tian Li, R. Jakieła, K. N. Trohidou, A. Bonanni, D. Hommel, M. Sawicki, and T. Dietl, Phase diagram and critical behavior of a random ferromagnet Ga1-xMnxN, Phys. Rev. B 88, 081201(R) (2013).
- Gas et al. [2018] K. Gas, J. Z. Domagala, R. Jakiela, G. Kunert, P. Dluzewski, E. Piskorska-Hommel, W. Paszkowicz, D. Sztenkiel, M. J. Winiarski, D. Kowalska, R. Szukiewicz, T. Baraniecki, A. Miszczuk, D. Hommel, and M. Sawicki, Impact of substrate temperature on magnetic properties of plasma-assisted molecular beam epitaxy grown (Ga,Mn)N, J. Alloys Compd 747, 946 (2018).
- Sawicki [2006] M. Sawicki, Magnetic properties of (Ga,Mn)As, J. Magn. Magn. Mater 300, 1 (2006).
- Jungwirth et al. [2005a] T. Jungwirth, J. Mašek, K. Y. Wang, K. W. Edmonds, M. Sawicki, M. Polini, J. Sinova, A. H. MacDonald, R. P. Campion, L. X. Zhao, N. R. S. Farley, T. K. Johal, G. van der Laan, C. T. Foxon, and B. L. Gallagher, Low-temperature magnetization of (Ga,Mn)As semiconductors, Phys. Rev. B 73, 165205 (2005a).
- Jungwirth et al. [2005b] T. Jungwirth, K. Y. Wang, J. Mašek, K. W. Edmonds, J. König, J. Sinova, M. Polini, N. A. Goncharuk, A. H. MacDonald, M. Sawicki, R. P. Campion, L. X. Zhao, C. T. Foxon, and B. L. Gallagher, Prospects for high temperature ferromagnetism in (Ga,Mn)As semiconductors, Phys. Rev. B 72, 165204 (2005b).
- Sadowski et al. [2017] J. Sadowski, S. Kret, A. Šiušys, T. Wojciechowski, K. Gas, M. F. Islam, C. M. Canali, and M. Sawicki, Wurtzite (Ga,Mn)As nanowire shells with ferromagnetic properties, Nanoscale 9, 2129 (2017).
- Gluba et al. [2018] L. Gluba, O. Yastrubchak, J. Z. Domagala, R. Jakiela, T. Andrearczyk, J. Żuk, T. Wosinski, J. Sadowski, and M. Sawicki, Band structure evolution and the origin of magnetism in (Ga,Mn)As: From paramagnetic through superparamagnetic to ferromagnetic phase, Phys. Rev. B 97, 115201 (2018).
- Sawicki et al. [2010] M. Sawicki, D. Chiba, A. Korbecka, Y. Nishitani, J. A. Majewski, F. Matsukura, T. Dietl, and H. Ohno, Experimental probing of the interplay between ferromagnetism and localization in (Ga,Mn)As, Nat. Phys. 6, 22 (2010).
- Proselkov et al. [2012] O. Proselkov, D. Sztenkiel, W. Stefanowicz, M. Aleszkiewicz, J. Sadowski, T. Dietl, and M. Sawicki, Thickness dependent magnetic properties of (Ga,Mn)As ultrathin films, Appl. Phys. Lett. 100, 262405 (2012).
- Chen et al. [2015] L. Chen, F. Matsukura, and H. Ohno, Electric-field modulation of damping constant in a ferromagnetic semiconductor (Ga,Mn)As, Phys. Rev. Lett. 115, 057204 (2015).
- Dietl [2008b] T. Dietl, Interplay between carrier localization and magnetism in diluted magnetic and ferromagnetic semiconductors, J. Phys. Soc. Jpn. 77, 031005 (2008b).
- Mayer et al. [2010] M. A. Mayer, P. R. Stone, N. Miller, H. M. Smith, O. D. Dubon, E. E. Haller, K. M. Yu, W. Walukiewicz, X. Liu, and J. K. Furdyna, Electronic structure of Ga1-xMnxAs analyzed according to hole-concentration-dependent measurements, Phys. Rev. B 81, 045205 (2010).
- Richardella et al. [2010] A. Richardella, P. Roushan, S. Mack, B. Zhou, D. A. Huse, D. D. Awschalom, and A. Yazdani, Visualizing critical correlations near the metal-insulator transition in Ga1-xMnxAs, Science 327, 665 (2010).
- Gosk et al. [2005] J. Gosk, M. Zajac, A. Wolos, M. Kaminska, A. Twardowski, I. Grzegory, M. Bockowski, and S. Porowski, Magnetic anisotropy of bulk GaN:Mn single crystals codoped with Mg acceptors, Phys. Rev. B 71, 094432 (2005).
- Das et al. [2024] K. Das, N. G. Szwacki, R. Hayn, and D. Sztenkiel, Jahn-Teller effect and pair anisotropy in wurtzite Ga1-xMnxN 10.48550/ARXIV.2410.22035 (2024).
- Sztenkiel et al. [2025] D. Sztenkiel, K. Gas, N. G. Szwacki, M. Foltyn, C. Śliwa, T. Wojciechowski, J. Domagala, D. Hommel, M. Sawicki, and T. Dietl, Electric field manipulation of magnetization in an insulating dilute ferromagnet through piezoelectromagnetic coupling, Commun. Mater. 6, 16 (2025).
- Graf et al. [2002] T. Graf, M. Gjukic, M. S. Brandt, M. Stutzmann, and O. Ambacher, The Mn3+/2+ acceptor level in group III nitrides, Appl. Phys. Lett. 81, 5159 (2002).
- Wolos et al. [2004a] A. Wolos, M. Palczewska, M. Zajac, J. Gosk, M. Kaminska, A. Twardowski, M. Bockowski, I. Grzegory, and S. Porowski, Optical and magnetic properties of Mn in bulk GaN, Phys. Rev. B 69, 115210 (2004a).
- Wolos et al. [2004b] A. Wolos, A. Wysmolek, M. Kaminska, A. Twardowski, M. Bockowski, I. Grzegory, S. Porowski, and M. Potemski, Neutral Mn acceptor in bulk GaN in high magnetic fields, Phys. Rev. B 70, 245202 (2004b).
- Vallin et al. [1970] J. T. Vallin, G. A. Slack, S. Roberts, and A. E. Hughes, Infrared absorption in some II-VI compounds doped with Cr, Phys. Rev. B 2, 4313 (1970).
- Vallin and Watkins [1974] J. T. Vallin and G. D. Watkins, EPR of Cr2+ in II-VI lattices, Phys. Rev. B 9, 2051 (1974).
- Herbich et al. [1998] M. Herbich, W. Mac, A. Twardowski, K. Ando, Y. Shapira, and M. Demianiuk, Magnetization and exciton spectroscopy of the diluted magnetic semiconductor , Phys. Rev. B. 58, 1912 (1998).
- Stefanowicz et al. [2010] W. Stefanowicz, D. Sztenkiel, B. Faina, A. Grois, M. Rovezzi, T. Devillers, F. d’Acapito, A. Navarro-Quezada, Tian Li, R. Jakieła, M. Sawicki, T. Dietl, and A. Bonanni, Structural and paramagnetic properties of dilute Ga1-xMnxN, Phys. Rev. B 81, 235210 (2010).
- Sztenkiel et al. [2016] D. Sztenkiel, M. Foltyn, G. P. Mazur, R. Adhikari, K. Kosiel, K. Gas, M. Zgirski, R. Kruszka, R. Jakiela, Tian Li, A. Piotrowska, A. Bonanni, M. Sawicki, and T. Dietl, Stretching magnetism with an electric field in a nitride semiconductor, Nat. Commun 7, 13232 (2016).
- Sztenkiel et al. [2020] D. Sztenkiel, K. Gas, J. Domagala, D. Hommel, and M. Sawicki, Crystal field model simulations of magnetic response of pairs, triplets and quartets of Mn3+ ions in GaN, New. J. Phys. 22, 123016 (2020).
- Evans et al. [2014] R. F. L. Evans, W. J. Fan, P. Chureemart, T. A. Ostler, M. O. A. Ellis, and R. W. Chantrell, Atomistic spin model simulations of magnetic nanomaterials, J. Phys.: Condens. Matt. 26, 103202 (2014).
- Edathumkandy and Sztenkiel [2022] Y. K. Edathumkandy and D. Sztenkiel, Comparative study of magnetic properties of Mn3+ magnetic clusters in GaN using classical and quantum mechanical approach, J. Magn. Magn. Mater. 562, 169738 (2022).
- Nakayama et al. [2013] H. Nakayama, M. Althammer, Y.-T. Chen, K. Uchida, Y. Kajiwara, D. Kikuchi, T. Ohtani, S. Geprägs, M. Opel, S. Takahashi, R. Gross, G. E. W. Bauer, S. T. B. Goennenwein, and E. Saitoh, Spin Hall magnetoresistance induced by a nonequilibrium proximity effect, Phys. Rev. Lett. 110, 206601 (2013).
- Mendoza-Rodarte et al. [2024] J. A. Mendoza-Rodarte, K. Gas, M. Herrera-Zaldívar, D. Hommel, M. Sawicki, and M. H. D. Guimarães, Spin Hall magnetoresistance in Pt/(Ga,Mn)N devices, Appl. Phys. Lett. 125, 152404 (2024).
- Farle [1998] M. Farle, Ferromagnetic resonance of ultrathin metallic layers, Rep. Prog. Phys. 61, 755 (1998).
- Liu et al. [2003] X. Liu, Y. Sasaki, and J. K. Furdyna, Ferromagnetic resonance in Ga1-xMnxAs: Effects of magnetic anisotropy, Phys. Rev. B 67, 205204 (2003).
- Sasaki et al. [2002] Y. Sasaki, X. Liu, J. K. Furdyna, M. Palczewska, J. Szczytko, and A. Twardowski, Ferromagnetic resonance in GaMnAs, J. Appl. Phys. 91, 7484 (2002).
- Zhou et al. [2009] Y. Y. Zhou, X. Liu, J. K. Furdyna, M. A. Scarpulla, and O. D. Dubon, Ferromagnetic resonance investigation of magnetic anisotropy in Ga1-xMnxAs synthesized by ion implantation and pulsed laser melting, Phys. Rev. B. 80, 224403 (2009).
- Bihler et al. [2007] C. Bihler, M. Kraus, H. Huebl, M. S. Brandt, S. T. B. Goennenwein, M. Opel, M. A. Scarpulla, P. R. Stone, R. Farshchi, and O. D. Dubon, Magnetocrystalline anisotropy and magnetization reversal in Ga1-xMnxP synthesized by ion implantation and pulsed-laser melting, Phys. Rev. B 75, 214419 (2007).
- et al. [2025] K. G. et al., Magnetic anisotropy of paramagnetic Mn3+ in GaN (2025), manuscript in preparation.
- Sawicki et al. [2011] M. Sawicki, W. Stefanowicz, and A. Ney, Sensitive SQUID magnetometry for studying nanomagnetism, Semicon. Sci. Technol. 26, 064006 (2011).
- Pereira et al. [2011] L. M. C. Pereira, J. P. Araújo, M. J. V. Bael, K. Temst, and A. Vantomme, Practical limits for detection of ferromagnetism using highly sensitive magnetometry techniques, J. Phys. D: Appl. Phys 44, 215001 (2011).
- Gas and Sawicki [2019] K. Gas and M. Sawicki, In situ compensation method for high-precision and high-sensitivity integral magnetometry, Meas. Sci. Technol 30, 085003 (2019).
- Gas and Sawicki [2022] K. Gas and M. Sawicki, A simplified method of the assessment of magnetic anisotropy of commonly used sapphire substrates in SQUID magnetometers, Materials 15, 10.3390/ma15238532 (2022).
- Zhang et al. [2021] Y. Zhang, B. Wang, Y. Guo, Q. Li, and J. Wang, A universal framework for metropolis Monte Carlo simulation of magnetic Curie temperature, Comput. Mater. Sci. 197, 110638 (2021).
- Prudnikov et al. [2016] V. V. Prudnikov, P. V. Prudnikov, and D. E. Romanovskiy, Monte Carlo simulation of magnetic multilayered structures with giant magnetoresistance effects, J. Phys. Conf. Ser. 681, 012016 (2016).
- Usadel [2006] K. D. Usadel, Temperature-dependent dynamical behavior of nanoparticles as probed by ferromagnetic resonance using Landau-Lifshitz-Gilbert dynamics in a classical spin model, Phys. Rev. B. 73, 212405 (2006).
- Fabian et al. [2013] K. Fabian, V. P. Shcherbakov, and S. A. McEnroe, Measuring the curie temperature, Geochemistry, Geophysics, Geosystems. 14, 947 (2013).
- Wang et al. [2013] M. Wang, K. W. Edmonds, B. L. Gallagher, A. W. Rushforth, O. Makarovsky, A. Patané, R. P. Campion, C. T. Foxon, V. Novak, and T. Jungwirth, High Curie temperatures at low compensation in the ferromagnetic semiconductor (Ga,Mn)As, Phys. Rev. B 87, 121301 (2013).
- Gas et al. [2021a] K. Gas, A. Królicka, K. Dybko, P. Nowicki, Z. Khosravizadeh, T. Story, and M. Sawicki, Magnetic constitution of topologically trivial thermoelectric PbTe:Cr, J. Magn. Magn. Mater. 537, 168154 (2021a).
- Kalbarczyk et al. [2019] K. Kalbarczyk, K. Dybko, K. Gas, D. Sztenkiel, M. Foltyn, M. Majewicz, P. Nowicki, E. Łusakowska, D. Hommel, and M. Sawicki, Electrical characteristics of vertical-geometry Schottky junction to magnetic insulator (Ga,Mn)N heteroepitaxially grown on sapphire, Journal of Alloys and Compounds 804, 415 (2019).
- Sztenkiel [2023] D. Sztenkiel, Spin orbital reorientation transitions induced by magnetic field, Journal of Magnetism and Magnetic Materials 572, 170644 (2023).
- Stone et al. [2006] P. R. Stone, M. A. Scarpulla, R. Farshchi, I. D. Sharp, E. E. Haller, O. D. Dubon, K. M. Yu, J. W. Beeman, E. Arenholz, J. D. Denlinger, and H. Ohldag, Mn L3,2 x-ray absorption and magnetic circular dichroism in ferromagnetic Ga1-xMnxP, Appl. Phys. Lett. 89, 012504 (2006).
- Bhatt [1986] R. N. Bhatt, Magnetic properties of doped semiconductors, Phys. Scr., T14, 7 (1986).
- Anderson et al. [1986] J. R. Anderson, M. Górska, L. J. Azevedo, and E. L. Venturini, Magnetization of Te, Phys. Rev. B 33, 4706 (1986).
- Bhatt and Lee [1982] R. N. Bhatt and P. A. Lee, Scaling studies of highly disordered spin-1/2 antiferromagnetic systems, Phys. Rev. Lett. 48, 344 (1982).
- Dietl [1987] T. Dietl, Localization and magnetic interactions in semimagnetic semiconductors at low temperatures, Jpn. J. Appl. Phys. 26, 1907 (1987).
- Sawicki et al. [2013] M. Sawicki, E. Guziewicz, M. I. Łukasiewicz, O. Proselkov, I. A. Kowalik, W. Lisowski, P. Dluzewski, A. Wittlin, M. Jaworski, A. Wolska, W. Paszkowicz, R. Jakiela, B. S. Witkowski, L. Wachnicki, M. T. Klepka, F. J. Luque, D. Arvanitis, J. W. Sobczak, M. Krawczyk, A. Jablonski, W. Stefanowicz, D. Sztenkiel, M. Godlewski, and T. Dietl, Homogeneous and heterogeneous magnetism in (Zn,Co)O: From a random antiferromagnet to a dipolar superferromagnet by changing the growth temperature, Phys. Rev. B 88, 085204 (2013).
- Wolos et al. [2004c] A. Wolos, A. Wysmolek, M. Kaminska, A. Twardowski, M. Bockowski, I. Grzegory, S. Porowski, and M. Potemski, Neutral Mn acceptor in bulk GaN in high magnetic fields, Phys. Rev. B 70, 245202 (2004c).
- Smit and Beljers [1955] J. Smit and H. G. Beljers, Philips Res. Rep. 10, 113 (1955).
- Suhl [1955] H. Suhl, Ferromagnetic resonance in nickel ferrite between one and two kilomegacycles, Phys. Rev. 97, 555 (1955).
- Platow et al. [1998] W. Platow, A. N. Anisimov, G. L. Dunifer, M. Farle, and K. Baberschke, Correlations between ferromagnetic-resonance linewidths and sample quality in the study of metallic ultrathin films, Phys. Rev. B 58, 5611 (1998).
- Chappert et al. [1986] C. Chappert, K. L. Dang, P. Beauvillain, H. Hurdequint, and D. Renard, Ferromagnetic resonance studies of very thin cobalt films on a gold substrate, Phys. Rev. B 34, 3192 (1986).
- Sinova et al. [2004] J. Sinova, T. Jungwirth, X. Liu, Y. Sasaki, J. K. Furdyna, W. A. Atkinson, and A. H. MacDonald, Magnetization relaxation in (Ga,Mn)As ferromagnetic semiconductors, Phys. Rev. B 69, 085209 (2004).
- Matsuda et al. [2006] Y. Matsuda, A. Oiwa, K. Tanaka, and H. Munekata, Ferromagnetic resonance study of magnetization relaxation in GaMnAs, Physica B. 376-377, 668 (2006), proceedings of the 23rd International Conference on Defects in Semiconductors.
- Li et al. [1990] Y. Li, M. Farle, and K. Baberschke, Critical spin fluctuations and curie temperatures of ultrathin Ni(111)/W(110): A magnetic-resonance study in ultrahigh vacuum, Phys. Rev. B 41, 9596 (1990).
- Kötzler and von Philipsborn [1978] J. Kötzler and H. von Philipsborn, Critical speeding-up of spin-relaxation in CdCr2Se4, Phys. Rev. Lett. 40, 790 (1978).
- Spörel and Biller [1975] F. Spörel and E. Biller, Electron spin resonance in nickel near , Solid State Commun. 17, 833 (1975).
- Gas et al. [2021b] K. Gas, G. Kunert, P. Dluzewski, R. Jakiela, D. Hommel, and M. Sawicki, Improved-sensitivity integral SQUID magnetometry of (Ga,Mn)N thin films in proximity to Mg-doped GaN, J. Alloys Compd 868, 159119 (2021b).
- Griffiths [1969] R. B. Griffiths, Nonanalytic behavior above the critical point in a random Ising ferromagnet, Phys. Rev. Lett. 23, 17 (1969).
- Skubic et al. [2008] B. Skubic, J. Hellsvik, L. Nordstróm, and O. Eriksson, A method for atomistic spin dynamics simulations: implementation and examples, J. Phys.: Condens. Matt. 20, 315203 (2008).
- Evans et al. [2015] R. F. L. Evans, U. Atxitia, and R. W. Chantrell, Quantitative simulation of temperature-dependent magnetization dynamics and equilibrium properties of elemental ferromagnets, Phys. Rev. B 91, 144425 (2015).
- Van Vleck and Weisskopf [1945] J. H. Van Vleck and V. F. Weisskopf, On the shape of collision-broadened lines, Rev. Mod. Phys. 17, 227 (1945).