Reconstructing the shape of the non-linear matter power spectrum using CMB lensing and cosmic shear
Abstract
We reconstruct the non-linear matter power spectrum using a joint analysis of gravitational lensing of the cosmic microwave background (CMB) and lensing of galaxies. This reconstruction is motivated by the tension between early-universe CMB predictions and late-time observables. We use CMB lensing data from the Atacama Cosmology Telescope DR6 and cosmic shear data from the Dark Energy Survey (DES) Y3 release to perform a gravity-only (i.e. no baryonic feedback) fit to in bins of wave-number, within . We find that with DES cosmic shear data alone, departs from the early-universe CMB prediction on all scales. The joint fit with CMB lensing is consistent on large scales but shows a deviation from scale-independence when extending to . We compare our agnostic reconstruction to baryonic feedback models and non-standard dark matter models: reasonable variations of both scenarios can recover the shape and amplitude of the suppression. We discuss the advances needed to disentangle these physical effects with a full mapping of .
I Introduction
Measurements of anisotropies in the cosmic microwave background (CMB) are remarkably well fit by the standard model of cosmology with a cosmological constant and cold dark matter (CDM) component. While these measurements probe the recombination epoch ( yr), the fit to this model can be extrapolated to late times to provide predictions for the growth of structure, and for the amplitude of the matter power spectrum at the present day. In the last decade, comparisons of the predictions based on the CMB as seen by the Planck satellite [1] have given mixed results when compared to a variety of late-time probes of the growth of structure.
The formation of inhomogeneities in the distribution of matter can be quantified by the parameter , which is the root-mean-square variation in the matter field on scales of Mpc extrapolated to the present day. A related parameter is the combination , chosen due to the degeneracy between the matter density and in observations of gravitational weak lensing. Anisotropies in the primary CMB measured by the Planck satellite provide a precise prediction through the model of [1]. Meanwhile, measurements of distortions in galaxy shapes (i.e. galaxy weak lensing or cosmic shear) prefer , , and for the Kilo-Degree Survey (KiDS-1000) [2], Dark Energy Survey [3], and the Hyper Suprime-Cam [4], respectively. This discrepancy between measurements is known as the tension. A similar tension has been observed in several other astrophysical observables such as peculiar velocity measurements and the Lyman- forest [5, 6, 7]. Intriguingly, measurements of the lensing of the CMB are in strong agreement with the CMB prediction (e.g. [8, 9, 10, 11]).
While many of the probes above disagree on their inference of , it should be noted that they do so while probing somewhat different length scales and redshifts. The observed data is fit to a model, usually a close variant of CDM, to then extrapolate the amplitude of the matter power spectrum on scales of and at the present day. For this reason, the tension could point to erroneous assumptions in our modeling choices. For example, the tension can be reduced when introducing a scale-dependent suppression in the matter power spectrum. Such solutions are numerous, and deviations from CDM can arise in various ways. In the non-relativistic regime, the growth of CDM perturbations in linear theory is well described by a damped harmonic oscillator such that
| (1) |
where is the Hubble expansion rate, is the mean matter density, and is the density contrast. Scale-dependent growth in the linear regime can arise from the modification of any of the underlined terms.
Damping term: The rate of expansion of the Universe dampens the growth of perturbations. Late-time modifications in this rate can lead to scale-dependence in the evolution of . For instance, kinematic couplings of dark matter to dark energy introduce such a correction to the dampening term and have been suggested as a potential solution to the tension [12, 13, 14]. A similar phenomenon occurs when dark matter couples to dark radiation [15].
Mass term: Cosmological components with a repulsive self-interaction or a non-zero pressure have a sound speed (or in some cases an effective sound speed if the pressure is due to high particle velocity or wave effects) that leads to a Jeans instability. Above a certain distance, known as the Jeans length, the repulsive forces that overcome gravitational clustering are suppressed. This manifests as a scale-dependent growth of perturbations. Many solutions to the tension exhibiting this behavior are particularly well-motivated by particle physics and include ultralight axions, warm dark matter, self-interacting dark matter, and atomic dark matter [16, 17, 18, 6]. Since the mass term above is obtained by using Poisson’s equation, modifications to the force of gravity can also introduce scale-dependence. In the case of modified gravity, the mass term can often be modeled with an effective gravitational constant that can be a function of scale [19].
Source term: The source term can be modified if there is a mechanism for dark matter to exchange energy with another component. An example of such models with regards to the tension is interacting dark energy [20].
There is also the possibility of having all terms in Eq. (1) by modified. This can happen if the overall growth of the perturbations (the time component of ) is assumed to differ from the General Relativity (GR) prediction. A useful approximation to search for time-dependent rather than scale-dependent deviations in GR is to treat the differential growth rate as a power law based on the matter density. This model is parameterized as , where the GR prediction lies at [21, 22]. Redshift-dependent deviations in the growth rate of matter perturbations have been proposed to reconcile high redshift and low redshift probes [5]. Aside from GR extensions, these include models of dynamical dark energy and some interacting dark sectors.
Baryonic feedback processes, which are still not very well understood, have a confounding effect with observational evidence for new non-standard forms of dark matter. These affect the late-time clustering of matter on small scales; enhanced feedback (beyond what is usually considered in cosmological simulations) can alleviate the tension between galaxy weak lensing and the CMB [23]. Studies of the gas profiles of galaxy groups with the kinematic Sunyaev-Zel’dovich effect also favor higher levels of baryonic feedback [24, 25, 26]. A combination of X-ray, weak lensing, and kinematic Sunyaev-Zel’dovich data suggests baryonic feedback may be higher than found in simulations but not sufficiently to resolve the tension on its own [27].
There have been several past efforts to reconstruct the matter power spectrum as a function of redshift and scale, given its usefulness in diagnosing discrepancies between data-sets beyond just the parameter. Among them, the matrix-based approach of Ref. [28] has been adapted to the Lyman- forest [29] and weak lensing [30]. A double-power law reconstruction of was used in Ref. [31], which compresses all the -dependence into an amplitude and tilt (but also assumes a power-law in the redshift-dependent scale factor). Ref. [23] introduced a phenomenological model that parameterizes the suppression of the matter power spectrum with a single variable , and uses it to fit KiDS-1000 weak lensing data. In that model, the parameter can be physically understood as a suppression on small scales due to baryonic feedback or due to non-standard dark matter. The same model is also used to fit the Dark Energy Survey Year 3 cosmic shear data (DES-Y3 henceforth) in [32], finding a similar value for to that found for KiDS-1000. Refs. [32] and [33] also provide extensions of the original model to understand the redshift and scale dependence of the matter power spectrum suppression. These papers conclude that cosmic shear data from current state-of-the-art surveys (and even Stage-4 surveys) on its own does not have sufficient statistical power to help with the redshift reconstruction of this suppression. The scale dependence is found to require suppression of the matter power spectrum on scales /Mpc to reconcile DES-Y3 and Planck CDM.
In this paper, we develop a flexible phenomenological model of the matter power spectrum which allows us to test the viability of all three classes of solutions to resolve the tension. Moreover, we fit this model to galaxy weak lensing and CMB lensing data jointly with the aim of disentangling baryonic feedback and new physics affecting the history of structure formation.
II Model
The phenomenological model we propose here is agnostic to specific baryonic feedback or non-standard dark matter models. Instead, we aim to reconstruct the matter power spectrum as a function of scale using the parameterization
| (2) |
where is a fiducial total matter power spectrum (including both linear and non-linear contributions), the parameters alter the amplitude of power over the -th scale bin , and the functions describe a top-hat function such that:
| (3) |
The weak lensing angular cross-power spectrum (as a function of multipole ) between two distributions of sources is then given by a Limber integral of the form:
| (4) |
where the lensing kernel or are given by
| (5) |
In the case of cosmic shear, is the normalized redshift distribution of the source galaxies in a particular redshift bin. In the case of CMB lensing, this distribution is instead a -function at the redshift of the last scattering surface, :
| (6) |
The lensing convergence power spectrum for different redshift bins, , is in turn related to the cosmic shear correlation functions, , as follows:
| (7) |
where is angle on the sky and the functions are functions of Legendre polynomials [34, 35]. In this work, we reconstruct the shape of the matter power spectrum by inferring the parameters in Eq. (2) from observations of angular power spectra of CMB lensing and/or galaxy weak lensing shear correlation functions.
II.1 Comparison to model and other works.
The parameterization introduced here should be contrasted with the approach from [23] and [32]. Those works parameterize the difference between the non-linear and the linear matter power spectrum and quantifies departures from this as a suppression as shown in Eq. (8),
| (8) |
where refers to the non-linear matter spectrum due to cold-dark matter contributions only (ignoring baryonic feedback), is the linear matter power spectrum, and the parameter can be physically interpreted as a suppression due to baryonic feedback or non-standard forms of dark matter. Ref. [32] proposed a similar model to Ref. [23] but accounting for scale-dependent suppression by replacing with five parameters that act on in different -bins.
If we restrict in our model in Eq. (2) to only account for cold-dark matter contributions to the matter power spectrum and ignoring baryonic feedback, then our model and the model in Ref. [32] are equivalent as follows:
| (9) |
Furthermore, if both models have the same -binning, then
| (10) |
Although here we made a direct comparison between our model and that of [23, 32], we point out that different analysis choices were made in the present work than in those works, as we detail in sections III and IV. Importantly, our parameterization is better suited for assessing whether there is a scale-dependent departure from . For example, if observations were uniformly discrepant from CDM by an amplitude on all scales (say, due to a multiplicative bias in galaxy weak lensing), the parameterization in Eq. (9) would indicate an incorrectly large deviation on small-scales, since it does not allow the large scales to disagree with Planck. The binned parameterization with multiple parameters in [32] does not fully address this since the prior ranges used there are ; i.e., the inferred parameters will be biased low since only suppression is allowed, and not enhancement.
More recently, [36] also introduced a model-independent reconstruction of the matter power spectrum. This model performs a perturbative expansion of the linear growth factor, and fits cosmological data at various redshifts (galaxy weak lensing, CMB lensing, BAO and supernovae) to obtain coefficients that scale the linear power spectrum as a function of scale. Their model, which attempts to reconstruct to very high with only a first-order expansion, recovers the linear power spectrum at large scales, while at small scales, it predicts some non-linear contributions to the matter power spectrum without assuming any specific non-linear model. In particular, at small scales (), the model seems to predict an enhancement of the matter power spectrum. Our approach is significantly different since it performs a direct reconstruction of the full non-linear matter power.
III Data
Unlike previous work [28, 29, 30, 36], we perform a joint fit of both CMB lensing and galaxy weak lensing data to directly reconstruct the non-linear matter power spectrum. To this end, we applied the model described above to lensing data from the Atacama Cosmology Telescope (ACT) Data Release 6 (ACT-DR6 henceforth) and to DES-Y3. The ACT-DR6 lensing power spectrum is obtained from night-time CMB data acquired by ACT between 2017 and 2022, and covers roughly 9400 deg2. Details on the processing of the ACT DR6 data can be found in [10]. In this paper in particular, we use the ACT+Planck lensing power spectrum with the extended multipole range (). We include this data-set by using the publicly available likelihood used to constrain cosmology from ACT DR6 lensing data, but ran this in the “Limber integral mode”. The Limber approximation is precise for the scales we use (). Further details on this likelihood can be found in [9]. For our galaxy weak lensing dataset, we use the DES-Y3 cosmic shear likelihood as implemented in CocoA (as introduced in [37]), which uses the CosmoLike framework [38]. The DES-Y3 data was collected over the first three years of the survey and covers about 4143 deg2. Details about the data and the analysis can be found in [39].
IV Methodology
Since our approach gives considerable freedom to the shape of the matter power spectrum at , we may proceed by fixing the cosmological parameters; we choose as our fiducial parameters determined from TT,TE,EE+lowE in the Planck 2018 CMB analysis [1] (Table 1). It should be noted that this does fix the redshift evolution of background and perturbation quantities to be that determined by this cosmology. We modified the Boltzmann code CAMB [40] to introduce the parameters that reshape the non-linear matter power spectrum as a function of scale, with a binning set by
| (11) |
| Parameter | TT,TE,EE+lowE value |
|---|---|
| 0.02236 | |
| 0.1202 | |
| 0.0544 | |
| 3.045 | |
| 0.9649 | |
| 67.27 |
We performed five different fits, which we summarize in Table 2. We run three of the fits with the nonlinear model Mead2020 in CAMB [41], which only accounts for dark matter contributions when calculating the non-linear matter power spectrum, and the two others with Mead2020-feedback, which also includes baryonic feedback contributions. We set the feedback parameter for the runs with the Mead2020-feedback model.
For the cases without baryonic feedback, we either fit ACT-DR6 CMB lensing and DES-Y3 cosmic shear data likelihoods jointly, or fit each data set separately. For the ACT-DR6-only run, we only fit for since we expect CMB lensing data to only accurately constrain the largest scales. The DES-Y3 cosmic shear-only run and the joint run do fit for the five parameters. For the cases with baryonic feedback, we also do a joint ACT-DR6 lensing and DES-Y3 cosmic shear data fit and a DES-only fit. We note that we have used the entire cosmic shear correlation data without applying the scale cuts imposed in the original DES-Y3 cosmic shear analysis [39]. This is because applying the conservative scale cuts from the DES-Y3 analysis would prevent us from reconstructing the matter power spectrum on small scales.
For any of the fits described above that make use of DES-Y3 cosmic shear, we also sampled over the DES-Y3 nuisance parameters described in Table 3, where represents a Gaussian prior with mean and variance , and where represents a uniform distribution over the interval . These priors were taken from the official DES-Y3 cosmic shear analysis [39]. As in the fiducial DES-Y3 cosmic shear analysis, we employ the Tidal Alignment and Tidal Torquing model (TATT), which consists of 5 parameters, [42]. The priors for the parameters were set to a uniform distribution .
| Label | Data and likelihood | Halofit model | Sampled parameters |
|---|---|---|---|
| ACT | ACT-DR6 | Mead2020 | , |
| DES | DES-Y3-CS | Mead2020 | ,..,, nuisance |
| ACT+DES | ACT-DR6 + DES-Y3-CS | Mead2020 | ,..,, nuisance |
| DES-BF | DES-Y3-CS | Mead2020-feedback | ,..,, nuisance |
| ACT+DES-BF | ACT-DR6 + DES-Y3-CS | Mead2020-feedback | ,..,, nuisance |
| Parameter | Prior |
| Source photo-z | |
| Shear calibration | |
| Intrinsic alignment | |
V Results
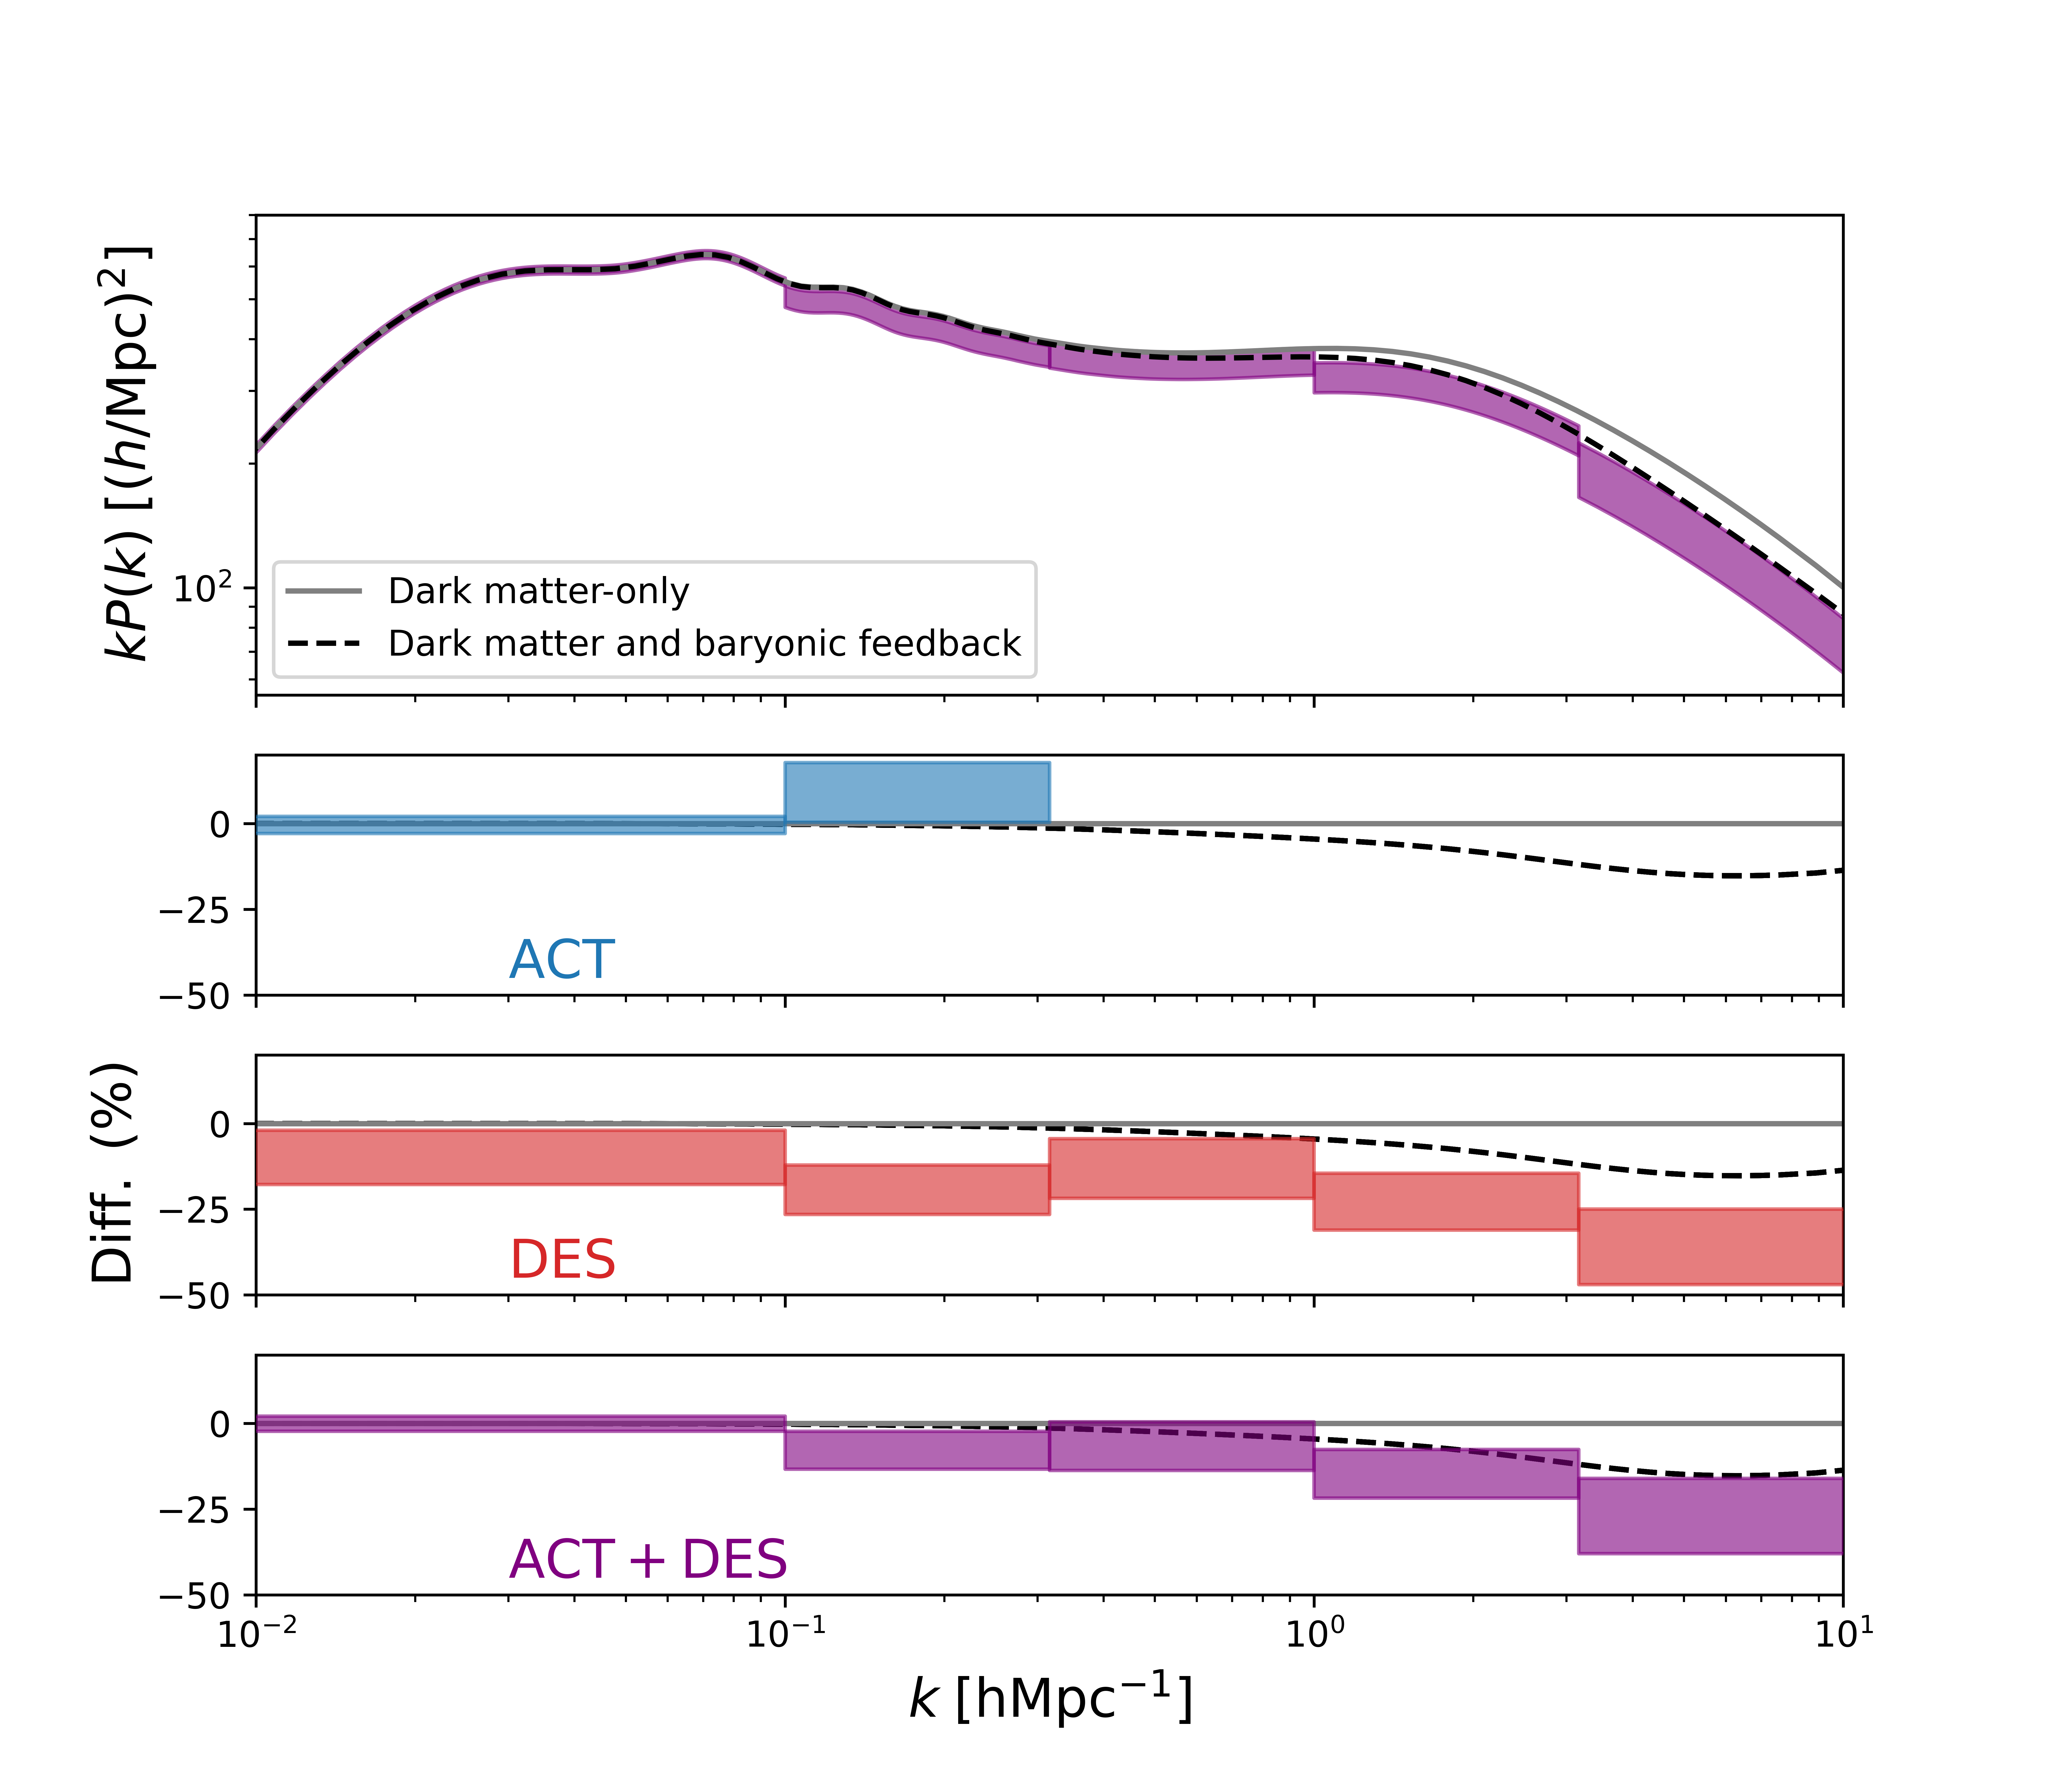
Fig. 1 shows the scale-dependent reconstruction of the matter power spectrum obtained from the runs with Mead2020. The corresponding triangle plot and correlation matrices of the parameters can be found in Appendix A.
In order to quantify the amount of scale dependence that these parameters imprint on the matter power spectrum, we treat the best-fit for the parameters as data points (with covariance obtained from the MCMC samples for the parameters) and then fit these to a model consisting of just a constant offset. A good fit to this constant model would be an indication of scale-independence, i.e. a disagreement with the Planck prediction would then be due to an overall amplitude shift. We then compute the and probability-to-exceed (PTE) for these fits, noting that a smaller PTE corresponds to a more significant scale-dependent departure from the Planck prediction. Table 4 and Fig. 2 summarize the PTE for the different fits. Note that we either fit for all the available parameters (), or leave out the last bin (), which corresponds to the smallest scales. We notice that the case for a scale-dependent departure from is stronger for the five parameters obtained from the joint ACT+DES fit with Mead2020. When accounting for some amount of baryonic feedback, as we do in the runs with Mead2020-feedback, or alternatively, when leaving out the smallest scales from the fit, the evidence for scale-dependence is much weaker.
| Label | Parameters fit | Amplitude | PTE |
|---|---|---|---|
| ACT+DES | 0.07 | ||
| DES | 0.12 | ||
| ACT+DES | 0.40 | ||
| DES | 0.79 | ||
| ACT+DES-BF | 0.20 | ||
| DES-BF | 0.25 |
We also fit a slight variation of the model introduced in [23], where we introduce an additional parameter that frees up the amplitude of the matter power spectrum:
| (12) |
| Label | PTE | ||
|---|---|---|---|
| ACT+DES | 0.50 | ||
| DES | 0.34 | ||
| ACT+DES | 0.64 | ||
| DES | 0.11 |
For comparison with [23], we also fit the original variant, which corresponds to fixing . The result of these fits is shown in Fig. 2, and summarized in Table 5. In the case of the DES-only runs, we calculate the Akaike Information Criterion (AIC = ) to compare the and models and find suggesting that one model is not significantly preferred over another. However, freeing up the large-scale parameter for DES-only does give , a deficit compared to the Planck prediction. This deficit disappears () in the joint ACT+DES run.
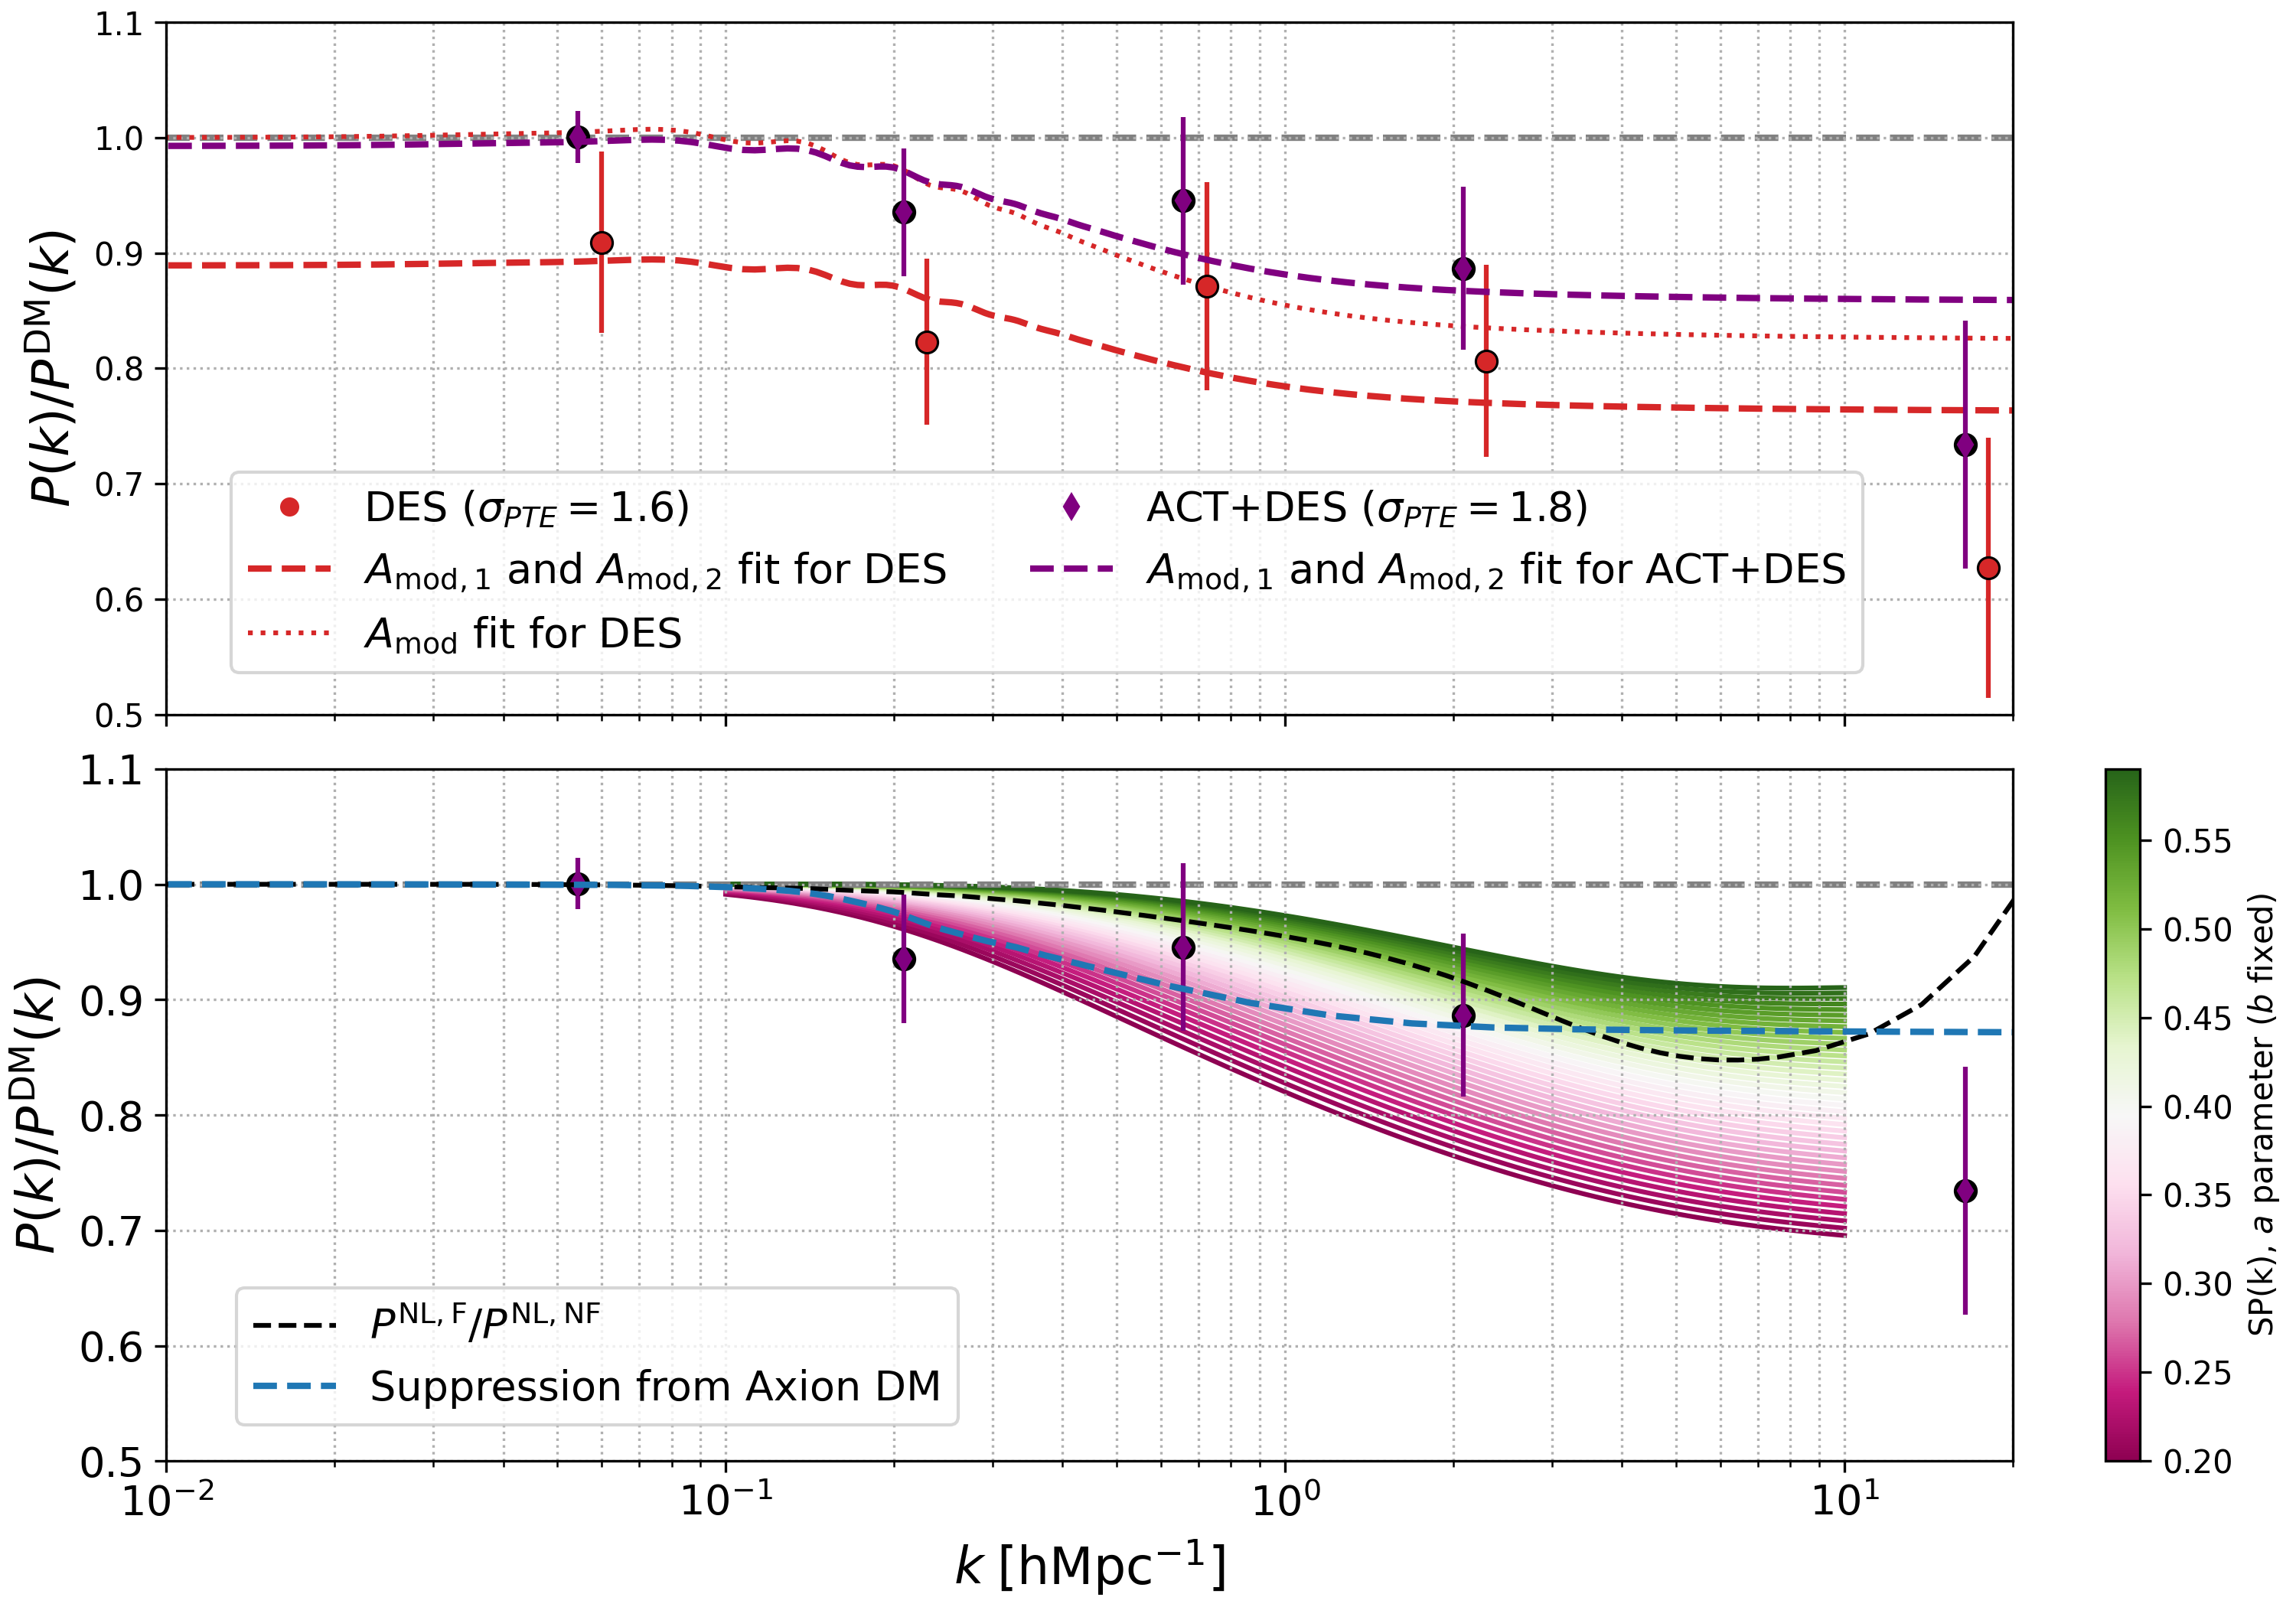
Although the results obtained with the halofit model Mead2020 in this paper are agnostic to specific baryonic feedback models or to non-standard dark matter theories, we also compare the reconstruction of the matter power spectrum in this work to interesting models. For example, in Fig. 2 we also we also overplot SP(k) hydrodynamical simulation-based models for the suppression of the non-linear matter power spectrum due to baryonic feedback from [43]. These models employed 400 simulations of an ample range of baryonic feedback processes at a wide range of scales and redshifts, and mapped the suppression to the total baryon fraction of haloes, , as follows:
| (13) |
where is the baryon fraction at some optimal halo mass: . Details on this parameter and on , and , as well as their corresponding best-fit parameters can be found in [43]. With these best-fit parameters, and the functional form for the relation defined as
| (14) |
SP(k) can return predictions for the amount of suppression to the non-linear matter power spectrum due to baryonic feedback down to redshift z=0.125 and for , which we overplot in Fig. 2. At first glance, the range of curves for this model adequately recovers the shape and amplitude described by the parameters.
We additionally overplot in Fig. 2 a prediction for the suppression of the non-linear matter power spectrum due to ultralight axion dark matter. We use the best-fit model in [6] that alleviates the tension arising in the slope of the linear matter power spectrum from the Lyman- forest and CMB, which was found to be an axion with mass eV that constitutes % of the dark matter (with the rest being cold dark matter). This value is well within the constraints on axions from CMB and galaxy surveys [44, 45]. The exact shape of the suppression is obtained from axionHMcode [46] which computes the non-linear corrections to the matter power spectrum calculated by the adapted Boltzmann code axionCAMB [47]. We notice that this suppression is similar to the best-fit of the two model we fit to the parameters from the joint ACT+DES run, and could adequately describe the shape and amplitude of the parameters, as seen in Fig. 2.
VI Conclusion
The results presented here constitute the first attempt at directly reconstructing the non-linear matter power spectrum across scales with both CMB lensing and cosmic shear data. When ignoring baryonic feedback, we find a mild indication of a scale-dependent suppression, as evidenced by the joint fit with ACT DR6 lensing and DES-Y3 cosmic shear runs in Fig 1. However, either of these data-sets on their own do not indicate such a preference, in contrast to what was found in previous work [23, 32]. We also perform a reconstruction with respect to a model that includes a moderate amount of baryonic feedback (the default in Mead2020-feedback): here, the model provides a good fit with no suggestion of a scale-dependent departure even when jointly fit to both CMB lensing and weak lensing. Note that our analysis assumes the standard cosmology (except for the one dark matter alternative discussed below) with the parameters listed in Table 1 fixed to the values determined by the Planck 2018 primary CMB analysis.
A comparison with the model in [23, 32] and their best-fit parameter from cosmic shear data () shows that such a model roughly describes the shape and the scale of the suppression recovered with the joint ACT+DES fit of the parameters in this paper, in particular for the two central wavenumber bins. However, this does not seem to be the case when using only DES galaxy weak lensing data. We introduced a variation of this model, where two parameters are introduced, one of which () also varies the amplitude of the linear matter power spectrum. Particularly in the case of DES data alone, we find a preference for (although we note that the two-parameter model is not a better fit to the data than the standard one-parameter ), i.e. that the DES data differs from the Planck prediction on linear scales, as is also evident from the top panel of Fig. 2.
It should be noted that the central value of found by cosmic shear measurements also differs slightly from our fiducial value based on CMB measurements. Indeed, DES-Y3 cosmic shear finds [34] which is lower than the fiducial . Given the degeneracy direction of , one needs to decrease to obtain the same with a higher matter density when fitting cosmic shear data. This may be partially responsible for the overall (scale-independent) suppression observed in the DES-only analysis.
We also compared the parameters recovered from ACT+DES and the DES fit to the SP(k) model for baryonic feedback suppression of the non-linear matter power spectrum [43]. While we do not attempt to quantitatively fit this baryonic feedback model, some variations overplotted in Fig. 2 do appear recover the shape and amplitude of the suppression induced by the parameters. Further work can be done to fit for the parameters along with SP(k) model using both cosmic shear and CMB lensing data.
We have also compared our matter power spectrum reconstruction to the best-fit model of ultralight axion dark matter suppression of the non-linear matter power spectrum in [6]. These comparisons motivate the need for more accurate models of baryonic feedback, as it is almost impossible to distinguish between its impact on the non-linear matter power spectrum and the effects of non-standard dark matter models. Our results suggest that strong constraints on baryonic feedback models – likely from complementary measurements such as the thermal (e.g. [48, 49, 50, 51]) and kinematic Sunyaev-Zel’dovich effects (e.g. [52, 53, 54, 55, 56, 57]) – are required to be able to test dark matter models with lensing data.
Another effect of the coupling of scale and redshift dependence may be at play in cross-correlation studies between galaxy surveys and CMB lensing [58, 59, 60, 61, 62] that measure the growth of structure over time and find a somewhat lower value of at lower redshifts. Given the form of the line-of-sight projection integral (Eq. 4), a given mode receives contributions from the matter power spectrum at smaller scales from low redshifts. Therefore a redshift-dependent suppression effect could manifest as scale-dependence in our analysis. We leave the study of time-dependent deviations from CDM in the matter power spectrum to future work. With improved galaxy weak lensing (e.g. [63, 64, 65] ) and CMB lensing (e.g. [66, 67, 68]) measurements from upcoming or planned surveys, it may in the future be possible to separate out redshift and scale-dependent effects, allowing the mapping of in a grid across scales and cosmic time.
VII Acknowledgments
We thank Gary Bernstein, Cyrille Doux, Rafael Gomes, Tanvi Karwal, Sanjit Kobla, Meng-Xiang Lin and Kunhao Zhong for helpful discussions. We thank Neelima Sehgal and Ed Wollack for helpful suggestions for this manuscript. We are especially grateful to Vivian Miranda for help with the Cocoa likelihood framework. KPS and MM acknowledge support from NSF grants AST-2307727 and AST-2153201. AL acknowledges support from NASA grant 21-ATP21-0145. BJ is partially supported by the US Department of Energy grant DE-SC0007901. We also acknowledge use of the matplotlib [69] package for producing plots in this paper, use of the Boltzmann code CAMB [40] for calculating theory spectra, and use of the GetDist [70] and Cobaya [71] software for likelihood analysis and sampling.
References
- Planck Collaboration et al. [2020a] Planck Collaboration, N. Aghanim, Y. Akrami, M. Ashdown, J. Aumont, C. Baccigalupi, M. Ballardini, A. J. Banday, R. B. Barreiro, N. Bartolo, et al., A&A 641, A6 (2020a), eprint 1807.06209.
- Heymans et al. [2021] C. Heymans, T. Tröster, M. Asgari, C. Blake, H. Hildebrandt, B. Joachimi, K. Kuijken, C.-A. Lin, A. G. Sánchez, J. L. van den Busch, et al., A&A 646, A140 (2021), eprint 2007.15632.
- Abbott et al. [2022] T. M. C. Abbott, M. Aguena, A. Alarcon, S. Allam, O. Alves, A. Amon, F. Andrade-Oliveira, J. Annis, S. Avila, D. Bacon, et al., Phys. Rev. D 105, 023520 (2022), eprint 2105.13549.
- Li et al. [2023] X. Li, T. Zhang, S. Sugiyama, R. Dalal, R. Terasawa, M. M. Rau, R. Mandelbaum, M. Takada, S. More, M. A. Strauss, et al., Phys. Rev. D 108, 123518 (2023), eprint 2304.00702.
- Nguyen et al. [2023] N.-M. Nguyen, D. Huterer, and Y. Wen, Phys. Rev. Lett. 131, 111001 (2023), eprint 2302.01331.
- Rogers and Poulin [2025] K. K. Rogers and V. Poulin, Physical Review Research 7, L012018 (2025), eprint 2311.16377.
- Fernandez et al. [2024] M. A. Fernandez, S. Bird, and M.-F. Ho, J. Cosmology Astropart. Phys 2024, 029 (2024), eprint 2309.03943.
- Planck Collaboration et al. [2020b] Planck Collaboration, N. Aghanim, Y. Akrami, M. Ashdown, J. Aumont, C. Baccigalupi, M. Ballardini, A. J. Banday, R. B. Barreiro, N. Bartolo, et al., A&A 641, A8 (2020b), eprint 1807.06210.
- Madhavacheril et al. [2024] M. S. Madhavacheril, F. J. Qu, B. D. Sherwin, N. MacCrann, Y. Li, I. Abril-Cabezas, P. A. R. Ade, S. Aiola, T. Alford, M. Amiri, et al., ApJ 962, 113 (2024), eprint 2304.05203.
- Qu et al. [2024] F. J. Qu, B. D. Sherwin, M. S. Madhavacheril, D. Han, K. T. Crowley, I. Abril-Cabezas, P. A. R. Ade, S. Aiola, T. Alford, M. Amiri, et al., ApJ 962, 112 (2024), eprint 2304.05202.
- Bianchini et al. [2020] F. Bianchini, W. L. K. Wu, P. A. R. Ade, A. J. Anderson, J. E. Austermann, J. S. Avva, J. A. Beall, A. N. Bender, B. A. Benson, L. E. Bleem, et al., ApJ 888, 119 (2020), eprint 1910.07157.
- Simpson [2010] F. Simpson, Phys. Rev. D 82, 083505 (2010), eprint 1007.1034.
- Poulin et al. [2023] V. Poulin, J. L. Bernal, E. D. Kovetz, and M. Kamionkowski, Phys. Rev. D 107, 123538 (2023), eprint 2209.06217.
- Laguë et al. [2024] A. Laguë, F. McCarthy, M. Madhavacheril, J. C. Hill, and F. J. Qu, Phys. Rev. D 110, 023536 (2024), eprint 2402.08149.
- Mazoun et al. [2024] A. Mazoun, S. Bocquet, M. Garny, J. J. Mohr, H. Rubira, and S. M. L. Vogt, Phys. Rev. D 109, 063536 (2024), eprint 2312.17622.
- Cyr-Racine et al. [2016] F.-Y. Cyr-Racine, K. Sigurdson, J. Zavala, T. Bringmann, M. Vogelsberger, and C. Pfrommer, Phys. Rev. D 93, 123527 (2016), eprint 1512.05344.
- Markovic et al. [2011] K. Markovic, S. Bridle, A. Slosar, and J. Weller, J. Cosmology Astropart. Phys 2011, 022 (2011), eprint 1009.0218.
- Tulin and Yu [2018] S. Tulin and H.-B. Yu, Phys. Rep. 730, 1 (2018), eprint 1705.02358.
- Tsujikawa [2007] S. Tsujikawa, Phys. Rev. D 76, 023514 (2007), eprint 0705.1032.
- Shah et al. [2025] R. Shah, P. Mukherjee, and S. Pal, MNRAS 536, 2404 (2025), eprint 2404.06396.
- Wang and Steinhardt [1998] L. Wang and P. J. Steinhardt, ApJ 508, 483 (1998), eprint astro-ph/9804015.
- Linder [2005] E. V. Linder, Phys. Rev. D 72, 043529 (2005), eprint astro-ph/0507263.
- Amon and Efstathiou [2022] A. Amon and G. Efstathiou, MNRAS 516, 5355 (2022), eprint 2206.11794.
- Schaan et al. [2021] E. Schaan, S. Ferraro, S. Amodeo, N. Battaglia, S. Aiola, J. E. Austermann, J. A. Beall, R. Bean, D. T. Becker, R. J. Bond, et al., Physical Review D 103 (2021), ISSN 2470-0029, URL http://dx.doi.org/10.1103/PhysRevD.103.063513.
- Amodeo et al. [2021] S. Amodeo, N. Battaglia, E. Schaan, S. Ferraro, E. Moser, S. Aiola, J. E. Austermann, J. A. Beall, R. Bean, D. T. Becker, et al., Phys. Rev. D 103, 063514 (2021), eprint 2009.05558.
- Hadzhiyska et al. [2024a] B. Hadzhiyska, S. Ferraro, B. Ried Guachalla, E. Schaan, J. Aguilar, N. Battaglia, J. R. Bond, D. Brooks, E. Calabrese, S. K. Choi, et al., arXiv e-prints arXiv:2407.07152 (2024a), eprint 2407.07152.
- Schneider et al. [2022] A. Schneider, S. K. Giri, S. Amodeo, and A. Refregier, MNRAS 514, 3802 (2022), eprint 2110.02228.
- Tegmark and Zaldarriaga [2002] M. Tegmark and M. Zaldarriaga, Phys. Rev. D 66, 103508 (2002), eprint astro-ph/0207047.
- Chabanier et al. [2019] S. Chabanier, M. Millea, and N. Palanque-Delabrouille, MNRAS 489, 2247 (2019), eprint 1905.08103.
- Doux et al. [2022] C. Doux, B. Jain, D. Zeurcher, J. Lee, X. Fang, R. Rosenfeld, A. Amon, H. Camacho, A. Choi, L. F. Secco, et al., MNRAS 515, 1942 (2022), eprint 2203.07128.
- Broxterman and Kuijken [2024] J. C. Broxterman and K. Kuijken, arXiv e-prints arXiv:2409.13404 (2024), eprint 2409.13404.
- Preston et al. [2023] C. Preston, A. Amon, and G. Efstathiou, MNRAS 525, 5554 (2023), eprint 2305.09827.
- Preston et al. [2024] C. Preston, A. Amon, and G. Efstathiou, MNRAS 533, 621 (2024), eprint 2404.18240.
- Secco et al. [2022] L. F. Secco, S. Samuroff, E. Krause, B. Jain, J. Blazek, M. Raveri, A. Campos, A. Amon, A. Chen, C. Doux, et al., Phys. Rev. D 105, 023515 (2022), eprint 2105.13544.
- Krause et al. [2021] E. Krause, X. Fang, S. Pandey, L. F. Secco, O. Alves, H. Huang, J. Blazek, J. Prat, J. Zuntz, T. F. Eifler, et al., arXiv e-prints arXiv:2105.13548 (2021), eprint 2105.13548.
- Ye et al. [2024] G. Ye, J.-Q. Jiang, and A. Silvestri, arXiv e-prints arXiv:2411.07082 (2024), eprint 2411.07082.
- Zhong et al. [2023] K. Zhong, E. Saraivanov, V. Miranda, J. Xu, T. Eifler, and E. Krause, Phys. Rev. D 107, 123529 (2023), eprint 2301.03694.
- Krause and Eifler [2017] E. Krause and T. Eifler, MNRAS 470, 2100 (2017), eprint 1601.05779.
- Amon et al. [2022] A. Amon, D. Gruen, M. A. Troxel, N. MacCrann, S. Dodelson, A. Choi, C. Doux, L. F. Secco, S. Samuroff, E. Krause, et al., Phys. Rev. D 105, 023514 (2022), eprint 2105.13543.
- Lewis et al. [2000] A. Lewis, A. Challinor, and A. Lasenby, ApJ 538, 473 (2000), eprint astro-ph/9911177.
- Mead et al. [2021] A. J. Mead, S. Brieden, T. Tröster, and C. Heymans, MNRAS 502, 1401 (2021), eprint 2009.01858.
- Blazek et al. [2019] J. A. Blazek, N. MacCrann, M. A. Troxel, and X. Fang, Phys. Rev. D 100, 103506 (2019), eprint 1708.09247.
- Salcido et al. [2023] J. Salcido, I. G. McCarthy, J. Kwan, A. Upadhye, and A. S. Font, MNRAS 523, 2247 (2023), eprint 2305.09710.
- Laguë et al. [2022] A. Laguë, J. R. Bond, R. Hložek, K. K. Rogers, D. J. E. Marsh, and D. Grin, J. Cosmology Astropart. Phys 2022, 049 (2022), eprint 2104.07802.
- Rogers et al. [2023] K. K. Rogers, R. Hložek, A. Laguë, M. M. Ivanov, O. H. E. Philcox, G. Cabass, K. Akitsu, and D. J. E. Marsh, J. Cosmology Astropart. Phys 2023, 023 (2023), eprint 2301.08361.
- Vogt et al. [2023] S. M. L. Vogt, D. J. E. Marsh, and A. Laguë, Phys. Rev. D 107, 063526 (2023), eprint 2209.13445.
- Hlozek et al. [2015] R. Hlozek, D. Grin, D. J. E. Marsh, and P. G. Ferreira, Phys. Rev. D 91, 103512 (2015), eprint 1410.2896.
- Gatti et al. [2022] M. Gatti, S. Pandey, E. Baxter, J. C. Hill, E. Moser, M. Raveri, X. Fang, J. DeRose, G. Giannini, C. Doux, et al., Phys. Rev. D 105, 123525 (2022), eprint 2108.01600.
- Pandey et al. [2022] S. Pandey, M. Gatti, E. Baxter, J. C. Hill, X. Fang, C. Doux, G. Giannini, M. Raveri, J. DeRose, H. Huang, et al., Phys. Rev. D 105, 123526 (2022), eprint 2108.01601.
- Tröster et al. [2022] T. Tröster, A. J. Mead, C. Heymans, Z. Yan, D. Alonso, M. Asgari, M. Bilicki, A. Dvornik, H. Hildebrandt, B. Joachimi, et al., A&A 660, A27 (2022), eprint 2109.04458.
- Pandey et al. [2023] S. Pandey, K. Lehman, E. J. Baxter, Y. Ni, D. Anglés-Alcázar, S. Genel, F. Villaescusa-Navarro, A. M. Delgado, and T. di Matteo, MNRAS 525, 1779 (2023), eprint 2301.02186.
- Battaglia et al. [2017] N. Battaglia, S. Ferraro, E. Schaan, and D. N. Spergel, J. Cosmology Astropart. Phys 2017, 040 (2017), eprint 1705.05881.
- Battaglia et al. [2019] N. Battaglia, J. C. Hill, S. Amodeo, J. G. Bartlett, K. Basu, J. Erler, S. Ferraro, L. Hernquist, M. Madhavacheril, M. McQuinn, et al., BAAS 51, 297 (2019), eprint 1903.04647.
- Schaan et al. [2021] E. Schaan, S. Ferraro, S. Amodeo, N. Battaglia, S. Aiola, J. E. Austermann, J. A. Beall, R. Bean, D. T. Becker, R. J. Bond, et al., Phys. Rev. D 103, 063513 (2021), eprint 2009.05557.
- Vavagiakis et al. [2021] E. M. Vavagiakis, P. A. Gallardo, V. Calafut, S. Amodeo, S. Aiola, J. E. Austermann, N. Battaglia, E. S. Battistelli, J. A. Beall, R. Bean, et al., Phys. Rev. D 104, 043503 (2021), eprint 2101.08373.
- Hadzhiyska et al. [2024b] B. Hadzhiyska, S. Ferraro, B. Ried Guachalla, E. Schaan, J. Aguilar, N. Battaglia, J. R. Bond, D. Brooks, E. Calabrese, S. K. Choi, et al., arXiv e-prints arXiv:2407.07152 (2024b), eprint 2407.07152.
- Hadzhiyska et al. [2025] B. Hadzhiyska, S. Ferraro, and R. Zhou, Phys. Rev. D 111, 023534 (2025), eprint 2412.03631.
- White et al. [2022] M. White, R. Zhou, J. DeRose, S. Ferraro, S.-F. Chen, N. Kokron, S. Bailey, D. Brooks, J. García-Bellido, J. Guy, et al., J. Cosmology Astropart. Phys 2022, 007 (2022), eprint 2111.09898.
- Sailer et al. [2024] N. Sailer, J. Kim, S. Ferraro, M. S. Madhavacheril, M. White, I. Abril-Cabezas, J. N. Aguilar, S. Ahlen, J. R. Bond, D. Brooks, et al., arXiv e-prints arXiv:2407.04607 (2024), eprint 2407.04607.
- Kim et al. [2024] J. Kim, N. Sailer, M. S. Madhavacheril, S. Ferraro, I. Abril-Cabezas, J. N. Aguilar, S. Ahlen, J. Richard Bond, D. Brooks, E. Burtin, et al., J. Cosmology Astropart. Phys 2024, 022 (2024), eprint 2407.04606.
- Farren et al. [2024] G. S. Farren, A. Krolewski, N. MacCrann, S. Ferraro, I. Abril-Cabezas, R. An, Z. Atkins, N. Battaglia, J. R. Bond, E. Calabrese, et al., ApJ 966, 157 (2024), eprint 2309.05659.
- Karim et al. [2024] T. Karim, S. Singh, M. Rezaie, D. Eisenstein, B. Hadzhiyska, J. S. Speagle, J. N. Aguilar, S. Ahlen, D. Brooks, T. Claybaugh, et al., arXiv e-prints arXiv:2408.15909 (2024), eprint 2408.15909.
- Spergel et al. [2015] D. Spergel, N. Gehrels, C. Baltay, D. Bennett, J. Breckinridge, M. Donahue, A. Dressler, B. S. Gaudi, T. Greene, O. Guyon, et al., arXiv e-prints arXiv:1503.03757 (2015), eprint 1503.03757.
- The LSST Dark Energy Science Collaboration et al. [2018] The LSST Dark Energy Science Collaboration, R. Mandelbaum, T. Eifler, R. Hložek, T. Collett, E. Gawiser, D. Scolnic, D. Alonso, H. Awan, R. Biswas, et al., arXiv e-prints arXiv:1809.01669 (2018), eprint 1809.01669.
- Euclid Collaboration et al. [2024] Euclid Collaboration, Y. Mellier, Abdurro’uf, J. A. Acevedo Barroso, A. Achúcarro, J. Adamek, R. Adam, G. E. Addison, N. Aghanim, M. Aguena, et al., arXiv e-prints arXiv:2405.13491 (2024), eprint 2405.13491.
- Abazajian et al. [2016] K. N. Abazajian, P. Adshead, Z. Ahmed, S. W. Allen, D. Alonso, K. S. Arnold, C. Baccigalupi, J. G. Bartlett, N. Battaglia, B. A. Benson, et al., arXiv e-prints arXiv:1610.02743 (2016), eprint 1610.02743.
- Ade et al. [2019] P. Ade, J. Aguirre, Z. Ahmed, S. Aiola, A. Ali, D. Alonso, M. A. Alvarez, K. Arnold, P. Ashton, J. Austermann, et al., J. Cosmology Astropart. Phys 2019, 056 (2019), eprint 1808.07445.
- MacInnis and Sehgal [2024] A. MacInnis and N. Sehgal, arXiv e-prints arXiv:2405.12220 (2024), eprint 2405.12220.
- Hunter [2007] J. D. Hunter, Computing in Science and Engineering 9, 90 (2007).
- Lewis [2019] A. Lewis, arXiv e-prints arXiv:1910.13970 (2019), eprint 1910.13970.
- Torrado and Lewis [2021] J. Torrado and A. Lewis, J. Cosmology Astropart. Phys 2021, 057 (2021), eprint 2005.05290.
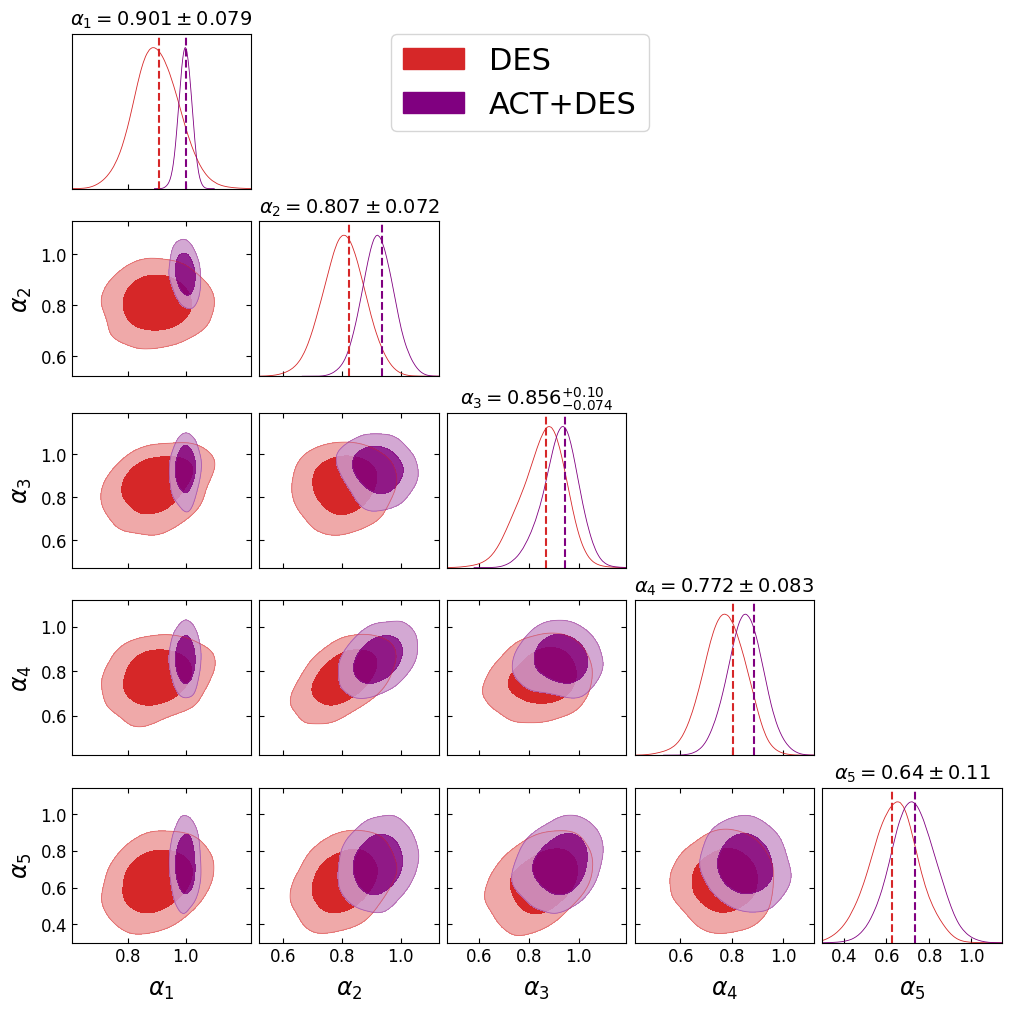
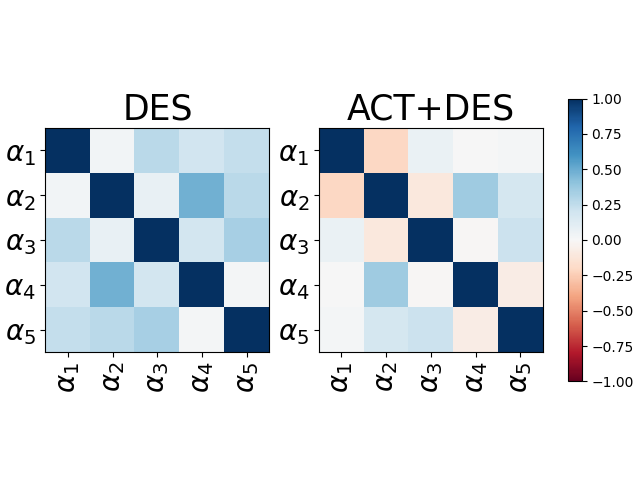
Appendix A Parameter correlations
Fig. 3 shows the parameters recovered from the DES-Y3 cosmic shear run and the joint run with ACT DR6 CMB lensing data, while Fig. 4 shows the corresponding correlation matrices. The best-fit values are generally in agreement with the mean values, and the correlation between different parameters is generally low.