High pressure structural and lattice dynamics study of -In2Se3
Abstract
Layered -In2Se3 has been studied using a concomitant synchrotron angle-dispersive powder x-ray diffraction and Raman spectroscopy study in a diamond anvil cell up to 60+ GPa, at room temperature. Helium, that remains fairly hydrostatic up to the highest pressure in this study, was used as the pressure-transmitting medium. The results from both experimental methods reveal a pressure-induced structural phase transition from -In2Se3 to a monoclinic -In2Se3 structure at 1 GPa, in agreement with previous studies. Based on our detailed measurements using both experimental techniques and formalism, the -In2Se3 structure remains stable up to 45 GPa, without a clear indication of a phase transition towards the previously reported -In2Se3 phase. Above this pressure, In2Se3 adopts a disordered solid-solution-like orthorhombic structure, phase IV. The results are discussed in comparison with the relevant previous studies of -In2Se3 under pressure.
I Introduction
Two-dimensional materials are ultrathin nanomaterials that are constrained in two dimensions [1]. They possess superior optical, mechanical, and electrical properties, such as high transparency, anisotropy, and gate tunability [2, 3]. Compared to conventional ferroelectric materials, their two-dimensional counterparts are more suitable for high-density storage and low-energy consumption in nanoelectronics due to their stable and outstanding ferroelectric properties [4]. -In2Se3 is an emerging 2D ferroelectric material and it is a III-VI semiconductor consisting of five Se-In-Se-In-Se atomic layers. It has attracted particular interest, due to the presence of robust intercoupled in-plane and out-of-plane ferroelectricity in monolayer form, that makes it highly suitable for ferroelectric-based electronics applications [5, 6].
At ambient conditions, the layered rhombohedral (space group (160)) -In2Se3 phase is the most stable crystal structure [6], and pressure is expected to significantly affect its physicochemical properties. Indeed, recent research results on other layered compounds, such as graphene [7] and Transition Metal Dichalcogenides [8, 9], further support this hypothesis. However, to our knowledge, the overall structural behavior and the optical properties of -In2Se3 phase under high pressure have not been systematically investigated. The majority of previous studies, using Raman spectroscopy and X-ray diffraction (XRD), were limited to 20 GPa [10, 11, 12] and only one XRD study [12] was conducted up to 60 GPa , albeit using a substantially non-hydrostatic pressure transmitting medium (PTM).
To address this issue, we performed a combined Raman spectroscopy and synchrotron XRD study of -In2Se3 under pressure, using helium as the pressure transmitting medium. Our results agree with the phase transition at 1 GPa, reported in previous studies [10, 11, 12, 13]. However, no evidence for the transition to the previously reported -In2Se3 were found. On the other hand, we do observe the previously reported phase transition, towards a high-pressure phase ()[12], above 45 GPa . We conclude that this phase is a disordered solid-solution-like orthorhombic structure, based on XRD patterns indexing and atomic volumes arguments. A detailed comparison with previous studies on -In2Se3 under pressure is also provided.
II Experimental methods
The -In2Se3 samples employed in the Raman spectroscopy measurements for this study are commercially available from hq graphene BV Company in the Netherlands (99.995). For X-ray diffraction (XRD) experiments, commercially available high purity (99.999) -In2Se3 powder specimens from Shanghai Aladdin Biochemical Technology Company were used.
II.1 High pressure studies
Symmetric and mini-BX-80 diamond anvil cells (DAC) with diamond culets of 300-400 m diameter were used. Between the two diamonds, a high-pressure chamber was constructed using a pre-indented Rhenium gasket with a thickness of 30-40 m and a central hole diameter of 120 m. Powder specimens grained to 5 m in average diameter were loaded, and the remaining volume was filled with Helium (He) pre-compressed to 2KBar (using a gas loader), acting as the pressure-transmitting medium (PTM). He, remains fairly hydrostatic at pressures far above its solidification pressure and up to 50+ GPa [14].
II.1.1 Raman Spectroscopy
Raman studies were performed using a custom-made confocal micro-Raman with the 532 nm line of a solid-state laser for excitation in the backscattering geometry. The laser probing spot dimension was 4 m. Raman spectra were recorded with a spectral resolution of 2 cm-1 using a single-stage grating spectrograph equipped with a charge-coupled device (CCD) array detector. The laser power on specimens was kept below 1mW, to avoid any laser-induced decomposition. Ultra-low-frequency solid-state notch filters allowed us to measure Raman spectra down to 10 cm-1 [15]. A small ruby ball was also loaded inside the sample chamber, to measure pressure using ruby luminescence [16].
II.1.2 X-ray Diffraction
For the XRD measurements, small quantities of ruby and gold powder were also loaded to determine the pressure through ruby luminescence [16] and gold Equation of state (EOS) [17], respectively. A Dectris Pilatus3 S 1M Hybrid Photon Counting detector was used at the Advanced Light Source, Lawrence Berkeley National Laboratory, Beamline 12.2.2. The spot size of the X-ray probing beam was focused to about 10 x 10m using Kirkpatrick-Baez mirrors. More details on the XRD experimental setups are given in Kunz [18] At SPring-8, beamline BL10XU, a Flat Panel X-ray Detector (Varex Imaging, XRD1611 CP3) was used and the X-ray probing beam spot size was focused to about 10 x 10m using Kirkpatrick-Baez mirrors. More details on the SPring-8 XRD experimental setups are given in Kawaguchi‐Imada [19]. At Beamline P02.2 at DESY, the X-ray probing beam were focused to a spot size of 2 x 2 m at the sample using Kirkpatrick-Baez mirrors and a PerkinElmer XRD 1621 flat-panel detector was used to collect the diffraction images of sample.
Integration of powder diffraction patterns to yield scattering intensity versus 2 diagrams and initial analysis were performed using the DIOPTAS program [20]. Calculated XRD patterns were produced using the POWDER CELL program [21] for the corresponding crystal structures according to the EOSs determined experimentally in this study and assuming continuous Debye rings of uniform intensity. XRD patterns indexing has been performed using the DICVOL program [22] as implemented in the FullProf Suite. Le Bail refinements were performed using the software [23].
III Results
Before proceeding to the results of this study, it is useful to provide a brief summary of the previous high-pressure Raman spectroscopy and XRD studies of -In2Se3 [10, 11, 12, 13]. From XRD studies [10, 11], it was suggested that -In2Se3 will undergo two pressure-induced phase transitions below 20 GPa: the phase transforms to the phase at 0.9 GPa, which in turn converts to the phase at 10-12 GPa. During this process, the coordination number of both In and Se atoms increases with pressure. Initially, for the phase, the two crystallographically nonequivalent In-1 and In-2 atoms have 4-fold and 6-fold coordination, respectively, while the Se atoms are 4-fold coordinated. After transforming to the phase, both In and Se atoms have the 6-fold coordination, see Fig. 7 in Ref. 11.
According to Zhao [12], In2 Se3 undergoes four pressure-induced transformations from ambient pressure to 59.5 GPa, based on their XRD results. At roughly 0.81 GPa, the -In2Se3 (phase ) transforms to -In2Se3 (phase ), and at around 5 GPa this phase transforms to -In2Se3 (phase ). Then, at about 20.6 GPa, there is an evolution from phase to , similar to an isostructural phase transition. At approximately 32.1 GPa, phase finally transforms into a body-centered cubic-type structure (phase ) that is stable up to, at least, 59.5 GPa.
Likewise, two of the previous Raman spectroscopy studies indicated a structural sequence under pressure [10, 11], in agreement with XRD results. A previous study [12] observed a prominent negative Raman shift, accompanied by a significant increase in intensity, of one of the Raman modes in the range of 170-210 for -In2Se3 (phase III) below about 20 GPa. However, this observation contradicts all previously reported and present results, raising questions about the origin of this effect.
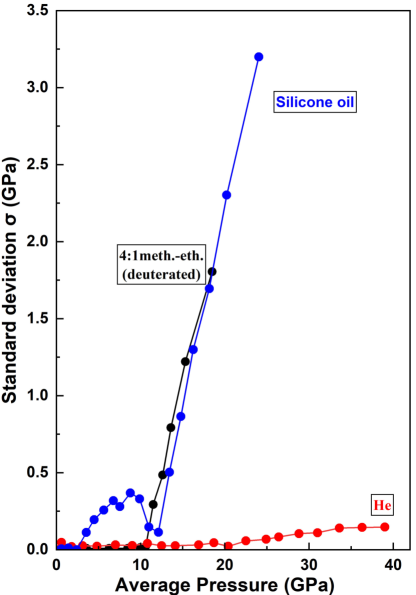
We note that in the aforementioned studies, a methanol-ethanol mixture [11, 10] or silicone oil [12] was used as the PTM. It is well established, that both these PTMs become substantially nonhydrostatic above 12 GPa [14], see Fig. S1. Non-hydrostatic conditions may be problematic, as it is impossible to determine the exact pressure during measurements and also they promote phase transitions to occur at lower pressures [24]. Furthermore, the same material may undergo different phase transitions under hydrostatic and nonhydrostatic conditions [25, 26]. The above mentioned issues with respect to PTMs, was our main motivation to use He as PTM that is considered the optimal PTM, even in its solid state above 12.1 GPa at 300 K [27].
III.1 Raman spectroscopy
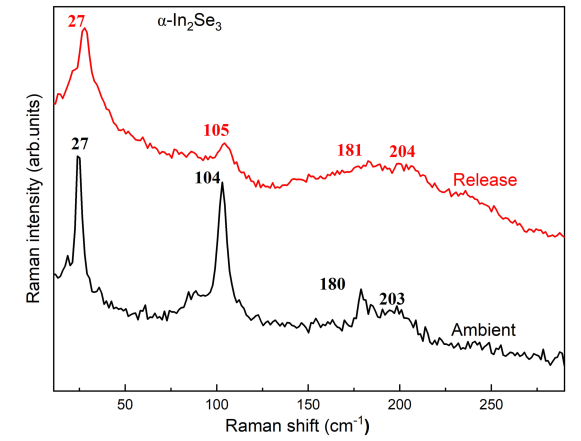
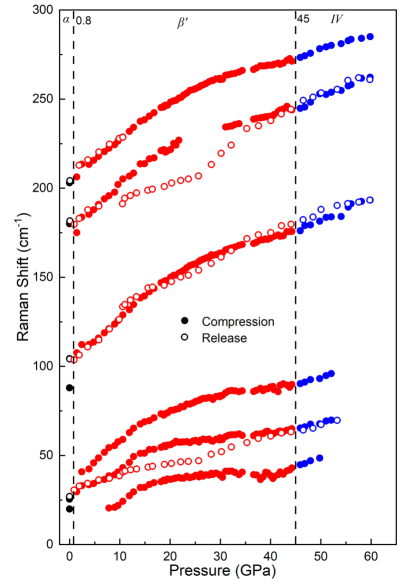
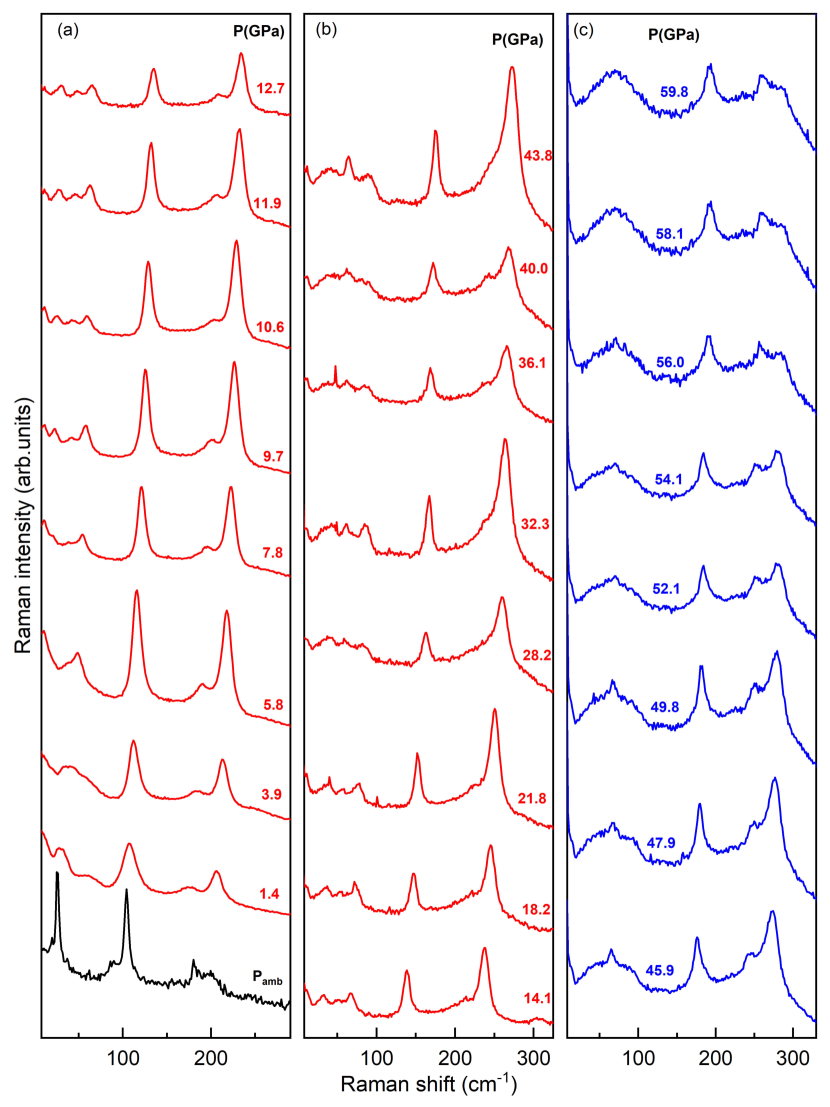
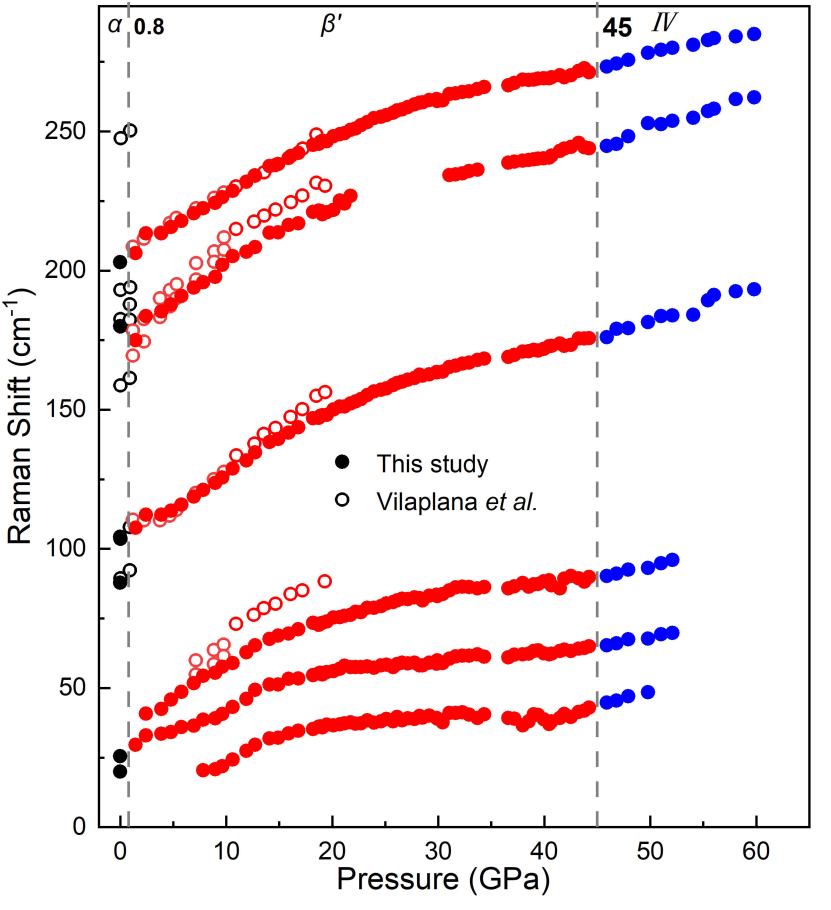
In Fig. S2, the Raman spectrum of In2Se3 at ambient pressure can be attributed to the phase according to Ref. 28. According to group theory (see also table I for Wyckoff positions), the Raman active zone center modes are = +. From the 10 expected modes, the Raman peaks at 104 , 182 and 203 are assigned to the A1 symmetry, while the peak at 27 was assigned to the E symmetry [28]. Figure 1 shows selected high-pressure Raman scattering spectra in different pressure ranges ((a)-(c)), from ambient pressure to 59.8 GPa. Clear spectral changes can be observed above 1.44 GPa, signaling the transition to the phase, in agreement with previous studies [10, 11]. No obvious spectroscopic changes are observed up to 40 GPa, no indication for a subsequent transition from the to the phase was observed. This is further supported by the pressure dependence of the Raman active modes in Fig. 2.
According to group theory, the Raman active zone center modes for the and phases are, = and = , respectively. Thus, a transition to the phase shall be accompanied (in principle) by a reduction of the observed Raman modes. However, in our study, we observe a continuity of both the frequencies and the number of Raman modes. It is plausible to assume that because the Raman system used in Ref. 11 precluded measurements bellow 50 cm-1, an apparent decrease of the number of Raman active modes was observed. In contrast, the ability of our system to record Raman modes up to 10 cm-1 close to the Rayleigh, gives us confidence that there is no spectral discontinuity above 12 GPa and up to 40 GPa.
We also note, a slight discrepancy, of the Raman mode frequencies between our study and Ref. 11 in the 10-20 GPa pressure range. That is, our data consistently show lower frequencies than Ref.11. As previously mentioned, 4:1 meth.-eth. used as PTM in Ref. 11, introduce non-hydrostatic conditions above 10 GPa. Assuming a standard experimental setup, pressure marker placed further form the center, while Raman signal from specimen is probed close to the center, this can be easily understood based on the developed pressure gradient under nonhydrostatic conditions, with higher “real” pressure than the one determined by the marker. Indeed, a slight adjustment of the frequencies of Ref. 11 to higher pressures above 10 GPa, resulting to an overlap between the two datasets.
Above 45 GPa, although the number and the frequencies of the observed Raman modes agree with the ones of -In2Se3, clear spectroscopic changes can be observed. Indeed, a gradual inversion of the relative intensities of the high-frequency Raman modes at 245 and 275 cm-1 is apparent, see Fig. 1(c). We tentatively assign this change to a phase transition towards phase IV, following Ref. 12, with a broad pressure range of coexistence between the -In2Se3 and IV phases.
During decompression, (see Figs. S2-S4), we observed the sequential transformation of In2Se3 to the phase with minima hysteresis. Thus, all pressure-induced phase transitions are reversible at room temperature, consistent with previous studies[11, 12]. A detailed comparison between the Raman spectrum of -In2Se3 after full pressure release with the one before compression (Fig. S2) reveals that, except for the much lower intensity of the peak at 104, all expected active Raman modes (see Ref. 28) are present in the spectrum of the released specimen. An apparent increase of the Raman modes width is indicative of a remaining pressure-induced disorder.
III.2 X-ray diffraction
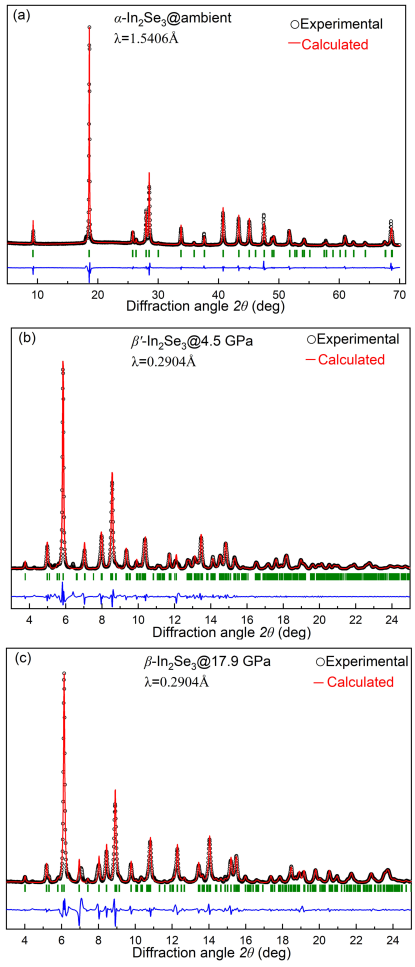
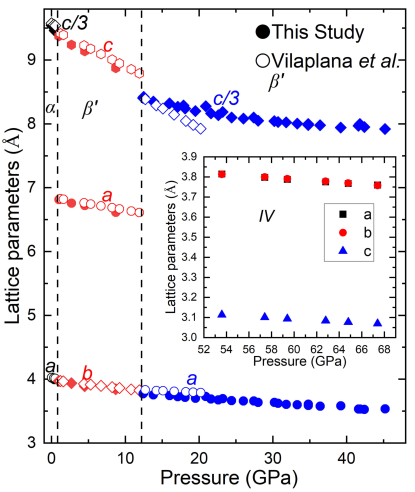
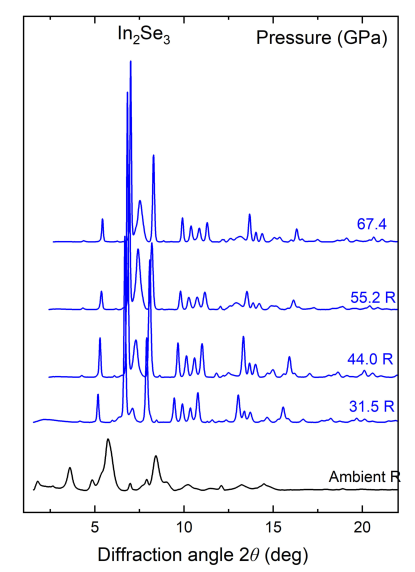
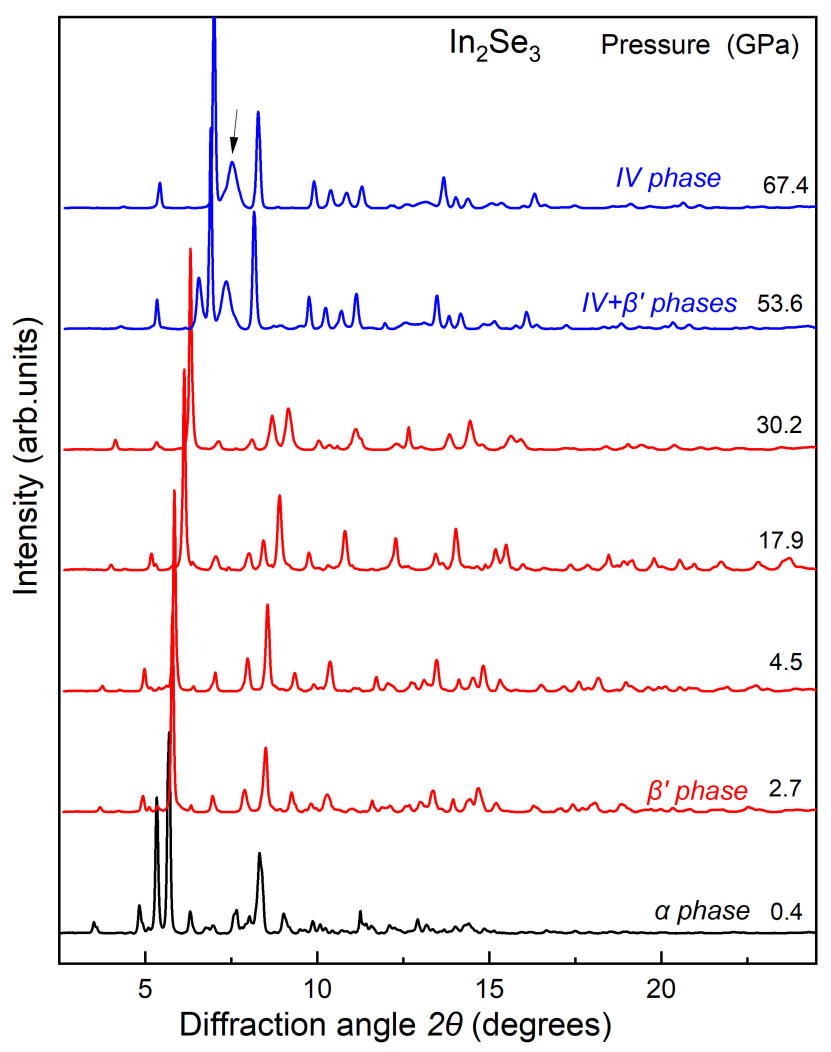
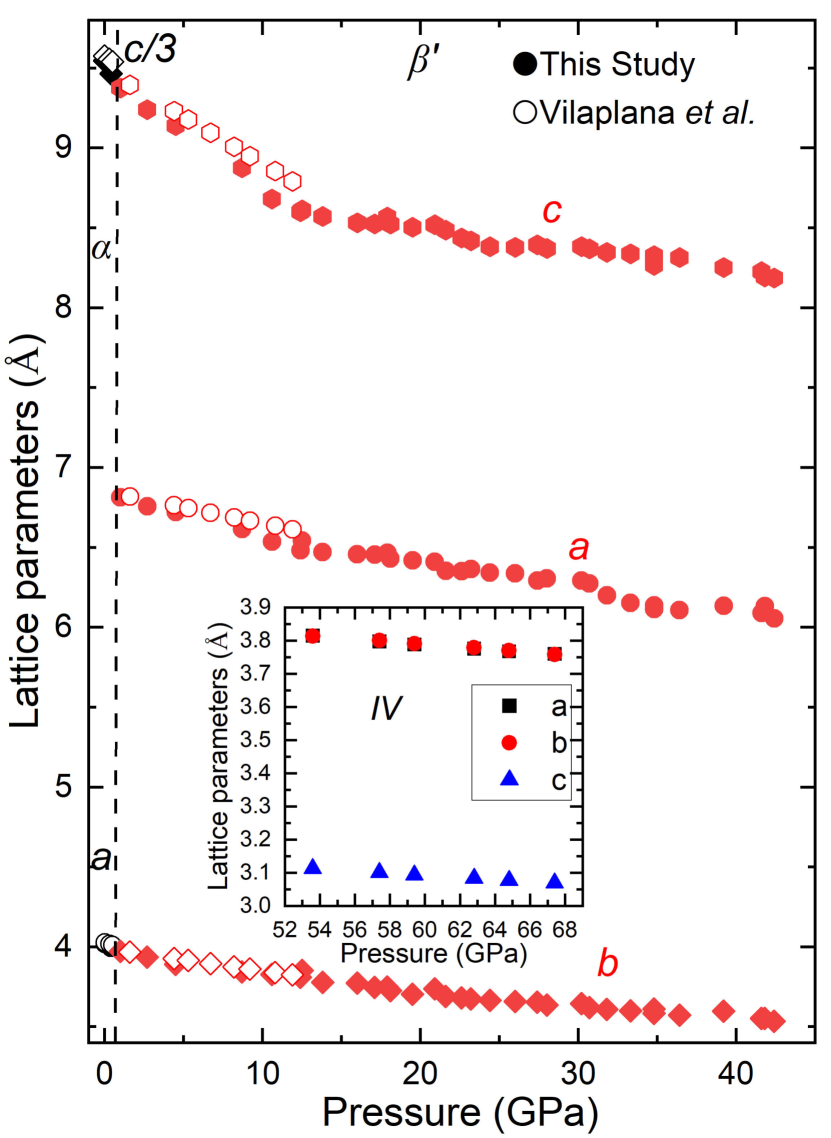
XRD patterns of In2 Se3 at selected pressures upon pressure increase are plotted in Figure 3. A clear pressure-induced phase transition was observed at 1 GPa, in agreement with the Raman results of this study and previous XRD studies [11, 12] and the relevant patterns above 1 GPa can be indexed with the previously reported ’-In2Se3 phase. From the relevant Le Bail refinements of the XRD patterns of this study (see Fig. S5), the lattice parameters and the cell volume for the In2Se3 phases were determined and are plotted in Figs. 4 and 5 and listed in Table I.
| P(GPa) | SG | Z | (Å) | (Å) | (Å) | (Å3) | B(GPa) | B’ | WP |
|---|---|---|---|---|---|---|---|---|---|
| 0.4 | R3m | 3 | 3.994 | 3.994 | 28.397 | 130.77 | In:2x(3a), Se:3x(3a) | ||
| 4.5 | C2m | 2 | 6.721 | 3.890 | 9.140 | 115.55 | 49.2(3) | 5.3(12) | In:(4i), Se:(4i)+(2a) |
| 33.3 | C2m | 2 | 6.153 | 3.600 | 8.338 | 89.764 | In:(4i), Se:(4i)+(2a) | ||
| 62.8 | 3/5 | 3.776 | 3.778 | 3.084 | 73.3 | 221(5) | 8.2(15) |
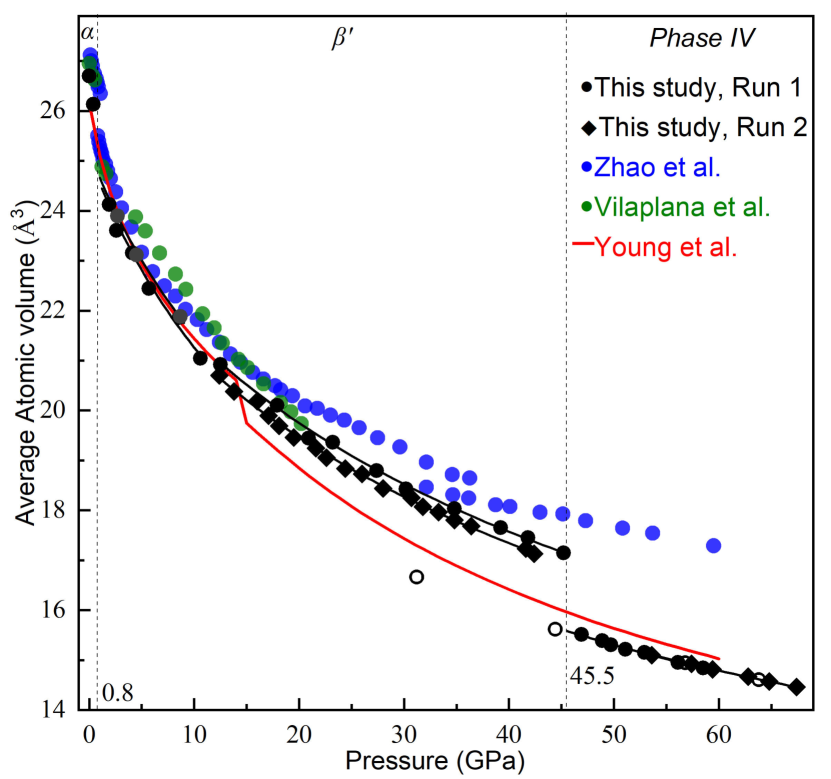
Above 12 GPa, although the XRD patterns could be indexed with the -In2Se3 phase, no clear appearance or disappearance of Bragg peaks was observed. In fact, XRD patterns above 12 GPa can also be indexed using the ’-In2Se3 phase. According to Ref. 11, the transition is characterized by a symmetrization, resulting to a decrease of the observed Bragg peaks, without volume discontinuities, pointing towards a second order transition. Indeed, no volume discontinuities were observed in this study, that could be related to the transition, see Fig. 5.
We also note the difficulty on establishing a definite critical pressure for this phase transition, with a large difference between Ref. 11 (12 GPa) and Ref.12 (5 GPa), although both pressures are inside the hydrostaticity limit of both PTMs used in these studies. A closer look on the space groups of (, #12) and (, #166) phases, reveals that they hold a direct group-subgroup relation, and this further supports the second-order nature of this possible transition. Finally, we note that in Ref. 13 a direct was reported, based on the lower number of observed Bragg peaks, and this further highlights the challenge on distinguishing between the and from XRD alone. Thus, it is plausible to conclude that the indexing of Bragg peaks with the phase is directly related with the resolution of the measured XRD patterns. Nevertheless, for completeness, and most important for direct comparison with Ref. 11, in Fig. S6 we plot the lattice parameters as a function of pressure by adopting the phase above 12 GPa.
Above 45 GPa, the XRD patterns clearly indicate a phase transition, as evident by the appearance and disappearance of Bragg peaks, towards phase IV, in agreement with Ref. 12. The higher critical pressure in this study (45 GPa) than in Ref. 12 (31 GPa), is anticipated based on the difference in the level of hydrostaticity. Moreover, the overall shape (position and intensity) of the observed XRD patterns in this study are in agreement with Ref.12, although a much higher number of Bragg peaks (15 vs 5) are resolved in this study. -In2Se3 (or -In2Se3, see discussion), continues to coexist with phase IV up to, at least, 54 GPa, while only phase IV can be observed at 67.4 GPa, that is the highest pressure of this XRD study. We note that both the coexistence of phases for, at least, 10 GPa and the critical pressure for the phase transition, are in agreement with the Raman spectroscopy results of this study, see Fig. 1(c). Moreover, a broad, amorphous-like feature starts to develop, see the arrow in Fig. 3. According to Zhao , the IV structure was attributed (based on the indexing of 5 observed Bragg peaks) to a cubic defect Th3P4-type BCC-like structure. In this structure, Se atoms occupy the 16c WP, while In atoms occupy the 12c WP, albeit with a 0.88 occupancy, resulting to Z=5.3 and a 2/3 ratio. This structure can index all observed Bragg peaks in the previous study and all, except one low angle peak, Bragg peaks of this study with relatively good agreement between expected and observed intensities. We postpone the evaluation of the validity of this structural assignment for the discussion section of our manuscript.
Upon pressure release, phase IV remains stable up to, at least, 32 GPa, see Fig. S7. Thus, showing considerable hysteresis for the inverse transition to the -In2Se3 phase. This is further supported by the considerable frequency-gap (between corresponding frequencies upon increasing and decreasing pressure) observed at the same pressure range around 30 GPa for few Raman modes upon pressure release, see Fig. S4. Upon full pressure release, the XRD pattern can be indexed with the -In2Se3, albeit with considerable increase of the width of the Bragg peaks width, in agrement with the results from the Raman spectroscopy measurements.
IV Discussion
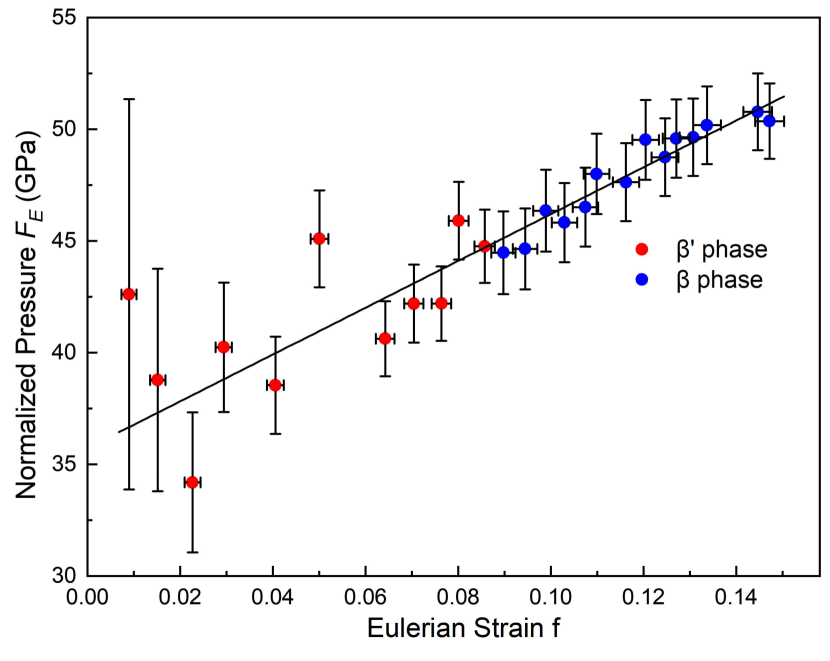
Both the XRD and Raman spectroscopy data of this study clearly indicate the absence of a first-order phase transition between 1 GPa and up to 45 GPa, a transition. In order to further explore the possibility of a subtle structural modification, we performed an additional analysis of the XRD results by plotting the PV data using the finite-strain formalism [29]. The EOS is ideal for probing subtle structural changes that relax the built-up stress of unit cells. Application of the EOS model reveals that pressure-dependent stress exhibits a linear response to the applied strain up to 45 GPa within the established errors; see Fig. 6. Thus, there is no indication of a pressure or strain-induced modification of the ’-In2Se3. Consequently, we conclude that there is no, even a subtle, structural modification of the -In2Se3 phase up to 45 GPa.
As mentioned in the previous section, the IV structure above 45 GPa, was attributed by Zhao to a cubic defect Th3P4-type BCC-like structure. However, this structure is counterintuitive: a) it is well known that pressure promotes compact structures. The overall increase of the coordination number [31] and the formation host-guest structures [32] under pressure being two well-known manifestations of this general intuition and b) The resulted volume/Z for this structure is much higher than the weighted sum (2*In+3*Se) of the elemental volumes at the same pressure according to Young , see Fig.5 , something that points towards compositional instability.
For this reason, we performed an independent indexing, using more than 15 observed Bragg peaks. Surprisingly, the observed Bragg peaks can be well indexed (with a 3-fold higher figure of merit (FOM) than the cubic structure) with a low-volume orthorhombic structure. Most importantly, a low intensity peak at 4.3 deg cannot be indexed with the cubic defect Th3P4-type structure, while it was indexed with the orthorhombic structure. The volume of this orthorhombic structure (43.52 Å3 at 67 GPa) points towards a crystal structure with 3 atoms per primitive unit cell. Based on the In2Se3 expected stoichiometry, this structure can only be explained by the formation of a solid solution with an occupancy of 0.4 and 0.6 of the relevant crystallographic positions by In and Se, respectively. The formation of a solid solution is qualitatively in agreement with the case of Bi2Ti3 under pressure [33, 34], that has practically identical structure with In2Se3 at ambient conditions. Indeed, Bi2Te3 forms a simple BCC solid solution above 20 GPa. The higher atomic numbers of Bi and Te compared to In and Se can explain the higher pressure needed for the formation of a solid solution in the case of In2Se3. Unfortunately, we were not able to find a previously reported relevant structural type (oP3) that fits the unit cell used for indexing, something that points towards a new topology. Further studies, including theoretical calculations, are needed to elucidate the exact structure of phase IV.
Finally, we tentatively assign the broad (amorphous-like) XRD peak (at 7.5 deg, see Fig. 3) that appears in the XRD patterns of the IV phase, to a partial amorphization of In2Se3 above this pressure. This might be related to the formation of the disorder solid-solution IV phase. We have also considered the possibility of a, even partial, decomposition of In2Se3 at this pressure. However, the continuity of the observed Raman peaks throughout the transition; see Figs. 2 and 3, rules out this possibility.
V Conclusion
According to the results of both Raman spectroscopy and the XRD techniques used in this study, -In2Se3 undergoes a phase transition at 1 GPa towards the previously reported -In2Se3 phase. In contrast to the previous studies, we conclude that this phase remains stable up to 45 GPa, at a pressure that another pressure-induced phase transition is observed towards phase IV. Based on XRD patterns indexing and atomic volumes arguments, we conclude that phase IV is a disordered solid-solution-like orthorhombic structure.
Acknowledgements.
S.F. and C.W. acknowledges support from the Graduate scholarships of the Guangdong Provincial Key Laboratory of Materials and Technologies for Energy Conversion. The work performed at GTIIT was supported by funding from the Guangdong Technion Israel Institute of Technology and the Guangdong Provincial Key Laboratory of Materials and Technologies for Energy Conversion, MATEC (No. MATEC2022KF001). Beamline 12.2.2 at the Advanced Light Source is a DOE Office of Science User Facility under contract no. DE-AC02-05CH11231. Part of the synchrotron radiation experiments were performed at BL10XU of SPring-8 with the approval of the Japan Synchrotron Radiation Research Institute (JASRI) (Proposal Nos. 2024A1096 and 2024B1182). We also acknowledge DESY (Hamburg, Germany), a member of the Helmholtz Association HGF, for the provision of experimental facilities. Parts of this research were carried out at PETRA III beamline P02.2.AUTHOR DECLARATIONS
Conflict of Interest
The authors have no conflicts to disclose.
DATA AVAILABILITY
The data that support the findings of this study are available from the corresponding author upon reasonable request.
References
- Mas-Balleste et al. [2011] R. Mas-Balleste, C. Gomez-Navarro, J. Gomez-Herrero, and F. Zamora, “2D materials: to graphene and beyond,” Nanoscale 3, 20–30 (2011).
- Mukherjee et al. [2020] S. Mukherjee, D. Dutta, P. K. Mohapatra, L. Dezanashvili, A. Ismach, and E. Koren, “Scalable integration of coplanar heterojunction monolithic devices on two-dimensional In2Se3,” ACS nano 14, 17543–17553 (2020).
- Senapati and Maiti [2020] S. Senapati and P. Maiti, “Emerging bio-applications of two-dimensional nanoheterostructure materials,” in 2D nanoscale heterostructured materials (Elsevier, 2020) pp. 243–255.
- Dutta et al. [2021] D. Dutta, S. Mukherjee, M. Uzhansky, and E. Koren, “Cross-field optoelectronic modulation via inter-coupled ferroelectricity in 2D In2Se3,” npj 2D Materials and Applications 5, 81 (2021).
- Ding et al. [2017] W. Ding, J. Zhu, Z. Wang, Y. Gao, D. Xiao, Y. Gu, Z. Zhang, and W. Zhu, “Prediction of intrinsic two-dimensional ferroelectrics in In2Se3 and other III2-VI3 van der waals materials,” Nat. commun. 8, 14956 (2017).
- Mukherjee and Koren [2022] S. Mukherjee and E. Koren, “Indium selenide (In2Se3) – an emerging van‐der‐waals material for photodetection and non‐volatile memory applications,” Isr. J. Chem. 62 (2022).
- Efthimiopoulos et al. [2023] I. Efthimiopoulos, E. Stavrou, K. Umemoto, S. Mayanna, A. Torode, J. S. Smith, S. Chariton, V. B. Prakapenka, A. F. Goncharov, and Y. Wang, “High-pressure phase of cold-compressed bulk graphite and graphene nanoplatelets,” Phys. Rev. B 107, 184102 (2023).
- Nayak et al. [2014] A. P. Nayak, S. Bhattacharyya, J. Zhu, J. Liu, X. Wu, T. Pandey, C. Jin, A. K. Singh, D. Akinwande, and J.-F. Lin, “Pressure-induced semiconducting to metallic transition in multilayered molybdenum disulphide,” Nature Communications 5, 3731 (2014).
- Chi et al. [2014] Z.-H. Chi, X.-M. Zhao, H. Zhang, A. F. Goncharov, S. S. Lobanov, T. Kagayama, M. Sakata, and X.-J. Chen, “Pressure-induced metallization of molybdenum disulfide,” Phys. Rev. Lett. 113, 036802 (2014).
- Liang et al. [2020] J. Liang, H. Jin, J. Zhang, and X. Chen, “Structural evolution of β’-In2Se3under pressure,” J. Phys.: Conf. Ser. 1622, 012027 (2020).
- Vilaplana et al. [2018] R. Vilaplana, S. G. Parra, A. Jorge-Montero, P. Rodríguez-Hernández, A. Munoz, D. Errandonea, A. Segura, and F. J. Manjón, “Experimental and theoretical studies on α-In2Se3 at high pressure,” Inorg. Chem. 57, 8241–8252 (2018).
- Zhao and Yang [2014] J. Zhao and L. Yang, “Structure evolutions and metallic transitions in In2Se3 under high pressure,” J. Phys. Chem. C 118, 5445–5452 (2014).
- Rasmussen et al. [2013] A. M. Rasmussen, S. T. Teklemichael, E. Mafi, Y. Gu, and M. D. McCluskey, “Pressure-induced phase transformation of In2Se3,” Appl. Phys. Lett. 102, 062105 (2013).
- Klotz et al. [2009] S. Klotz, J. Chervin, P. Munsch, and G. Le Marchand, “Hydrostatic limits of 11 pressure transmitting media,” J. Phys. D: Appl. Phys. 42, 075413 (2009).
- Hinton et al. [2019] J. K. Hinton, S. M. Clarke, B. A. Steele, I.-F. W. Kuo, E. Greenberg, V. B. Prakapenka, M. Kunz, M. P. Kroonblawd, and E. Stavrou, “Effects of pressure on the structure and lattice dynamics of α-glycine: a combined experimental and theoretical study,” CrystEngComm 21, 4457–4464 (2019).
- Syassen [2008] K. Syassen, “Ruby under pressure,” High Pressure Research 28, 75–126 (2008).
- Anderson, Isaak, and Yamamoto [1989] O. L. Anderson, D. G. Isaak, and S. Yamamoto, “Anharmonicity and the equation of state for gold,” J. Appl. Phys. 65, 1534–1543 (1989).
- Kunz et al. [2005] M. Kunz, A. MacDowell, W. Caldwell, D. Cambie, R. Celestre, E. Domning, R. Duarte, A. Gleason, J. Glossinger, N. Kelez, D. Plate, T. Yu, J. Zaug, H. Padmore, R. Jeanloz, A. Alivisatos, and S. Clark, “A beamline for high-pressure studies at the advanced light source with a superconducting bending magnet as the source,” J. Synchrotron Radiat. 12, 650 (2005).
- Kawaguchi-Imada et al. [2024] S. Kawaguchi-Imada, R. Sinmyo, K. Ohta, S. Kawaguchi, and T. Kobayashi, “Submillisecond in situ x-ray diffraction measurement system with changing temperature and pressure using diamond anvil cells at BL10XU/SPring-8.” J. Synchrotron Radiat. 31, 343–354 (2024).
- Prescher and Prakapenka [2015] C. Prescher and V. B. Prakapenka, “Dioptas: a program for reduction of two-dimensional x-ray diffraction data and data exploration,” High Pres. Res. 35, 223–230 (2015).
- Kraus and Nolze [1996] W. Kraus and G. Nolze, “POWDER CELL – a program for the representation and manipulation of crystal structures and calculation of the resulting X-ray powder patterns,” J. Appl. Crystallogr. 29, 301–303 (1996).
- Boultif and Louër [2004] A. Boultif and D. Louër, “Powder pattern indexing with the dichotomy method,” J. Appl. Crystallogr. 37, 724–731 (2004).
- Toby and Von Dreele [2013] B. H. Toby and R. B. Von Dreele, “GSAS-II: the genesis of a modern open-source all purpose crystallography software package,” Journal of Applied Crystallography 46, 544–549 (2013).
- Zhang et al. [2023] X. Zhang, L. Dai, H. Hu, M. Hong, and C. Li, “Pressure-induced reversible structural phase transitions and metallization in GeTe under hydrostatic and non-hydrostatic environments up to 22.9 GPa,” J. Non-Cryst. Solids 618, 122516 (2023).
- Guńka et al. [2021] P. A. Guńka, A. Olejniczak, S. Fanetti, R. Bini, I. E. Collings, V. Svitlyk, and K. F. Dziubek, “Crystal structure and non‐hydrostatic stress‐induced phase transition of urotropine under high pressure,” Chemistry–A European Journal 27, 1094–1102 (2021).
- Barreda-Argüeso et al. [2013] J. A. Barreda-Argüeso, S. López-Moreno, M. N. Sanz-Ortiz, F. Aguado, R. Valiente, J. González, F. Rodríguez, A. H. Romero, A. Muñoz, and L. Nataf, “Pressure-induced phase-transition sequence in CoF2: An experimental and first-principles study on the crystal, vibrational, and electronic properties,” Physical Review B 88, 214108 (2013).
- Vos, Van Hinsberg, and Schouten [1990] W. L. Vos, M. G. Van Hinsberg, and J. A. Schouten, “High-pressure triple point in helium: The melting line of helium up to 240 kbar,” Physical Review B 42, 6106 (1990).
- Lewandowska et al. [2001] R. Lewandowska, R. Bacewicz, J. Filipowicz, and W. Paszkowicz, “Raman scattering in α-In2Se3 crystals,” Materials Research Bulletin 36, 2577–2583 (2001).
- Birch [1947] F. Birch, “Finite elastic strain of cubic crystals,” Phys. Rev. 71, 809–824 (1947).
- Young et al. [2016] D. A. Young, H. Cynn, P. Söderlind, and A. Landa, “Zero-Kelvin compression isotherms of the elements 1 Z 92 to 100 GPa,” Journal of Physical and Chemical Reference Data 45, 043101 (2016).
- Stavrou et al. [2016] E. Stavrou, Y. Yao, A. F. Goncharov, Z. Konôpková, and C. Raptis, “High-pressure structural study of MnF2,” Phys. Rev. B 93, 054101 (2016).
- McMahon et al. [2006] M. I. McMahon, R. J. Nelmes, U. Schwarz, and K. Syassen, “Composite incommensurate K-III and a commensurate form: Study of a high-pressure phase of potassium,” Phys. Rev. B 74, 140102 (2006).
- Zhu et al. [2011] L. Zhu, H. Wang, Y. Wang, J. Lv, Y. Ma, Q. Cui, Y. Ma, and G. Zou, “Substitutional Alloy of Bi and Te at High Pressure,” Phys. Rev. Lett. 106, 145501 (2011).
- Einaga et al. [2011] M. Einaga, A. Ohmura, A. Nakayama, F. Ishikawa, Y. Yamada, and S. Nakano, “Pressure-induced phase transition of Bi2Te3 to a bcc structure,” Phys. Rev. B 83, 092102 (2011).
Supplementary material for “High pressure structural and lattice dynamics study of -In2Se3”