The Emperor’s New Arc: gigaparsec patterns abound in a CDM universe
Abstract
Recent discoveries of apparent large-scale features in the structure of the universe extending over many hundreds of megaparsecs, have been claimed to contradict the large-scale isotropy and homogeneity foundational to the standard (CDM) cosmological model. We explicitly test and refute this conjecture using FLAMINGO-10K, a new and very large cosmological simulation of the growth of structure in a CDM context. Applying the same methods used in the observations, we show that patterns like the “Giant Arc”, supposedly in tension with the standard model, are, in fact, common and expected in a CDM universe. We also show that their reported significant overdensities are an algorithmic artefact and unlikely to reflect any underlying structure.
keywords:
large-scale structure of Universe, cosmology: theory, methods: numerical, methods: statistical1 Introduction
The standard paradigm of hierarchical structure formation predicts that the Universe, while highly inhomogeneous on the scales of galaxies and galaxy clusters, is statistically homogeneous on very large scales (Davis et al., 1985). Structures extending to several hundred comoving Megaparsecs (Mpc) have long been observed (Huchra & Geller, 1982; Gott et al., 1989). Simulations in the CDM context have since shown that similar features are also predicted to exist in the standard model (White et al., 1987; Springel et al., 2005; Park et al., 2012; Schaller, 2024) and are, in fact, required to explain the observed large-scale distribution of galaxies (e.g. Sawala et al., 2024). It is worth noting that not all previous claims of large-scale inhomogeneities have persisted: the “Giant Ring of Gamma Ray Bursts” (Balázs et al., 2015) was subsequently shown to be statistically insignificant (Balázs et al., 2018), while the reported gigaparsec-scale agglomerations of quasars (Clowes et al., 2013) were shown by several authors to be consistent with random fluctuations (Nadathur, 2013; Park et al., 2015; Fujii, 2024) and compatible with CDM expectations (Marinello et al., 2016).
Recently, the discoveries of two more gigaparsec-scale patterns, the “Giant Arc” (Lopez et al., 2022) and the “Big Ring” (Lopez et al., 2024b), have again been interpreted as invalidating the standard model (e.g. Kumar Aluri et al., 2023; Lopez et al., 2024a) or as signatures of non-standard physics (e.g. Lapi et al., 2023; Constantin et al., 2023; Mazurenko et al., 2025). This is partly motivated by the notion of a definite homogeneity scale of Mpc (Yadav et al., 2010) beyond which any structures would be in tension with the standard model.
We use a new, extremely large cosmological simulation of structure formation in CDM, FLAMINGO-10K (Schaller et al., in prep.; see also Pizzati et al., 2024), to test directly the claim that the existence of features like the“Giant Arc” contradicts CDM and that its reported overdensity violates the assumption of large-scale homogeneity upon which the standard model is based.
2 The“Giant Arc”
The “Giant Arc” was serendipitously discovered from a total sample of 63,876 Mg\scaleto1.2ex absorbers, originally constructed from the catalogue of Zhu & Ménard (2013) paired with SDSS DR7 and DR12 quasars, and later identified using a Friends-of-Friends (FoF) algorithm (Lopez et al., 2022). In their analysis, Lopez et al. considered a subvolume of cMpc3 in a redshift interval of containing 504 absorbers. The central redshift, depth of the slice, and linking length of 95 cMpc were all specifically chosen to obtain the clearest identification of the“Giant Arc” which, with these parameters, contains 44 members.
To ascertain the physical nature and significance of their discovery, Lopez et al. (2022) applied several statistical tests. They applied the FoF search to 1000 samples with randomised redshifts but did not find another pattern as significant as the “Giant Arc”, inferring a probability of of such a pattern arising at random. Additionally, they computed the convex-hull overdensity of the “Giant Arc”, and compared it to overdensities of randomised point samples, attributing a significance to their structure. We will show that the probability of finding similar structures in both CDM and in random patterns is much greater than claimed, while the significance of the associated point overdensity is much lower.
3 The FLAMINGO-10K simulation
To identify possible counterparts to the“Giant Arc” in CDM, we consider FLAMINGO-10K, a simulation that follows collisionless CDM and neutrino particles ( particles in total) in a periodic volume of cGpc3, with cosmological parameters , , , , , and . FLAMINGO-10K was performed using the SWIFT simulation code (Schaller et al., 2024) and is part of the FLAMINGO suite (see Schaye et al. (2023) for a complete description), using the same phases as their flagship L2p8_m9 hydrodynamical simulation but with 8 more collisionless particles.
For comparison to the“Giant Arc”, we use the output at , the closest for which the full particle data are available, but we also examine different outputs between and . From the outputs, self-bound subhaloes were identified in the simulation using the HBT+ (Hierarchical Bound-Tracing) algorithm (Han et al. 2018; Forouhar Moreno et al., in prep.). As analogues of the Mg\scaleto1.2ex absorbers, we consider subhaloes in the mass range –, of which FLAMINGO-10K contains at . This mass range brackets results of studies based on clustering strength at similar redshifts (e.g. Lundgren et al., 2011; Gauthier et al., 2014). The precise halo masses of Mg\scaleto1.2ex absorbers are not known, but as we will discuss, our results are not sensitive to the assumed mass.
The number density of subhaloes in this mass range in FLAMINGO-10K is Mpc-3, about the density of Mg\scaleto1.2ex absorbers in the slice of Lopez et al. (2022), which were selected on the basis of a (random) association with background quasars. To mimic this selection, we draw random subsamples of subhaloes with the same number density. To provide a baseline for the amount of structures found in the simulation, we follow Nadathur (2013) and construct random (Poisson) point patterns of equal density.
4 Structure Finding
To identify extended structures in the simulation, we follow Lopez et al. and apply a Friends-of-Friends algorithm (Huchra & Geller, 1982; Davis et al., 1985), i.e. a hierarchical single-link clustering algorithm with a Euclidean distance metric and the linking length as a free parameter. In the more familiar application of finding collapsed objects in cosmological simulations, a canonical linking length of the mean interparticle distance is used. In general, the amount and type of structures found using a FoF algorithm are very sensitive to the relation between the linking length and the interparticle distance: a linking length that is too small results in the breakup of structures, while a linking length that is too large results in points being linked together independently of any underlying correlation.
The redshift slice examined in Lopez et al. (2022) has a volume of Gpc3 and a mean point density of Gpc-3, corresponding to a mean interparticle distance Mpc. The fact that both the mean interparticle distance and the linking length (95 Mpc) are similar to the shortest dimension of the slice (338 Mpc), but much smaller than its other two dimensions makes the geometry of the slice an important factor. Most points are separated by less than one linking length from either face of the slice, and any structures resembling the “Giant Arc” will be much longer than its shortest dimension. This largely restricts such structures to two dimensions, which also makes them, by definition, highly anisotropic.
For a direct comparison, we must therefore not only adapt the same redshift, point density and linking length, but also consider equally thin slices of the FLAMINGO-10K volume (or random point patterns). Specifically, we examine slices containing 1588 points within Mpc3 along each of the three orientations of the FLAMINGO-10K volume. We exclude structures separated by less than one linking length from any side of the box.
To characterise identified structures, we consider the membership number, , and compute their extent or length, , which we define as the maximum pairwise point distance. We also compute the point overdensity, , for which we calculate the density of the convex hull that encloses spheres of radius equal to the mean distance of the points belonging to the structure, centred on all member points (Clowes et al., 2012). In addition, we use the simulation particle data to compute the matter overdensity, , within the same convex hulls.
We characterise the shape or anisotropy of structures according to the ratio between the square roots of the second-largest and largest eigenvalues of their covariance matrix, . Structures that extend along only one dimension, i.e. arcs or filaments, have one dominant eigenvalue, i.e. (due to the particular geometry, for the extended structures we discuss here, by construction).
For the“Giant Arc”, only the membership number and overdensity () are reported, the latter computed in the same way as our point overdensity, . The extent of the“Giant Arc” is only described as “approximately 1 Gpc”. Based on Lopez et al. (2022), we are able to measure its projected extent as Mpc. Because its depth is at most equal to that of the slice, 338 Mpc, its true extent, by our definition, is at least Mpc and at most Mpc.
5 Structures in FLAMINGO-10K
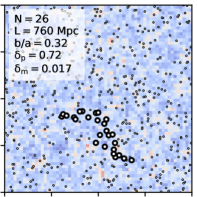
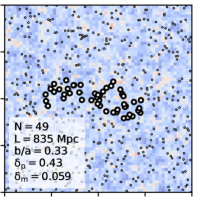
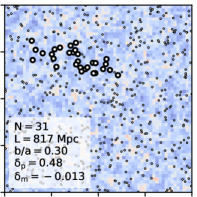
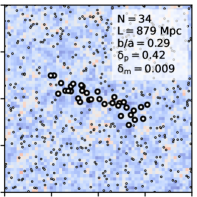
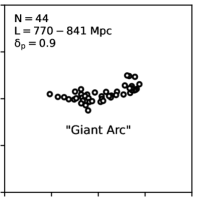
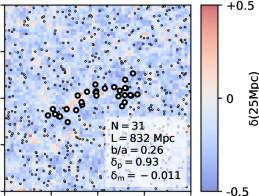
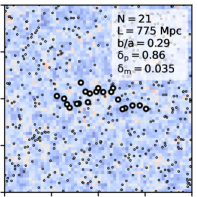
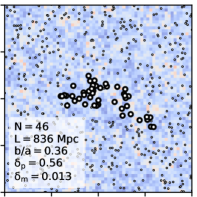
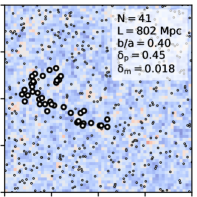
We find that“Giant Arc” -like structures are very common features in FLAMINGO-10K. In Figure 1, we show the“Giant Arc” alongside eight examples of similarly extended structures found in the first random sampling seed of the FLAMINGO-10K simulation. All eight structures are disjoint from one another, i.e. no point belonging to any structure is contained in any other. All eight have extents greater than 750 Mpc, contain more than 20 members, and all have point overdensities, , above 0.4. While no structure in FLAMINGO-10K is an exact copy of the“Giant Arc” (just as no two structures are exact copies of one another), the“Giant Arc” evidently has many counterparts in a FLAMINGO-10K-like CDM volume.
5.1 Structure persistence
The greater number density of possible Mg\scaleto1.2ex absorbers in FLAMINGO-10K compared to the Lopez et al. (2022) sample allows us to construct independent samples of the full population. This enables us to both extend our statistics and test whether any structure identified in one subsample persists in other subsamples. Structures identified from one sample that persist in other samples of the same volume indicate a real underlying structure, while structures that are only identified in one subsample indicate a spurious pattern.
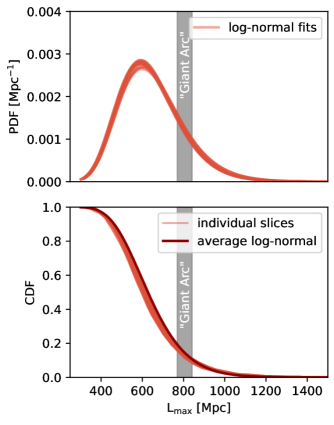
In Figure 2, we show the probability density function (PDF, top) and cumulative distribution function (CDF, bottom) of the length of the longest structures satisfying found within random subsamples in 21 non-overlapping slices of FLAMINGO-10K. We find that the distributions for the length of the longest structures per slice are well approximated by a single log-normal distribution.
Almost every sample of every slice contains at least one structure longer than Mpc, while the typical (median) length of the longest structure found in one random sample of any slice in FLAMINGO-10K is Mpc. Approximately and of samples contain at least one structure longer than the lower and upper limits for the extent of the “Giant Arc”, respectively. Even accounting for the larger volume compared to that examined by Lopez et al. (2022), thin structures as extended as the “Giant Arc” are very common in FLAMINGO-10K.
We also find that, in any given slice, different random subsamples of the underlying subhalo population lead to completely different structures, but the PDFs of maximum lengths across different slices are very similar. “Giant-Arc” analogues are not only common, but largely spurious, rather than real underlying structures.
5.2 Sensitivity to the linking length
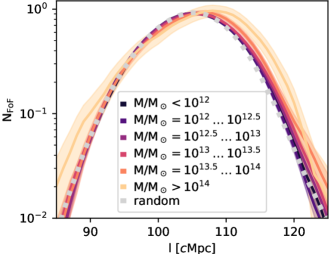
The number of structures identified with a Friends-of-Friends algorithm is expected to depend on the linking length. In Figure 3, we show the average number of “Giant Arc” analogues per slice, either in samples of subhaloes of different masses in FLAMINGO-10K at (coloured lines), or in random point samples (grey), as a function of linking length. We find that the number of structures is very sensitive to the linking length, and that for all but the highest subhalo masses, the number found in FLAMINGO-10K is very similar to that in random point samples. Notably, the linking length originally chosen to detect the “Giant Arc” by Lopez et al. (2022), Mpc, is close to the one that maximises the number of structures identified in both the simulation and in random point patterns.
5.3 Overdensities
As shown in Figure 1, structures resembling the “Giant Arc” in FLAMINGO-10K often have point overdensities, , of order unity, and comparable to the stated overdensity of the “Giant Arc” (). Physical overdensities of order unity on these scales would certainly be inconsistent with the CDM model. However, for the same structures, we find matter overdensities, , of at most a few percent, and in some cases, even slight underdensities.
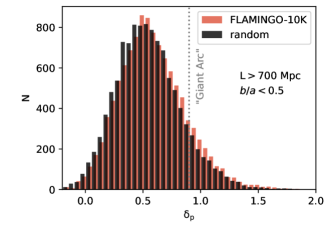
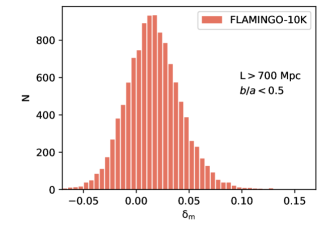
In the top panel of Figure 4, we show histograms of the point overdensities, , of extended structures in FLAMINGO-10K and in random samples. Structures in FLAMINGO-10 are very slightly denser than those in random point patterns. Both sets are clearly overdense, and the point overdensity of the “Giant Arc” is not exceptional, ranking in the and percentiles among structures in FLAMINGO-10K and random patterns, respectively. This contradicts the statement by Lopez et al. (2022), who found that its convex hull overdensity represents a “4.5 outlier”. The difference most likely arises from the fact that, while Lopez et al. considered the density of convex hulls enclosing points randomly distributed within the slice, we consider the volumes that enclose points already identified as belonging to Friends-of-Friends structures of extent similar to the “Giant Arc”. Groups selected like the “Giant Arc”, with a linking length below the mean interparticle distance, are overdense almost by definition.
In the bottom panel of Figure 4, we show the distribution of matter overdensities, , for the same structures in FLAMINGO-10K. Despite point overdensities of order unity, the average matter overdensity in these structures is only slightly above zero. Our results strongly suggest that this also applies to the region of the Universe that contains the “Giant Arc”.
5.4 Scale-and time dependent number of structures
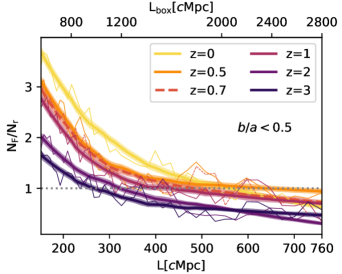
In Figure 5, we show the number of extended structures of different scales and at different redshifts in slices of the FLAMINGO-10K simulation, normalised by the corresponding numbers in random point patterns. For consistency, for the largest slices, we choose the default parameters for the volume, Mpc3, number of points, , and linking length, Mpc, but note that these provide a rather arbitrary anchor point.
To identify structures at different scales, we set a minimum extent of , corresponding to Mpc for the largest slice ( of slices contain such structures). For all smaller scales, we change all three dimensions of the slice and the linking length proportionally, maintaining a constant geometry, constant number of points, and constant ratio of the linking length to the mean interparticle separation. In this setup, the average number of structures found in random point patterns is constant and serves as a normalisation.
In the paradigm of hierarchical structure formation, the number of structures is both time- and scale dependent. As expected, we find relatively more structures at later times (lower ) and on smaller scales in FLAMINGO-10K. However, even where the number of structures found in the simulation is the same or below that of random samples, it never decreases to zero: the CDM model predicts structures at all times and on all scales.
6 Summary
Observed patterns like the “Giant Arc” do not contradict the CDM paradigm. Applying the same detection algorithm with the same parameters assumed by Lopez et al. (2022) for their sample of Mg\scaleto1.2ex absorbers to corresponding samples of subhaloes at the same redshift, the FLAMINGO-10K simulation contains many structures that are as extended, thin, and appear as overdense as the “Giant Arc”. Its reported overdensity holds no additional significance: FoF-groups resembling the “Giant Arc” naturally possess a large points overdensity, but this does not translate into an underlying matter overdensity. Considering that the sample of Mg\scaleto1.2ex absorbers only represents one of many possible, extremely sparse samples of the underlying galaxy population, and that similar structures are found in random point samples, there is no reason to believe that the “Giant Arc” traces any underlying structure in the Universe.
We hope that our results will dispel the misconception that no inhomogeneity can be found in the standard model Universe beyond some finite size. Instead, any given realisation of the isotropic universe comprises a time- and scale-dependent population of structures from which patterns can be identified on any scale.
Structures in FLAMINGO-10K that resemble the “Giant Arc” are not collapsed, gravitationally bound, or even particularly overdense. Our results strongly suggest that the same applies to the “Giant Arc” and other similarly large agglomerations. Without these physical characteristics commonly associated with cosmic structures, it may be more appropriate to term them “patterns” rather than structures.
Quantifying the frequency of direct counterparts to the “Giant Arc” has been complicated by the fact that both the precise volume and the parameters of the identification algorithm were defined post-hoc, with the explicit goal of obtaining the clearest detection of a previously identified structure. For consistency, we adopt the same parameters, but this strategy clearly entails a significant look-elsewhere effect. However, the fact that we find so many counterparts in FLAMINGO-10K even with these particular parameters clearly demonstrates that its discovery is fully consistent with the standard model.
Data Availability Statement
The script used to produce all figures and numbers presented in this work is available at https://github.com/TillSawala/GiantArc. Access to the underlying simulation data will be provided on reasonable request to the authors.
Acknowledgements
TS and GR acknowledge support from Academy of Finland grant 354905, and TS and MT acknowledge support from Academy of Finland grant 339127. TS and CSF acknowledge support from European Research Council (ERC) Advanced Grant DMIDAS (GA 786910). GR acknowledges support from European Research Council (ERC) Consolidator Grant KETJU (GA 818930). This work used the DiRAC@Durham facility managed by the ICC, with support from BEIS via STFC capital grants ST/K00042X/1, ST/P002293/1, ST/R002371/1 and ST/S002502/1, and STFC operations grant ST/R000832/1. This work used the DiRAC Memory Intensive service (Cosma8) at the University of Durham, which is part of the STFC DiRAC HPC Facility (www.dirac.ac.uk). Access to DiRAC resources was granted through a Director’s Discretionary Time allocation in 2023/24, under the auspices of the UKRI-funded DiRAC Federation Project. We used open source software, including Matplotlib (Hunter, 2007), SciPy (Virtanen et al., 2020), Scikit-learn (Pedregosa et al., 2011) and NumPy (Harris et al., 2020).
References
- Balázs et al. (2015) Balázs L. G., Bagoly Z., Hakkila J. E., Horváth I., Kóbori J., Rácz I. I., Tóth L. V., 2015, MNRAS, 452, 2236
- Balázs et al. (2018) Balázs L. G., Rejtő L., Tusnády G., 2018, MNRAS, 473, 3169
- Clowes et al. (2012) Clowes R. G., Campusano L. E., Graham M. J., Söchting I. K., 2012, MNRAS, 419, 556
- Clowes et al. (2013) Clowes R. G., Harris K. A., Raghunathan S., Campusano L. E., Söchting I. K., Graham M. J., 2013, MNRAS, 429, 2910
- Constantin et al. (2023) Constantin A., Harvey T. R., von Hausegger S., Lukas A., 2023, Classical and Quantum Gravity, 40, 245015
- Davis et al. (1985) Davis M., Efstathiou G., Frenk C. S., White S. D. M., 1985, ApJ, 292, 371
- Fujii (2024) Fujii H., 2024, MNRAS, 527, 1982
- Gauthier et al. (2014) Gauthier J.-R., Chen H.-W., Cooksey K. L., Simcoe R. A., Seyffert E. N., O’Meara J. M., 2014, MNRAS, 439, 342
- Gott et al. (1989) Gott J. Richard I., et al., 1989, ApJ, 340, 625
- Han et al. (2018) Han J., Cole S., Frenk C. S., Benitez-Llambay A., Helly J., 2018, MNRAS, 474, 604
- Harris et al. (2020) Harris C. R., et al., 2020, Nature, 585, 357
- Huchra & Geller (1982) Huchra J. P., Geller M. J., 1982, ApJ, 257, 423
- Hunter (2007) Hunter J. D., 2007, Computing in Science & Engineering, 9, 90
- Kumar Aluri et al. (2023) Kumar Aluri P., et al., 2023, Classical and Quantum Gravity, 40, 094001
- Lapi et al. (2023) Lapi A., Boco L., Cueli M. M., Haridasu B. S., Ronconi T., Baccigalupi C., Danese L., 2023, ApJ, 959, 83
- Lopez et al. (2022) Lopez A. M., Clowes R. G., Williger G. M., 2022, MNRAS, 516, 1557
- Lopez et al. (2024a) Lopez A. M., Clowes R. G., Williger G. M., 2024a, arXiv e-prints, p. arXiv:2409.14894
- Lopez et al. (2024b) Lopez A. M., Clowes R. G., Williger G. M., 2024b, J. Cosmology Astropart. Phys., 2024, 055
- Lundgren et al. (2011) Lundgren B. F., Wake D. A., Padmanabhan N., Coil A., York D. G., 2011, MNRAS, 417, 304
- Marinello et al. (2016) Marinello G. E., Clowes R. G., Campusano L. E., Williger G. M., Söchting I. K., Graham M. J., 2016, MNRAS, 461, 2267
- Mazurenko et al. (2025) Mazurenko S., Banik I., Kroupa P., 2025, MNRAS, 536, 3232
- Nadathur (2013) Nadathur S., 2013, MNRAS, 434, 398
- Park et al. (2012) Park C., Choi Y.-Y., Kim J., Gott J. Richard I., Kim S. S., Kim K.-S., 2012, ApJ, 759, L7
- Park et al. (2015) Park C., Song H., Einasto M., Lietzen H., Heinamaki P., 2015, Journal of Korean Astronomical Society, 48, 75
- Pedregosa et al. (2011) Pedregosa F., et al., 2011, Journal of Machine Learning Research, 12, 2825
- Pizzati et al. (2024) Pizzati E., et al., 2024, MNRAS, 534, 3155
- Sawala et al. (2024) Sawala T., Frenk C., Jasche J., Johansson P. H., Lavaux G., 2024, Nature Astronomy, 8, 247
- Schaller (2024) Schaller M., 2024, MNRAS, 529, L23
- Schaller et al. (2024) Schaller M., et al., 2024, MNRAS, 530, 2378
- Schaye et al. (2023) Schaye J., et al., 2023, MNRAS, 526, 4978
- Springel et al. (2005) Springel V., et al., 2005, Nature, 435, 629
- Virtanen et al. (2020) Virtanen P., et al., 2020, Nature Methods, 17, 261
- White et al. (1987) White S. D. M., Frenk C. S., Davis M., Efstathiou G., 1987, ApJ, 313, 505
- Yadav et al. (2010) Yadav J. K., Bagla J. S., Khandai N., 2010, MNRAS, 405, 2009
- Zhu & Ménard (2013) Zhu G., Ménard B., 2013, ApJ, 770, 130