An efficient end-to-end computational framework for the generation of ECG calibrated volumetric models of human atrial electrophysiology
Abstract
Computational models of atrial electrophysiology (EP) are increasingly utilized for applications such as the development of advanced mapping systems, personalized clinical therapy planning, and the generation of virtual cohorts and digital twins. These models have the potential to establish robust causal links between simulated in silico behaviors and observed human atrial EP, enabling safer, cost-effective, and comprehensive exploration of atrial dynamics. However, current state-of-the-art approaches lack the fidelity and scalability required for regulatory-grade applications, particularly in creating high-quality virtual cohorts or patient-specific digital twins. Challenges include anatomically accurate model generation, calibration to sparse and uncertain clinical data, and computational efficiency within a streamlined workflow.
This study addresses these limitations by introducing novel methodologies integrated into an automated end-to-end workflow for generating high-fidelity digital twin snapshots and virtual cohorts of atrial EP. These innovations include: (i) automated multi-scale generation of volumetric biatrial models with detailed anatomical structures and fiber architecture; (ii) a robust method for defining space-varying atrial parameter fields; (iii) a parametric approach for modeling inter-atrial conduction pathways; and (iv) an efficient forward EP model for high-fidelity electro-cardiogram (ECG) computation.
We evaluated this workflow on a cohort of 50 atrial fibrillation patients, producing high-quality meshes suitable for reaction-eikonal and reaction-diffusion models and demonstrating the ability to simulate atrial ECGs under parametrically controlled conditions. These advancements represent a critical step toward scalable, precise, and clinically applicable digital twin models and virtual cohorts, enabling enhanced patient-specific predictions and therapeutic planning.
keywords:
Atrial Electrophysiology; Volumetric Atrial Models; Cardiac Digit Twins; Universal Atrial Coordinates; Cardiac Modeling1 Introduction
Computational models of atrial EP are increasingly being considered in a variety of applications, ranging from the industrial development of devices such as electro-anatomical mapping (EAM) systems [91, 105] to the stratification and planning of clinical therapy [19]. These applications are built upon the mechanistic nature of biophysical models of atrial EP, and are based on the tacit assumption that simulated in silico behaviors closely correspond to the real human atrial EP observed in patients. If sufficient regulatory-strength evidence of such a close causal relation is provided, in silico models can be used to explore human atrial EP more comprehensively, in a safer and more cost-effective manner compared to the current paradigm based on preclinical animal testing and clinical trials [34, 101]. However, current state-of-the-art models supporting evidence of such a tight causal and quantitatively accurate relation are limited. The vast majority of computational studies use simplified anatomical models [7, 62, 94] with uncalibrated default parameters [19, 99], and any comparison to directly observable quantities, such as ECG, is usually limited [38, 67] or even not accounted for [94]. This can be largely attributed to the limited capabilities of current modeling technologies in terms of anatomical model generation as well as calibration and simulation technologies. A direct comparison to observations would reveal major discrepancies between physical and virtual spaces, thus undermining the credibility of the model.
The degree of fidelity needed, as well as the metrics used for measuring it, is application-dependent [13]. Beyond the minimum requirement of a mechanistic relation – that is, the models of atrial EP are able to qualitatively recapitulate all the mechanisms of atrial EP at play – in silico models can be calibrated to be representative of a group of patients of interest, also covering anatomical and functional variability [80]. Such representation of a patient cohort, rather than an individual, may facilitate generic interpretation of observations in real physical atria, and prediction of EP responses to therapeutic interventions. Such sets of functionally-similar models referred to as virtual cohorts, have recently started to be considered for in silico trials and for safety and efficacy testing of new devices or therapies [109]. Nevertheless, creating virtual cohorts of in silico models will necessitate a shift in cardiac modeling, moving from a limited set of custom models to efficient and scalable workflows capable of generating large volumes of models quickly [80].
Most demanding are clinical applications geared toward precision cardiology, that is, to tailor therapies to individual patients. There, models are sought that replicate cardiac anatomy and structures and quantitatively calibrate to match functional observations from an individual patient’s heart in a one-to-one manner. Such functionally equivalent models, where a particular stimulus or perturbation leads to the same emergent response in virtual and real space at a single time point, are referred to as digital twin snapshots. When the models are continuously or periodically updated with measurements, they become true digital twins [13, 24, 52].
However, the ability of current atrial EP modeling pipelines for creating high-fidelity digital twin snapshots or virtual cohorts at scale in a sufficiently efficient and robust manner is severely limited. The key challenge is to describe the electrical sources in the atria accurately enough to predict the electrical potential field in its surroundings where all observable measurements are recorded. In humans in vivo, electrical measurements are in the form of electrograms (EGMs) by devices or EAM systems, or as ECG at the body surface. While conceptually simple, the implementation of such a pipeline is vastly demanding, posing a long list of formidable challenges many of which remain unaddressed. In general, modeling pipelines for creating cardiac digital twin models of atrial EP are separated into two distinct stages, an anatomical and a functional twinning stage [7, 62, 94].
At the anatomical stage, multi-label segmentation of tomographic images is performed to identify all relevant domains [82] which are turned into multi-label computational meshes [28, 90] to accurately represent biatrial anatomy. Involved procedures are notoriously laborious, requiring numerous manual operator interventions by trained experts and significant computational resources [7, 94], to obtain anatomically accurate representations of sufficient mesh quality for a given type of cardiac EP simulation. Specifically for atrial anatomies, these are often simplified [30] and represented as manifolds only [7, 62, 94], thus limiting the achievable quantitative accuracy in representing electrical sources and associated potential fields.
At the functional twinning stage, the fundamental core challenge of calibrating an atrial EP model to clinical data is to infer high-dimensional space-varying parameter fields governing the EP behavior from limited sparse clinical recordings that are afflicted with substantial observational uncertainties [27, 113]. This poses a number of technological problems. Model functionalization refers to conceiving a framework for comprehensively describing a sufficiently high-dimensional parameter space defined over geometrically complex objects, such as the heart [11, 96], that encapsulates all relevant factors governing atrial EP, and the genesis of the associated extracellular potential field. These fields must be exposed to unattended algorithmic manipulation to facilitate parameter sweeps in order to minimize the mismatch between simulated and observed data within an optimization procedure [43, 45]. A computationally efficient yet accurate forward EP model for generating the observed electrical recordings, i.e. ECGs, EGMs or EAMs, is required to cope with the computational burden of a large number of model evaluations incurring during optimization [42, 77, 83]. Computational workflows meeting these criteria and reported so far in the literature [7, 19, 94], are primarily limited in terms of anatomical and structural representation, functional calibration capabilities, as well as automation, efficiency, robustness, reproducibility, and numerical accuracy.
In this study, we address these limitations by developing novel methodologies that are essential for the scalable generation of atrial digital twin snapshots and virtual cohorts, calibrated by ECGs and, potentially, EGMs or EAMs. These comprise:
-
i)
An automated flexible multi-scale approach for generating anatomically accurate volumetric biatrial models with comprehensive parametric incorporation of atrial structures and fiber architecture, and of sufficiently high mesh quality to be suitable for most widely used forward EP models;
-
ii)
A robust method for generating a volumetric atrial reference frame for defining space-varying atrial parameter fields, and their unattended manipulation in optimization sweeps;
-
iii)
A novel method for the flexible parametric representation of Inter-atrial Conduction (IC) pathways;
-
iv)
An efficient and clinically-compatible ECG forward model that computes high fidelity gold standard ECGs and EGMs with close to real-time performance.
We report on the integration of these methodological developments into a highly automated and efficient end-to-end workflow for building high-fidelity digital twin snapshots of atrial EP from clinical data. We elucidate in detail the methodological underpinnings of all processing stages – from image analysis over model generation to ECG and EGM prediction – and evaluate the performance of the end-to-end workflow on a clinical cohort of patients treated for atrial fibrillation (AF), by processing 50 patient datasets randomly selected from the Graz AF registry. For each patient, both coarse and fine-resolution meshes were generated at and for reaction-eikonal [77] and reaction-diffusion mono- or bidomain models, respectively, together with a set of automatically generated volumetric universal atrial coordinates (UAC). We demonstrate the ability to compute atrial ECGs by performing sweeps on parametrically-controlled and easy-to-generate inter-atrial pathways, and we show the possibility of automatically varying the position and shape of the sino-atrial node (SAN), allowing fast calibration of the model at hands.
The structure of the paper is as follows: Section 2 presents a comprehensive overview of the proposed end-to-end workflow, encompassing the anatomical twinning stage (Section 2.1) and the functional modeling stage (Section 2.2). Specifically, our approach for generating anatomically accurate volumetric biatrial models, including anatomical structures and fibers, is detailed in Sections 2.1.1-2.1.4. Sections 2.1.5 and 2.1.6 describe the computation of the UAC and torso model surrounding the biatrial mesh. Our novel method for computing interatrial connections is outlined in Section 2.2.1, while the parameter sweeping process for model calibration is detailed in Section 2.2.2. The numerical results are provided in Section 3, with the discussion, limitations, and conclusions presented in Sections 4, 5, and 6, respectively.
2 Methods
We provide a schematic overview of an end-to-end workflow for the generation of anatomically accurate volumetric biatrial-torso model in Figure 1.
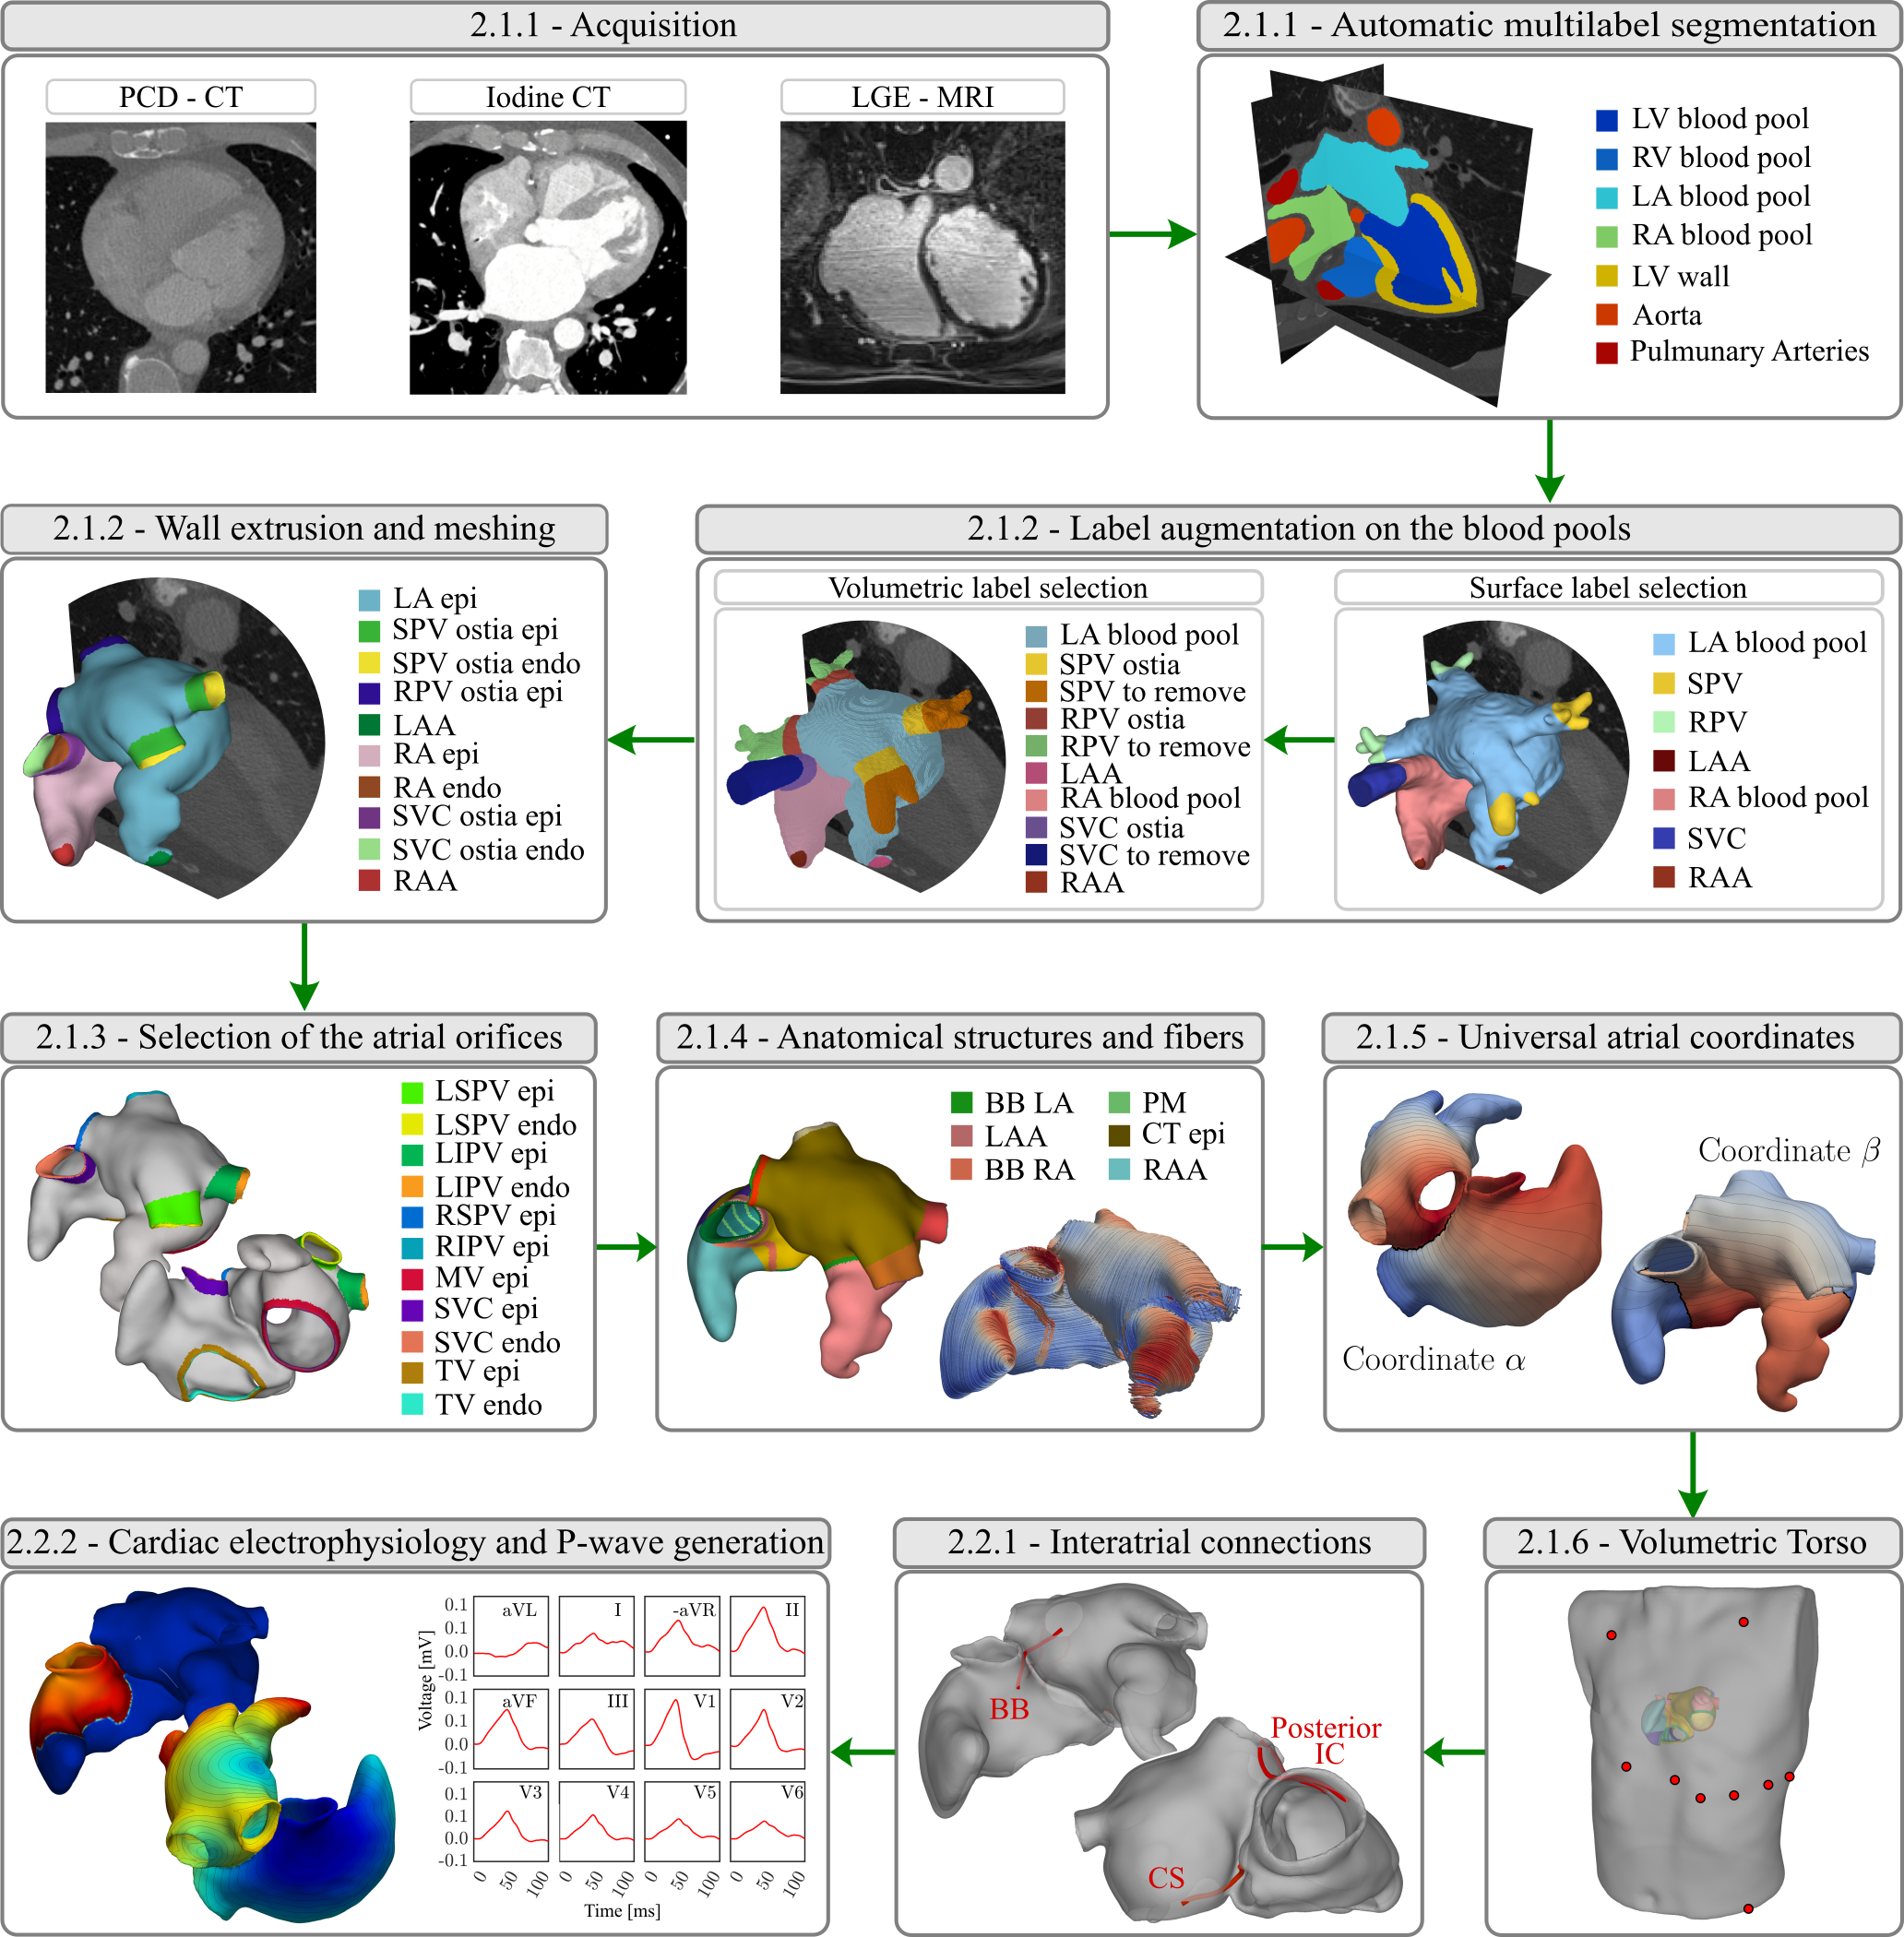
The workflow comprises two major processing stages, (i) an anatomical twinning stage comprising the generation of the atrial anatomical model with structural labels and fiber architecture, the generation of an atrial reference frame for spatial parameter swiping, and a torso anatomical model, and (ii) a functional modeling stage, for the definition of inter-atrial pathways, and the setting up of a forward EP model for representing and calibrating atrial action potential propagation, and for generating the associated clinically observable signals, such as the ECGs and the EGMs. Both stages are closely linked to the choice of forward EP mathematical model, which influences, for instance, the targeted spatial mesh resolution of the biatrial anatomical model.
The anatomical twinning stage is organized following an almost automatic and sequential step approach:
-
i)
image segmentation: by exploiting a convolutional neural network, tomographic scans, either computed tomography (CT) or Magnetic Resonance Imaging (MRI), are automatically segmented;
-
ii)
label augmentation on the atrial blood pool: veins and appendages on the atrial blood pools are identified and labeled, for defining the border between atrial myocardium and attached vasculature;
-
iii)
extrusion of the volumetric atrial walls: by accounting for the identified labels on the blood pools, a sequence of prescribed operations is employed on the segmentation to extrude the endo- and epicardial walls endowed with a selected thickness, automatically opening veins and valves, and generating a corresponding smooth volumetric mesh;
-
iv)
selection of atrial orifices: a fully automated process is carried out to identify the complete set of vein ostia and valves on the atrial walls, separated in endocardial and epicardial tissue;
-
v)
automatic labeling of anatomical structures and fiber generation: the remaining anatomical regions are automatically annotated, and the atrial fiber architecture is computed;
-
vi)
UACs generation: a system of normalized volumetric universal coordinates is computed;
-
vii)
integration of a torso volumetric conductor: a reference torso anatomical model is automatically integrated with the biatrial anatomical model and lead fields are computed for all considered electrode positions for computing all clinical ECG signals of interest.
The functional modeling stage comprises:
-
viii)
generating ICs: a flexible set of conduction pathways that cannot be delineated from images are computed to facilitate inter-atrial impulse conduction
-
ix)
generate EP clinical outputs: employing either Reaction-Diffusion (R-D) monodomain formulation, or a Reaction-Eikonal (R-E) model to represent the transmembrane voltage, , in the atrial model, a parameter spaces of EP parameter is selected to be used for the model calibration. The P-wave of the 12-lead ECGs on the torso are computed using the respective lead fields [41, 88]. The same approach can be potentially employed to compute EGMs in the blood pools.
The entire workflow is implemented in a single user-friendly software building on the package meshtool [79] and on python code. For meshing operations the software TetGen (Weierstrass Institute, Berlin, Germany) and NetGen (CerbSim GmbH, Vienna, Austria) have been licensed and integrated with meshtool. An interactive mode is moreover available, allowing for the verification of the labeling process, the visual control of all processing stages, and the correction of any potential software errors, through the use of the software CARPentry Studio (Numericor GmbH, Graz, Austria). All required interactive steps are readily supported by the freely available starter version of CARPentry Studio for academia. Each step of our workflow will be extensively described in the following sections.
2.1 Anatomical twinning stage
2.1.1 Imaging data acquisition and segmentation
For developing and testing the workflow, 50 patients diagnosed with AF and scheduled for AF ablation therapy were selected. Iodanized contrast CT scans were acquired at an isotropic resolution of as part of the routine standard of care at the Medical University of Graz hospital for patients included in the local AF ablation registry. This registry was approved by the ethics committee of the Medical University of Graz (reference number 26-217 ex 13/14) and all patients gave written informed consent.
Each CT dataset was segmented using the SpatialConfiguration-Net (SCN) [107], an automated multi-label segmentation method based on convolutional neural networks. Prior to input to the SCN, 3D image stacks were cropped around the center of the heart, re-sampled to an isotropic resolution of , and Gaussian filtered with . The SCN was trained to recognize and label seven cardiac domains, comprising all four major cardiac left ventricle (LV), right ventricle (RV), left atrium (LA), right atrium (RA) blood pools, the LV myocardium, and the vascular blood pools in the aorta and the pulmonary artery. Segmentation quality was assessed interactively, to ascertain topological soundness. Topological errors, if present, such as connections between the blood pools of the LA appendage and the left superior pulmonary vein (LSPV), or between the coronary sinus (CS) and the LA were identified, and manually corrected using the ITK-SNAP software [116].
2.1.2 Automated label augmentation on the blood pools
Label augmentation is performed to identify the atrial appendages and veins, which will later be used in the wall extrusion process. Among all the volumetric labels defined through segmentation, only the LA and RA blood pools are targeted at this stage, while all other anatomical labels serve as auxiliary references.
The blood pool label augmentation is carried out in two stages: the first stage automatically defines key landmarks on the surface of the blood pools; the second stage effectively labels the entire blood pool volumes.
In the first stage, beginning with the segmentation, triangular surface meshes of the LA and RA blood pools are generated. Key landmarks to identify include the left pulmonary veins (LPV), right pulmonary veins (RPV), and the left atrial appendage (LAA) in the LA, and the superior vena cava (SVC), inferior vena cava (IVC), CS, and right atrial appendage (RAA) in the RA. The automatic landmarking process is based on the computation of the curvature of the surface mesh, as presented in [7] (see Figure 2(a)). The curvature is defined point-wise, allowing for clustering of the mesh nodes based on curvature thresholding. Clusters of nodes with the highest curvature – five on the LA and four in the RA– are considered for anatomical structure selection and marked using the following algorithm (see Figure 2(b)):
-
1.
LA: The first landmark selected is the vertex of the LAA, identified as the central point of the LA cluster of node closest to the ascending aorta, or, if the aorta is not labeled, as the cluster with the highest curvature. A point cloud algorithm based on Principal Component Analysis (PCA) is then employed to divide the remaining clusters into two groups: the two clusters nearest to the LAA are designated as LPV, while the others are identified as RPV.
-
2.
RA: Similarly to the LA, the vertex of the RAA is first selected as the central point of the RA cluster closest to the ascending aorta or the one with the highest curvature. PCA is then applied to the two largest clusters in terms of nodes to identify the vena cavae. The SVC is designated as the cluster nearest to the RAA, while the other is marked as IVC. Among the remaining clusters with the highest curvature, the one nearest to the IVC is labeled as CS.
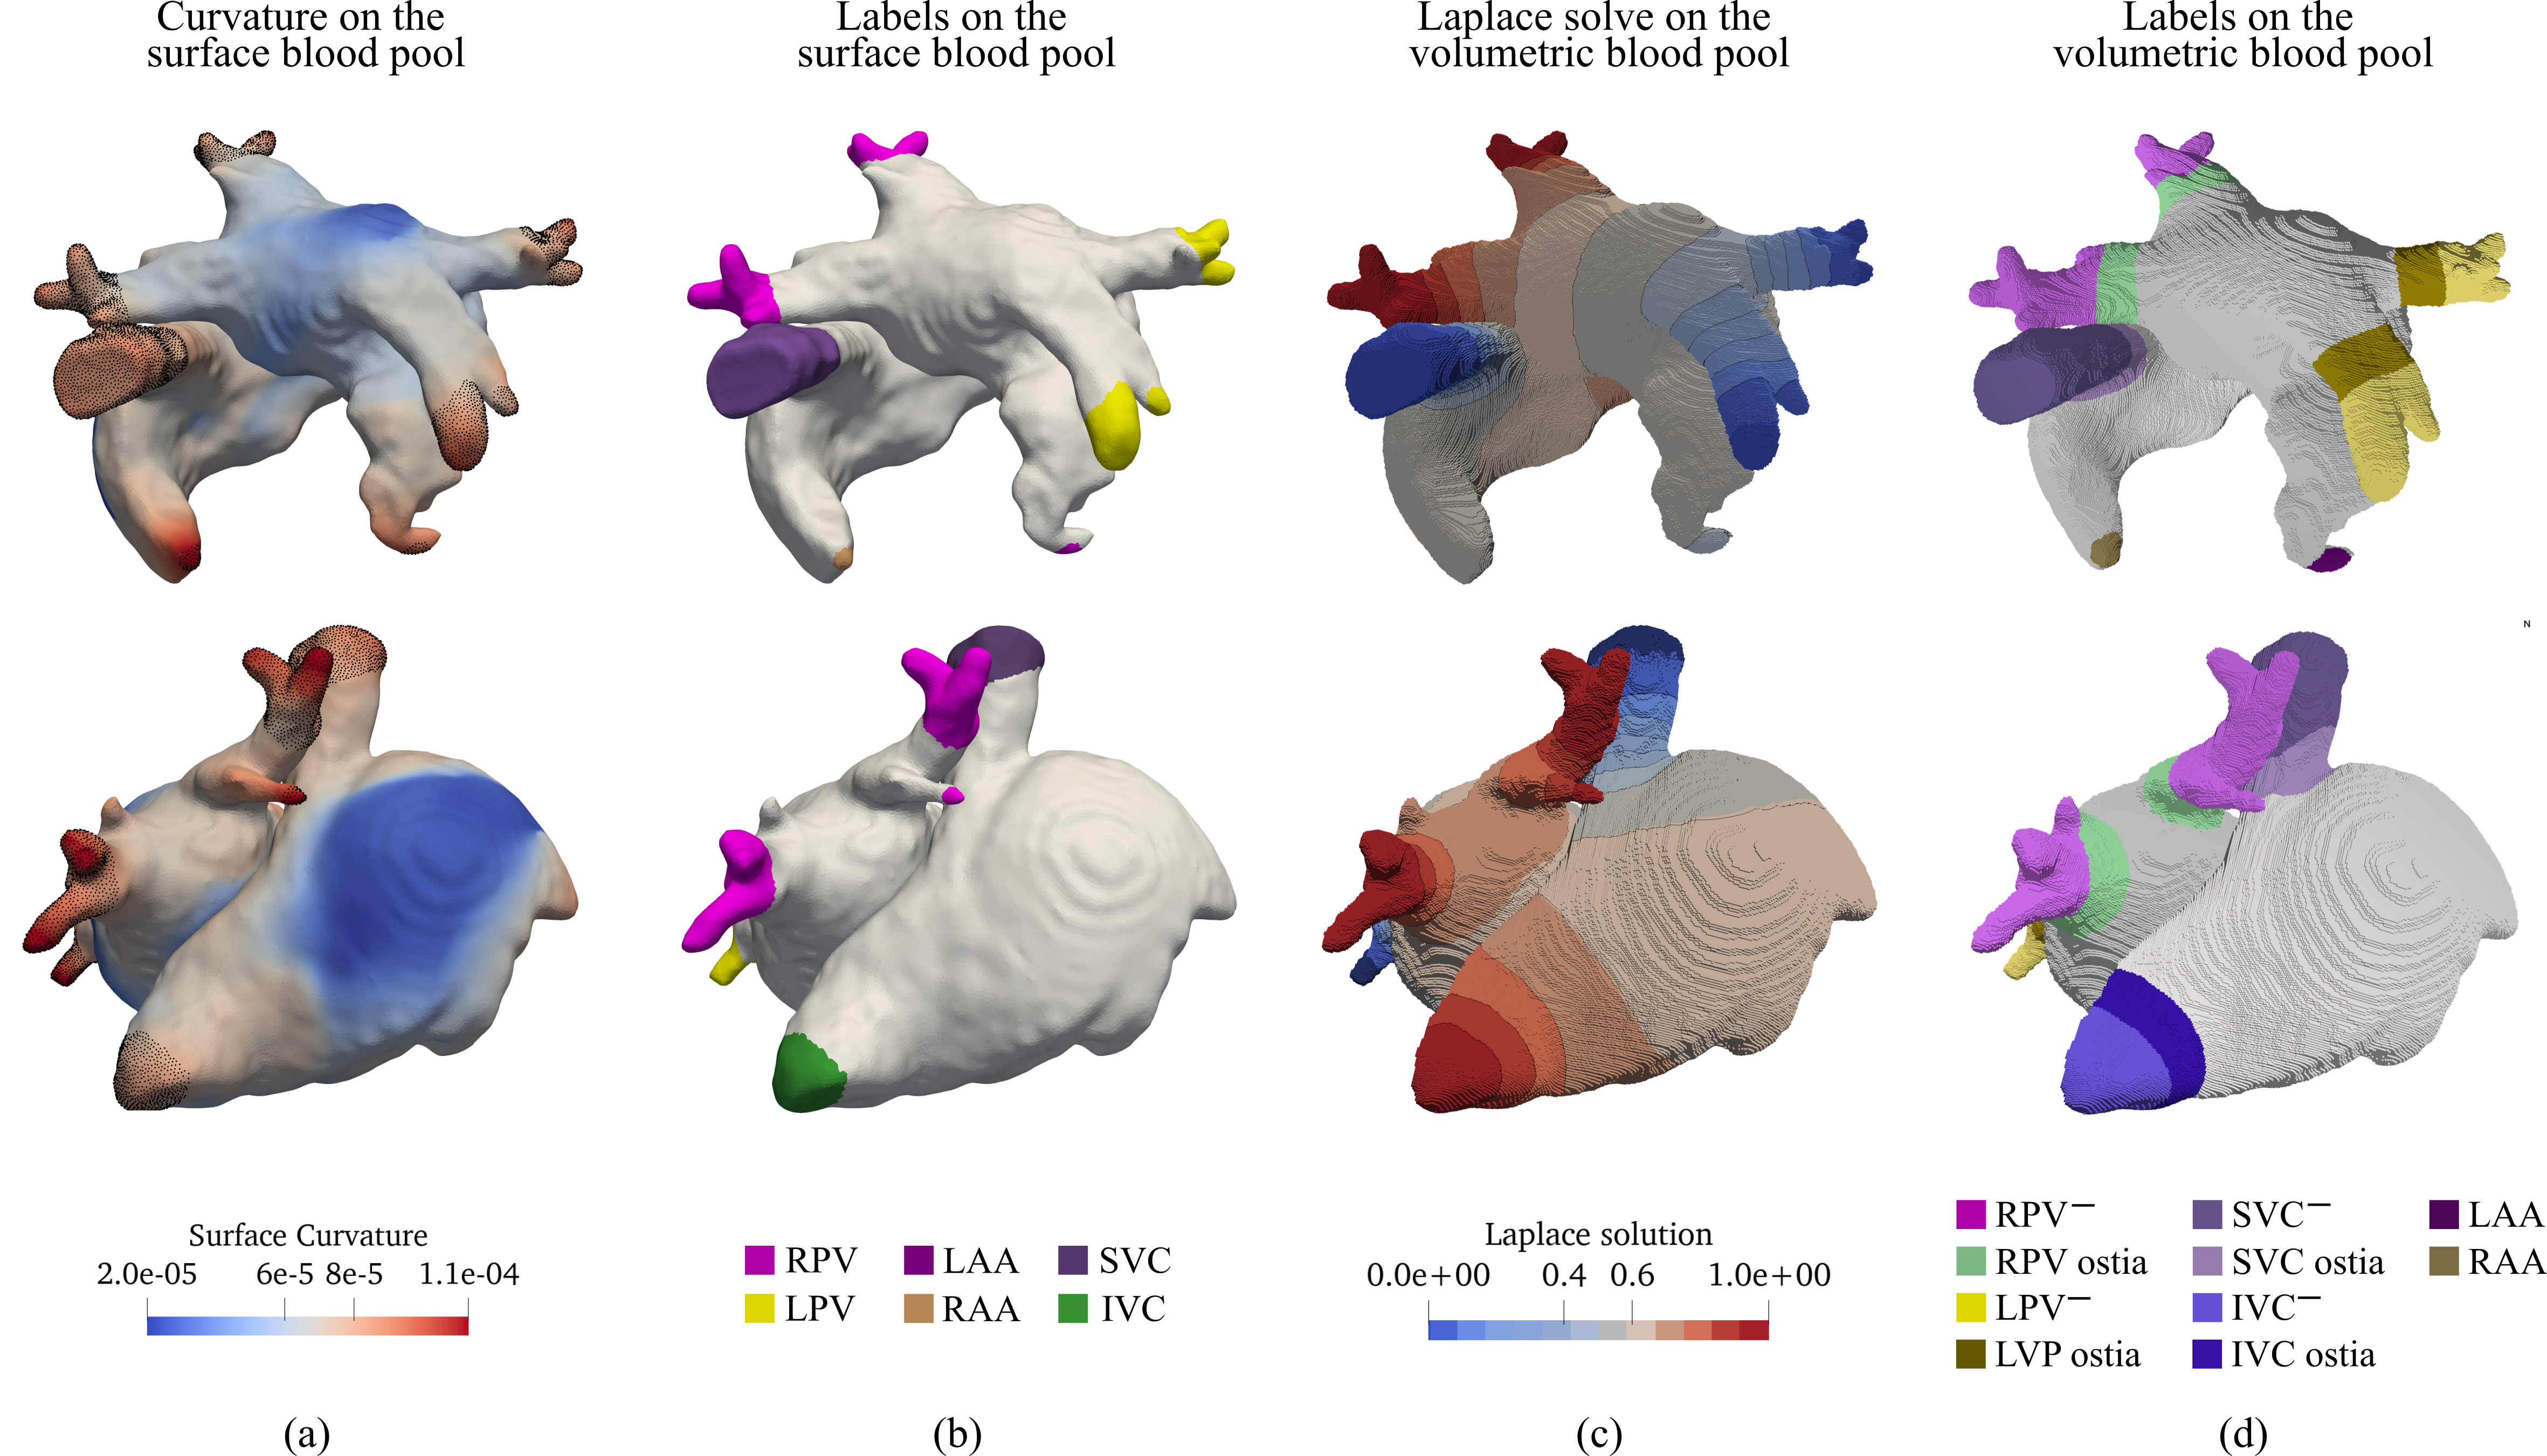
The second stage entails the generation of a volumetric hexahedral mesh of LA and RA blood pools from the initial volumetric segmentation of the SCN.For each atrium, a series of LD problems is solved to define a set of measures of distance between the previously defined veins and appendages. Dirichlet boundary conditions are generated by projecting the landmarks defined on the blood pool surface mesh onto the volumetric mesh (see Figure 2(c)). Isosurfaces of the LD solves are then employed to label the veins ostiae according to prescribed thresholds. The remaining portions of the veins are considered discardable tissue, as they will not be part of the final anatomical model. Therefore, they are marked for removal. Hereon, we will define this landmark by employing the name of the vessel followed by a negative sign, e.g. the portion of discardable tissue of the SVC will be denoted as SVC - (see Figure 2(d)). The same procedure is also applied to the CS. The labels defined on the volumetric hexahedral mesh are finally projected back onto an image stack that will then contain all augmented fine-grained labeling information.
The high variability in the atrial anatomy occasionally led the automatic algorithm to mislabel some structures. Specifically, errors in the positioning of the IVC and CS were witnessed, or in the identification of a reasonable portion of discardable IVC blood pool volume. In such cases, the workflow visualization modality allows for a swift manual correction.
As the atrial walls are thin, their accurate segmentation from current routine clinical imaging with CT and MRI is, in general, not feasible [15, 32]. In our workflow, we therefore use a priori knowledge [8, 12, 108, 112] on the RA and LA endo- and epicardial width to construct the atrial walls. A two steps process is applied. First, atrial walls are grown by image operations applied to the image stack, followed by a mesh generation step to create conformal unstructured meshes with smooth boundaries.
Using the augmented volumetric segmentation, atrial walls are grown by imposing a series of rule-based extrusion operations at the interface of two different landmarks, or at the interface of marked tissue with the image background. Extrusion operations may comprise both growth in an inward direction, i.e. erosion, or outward, corresponding to negative and positive growth along the surface normal of the labeled domain. The spatial granularity of extrusion is prescribed in physical length units, i.e. mm, which is converted to discrete steps corresponding to the voxel size of of the segmented image.
Specifically, volumetric representations of the atrial walls are then generated by the following rules: i) an inclusion set of labels where interfaces between differently labeled domains are allowed to grow into each other, comprising the blood pool labels of RA, and LA, the ostiae of both caval veins, SVC and IVC, and the pulmonary veins, RPV and LPV; ii) an exclusion set comprising domains labeled as not pertaining to the atrial blood pool, to impede extrusion along these interfaces. This set includes the LV and RV blood pools, the CS, the SVC -, IVC -, as well as right and left pulmonary veins, RPV -, LPV - (see Figure 2). The extrusion operations are performed then on the inclusion set, with the exclusion set serving as boundaries that impede any further growth. First, an inward extrusion is performed to create a minimal endocardial surface layer, followed by an outward dilation to thicken the endocardial layer to the prescribed width, and a further outward extrusion to create an epicardial layer. Distinct values for the thickness of the of LA and RA endocardial and epicardial layers, as well as the wall width of each vein can be specified independently. As the exclusion set impedes any inward or outward extrusion, growth is then blocked at the interfaces of RA and RV, and LA and LV blood pools, respectively, to create the orifices of tricuspid valve (TV) and mitral valve (MV). Similarly, atrial walls are not grown at the interface of the RA and LA blood pool with the tissue of the veins and CS to be dismissed, thus effectively creating the openings of all in- and outflow anatomical structures. Additional rules may be applied to mitigate effects due to limited segmentation accuracy. For instance, the growth of the epicardial wall may be constrained around the ostiae of the LSPV in cases where LAA and the LSPV are in close proximity, to avoid merging.
After the extrusion phase, the walls of both atria are volumetrically defined on the augmented image stack. The generation of a volumetric anatomical mesh starts with extracting a surface mesh that encloses all atrial wall labels. This initial surface mesh, conforming to a jagged voxel representation, is subjected to several remeshing and smoothing steps to obtain a smooth representation of all atrial walls, with smooth transitions between wall segments of different widths. Topological corrections, mesh quality checks, and improvements are moreover implemented to ascertain topological correctness and sufficiently high mesh quality. Finally, the surface mesh is resampled to match a prescribed target resolution. Typically, for R-E models a resolution of , sufficient to resolve endo- and epicardial atrial wall layers, was selected. For R-D simulation, a higher resolution of was used to resolve slowly propagating wavefronts without producing numerical artifacts [14]. As a final step, volumetric meshes of the atrial walls are created by the inward meshing of the labeled surfaces, again followed by a topological correction, reindexing, refinement, and mesh quality-enhancing procedures. Mesh quality of the final volumetric mesh is measured as in [55] based on [10, 54, 60] (referred to Figure 3-left).
Thus, at the end of this stage, the biatrial anatomy is represented by an unstructured volumetric tetrahedral mesh endowed with basic anatomical labels, including endo- and epicardial domains of RA, LA, RPV, LPV, IVC and SVC.
2.1.3 Automated selection of the atrial orifices
The atrial orifices comprising LPV, RPV, MV, TV, SVC, IVC, and CS are individually labeled as separated anatomical entities. Specifically, following [7], orifices are detected as mesh nodes of the biatrial surface that are shared between adjacent elements with disjoint endo- or epicardial labels of the same anatomical structure. Each orifice is therefore represented as a cluster of mesh nodes arranged along a ring, and is readily identified based on anatomical labels, except for the differentiation into superior and inferior of the RPV and LPV. There, each entity, RPV and LPV, consists of two clusters which are discriminated based on the Euclidian distances between their centroid and those of the IVC, SVC, MV, MV as well as the tips of RAA and LAA. For instance, the centroid of the LSPV is closer to the centroid of the SVC and to the RAA tip. Given the identified orifices, the anatomical regions of the LA labeled as RPV and LPV are updated to separate the inferior and superior pulmonary veins.
2.1.4 Automated labeling of anatomical structures and fiber generation
Following [7, 118], a further refined sub-classification of anatomical structures is performed on the RA and LA walls to define anatomical structures and tissue regions of known differences in EP behaviors. Such structures – including the SAN, CT and pectinate muscles (PMs), the Bachmann’s bundle (BB), and the muscular rim of the fossa ovalis (FO), as well as RAA and LAA– are automatically annotated on a per-rule basis defining location and width of the sought-after anatomical structures (refer to Figure 4b).
The implemented rules are based on solutions of multiple instances of LD problems on the domain , i.e. the right or left atrium, with varying boundary conditions. Specifically, given a generic unknown , this involves solving
for suitable Dirichlet Boundary Conditions (DBC) , set on generic partitions of the atria boundaries , and Neumann boundary conditions , such that . The LD solutions are used as measures of distance between the orifices and/or, the appendages. Moreover, a plane passing through the center of the IVC and SVC, and the center of mass of the RA is computed to separate the RA into lateral and septal regions. Hereon, we will call the intersection of such plane with the RA wall as RA roof. Similarly, the TV annulus is partitioned into a lateral and a septal tricuspid valve annulus, and , respectively. A representation of the defined set of boundaries is shown in Figure 3.
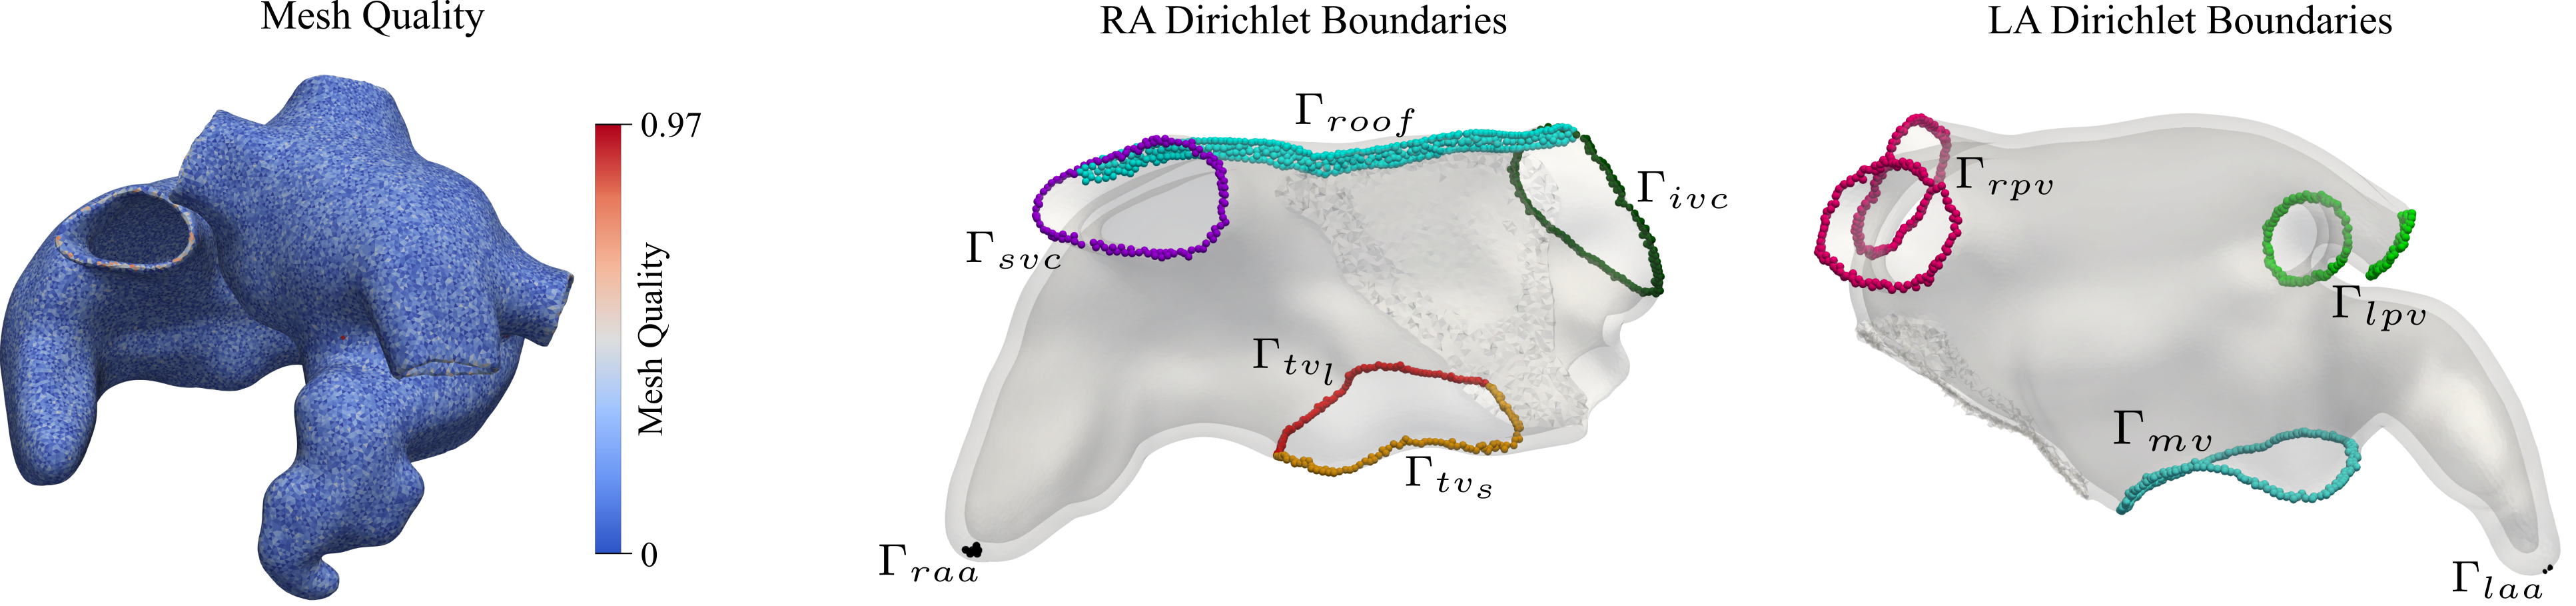
Compared to previous work [7, 118], three additional LD solutions were computed on the RA: i) with DBCs and imposed at the rings of SVC and IVC, respectively; ii) with at the rings of the SVC and IVC, and on the RA roof, and at the ring of the MV; and iii) with DBCs s on the roof, and on the septal and lateral parts, respectively, at the MV annulus. The complete set of DBCs is summarized in Table 1. These additional solutions are designed to improve the definition of the CT and PMs.
| Atrium | |||||||||
|---|---|---|---|---|---|---|---|---|---|
| RA | 0 | 1 | |||||||
| -1 | 0 | 1 | 2 | ||||||
| 0 | 1 | ||||||||
| 0 | 1 | ||||||||
| 0 | 1 | ||||||||
| 0 | 1 | ||||||||
| 0 | 1 | ||||||||
| -1 | 1 | ||||||||
| -1 | 0 | 1 | |||||||
| LA | 0 | 1 | |||||||
| -1 | 0 | 1 | 2 | ||||||
| 0 | 1 | ||||||||
| 0 | 1 | ||||||||
| 0 | 1 | ||||||||
| 0 | 1 |
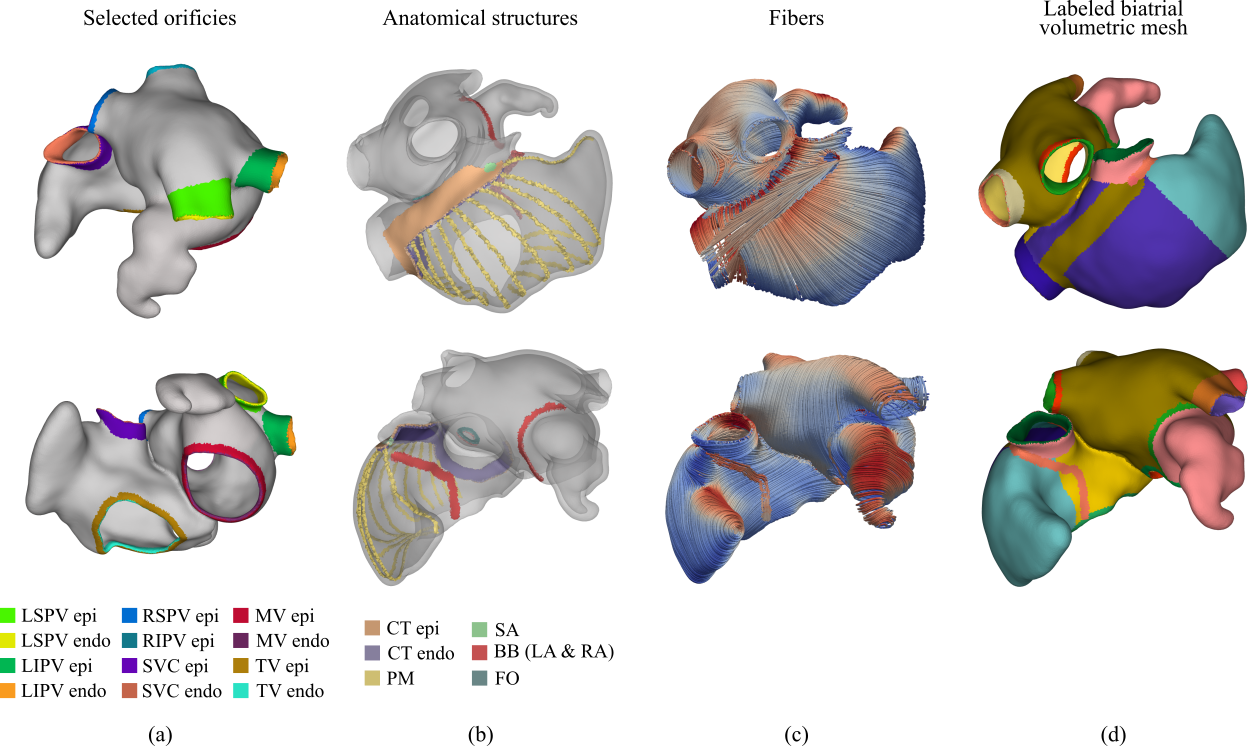
The labeling of the BB follows [118]. Using the additional solutions, we marked the area of the exit site of the SAN, and, optionally, the muscular rim of the FO, and the anterior-central band of the BB. The SAN is defined as a sphere with a radius of and centered on the node closest to the SVC with minimum . The FO is defined as an annulus with thickness of , located in the center of the atrial septum. The start and end points of the anterior-central band of the BB are selected as two points in the middle of the BB lateral bands of both RA and LA. Additionally, an intermediate point is chosen as the epicardial node of the LA nearest to the midpoint of the RA lateral BB. A geodesic path is, moreover, created using Dijkstra’s algorithm between the starting and intermediate points, and between the intermediate and end points. Around this path, a region of width is marked as BB. Unlike in [7, 118], no additional volumetric mesh is added to define the central bundle of the BB. While our workflow allows for marking the complete BB, in this work, we replace the anterior-central band of the BB, as well as all other inter-atrial conduction pathways, by conducting cables (see Section 2.2.1), increasing the flexibility of the modeling approach.
2.1.5 Universal atrial coordinates generation
To compute the UACs directly on the volumetric models we expand upon the method outlined in [94, 95]. For each atrium, we define four coordinates: i) , the IVC-to-SVC coordinate on the RA, and , the lateral-to-septal coordinate on the LA (see illustration in Figure 5(a)); ii) , the lateral-to-septal coordinate on the RA that starts at the lateral TV annulus, runs through the roof, and ends at the septal TV annulus, and , the posterior-to-anterior coordinate on the LA that starts at the posterior MV annulus, runs through the roof, and ends at the anterior MV annulus (see Figure 5(b)); iii) and , the relative transmural distance between endocardium and epicardium in RA and LA, respectively (see Figure 5(c)); iv) a binary value encoding to which atrium the other coordinates belong, always assigning shared points at the LA–RA interface to the LA. To compute the four coordinates, for each atrium, we first solve three LD problems, imposing DBC at pre-defined boundary surfaces. Secondly, to ascertain equal locations of the CS, left inferior pulmonary vein (LIPV), and right inferior pulmonary vein (RIPV) in the UAC space across different atrial models, a linear elasticity problem is solved.
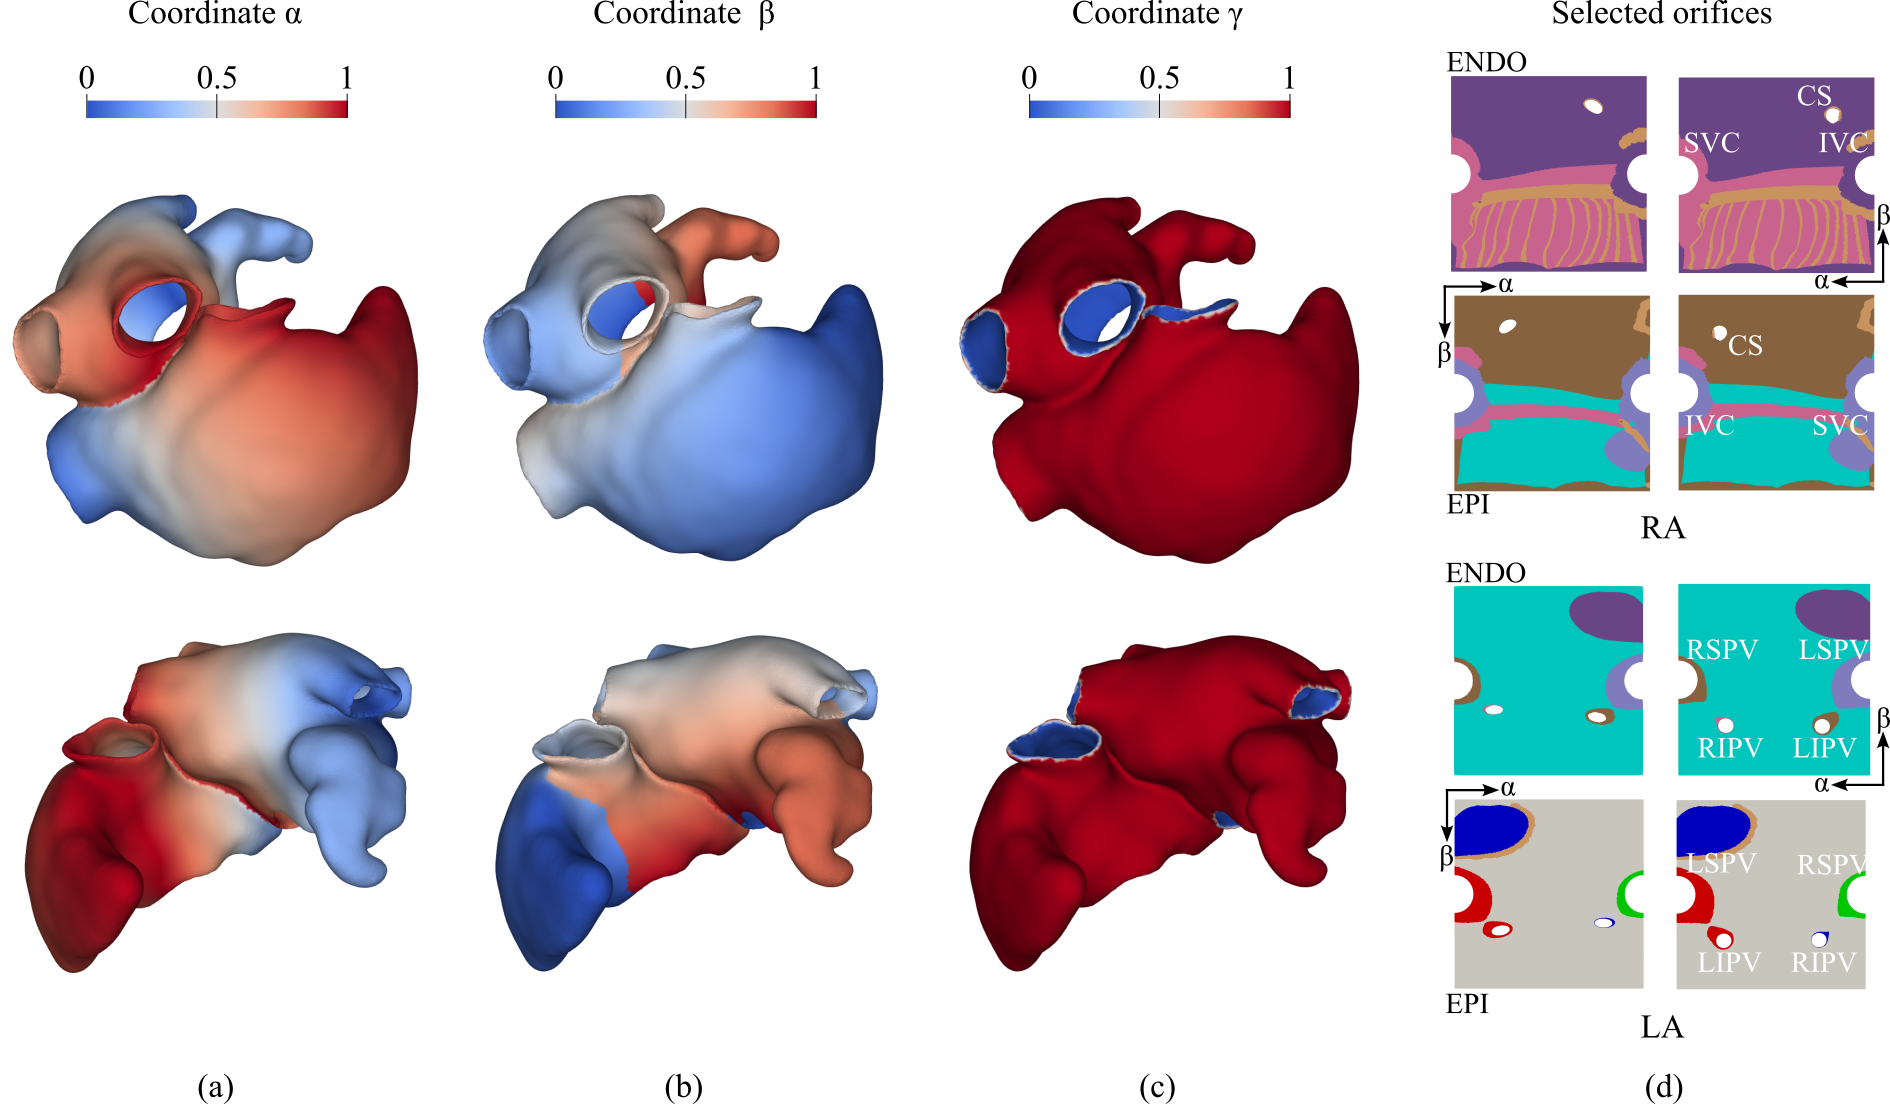
The selection of the boundary surfaces is fully automated and based on the anatomical labels. Specifically, the marked atrial orifices are utilized to define a set of reproducible points on both the vessel openings and the atrial walls. Such points are selected according to the general shape of the atria, to follow the roof of the RA, between the SVC and the IVC, and of the LA, between the LSPV and right superior pulmonary vein (RSPV), and to set lateral and septal boundaries in both atria. The points are then connected with quadrilateral surfaces. The intersections of such surfaces with the atrial volumetric walls define six auxiliary surface meshes, three for each atrium, effectively representing the interfaces separating the RA into a septal and a lateral part, and the LA in an anterior and a posterior part. Moreover, to avoid splitting of the appendages, the RAA is assigned to the lateral side of the RA, and the LAA is assigned to the anterior side of the LA. Therefore, for the RA we obtain two interfaces, and , from the TV to the IVC and SVC, respectively, and one interface along the roof from IVC to SVC. Similarly, the two interfaces and , from the MV to the LSPV and RSPV, respectively, are computed for the LA, together with the interface along the roof from LSPV to RSPV. The defined interfaces are furthermore used to partition the TV, IVC, and SVC into septal and lateral parts, and the MV, LSPV, and RSPV into anterior and posterior (see Figure 6 for a graphical representation). Such partition will be used in the following when solving the linear elasticity problem.
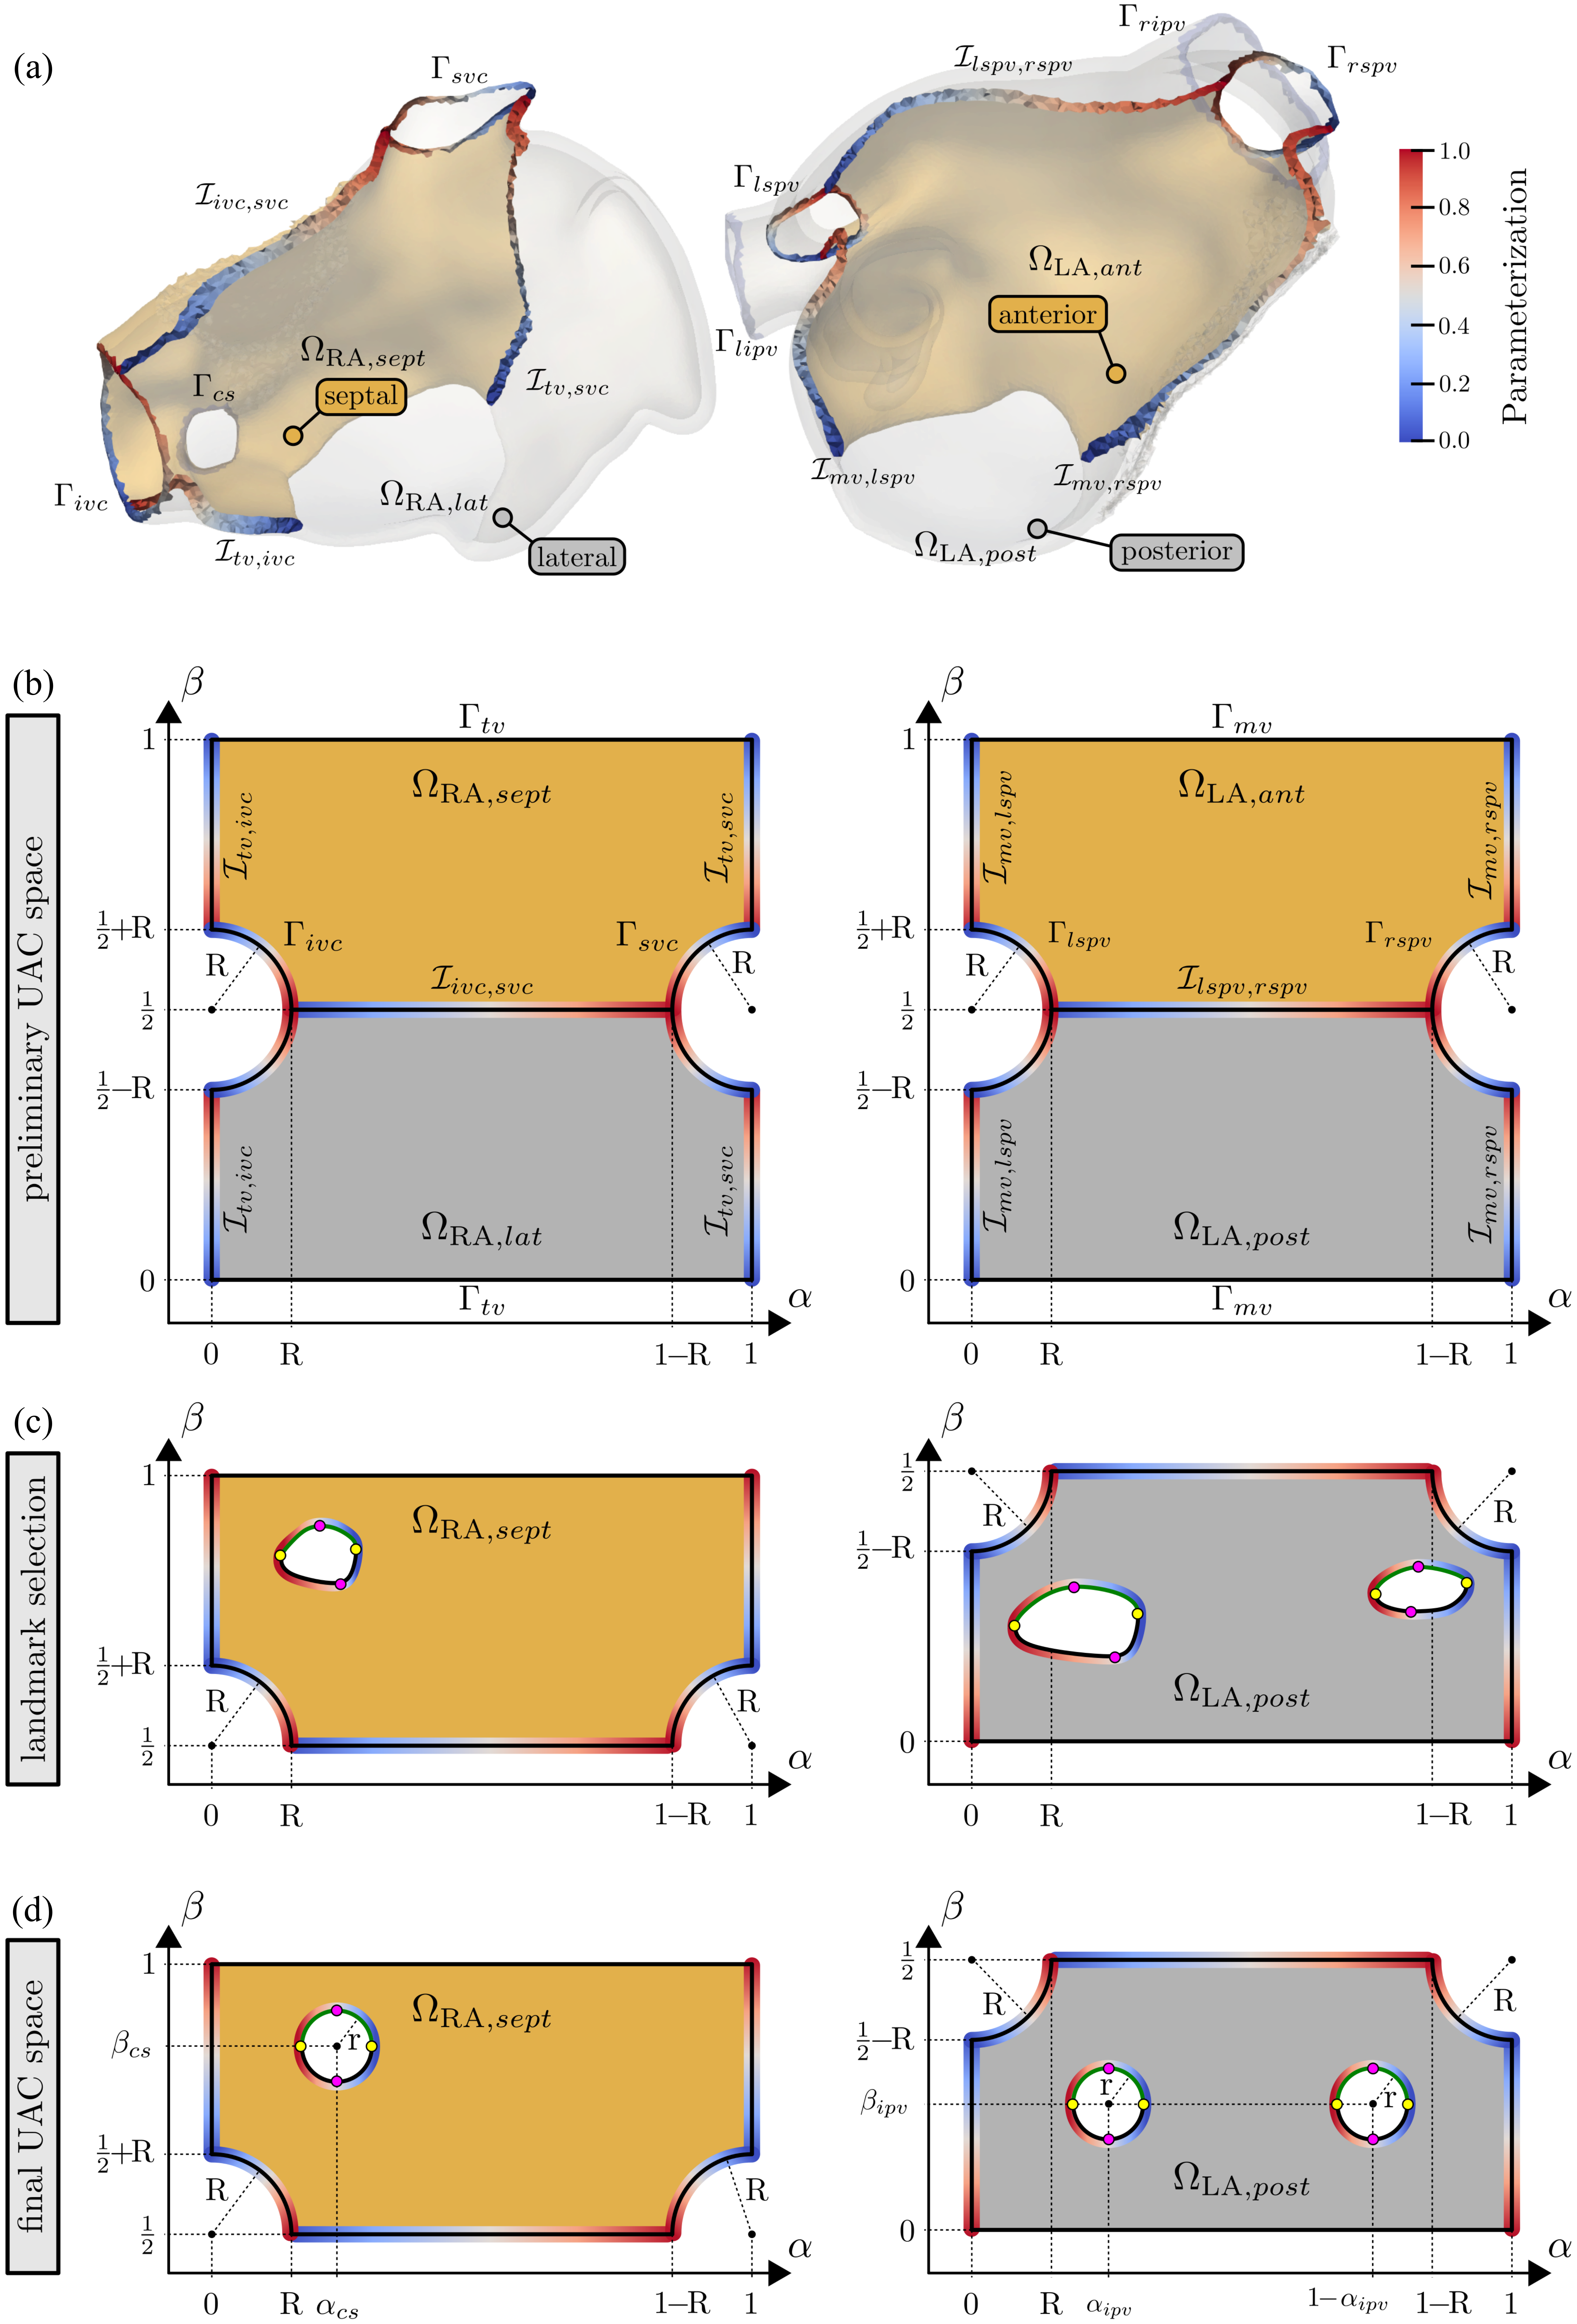
Both the interfaces and the atrial openings are then parametrized with a value with a Bi-Eikonal approach [102]. The and coordinates are computed by solving LD problems on the partitioned and , with DBC assigned based on , as defined in Table 2. For the component, only two Dirichlet boundary conditions are imposed, at the endocardium and at the epicardium.
| and | and | |||
|---|---|---|---|---|
| , | – | 1 | – | 0 |
| , | ||||
| , | ||||
| , | ||||
| , | ||||
| , | ||||
The linear elasticity problem is solved in the UAC space, by projecting the first three coordinates onto two thin cuboids, one for each atrium, where and are described along the edges of the square face, and represents the thickness of the cuboid. The IVC, SVC, RSPV, and LSPV are moreover recast in circumferential form, on the edges of the square face representing the coordinate. The square faces of each cuboid are then representing the endocardial and epicardial surfaces of the atrial walls. An updated Lagrangian formulation is then used to solve a linear elasticity problem, prescribing rule-based Dirichlet boundary conditions for the CS, RIPV, and LIPV. To achieve this, the parametrization of the CS, RIPV, and LIPV is carried out as follows. Beginning with the mesh nodes of each orifice, i.e., , , and as defined in Section 2.1.3, a node selection is grown across the biatrial surface in all directions. The outermost selected nodes form two rings, one on the endocardium and one on the epicardium. For each ring, four points are identified, corresponding to the minimum and maximum values of the and components. and for each of the four endocardial-epicardial point pairs, the shortest path is extracted on the selected surface. The CS node selection is then divided into a roof and a TV section and parameterized using a LD solve, with Dirichlet boundary conditions applied to the eight previously extracted paths. Similarly, the LIPV and RIPV node selections are divided into a roof and a MV section and parameterized in the same manner. The final position of the CS, RIPV, and LIPV after convergence of the linear elasticity problem is defined in Table 3 with , , , , , and ) and in Figure 5(d), where the anatomical labels are also reported.
2.1.6 Torso volume conductor model
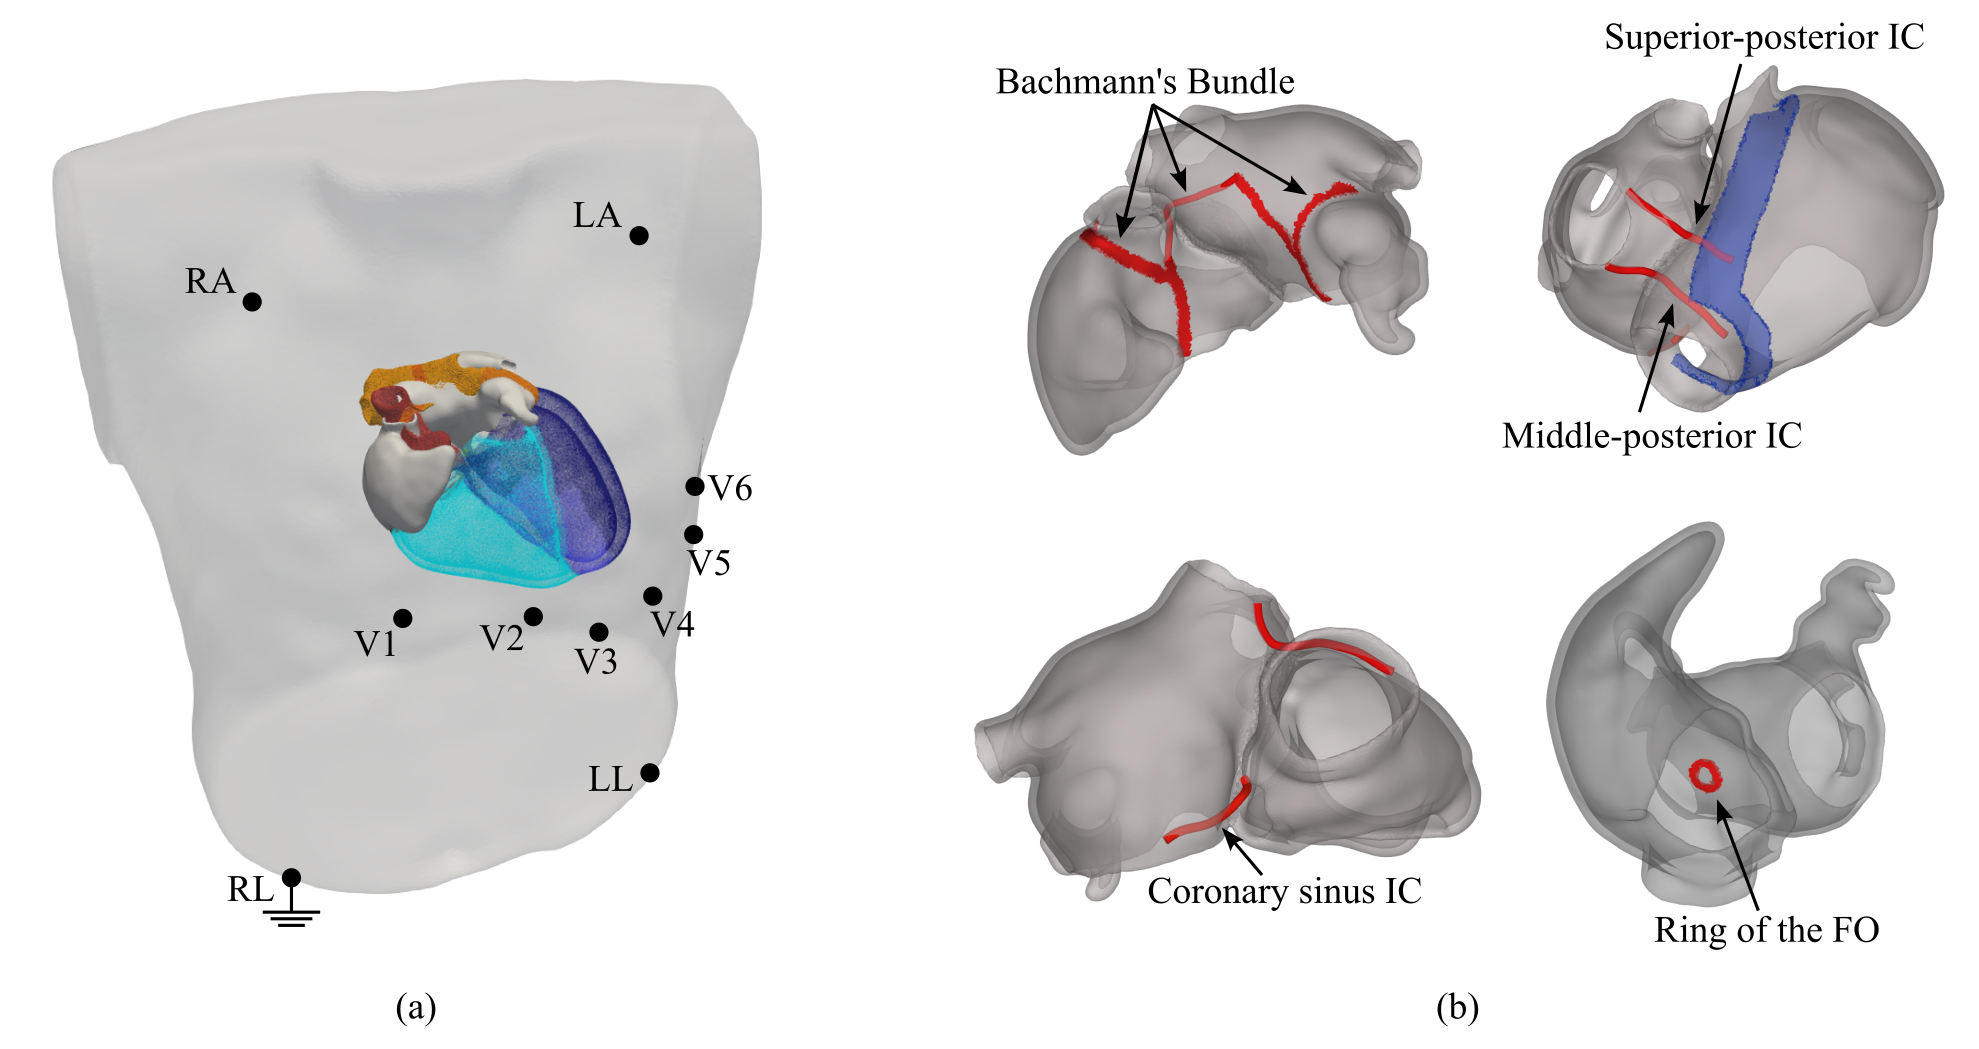
Since most clinical observations of atrial EP are obtained by sampling the potential fields generated within the volume conductor, such as ECGs or EGMs, volumetric models must be embedded in a torso domain to enable the prediction of these observations. However, the field of view of the CT scans of the patients within the Graz AF registry was restricted to the heart to minimize the patient’s exposure to x-ray radiation. Thus a full torso view including all ECG recording sites was not available. Thus, to predict atrial P-waves in the ECG, an automated procedure was implemented for registering a template heart-torso model with known electrode locations around the generated atria. The template was selected from a previously generated virtual cohort [40, 41]. More precisely, the atrial surfaces of the template were registered to the generated patient models by employing a global optimal 3D iterative closest point (GO-ICP) algorithm [114, 115]. The transformation was then stored and applied to the surface of the template torso along with the known positions of the electrodes [40, 41] (see Figure 7(a)).
A volumetric mesh was subsequently generated between the surfaces of the torso and the atria, then merged with the volumetric mesh of the atria. For simplicity, other organs represented in the template model, such as the lungs, were excluded to avoid potential meshing issues caused by intersections with the atrial geometry.
The obtained atria-torso model is suitable for the accurate simulation of ECGs and EGMs, either based on a bidomain model for simulating the entire extracellular potential field, [16, 77, 117], or on a lead field approach [39, 72, 88], yielding time traces of the extracellular potential sampled at discrete points .
2.2 Functional modeling stage
2.2.1 Parametric modeling of inter-atrial connections
Action potential propagation between RA and LA is limited to a few electrically excitable muscular strands of tissue called ICs, that serve as conduction pathways between the otherwise electrically insulated atria. Known pathways include BB, the sheath of the CS, the muscular rim of the FO and, posteriorly, a superior-posterior and a middle-posterior bridge. Histologically, ICs arise sub-epicardially and branch outside of the atrial walls [20, 86]. While the BB [9, 20, 65] and the CS musculature [21, 4] have been shown to be the most relevant electrical IC [98, 59], the specific number and location of the complete set of IC remains unclear [86, 87, 98].
In this study, we considered all five aforementioned ICs as the only electrical connections between the RA and LA. Except for the rim of the FO, which forms an electrically conductive bridge within the volumetric biatrial mesh, RA and LA are electrically fully decoupled using a nodal splitting approach [25]. All other ICs traversing the space outside the atrial walls are modeled as discrete electrically conducting strands, that are anchored within the RA and the LA at given sites defined through UACs (see Figure 7(b)), and constrained to the sub-epicardium. These strands are defined as auto-generated cables as previously utilized in [41], and their electrical behavior is modeled with the approach used to define the His-Purkinje System (HPS) in the ventricles in [77, 110]. The cables used to define the ICs were generated along the shortest path connecting the anchoring location in RA and LA, respectively.
Of the five represented ICs, the BB is composed of both an intra- and an inter-atrial component, where the intra-atrial component is modeled as tissue embedded within the atrial epicardial wall, as described in Section 2.1.4, and only the inter-atrial central component is modeled as a cable. The BB emerges at the junction of the RA body and the SVC, in close proximity to the sino-atrial node (SAN), and runs in an anterior direction around the RAA, where it branches into two bands, one towards the RA vestibule, and the inter-atrial central BB running toward the anterior LA wall, anchoring in the LA epicardium. From there another intra-atrial band runs epicardially towards the LAA, encircles the LAA, and terminates superiorly between the LAA and the LSPV, and inferiorly, at the MV annulus [20].
The two posterior IC s were defined as in [67, 111]. The superior-posterior bridge emerges in proximity of the IVC at the 90% of the CT, and connects the RA with the LA wall near the RIPV, on the septal side. The middle-posterior IC starts at the junction of the IVC with the atrial body, on the CT, and ends at the junction of the RIPV, on the inferior side of the RIPV.
The musculature of the CS was represented by a single cable providing a pathway from the RA wall, near the CS ostium, to the posterior LA at the annulus of the MV. The origin of the cable in the RA was chosen superior to the CS, at a distance between 3 and [21] from the CS ostium, while the LA anchoring site was selected according to [111].
2.2.2 Baseline calibration of the atrial activation sequence and P-wave simulation
The genesis of the atrial P-wave is governed by the spatio-temporal evolution of electrical depolarization wavefronts traversing the atria. At each point in the atria, the propagation of the wavefronts is governed by (i) a conduction velocity tensor that is determined by intra- and extracellular conductivities along the eigenaxes, (ii) the tissue composition condensed into a scalar bidomain surface-to-volume ratio, and (iii) the tissue’s EP properties related to cellular dynamics. Beyond these intrinsic conduction properties, the site of initiation of a depolarization wavefront, typically at an exit site of the SAN or at a pacing site, and the location of anchoring sites of inter-atrial conduction pathways and their associated conduction velocities influence the distribution of electrical sources during depolarization and, thus, the morphology of the P-wave. As such, the parameter vector controlling atrial activation is high dimensional. While all these parameters are exposed for unattended manipulation in parameter sweeps, their calibration as a whole is computationally not feasible with current technology, and, further, observable data are very sparse and insufficient to constrain the calibration procedure. As such, we only demonstrate the ability of our fully parametric 3D biatrial model to sweep over selected key parameters to generate physiologically meaningful sets of atrial P-waves.
Our workflow universally supports all common EP modeling approaches that build on the volumetric representation of atrial electrical sources, including all R-D mono- and bidomain models [16, 89], as well as variants of R-E models [77], including plain Eikonal models with -recovery [83]. To demonstrate the feasibility of a sampling-based model calibration using the P-wave, we chose two popular approaches, the computationally expensive R-D monodomain model, requiring a high average spatial resolution of , and a lightweight R-E model at . Both models are combined with the lead field approach for the P-wave computation. We refrain here from providing a mathematical model formulation and refer to previous studies where all methodological underpinnings of the forward EP modeling have been described in detail [16, 42, 77]. All simulations are executed using CARPentry [77] for R-D and R-E simulation runs, respectively, as well as openCARP [85] only suitable for R-D simulations.
Baseline parameter setting for electrophysiological simulations
The dimensionality of the parameter space governing the spatial variation in conduction velocity is reduced as follows. First, the overall fiber arrangement is kept constant, and target conduction velocities are prescribed in the CT, PM s, IC, FO, and the wider LA and RA walls, on a per-region basis using reported ranges [31], eventually scaled to ascertain that the total atrial activation times computed with the R-E model fall within the physiological ranges [64].
Anisotropy in conduction velocity between longitudinal and transverse to the fiber directions was set to a value of 1.3 within the reported range of 1.0 to 1.6 [46, 48]. Atrial cellular dynamics were represented by the Courtemanche model [26], parameterized for various EP regions following [7] with increased sodium channel conductivity to obtain the prescribed conduction velocities. To identify the electrical conductivities for the R-D model at the targeted mesh resolution that match the R-E conduction velocities, the ForCEPSS framework [47] was employed, using reported values [92] for initialization. The chosen parameter settings are summarized in Table 4. Conduction velocities in the IC cables were considered parameters, tuned to obtain physiological inter-atrial activation delays and, thus, the separation of the contributions of RA and LA to the P-wave.
All simulations were conducted for a duration of to cover the total atrial activation time and, thus, the entire duration of the P-wave. All ECGs were filtered with a low-pass and a high-pass, and scaled by a factor of 0.2 to obtain ECG signals with the observed magnitudes [41].
| m/s | m/s | S/m | S/m | S/m | S/m | |
|---|---|---|---|---|---|---|
| RA | 0.97 | 0.74 | 0.583 | 0.742 | 0.232 | 1.162 |
| LA | 0.98 | 0.76 | 0.570 | 0.726 | 0.220 | 1.102 |
| CT | 1.21 | 0.92 | 0.904 | 1.112 | 0.416 | 0.899 |
| PMs | 1.30 | 0.99 | 1.053 | 1.339 | 0.408 | 2.042 |
| BB (atrial) | 1.40 | 1.08 | 1.229 | 1.564 | 0.479 | 2.399 |
| Rim FO | 0.33 | 0.24 | 0.080 | 0.102 | 0.034 | 0.168 |
We assessed the accuracy of the R-E model relative to a gold standard R-D monodomain model for simulating atrial activation and associated P-waves. Using the baseline setup (see Table 4), a normal sinus activation with associated P-wave was simulated on two models of the same biatrial geometry discretized at different spatial resolutions of and for R-E and R-D, respectively, according to their specific numerical requirements [76].
Effect of the BB insertion in the LA on the P-wave
Activation of the LA is mediated through discrete ICs with BB being a primary pathway [59, 98]. A site of insertion, , of an IC defines an earliest activation site, , of the LA and, thus, constitutes a major factor in shaping the LA contribution to the P-wave morphology. With traditional modeling approaches, relying on discrete meshing of the ICs, elucidating such effects is challenging, as any change in the insertion site requires major remeshing of the model. In this work, we aim at investigate the impact of the location of the central BB insertion on the LA activation and P-wave, by sweeping over the spatial parameter representing the BB insertion point on the LA wall, that is . The temporal parameter represents the activation time of , and depends on the length of the cable , and the designated conduction velocity . Here, we chose to prescribed , while varying dependently on the insertion point . Therefore, changes in will impact both the LA activation pattern, that is, the P-wave shape, and the initial activation time of the LA, corresponding to a shift in the portion of the P-wave related to the LA activation. The importance of these parameters is investigated concerning the sensitivity of the P-wave shape, and their ability to yield a large enough physiological envelope of P-waves to cover the true measured P-wave.
However, using a single IC cable to mediate BB conduction limits the model ability to produce single point-like LA activation sites, and potentially the ECG shape generation. As the number of inter-atrial cables is not limited in our modeling approach, we investigate a more realistic volumetric-like approximation of the BB band, by using multiple cables. Specifically, we select three points, (), on the anterior wall of the LA as locations for anchoring three reference cables representing strands of the BB, all of which originate from the midpoint of the RA lateral band of the BB. As per the single-cable case, each location was then varied within a circular area of , defining a set of alternative entry points , and corresponding automatically generated cables. By running a R-E simulation for each tuple of cables , the set of P-waves was finally computed.
Effect of the discrete RA endocardium on the P-wave
The endocardium of the RA consists of discrete structures in the form of muscular strands comprising CT, BB and PMs, that are partially attached to a thin and smooth epicardial layer [23, 50].
The effect of the added endocardial tissue in atrial EP simulation, especially the inter-pectinate tissue, on the P-wave has never been study before. To investigate the role of the RA endocardium on the P-wave, R-E model simulations were run using two different parameter settings for each biatrial model. In one setting, the RA endocardium was considered cardiac conductive tissue, while in the other, the tissue labeled as RA endocardium was treated as part of the bath surrounding the heart. In the former case, conduction velocity tensors, as presented in Table 7, were assigned to the RA endocardium tissue. In the latter case, this tissue was marked as torso tissue.
Calibration of the atrial activation sequence based on the P-wave of the 12 lead ECG
We investigate the feasibility of calibrating the atrial activation sequence to the corresponding patient P-wave by sampling key parameters to generate a P-wave envelope covering the observed P-wave data. Due to the high dimensionality of the parameter space, we restrict sampling to three key parameters that are expected to be the most influential in altering the different phases of the P-wave morphology [68]. These are:
-
1.
the location of the leading pacemaker site within the SAN, responsible for the initial RA activation. This site is known to be variable, allowing modulation of the onset phase of the P-wave. The SAN is an elongated and highly heterogeneous RA region with action potential properties, cell size, and capacity as well as conductance changing from the center to periphery [51], and along inferior-superior and caudal-cranial gradients [73]. For calibration purposes, we avoided modeling the physiological function of the SAN with biophysical detail and instead used only the spatial location of the exit site as a parameter. Specifically, the SAN was modeled as a focal activation site, with a short, cigarette-shaped band of in length [18, 71], located in the inferior-central part of the CT. Moreover, the SAN was electrically isolated by a non-conductive region along the boundary of the CT, replicating the effective block observed in physiological studies [33].
-
2.
Calibration to the overall duration of earlier phase of the P-wave was based on varying conduction velocities globally within the RA. Velocity in the longitudinal direction was uniformly sampled in steps of between and . Assuming rotational isotropy, velocity in the transverse direction was sampled in steps of between and , but kept smaller to the longitudinal velocity , in accordance with [31].
-
3.
Calibration of the shape and duration of the late phase of the P-wave, was based on manual variation of the anchoring sites of the ICs and of the global conduction velocities in the LA. Specifically, the BB was modeled as a three-cable band initiating at the same origin in the RA, and anchoring in the LA at three independent insertion sites. The other three ICs were also varied in the anchoring position on the LA, and conduction velocities in the cables were manually calibrated to control the timing of the initial LA activation.
Data analysis
We performed both qualitative and quantitative analyses of EP and P-wave variations resulting from the previously described modeling assumptions. The overall tissue activation was qualitatively analyzed by recording the total activation time of both atria. Changes in P-waves were quantitatively investigated using three different metrics.
In the presence of a reference signal , either simulated or given as clinical ECG data, we analyzed amplitude variation with the relative mean square error (RMSE) in percentage, as described in [57, 117]. For each lead , the RMSE is expressed as:
We computed the RMSE when comparing the R-E and R-D models when exploring the effect of the variation of the SAN and RA conduction velocity on the P-wave.
When analyzing the variations of the BB, whether using one or three cables, none of the computed ECG signals matched the real ECG data and could not be used as a reference to calculate the RMSE. For these test cases, we first defined an average P-wave, , for each lead . We then evaluated the overall morphological and amplitude P-wave variation by computing the mean absolute distance (MAD) of each resulting P-wave from the average one as:
| (1) |
where and are the varying computed signal and the average signal at time , and is the total number of ECG time samples. The MAD is then averaged over all leads.
Additionally, in all cases, we accounted for the variation of P-Wave Duration (PWD), obtained using a sloping approach [106]. The PWD was measured for each lead. Moreover, the PWD averaged over all leads was given.
3 Results
3.1 Model generation workflow performance evaluation
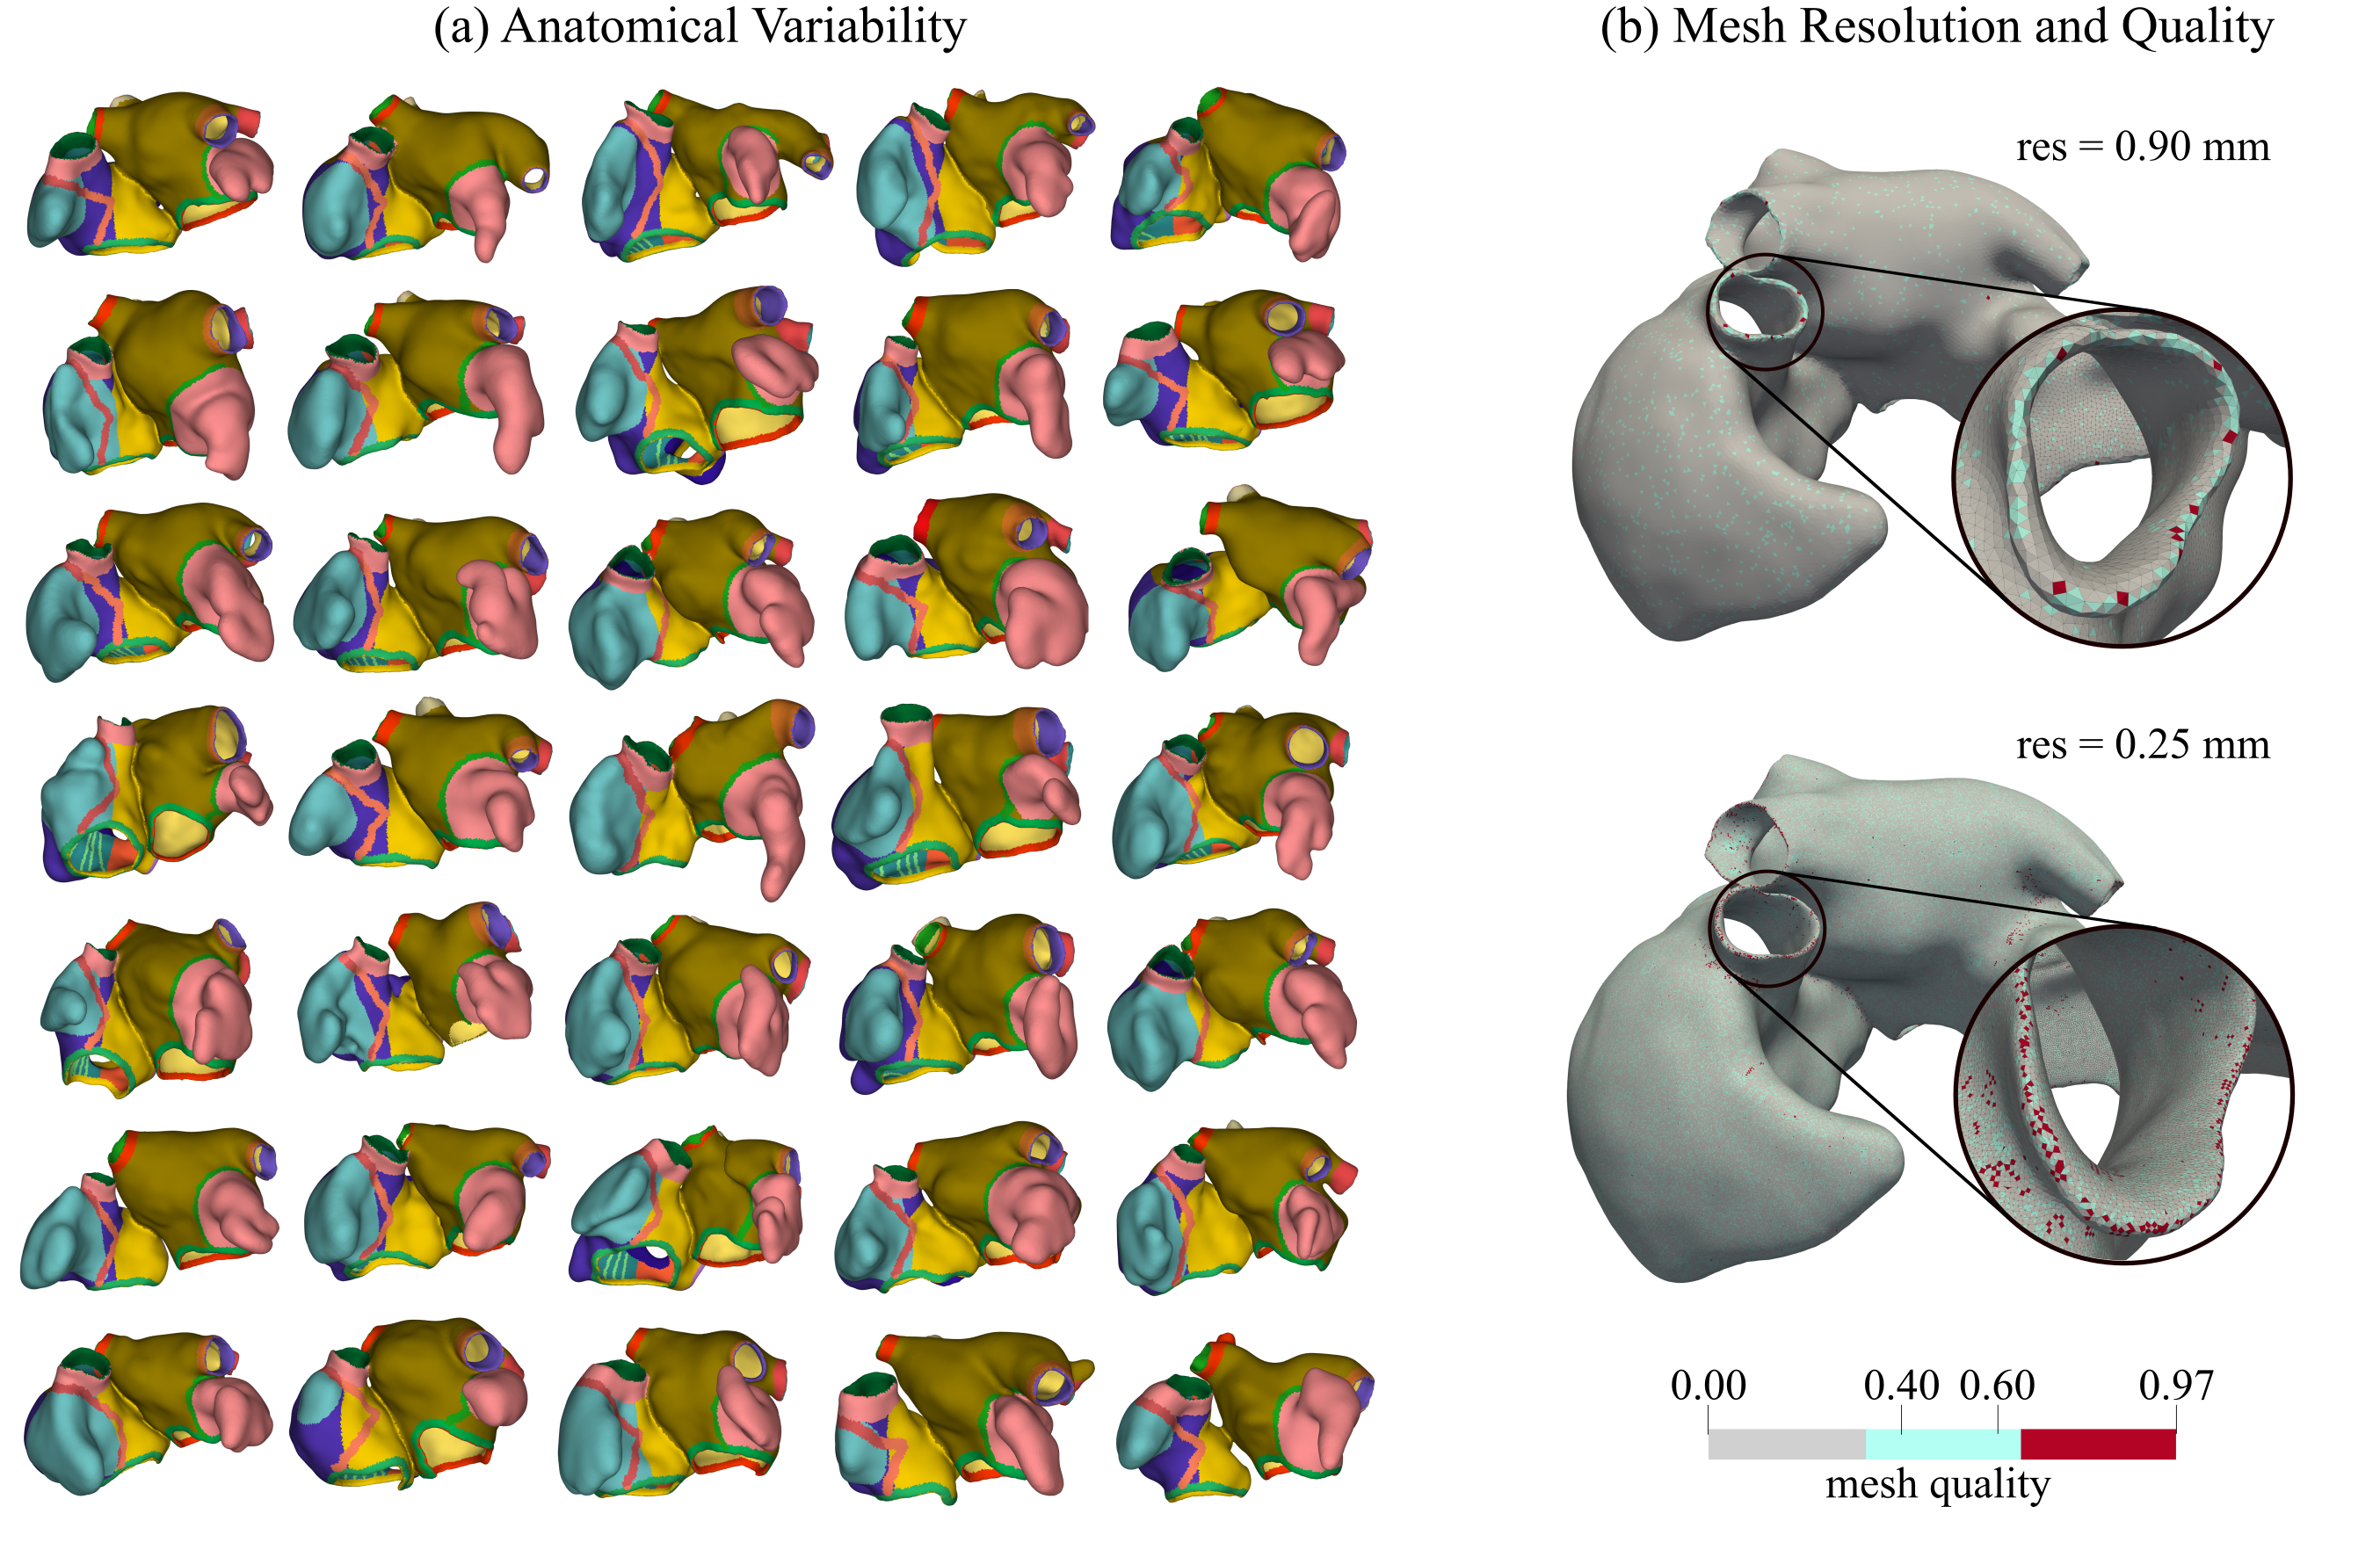
We evaluated our atrial model generation workflow with respect to the required processing time and the achieved degree of automation. 50 contrast CT datasets of AF patients were processed to generate biatrial models of target resolution of and , and the execution times of individual stages of the automated workflow were measured. After each stage, visual checks were performed to detect processing errors. Errors that required manual correction were recorded for each stage and at both target resolutions, and are summarized in Table Tab. 5. Benchmark results are reported for the execution of the workflow on a compute workstation equipped with an AMD Ryzen Threadripper PRO5965wx processor, using 16 CPU cores.
Overall, all 50 cases in both resolutions were processed automatically in the majority of cases (38), with only minimal user intervention required in 22 cases. The workflow produced anatomically highly detailed computational meshes, with fine-grained domain annotation, fiber arrangement, and an anatomical reference frame (referred to Figure 8). For the lower resolution R-E model, the overall processing per model lasted, on average, less than ten minutes. Higher resolution R-D compatible meshes were more costly to generate, specifically, the UAC generation stage where more than 84% of the costs incurred. Importantly, a fully automatic meshing processes was achieved in all cases, yielding meshes free of topological errors and of, overall, excellent mesh quality. Worst element quality was always below 0.99, according to the quality metric [55], which is considered a critical threshold in simulations using R-D solvers such as openCARP. Lower quality elements close to clustered mostly in high curvature regions, around the orifices of the thin-walled atria (referred to Figure 8).
3.1.1 Automation failure
A manual intervention was needed to separate the LSPV from the LAA in 19 cases, and the CS from the LA in 2 cases. The incorrect segmentation was however not due to the SCN, but to the low contrast in the acquired images. At the second stage, during the labeling of the blood pools, manual intervention was required to switch the CS with the IVC landmarks in 21 cases. The final marking of the veins and the corresponding tissue to discard from the blood pool, including the CS, LAA, and RAA, was automatically done by the workflow in 28 cases. For the remaining 22 cases, manual intervention was only needed to define or adjust the tissue to discard from the IVC to ensure a better opening.
| Mesh resolution/Model | Manual Correction | ||
| /R-E | /R-D | # Cases | |
| Automatic multilabel segmentation | 19 | ||
| Label augmentation on the blood pools | 22 | ||
| Walls extrusion and meshing | 0 | ||
| Selection of the atrial orifices | 0 | ||
| Anatomical structures and fibers | 0 | ||
| Universal atrial coordinates | 0 | ||
| Total processing time | – | ||
3.2 EP simulation workflow performance evaluation
The efficiency of our workflow in the function twinning stage, that is of simulating atrial EP for high fidelity ECG generation, was tested for both R-E and R-D models for all 50 patients. Execution times of individual processing stages – comprising torso generation, setting up of ICs, computation of the ECG lead fields, and the simulation of an entire atrial activation sequence initiated at the SAN– were measured (refer to Table Tab. 6 and Figure 9). As shown previously in detail [42], owing to its relaxed mesh resolution dependency, the R-E model is significantly more lightweight, facilitating the setup of an EP model in and the computation of a full biatrial activation sequence with a high fidelity ECG in . All steps of the workflow are computationally more costly due to the stricter mesh resolution requirements, requiring for setup, and for computing the activation sequence and the ECGs. While formally the same torso surface was employed, extra costs were incurred due to the required mesh conformity at the atrial surfaces, leading to a markedly higher number of elements in the R-D case.
| Mesh resolution / Model | ||
| / R-E | / R-D | |
| Volumetric torso | ||
| Interatrial connections | ||
| Lead field | ||
| EP simulation | ||
The computational costs of creating the IC cables also showed slight differences between the coarse mesh and the fine mesh, averaging and , respectively. However, this difference is negligible compared to the total costs of generating the biatrial and torso geometry, as well as the CPU time required for the computation of the lead field solution, which is of for the R-E mesh, and for the R-D grid, and the EP simulation, corresponding to of computation for the R-E model, and to for the R-D gold-standard monodomain model.
3.3 Assessing discrepancy between R-E and R-D model
To evaluate the computational fidelity of the R-E model compared to a gold standard R-D monodomain model [74], we compare the spatiotemporal distribution of electrical sources, , the activation maps, , and the P-wave generated by both models, employing the baseline parameter settings in Section 2.2.2. Results are illustrated for a representative test case in Figure 9.
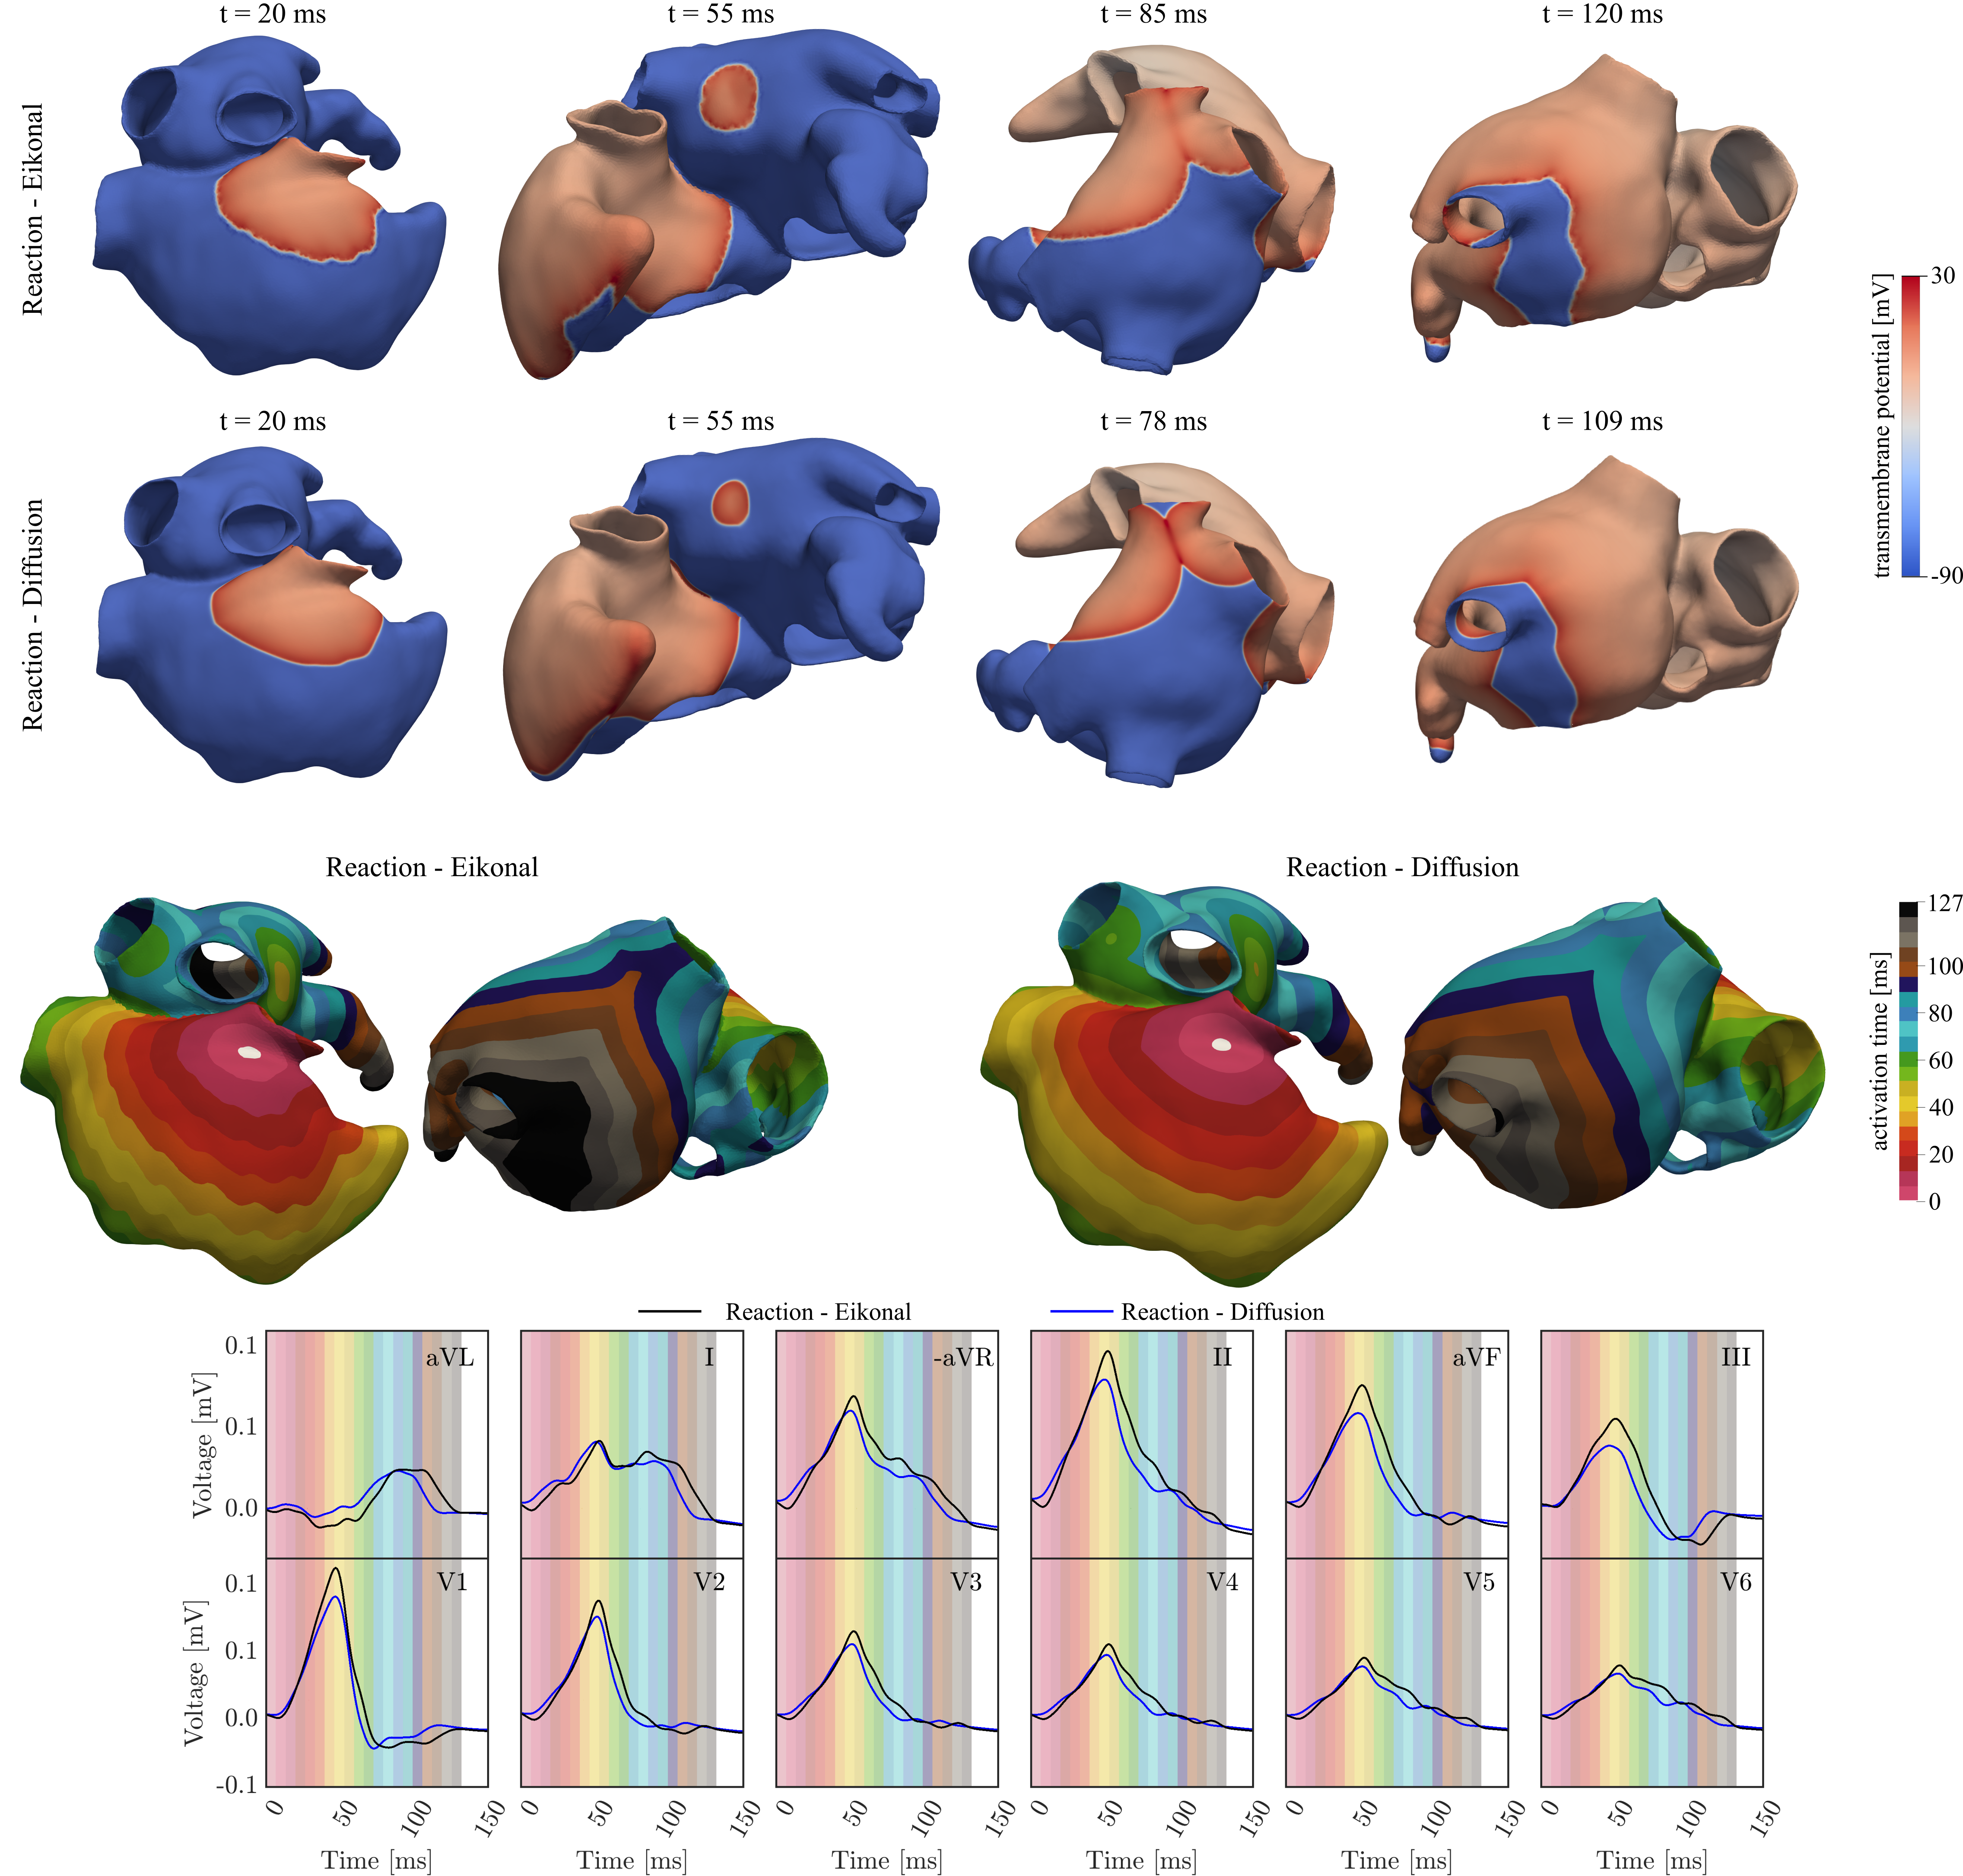
Overall, the model parameters calibrated to match R-D and R-E conduction velocities led to nearly identical activation patterns. Minor differences emerged due to imperfect matching of conduction velocities in the RA and LA tissue, as well as in the IC cables, and differences in anterograde and retrograde activation by the ICs cables mediated by an electrotonic source-sink mismatch at the interface between cable and tissue (refer to Figure 9, top panels). These combined effects led to a slightly longer total activation time of the atria, which manifested in minor differences in the PWD, with an average variation of .
Differences in P-wave morphology and magnitude were negligible, with a maximum amplitude difference in lead II of 5%, and an average RMSE across all leads of 3.71% (refer to Table 7). Magnitude differences could be attributed to the difference in spatial resolution, as these disappeared when running the R-E simulation on the higher resolution mesh (not shown).
| Lead | aVL | I | -aVR | II | aVF | III | V1 | V2 | V3 | V4 | V5 | V6 | Average |
|---|---|---|---|---|---|---|---|---|---|---|---|---|---|
| RMSE% | 3.56 | 3.44 | 3.54 | 5.16 | 4.87 | 5.17 | 4.64 | 3.66 | 3.09 | 1.69 | 2.39 | 2.34 | 3.71 |
| PWD R-Ems | 128 | 131 | 131 | 125 | 129 | 89 | 126 | 131 | 123 | 126 | 131 | 131 | 125.1 |
| PWD R-Dms | 121 | 124 | 121 | 124 | 129 | 90 | 120 | 131 | 123 | 126 | 131 | 131 | 122.6 |
3.4 Impact of Bachmann’s Bundle insertion on the P-wave
The role of BB insertion site on the LA activation and P-wave morphology was investigated. The use of a cable-based IC formulation readily facilitated a parametric sweeping of , where was varied within a radius of around the reference location, , as used above. Shifts in altered the location and timing of wavefronts collisions with waves initiated through the other ICs. These were predominantly the rim of the fossa ovalis, activating the LA almost synchronously with the BB, and the posterior-superior IC, activating the carina of the LPVs with a delay of . This entailed a change in the total activation time of the LA, and induced a spread in PWD and magnitude of the P-wave, with very limited effect on the corresponding morphology (refer to Figure 10).
Variation of alone led to differences in total activation time of , in PWD between to in individual leads, with a minimum and maximum average PWD of 104 and across all leads, respectively, and in magnitude to a mean absolute distance (1) between 4.410-4 and 2.610-3 mV. A quantitative summary on PWD variability is given in Table 8.
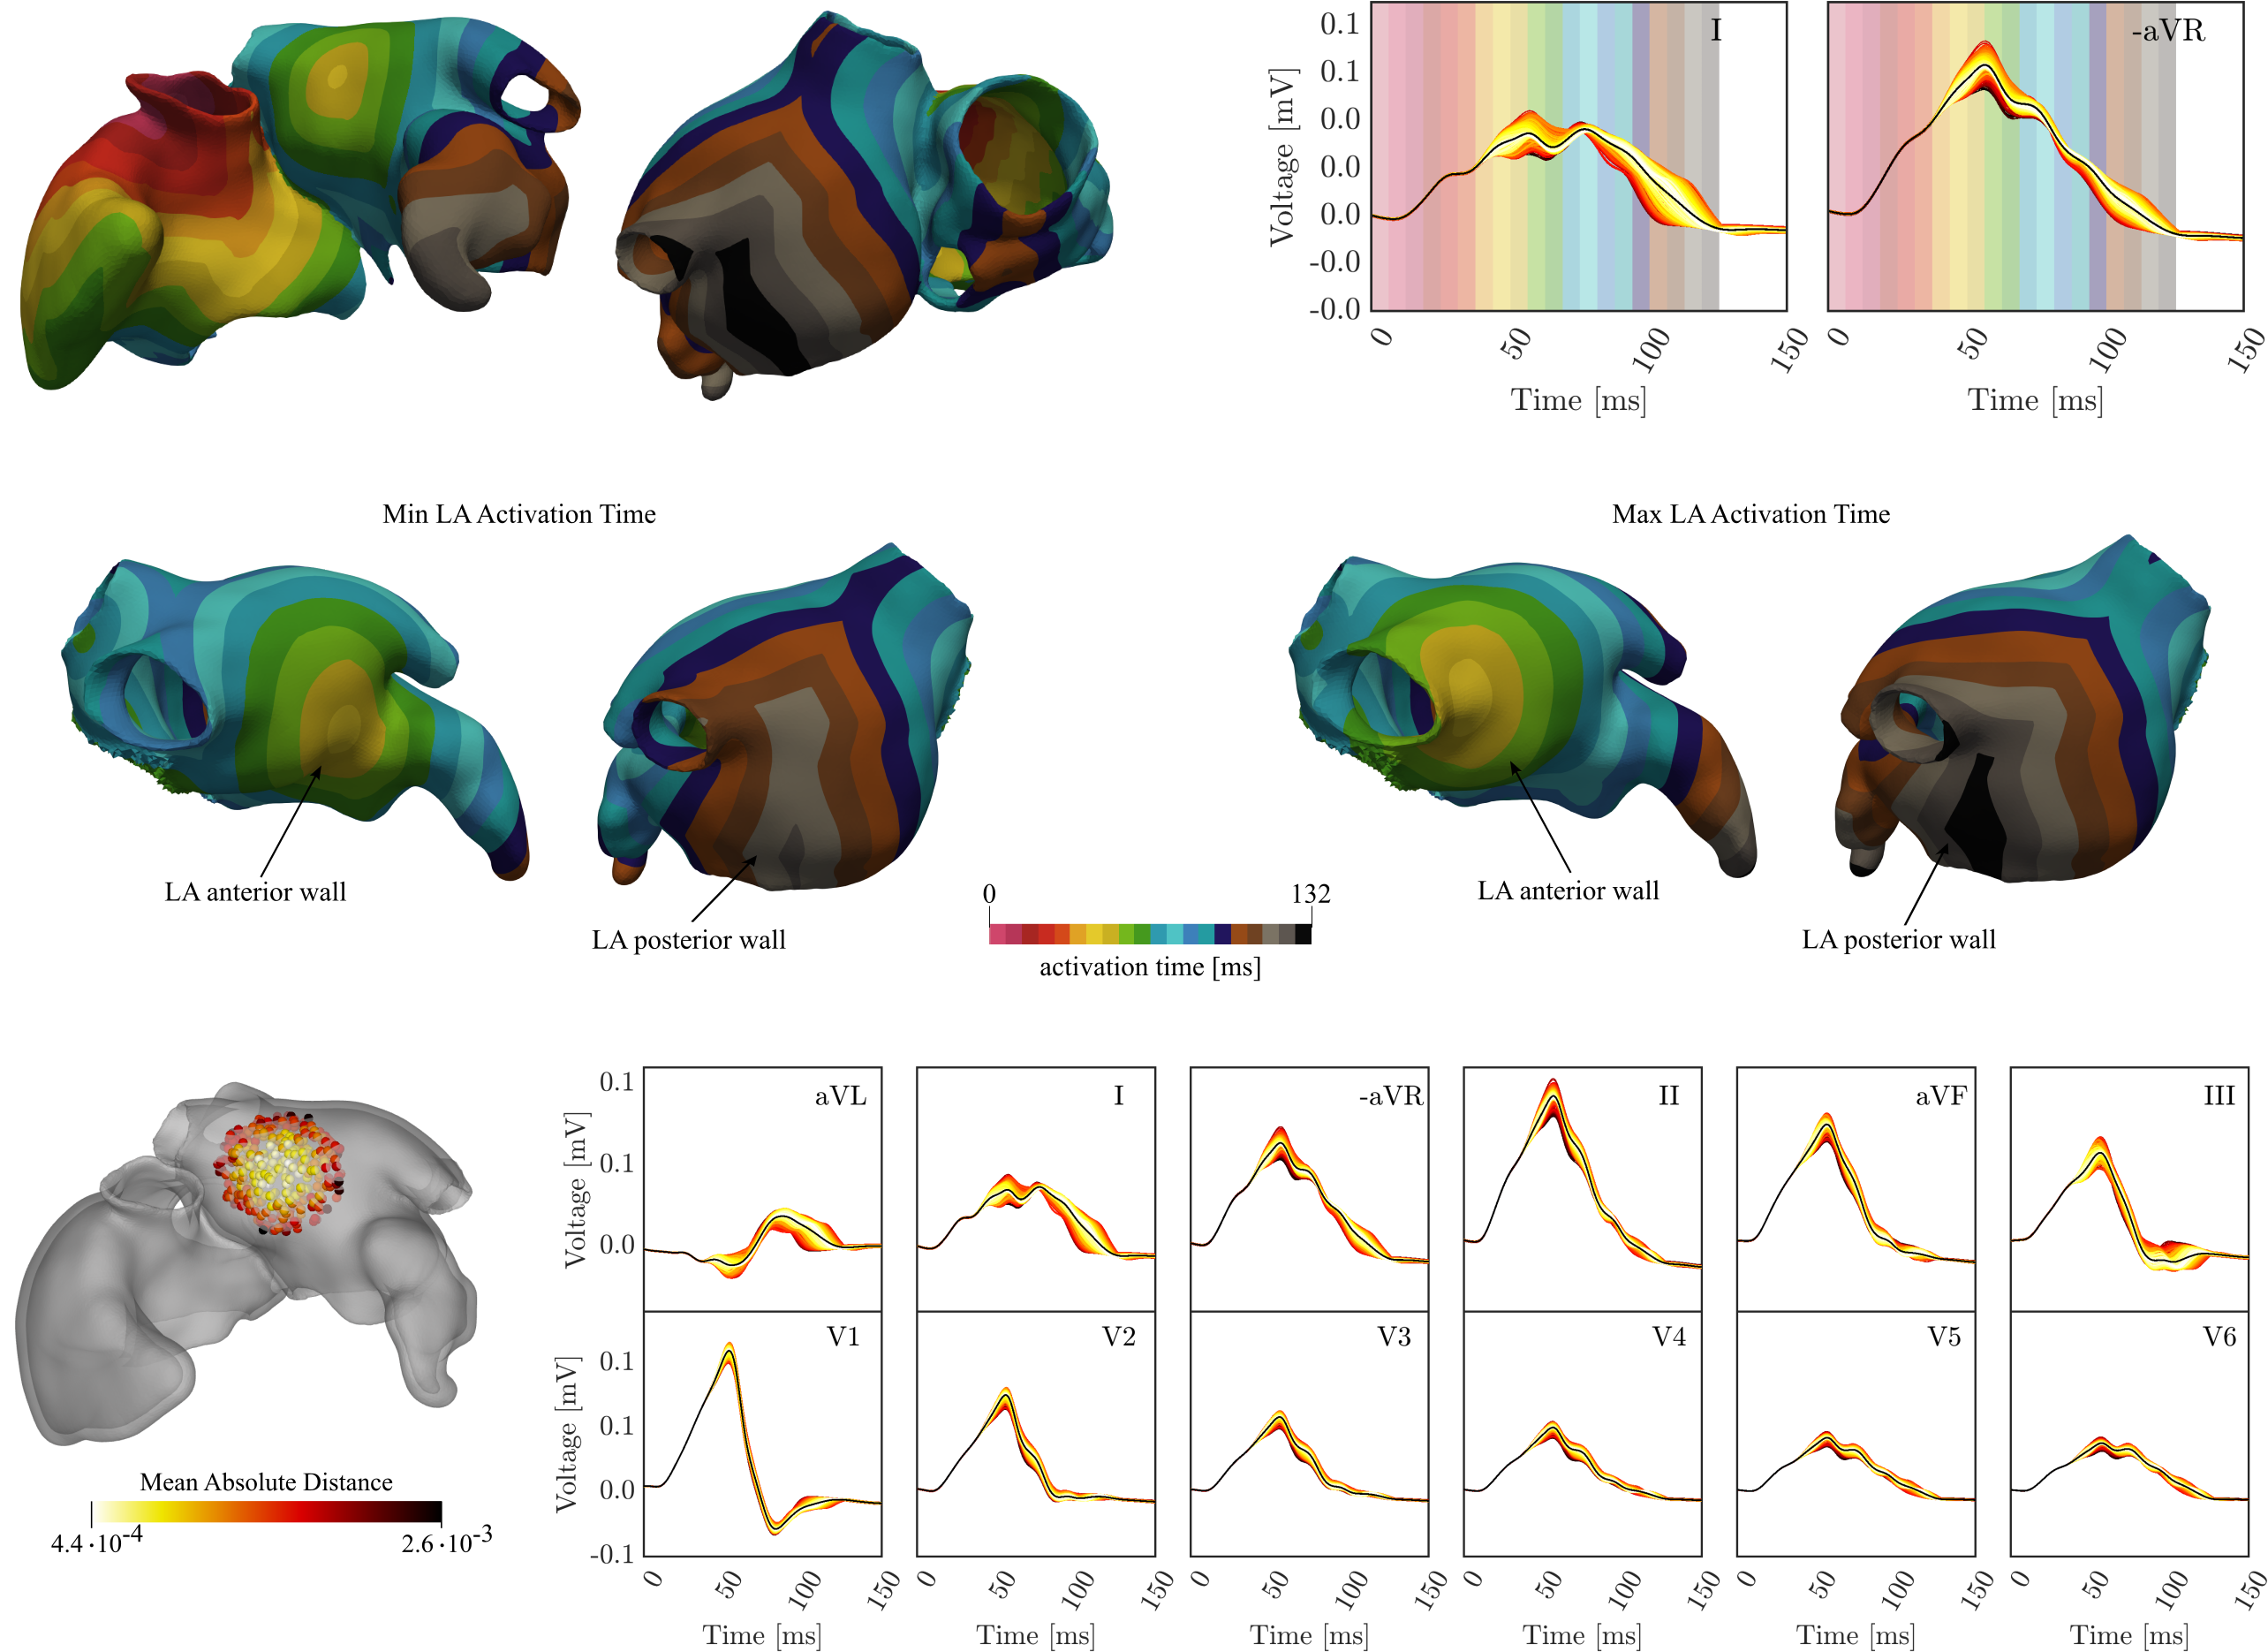
| Lead | aVL | I | -aVR | II | aVF | III | V1 | V2 | V3 | V4 | V5 | V6 | Average |
|---|---|---|---|---|---|---|---|---|---|---|---|---|---|
| Min PWDms | 93 | 93 | 108 | 110 | 104 | 107 | 99 | 106 | 106 | 106 | 106 | 106 | 104,2 |
| Max PWDms | 117 | 115 | 124 | 126 | 119 | 120 | 118 | 118 | 118 | 124 | 124 | 123 | 120,5 |
| (Max - Min) PWDms | 22 | 16 | 13 | 16 | 24 | 15 | 19 | 12 | 12 | 18 | 15 | 14 | 16,3 |
3.5 Effect of a fan-like LA insertion Bachmann’s Bundle on the P-wave
Our modeling approach flexibly supports an arbitrary number of ICs cables which can be bundled to increase source strength for generating ECGs and EGMs, or to model inter-atrial coupling with higher anatomical complexity. This ability is showcased for investigating the influence of a distributed fan-like insertion of BB into the LA with three independent coupling locations. An exemplary activation map along with the resulting distribution of P-waves is shown in Figure 11. As the same velocity was assumed in all cables the initial activation at the three LA insertion sites was not synchronous but led to an elongated area of early activation along the location of the wide BB.
The total activation time was observed between 118 and , comparable smaller than the BB single-cable case.
The highest variation in the P-wave was observed between 80 and , corresponding to the activation of the posterior wall of the LA. The average range of variation of the PWD was registered from 102 to , thus smaller than the single-cable case. The maximum and minimum PWD over the leads was also reduced compared to the single-cable case, with maximum variation in lead aVL and II.
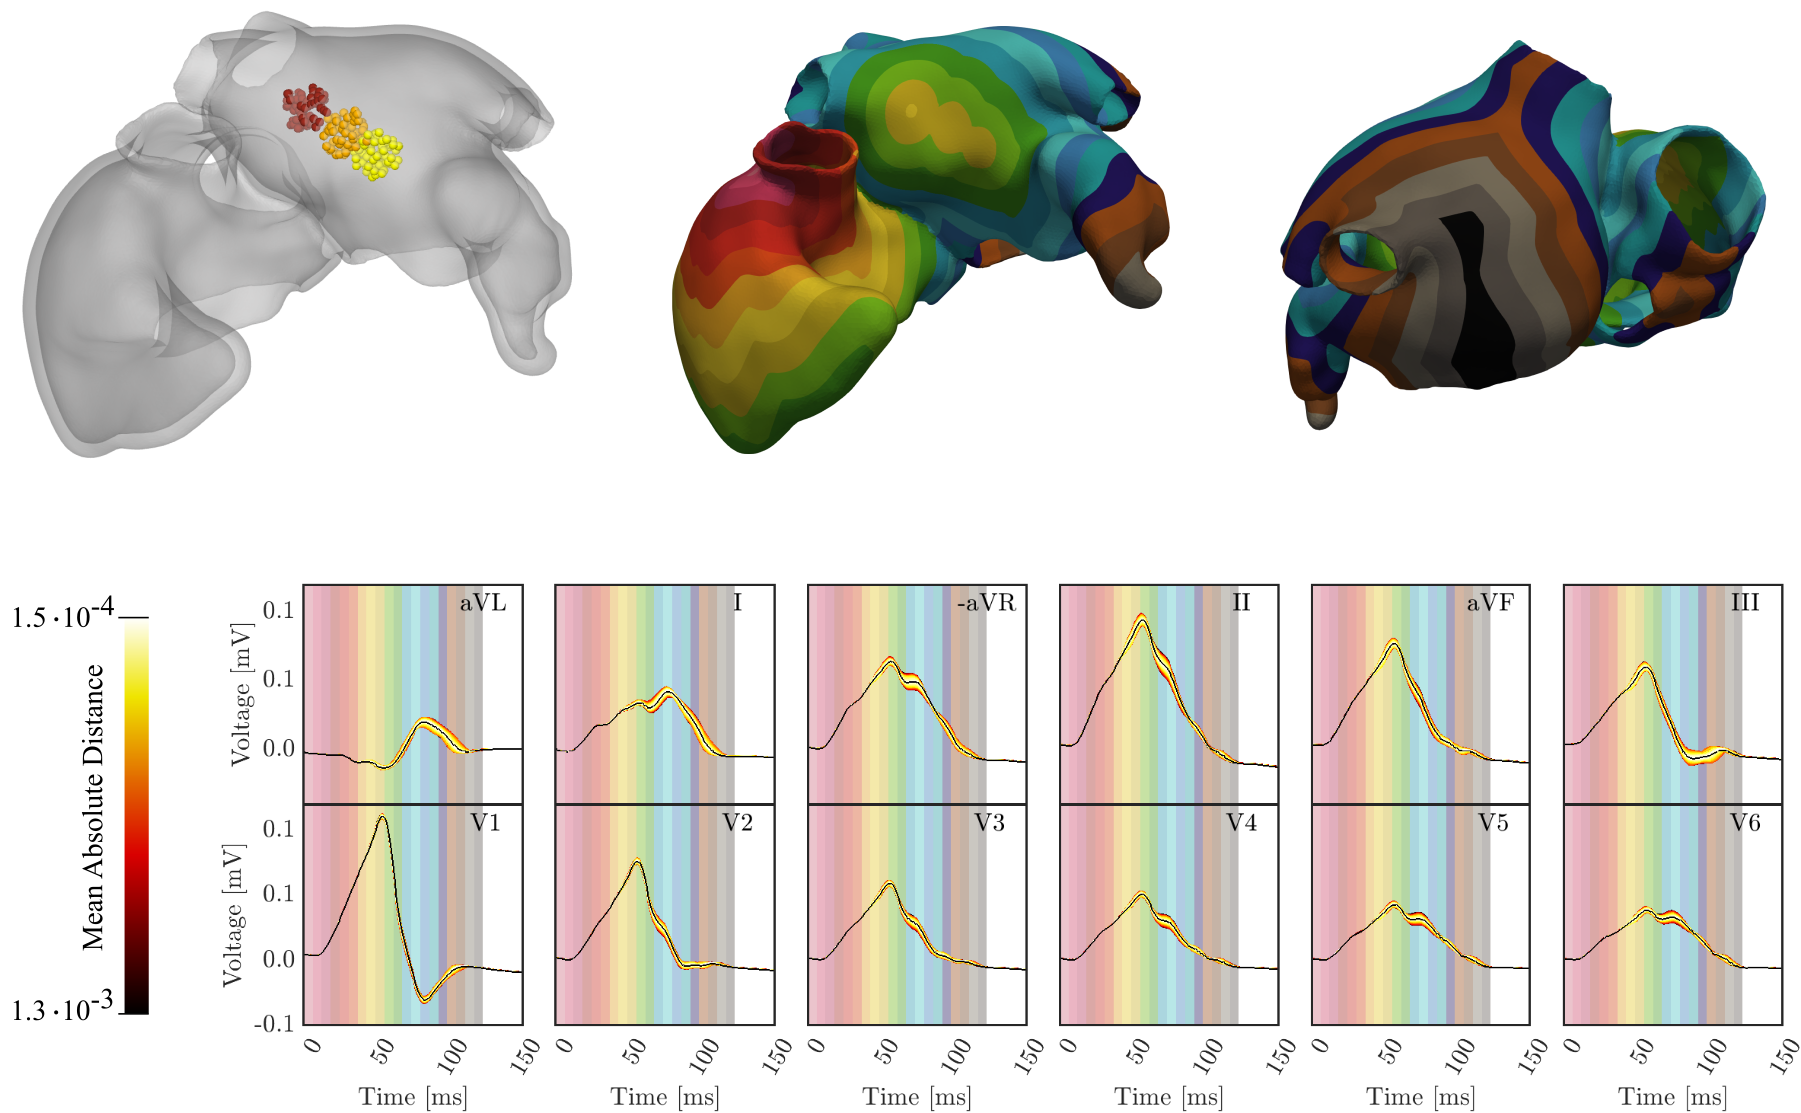
| Lead | aVL | I | -aVR | II | aVF | III | V1 | V2 | V3 | V4 | V5 | V6 | Average |
|---|---|---|---|---|---|---|---|---|---|---|---|---|---|
| Min PWDms | 80 | 100 | 107 | 110 | 95 | 107 | 94 | 98 | 110 | 110 | 109 | 109 | 102,4 |
| Max PWDms | 89 | 114 | 115 | 118 | 99 | 115 | 104 | 108 | 113 | 113 | 115 | 116 | 109,9 |
| (Max - Min) PWDms | 9 | 14 | 8 | 8 | 4 | 8 | 10 | 10 | 3 | 3 | 6 | 7 | 7,5 |
3.6 Effect of the RA endocardium on the P-wave
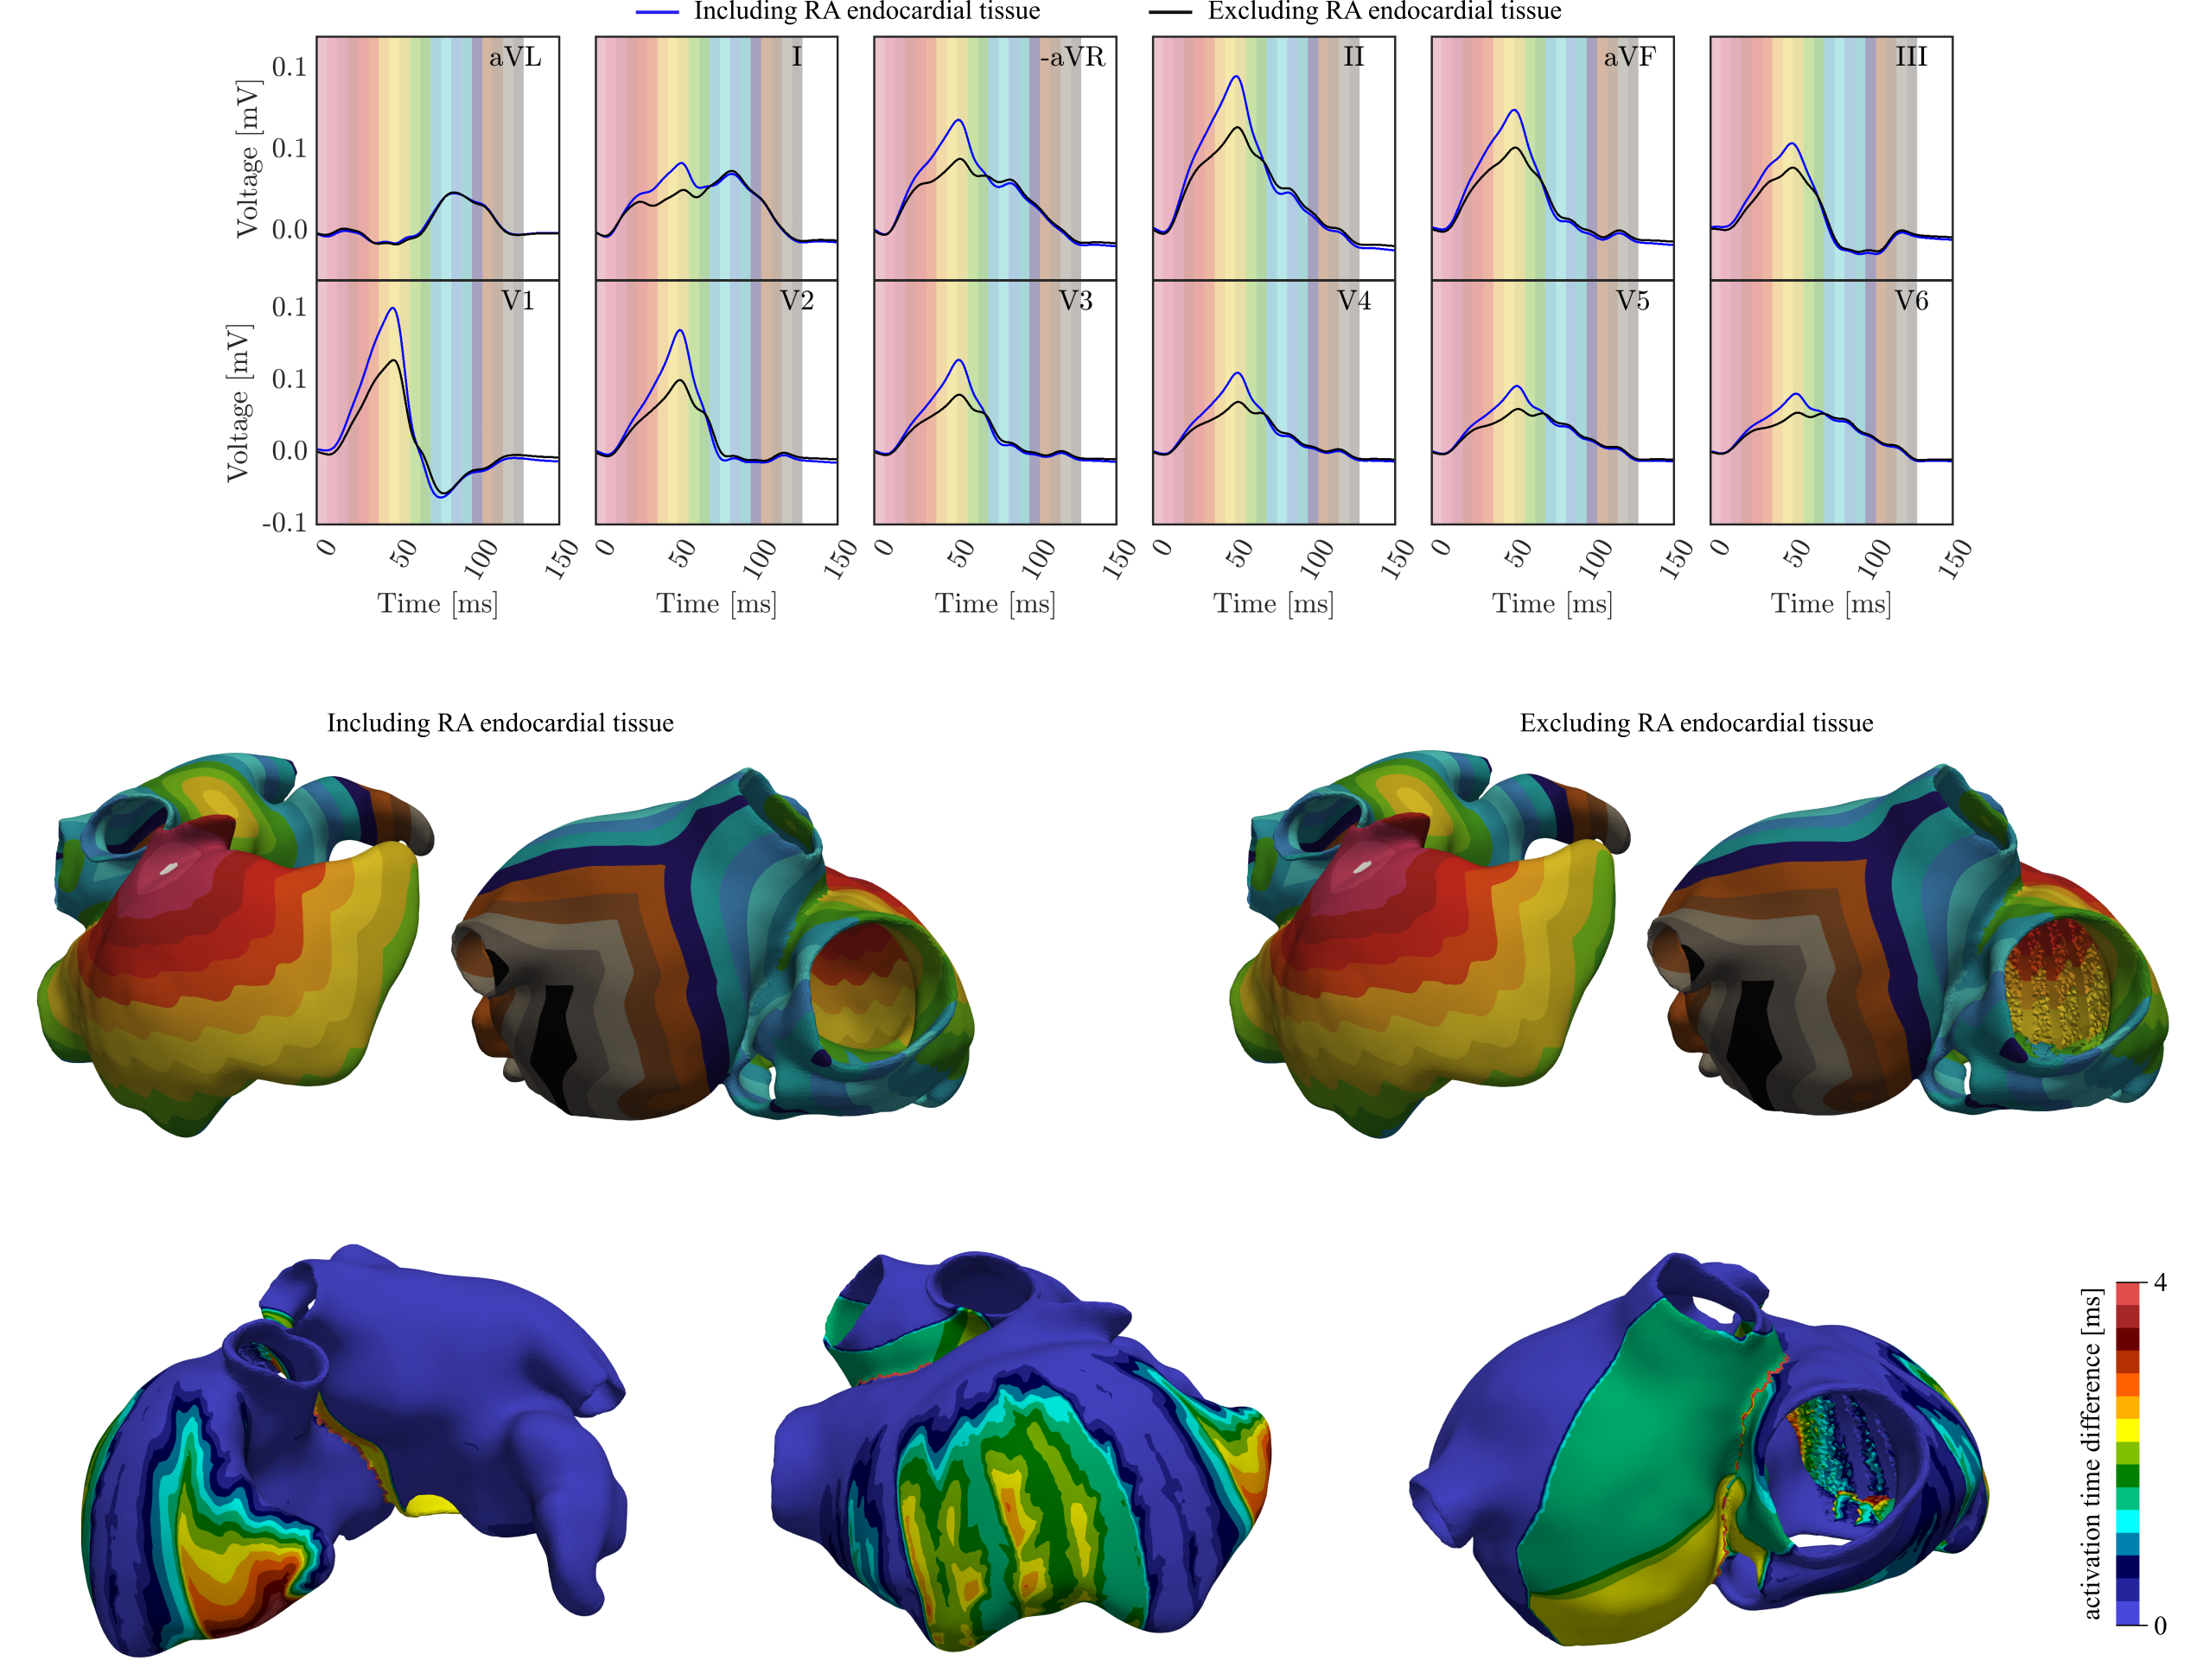
The ECGs obtained by simulating the atria, both including and excluding the RAs endocardial layer outside of the PM and CT, are shown in Figure 12. A decrease in wave amplitude between 14 and , corresponding to the activation of the RA, was observed in all leads. The RMSE in percentage is reported in Table 10. The major amplitude variation, exceeding 1%, was observed in leads II, V1, and V2, which capture the signal propagation towards the RAA and the PM. Variations between 0.49% and 0.91% were observed in all other leads, except for aVL, where the variation was almost null. The PWD, as reported in Table 10, remained unchanged in all leads.
| Lead | aVL | I | -aVR | II | aVF | III | V1 | V2 | V3 | V4 | V5 | V6 | Average |
|---|---|---|---|---|---|---|---|---|---|---|---|---|---|
| RMSE% | 0,08 | 0,63 | 0,91 | 1,19 | 0,88 | 0,58 | 1,31 | 1,18 | 0,85 | 0,72 | 0,58 | 0,49 | 0,78 |
| PWD [ms] | 114 | 119 | 120 | 121 | 97 | 89 | 111 | 86 | 88 | 99 | 101 | 121 | 105,5 |
The ECG variations were related to the computed activation maps and their absolute difference, depicted in Figure 12. When the RA endocardial wall was included, the signal propagated faster on the posterior part of the RAA, on the posterior-lateral wall of the RA near the PMs, and on the septum. A total activation delay of about was observed at the tip of the RAA, and on the epicardium between the PMs. The BB, RA anterior wall, and the CT were activated at the same speed. However, the removal of the RA endocardial layer between the CT and the septum caused a delay in the activation of the septum and the RA wall near the CS. Although this delay did not affect the overall RA activation, it slightly impacted the activation of the posterior wall of the LA, causing a total delay of up to in the posterior-inferior region. Nonetheless, the total activation map of the LA remained almost unchanged, consistent with the computed ECG s.
3.7 Calibration of the atrial activation sequence based on the P-wave of the 12 lead ECG
One anatomical model of a patient was selected along with the recorded P-wave under normal sinus rhythm. To keep the calibration procedure tractable, the parameter space to be explored was restricted to the initial exit site at the SAN, the conduction velocity in the RA, and the location and timing of three insertion sites of BB in the LA. In a first pseudo-calibration step for a fixed SAN exit site and baseline velocities in the RA, the location of BB was varied in interactive simulation runs to obtain a close approximation of the terminal half of the P-wave. One configuration yielding a good morphological fit in all leads, assessed only by visual inspection, was selected (see Figure 13, top row).
Keeping the BB fixed, the physiological envelope of the P-wave signals was computed by sampling over , , and (see Figure 13, mid row). The P-wave envelope under this sampling covered the observed clinical signal in most leads quite well, with the exceptions of leads aVL, -aVR and V1. While the discrepancy in the low amplitude P-waves in leads aVL and -aVR were rather small, this was not the case in lead V1 where the biphasic P-wave could not be approximated. The terminal negative deflection of the measured P-wave was likely mediated by fibrotic tissue in this AF patients with impaired electrophysiologicalglsep excitability and repolarization properties.
Quantitatively, the P-waves were well approximated, with a RMSE in the range of . The minimum RMSE was achieved when the SAN was positioned at 62% along the IVC-SVC axis and 35% along the lateral-to-septal axis (see Figure 13, top row), with conduction velocities of and . The RMSE values, as well as the PWD for each lead, obtained with the optimal parameter set that minimized RMSE are presented in Table 11. On average, simulated PWD was longer than clinical PWD, with versus , suggesting that calibration could be further improved by including IC and LA velocities in the sampled parameter space.
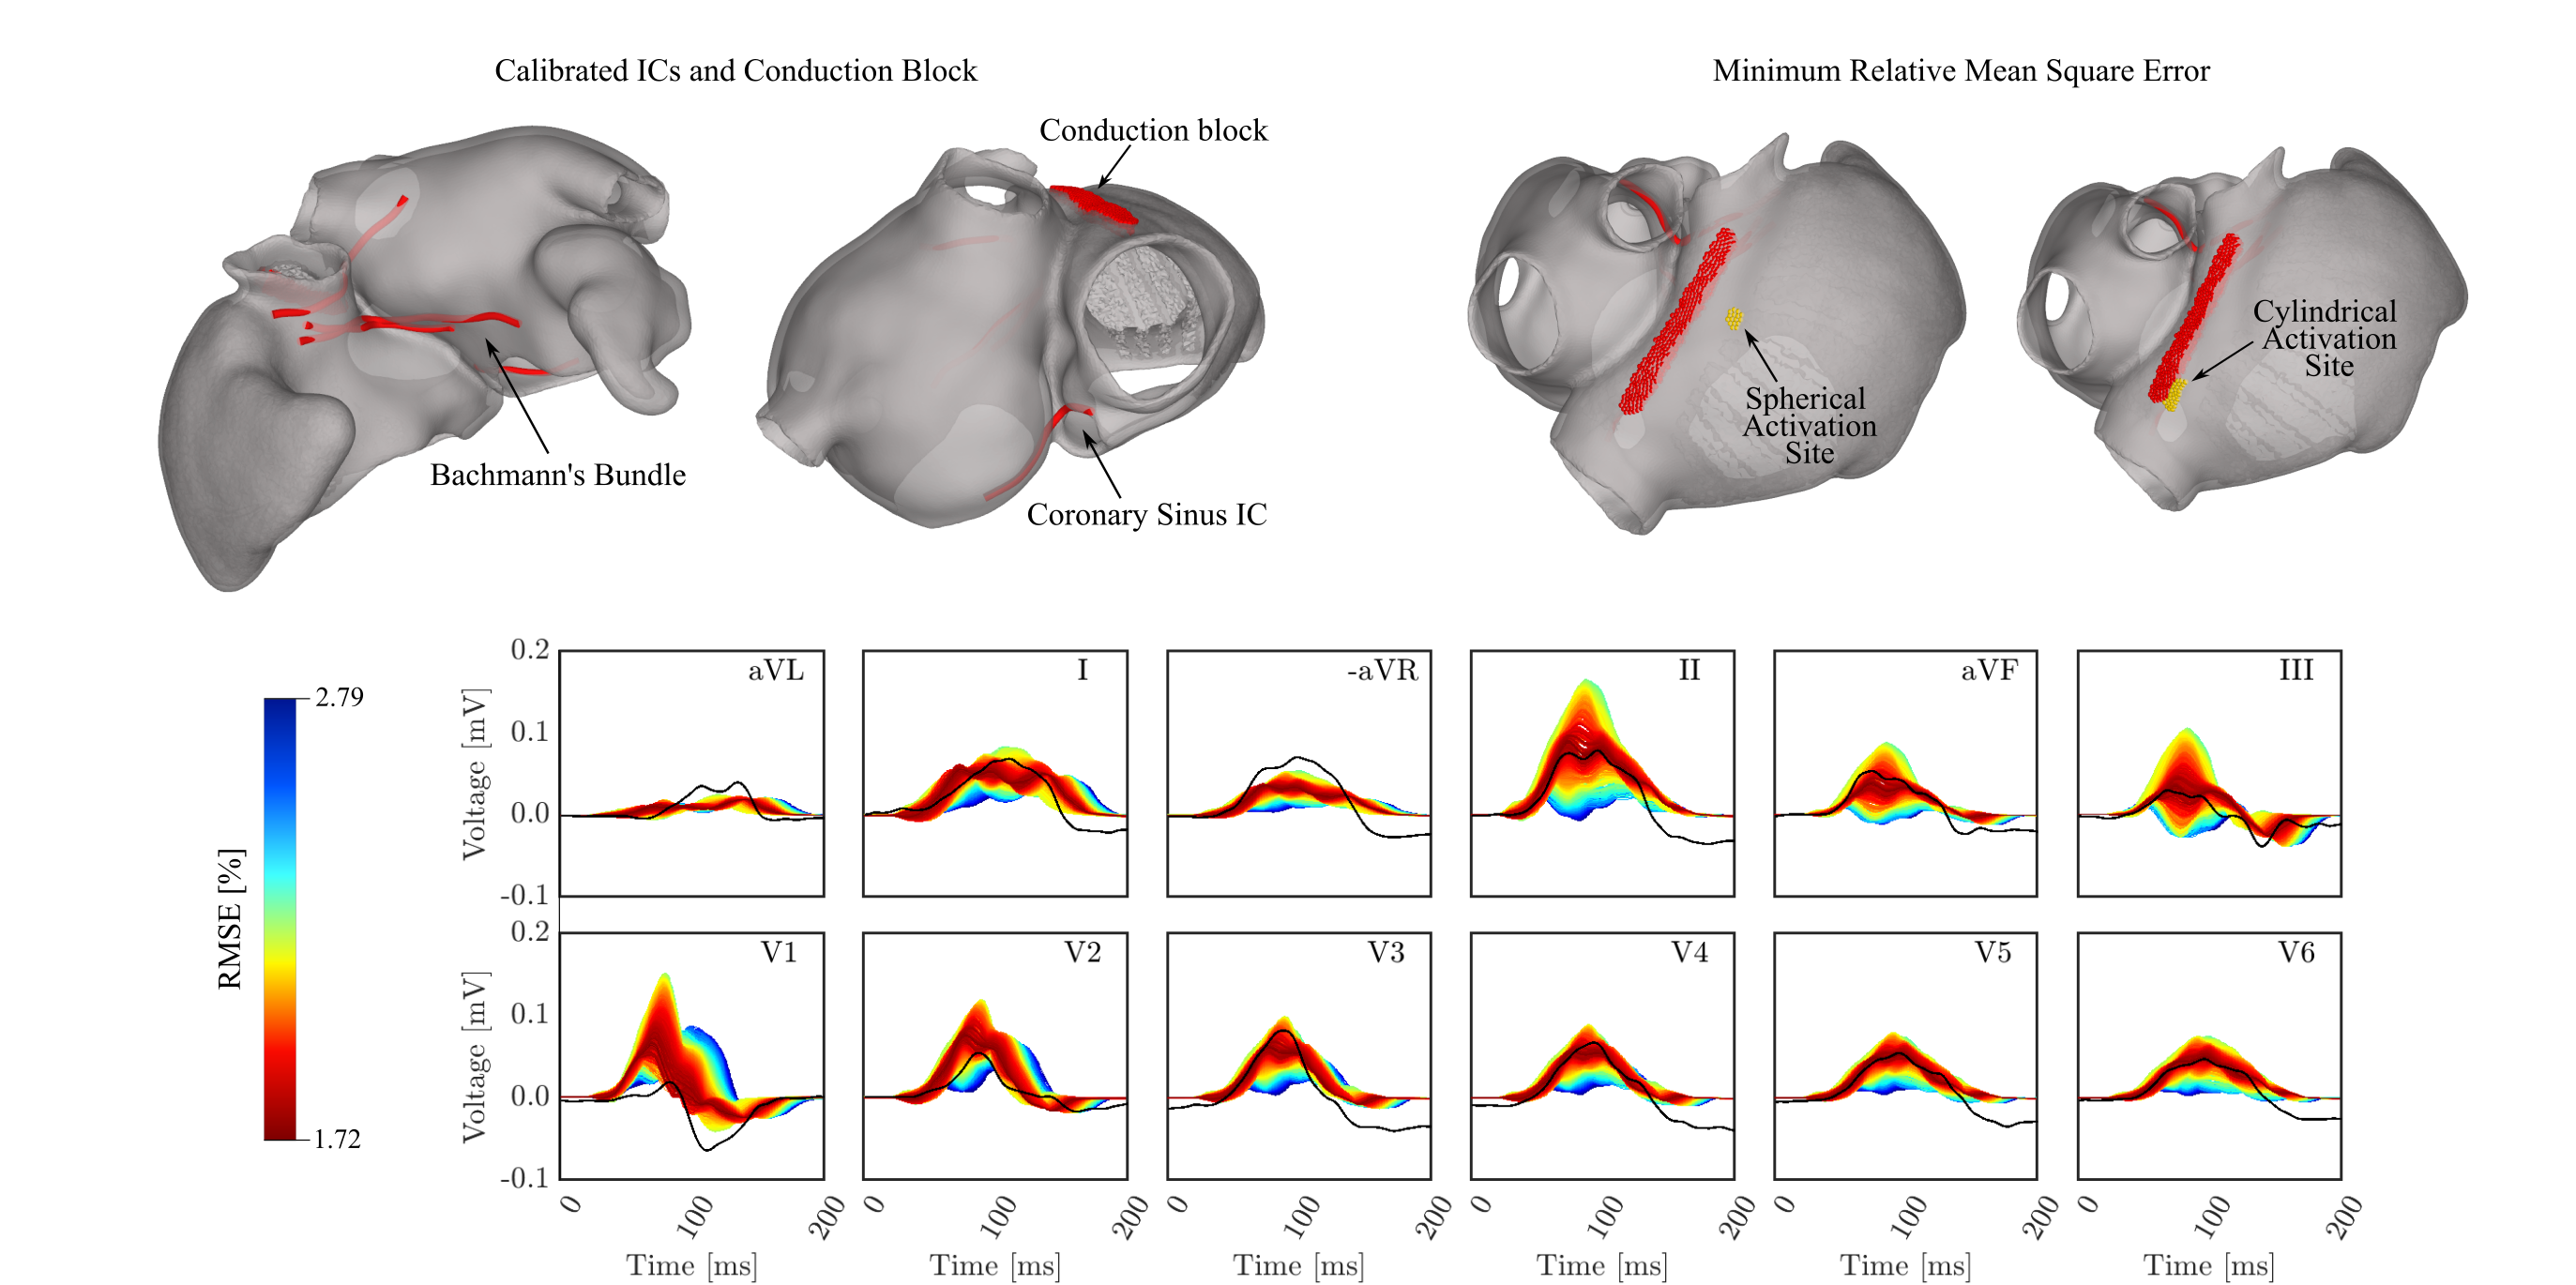
| Lead | aVL | I | -aVR | II | aVF | III | V1 | V2 | V3 | V4 | V5 | V6 | Average |
|---|---|---|---|---|---|---|---|---|---|---|---|---|---|
| min RMSE% | 1.16 | 1.68 | 2.27 | 2.06 | 1.33 | 1.02 | 2.60 | 1.51 | 2.22 | 1.87 | 1.58 | 1.37 | 1.72 |
| PWDms | |||||||||||||
| Clinical data | 139 | 147 | 123 | 124 | 127 | 146 | 134 | 125 | 118 | 132 | 120 | 129 | 130.33 |
| Simulated ECG | 136 | 137 | 135 | 150 | 133 | 151 | 145 | 142 | 131 | 129 | 131 | 151 | 139.25 |
| Diff with data | 3 | 10 | 12 | 26 | 6 | 5 | 11 | 17 | 13 | 3 | 11 | 22 | 8.92 |
4 Discussion
In this study, we present a highly automated scalable end-to-end workflow for generating patient-specific anatomical digital twins of human atria for their efficient calibration based on clinical data, e.g. the ECGs. Our novel workflow is comprehensive, including the generation of an anatomical reference frame, that facilitates parametric encoding of all space-varying EP model properties, as required for model calibration, a detailed annotation of all relevant anatomical landmarks and structures, including a fiber architecture based on a detailed anatomy-informed set of rules, and a new method for lightweight and flexible ICs.
Our workflow, implemented in a single software building on meshtool [79], generates smooth biatrial anatomical representations of sufficient mesh quality for a range of resolutions suitable for the entire spectrum of atrial EP simulations. Both coarser meshing at for real-time calibration using R-E type models [77, 83], as well as finer meshing with sufficient resolution for fully mechanistic R-D modeling studies, is supported. The workflow efficiently generates simulation-ready models within less than 10 minutes at a reference resolution of approximately . In contrast to previous approaches for building volumetric biatrial models, that used statistical shape models to generate virtual anatomies [75, 94], our approach generates accurate representations of an individual patient’s atrial anatomy, with fidelity being limited only by image quality and segmentation accuracy. A key advantage of our approach is its robustness, as the description of anatomy is built on a volumetric image stack. This avoids the more common manifold extrusion procedure prone to topological mesh errors.
Building on this anatomical model generation pipeline, the workflow is moreover extended for ECG based model calibration, employing either R-E-based real-time EP modeling, suitable for EP calibration, or a full fidelity computationally more demanding R-D model, suitable for predictive simulations. Inter-atrial conduction is modeled by initially imposing electrical insulation between the RA and LA [25], and then discretely reconnecting them using a novel, highly flexible, and physiologically constrained method. This approach employs auto-generated cables to establish inter-atrial conduction pathways, accurately representing all anatomically significant ICs between the RA and LA. Our approach facilitate the generation of pathways with prescribed conduction velocities to connect arbitrary parametrically steerable locations within RA and LA on the fly, and, thus, avoids rigid and error-prone explicit meshing of inter-atrial bundles [75].
Finally, we employ a forward ECG generation framework based on the Reaction-Eikonal Lead Field (RELF) model that yields full fidelity ECGs with real-time performance, to support a clinically compatible model calibration procedure. To this end, volumetric atrial models are swiftly registered with reference torso models with corresponding electrodes, and integrated into volumetric conformal atria-torso meshes. All combinations of cardiac EP source and field models are supported. As mesh conformity is preserved, high fidelity ECGs and EGMs can be computed over the entire solution domain based on either bidomain or lead field formulation, without being restricted to lower fidelity methods such as potential recovery [16], or boundary element approaches, that require smooth low pass pass-filtered coarse representations of the atrial sources [103].
The ability to compute full fidelity ECGs with close to real-time performance is demonstrated by exploring important parameters governing the genesis of the P-wave, which were impossible or notoriously difficult to explore with previous approaches, e.g., the anatomy of ICs. We show the equivalence in activation patterns and ECGs between the lower resolution R-E model, and the high resolution R-D model, with discrepancies well below the overall model uncertainty. These combined features make our end-to-end workflow suitable for large-scale atrial EP modeling studies. The achieved model efficiency supports a fast exploration of the high-dimensional parameter space spanned by atrial anatomy, structure and EP, by facilitating unattended sweeps over important space-varying parameters which is needed for the automation of optimization loops using ECG or EGM observations as target for calibration.
4.1 Scalable generation of volumetric biatrial anatomy models
Robust computational workflows capable of generating comprehensive volumetric biatrial anatomical models, with fiber architecture and anatomical reference frames at scale remain challenging. Only a few approaches have been reported to date, exhibiting significant variation in the degree of automation, anatomical and structural fidelity, flexibility in prescribing fiber architecture, and their ability to generate clinically observable signals such as EGMs and ECG with sufficient accuracy.
The majority of atrial modeling studies using larger cohorts relied upon a bilayer formulation [62] which greatly simplifies the meshing procedure and reduces computational expenses at the cost of decreased biophysical fidelity. For instance, it has been demonstrated that the behavior of bilayer models may differ strikingly from full 3D models with respect to propagation patterns and arrhythmia dynamics [95]. Discrepancies may stem from various factors such as e.g. altered source-sink relations, the impact of mediating transmural conduction through resistive coupling between the endocardial and epicardial layers using finite elements of incompatible dimensionality, or differences in inter-atrial conduction pathways. Another important limitation of bilayer models is their reduced accuracy in representing the atrial sources, and a lack of suitable approaches for computing higher-fidelity extracellular potential fields [16], due to incompatibility with standard Finite Element Method (FEM). As such, modeling clinical data, such as the EGMs or ECG, with high fidelity is challenging. Moreover, modeling extracellular potential field-related physiological events, such as bath loading effects, cannot be represented at all [17]. These factors combined limit their trustworthiness and application scope.
Volumetric biatrial meshes generated in early pioneering studies used artisanal handcrafted non-scalable methods that were tractable only for constructing small-size cohorts, often consisting of a single model only [30, 104]. Later, model-generation pipelines were proposed, gradually refined and increasingly automated towards a more industrialized process for producing models en masse. A first mostly complete workflow was reported in a study by [61] which was applied to generate a cohort of nine biatrial models. However, as numerous manual interventions were required in segmentation and landmark selection, for fiber mapping, and anatomical region definition, scalability remained limited.
A further automated approach using a segmentation-derived endocardial surface mesh as input was reported and tested in 29 patients in [7]. The approach bears similarities to ours in that e.g. surface curvature measures are used to identify structures such as the pulmonary veins, but also differs markedly in other processing steps which are more challenging to perform when using manifold meshes only. For instance, the identification of the mitral valve orifice, which is trivially identified as a label interface in our volumetric approach, required a rigid registration with a mean statistical shape model. Moreover, important anatomical landmarks such as the FO and its rim or the CS were not identified, and additional manual procedures were required to identify anatomical regions such as the LAA.
The largest atrial modeling cohort study comprising 1000 biatrial models has been reported in [94]. While this is indicative of robustness and scalability, the numerous interactive manual interventions required suggest a labor intense procedure. Moreover, the workflow was primarily tailored for generating patient-specific bilayer models, as only these were derived from clinical imaging data. Support for generating volumetric models was limited to volumetric remeshing of pre-existing manifold meshes built from a statistical shape model [93], and auxiliary data such as fiber architecture and UACs were transferred over from an atlas. A direct generation of anatomically accurate patient-specific 3D models from images, as per our approach, is currently not supported. Similarly, in the study by [75], volumetric biatrial models were also generated using statistical shape model manifolds as input to a heterogeneous workflow that integrated five different mesh generation and manipulation tools.
4.2 Performance considerations
The scalability of model generation methods depends on two major factors, the degree of automation to limit time-consuming interactive processing, and the robustness and speed of the processing steps, from medical image to final mesh. Our workflow achieves the highest degree of automation reported so far, with minimal to no interactive processing at all. Using a SCN [107] all CT data sets were automatically segmented within . As all required labels were detected robustly and accurately from all contrast CT datasets used in this study, with no need for manual label correction. The additional landmarking of veins and appendages can be fully automated, requiring minimal user input to verify or, if necessary, correct the auto-generated labels. This process includes an interactive step supported by a custom tool designed for quick label correction, reducing the overall operation time to less than . For all subsequent steps, including the generation of the volumetric atrial walls, the assignment of a rule-based fiber architecture and the computation of UACs, full automation has been achieved. Performance measured over 50 models yielded execution times of only and for generating an atrial model at mesh resolutions suitable for R-E and R-D simulations, respectively.
4.3 Mesh quality
A common limitation of most previous approaches is the mesh quality of the generated models. To evaluate this, we randomly sampled publicly available datasets of biatrial anatomies and found degenerated elements in all the sampled meshes [75, 94]. These deficiencies went unnoticed as all studies employed R-D monodomain models which cope well with poor mesh quality. However, employing these meshes for higher fidelity bidomain-based EGM generation is often challenging, since it requires the solution of sensitive elliptic problems, whose solution may be associated with slow convergence or even solver divergence in the presence of degenerated elements when employing classical solvers [22, 100]. Mesh quality issues and topological errors may arise from volumetric mesh construction methods that depend on the direct extrusion of the atrial walls from the mesh manifolds, [7, 75]. In contrast, our approach is more robust, as the atrial wall volume is generated directly from the image stack in a volumetric manner. This ensures that the initial volumetric representation of the atrial myocardium is topologically sound. Although our approach is less prone to topological issues, mesh topology errors may still occur at later stages, such as during surface smoothing operations aimed at removing jaggedness from the voxel-based grid or during remeshing to align mesh resolution with a prescribed target. To enhance robustness, a set of topological clean-up operations is repeatedly applied after each critical meshing step. All 50 models in this study were meshed fully automatically, achieving element quality exceeding a threshold of 0.99, which has been empirically identified as critical for cardiac bidomain simulations.
4.4 Universal Atrial Coordinates
Anatomical reference frames are key for scalable modeling studies, as they provide a parametric encoding of all spatial model properties and, thus, facilitate an unattended parameter manipulation as required for parameter sweeps [11, 96]. Accurate and robust mapping based on such reference frames relies on features such as geometric linearity, that is, isolines are evenly distributed in space, and uniqueness to ensure that any parameter set encodes a unique location in space. For atrial models, the first universal spatial reference system has been reported for manifold models by [97]. This approach was modified through anatomical normalization [95] and later extended to volumetric models [94]. The volumetric extension relies on UACs defined on endocardial and epicardial manifold surfaces, which serve as boundary conditions for solving a LD problem on the volumetric mesh to achieve transmural interpolation. Additionally, by solving another LD problem, a normalized transmural distance field is computed.
While this approach is straightforward to implement, the generated volumetric UACs were of moderate quality. Shortcomings of this approach include manual selection of initial landmark on the LA and RA surface, which impedes a fully automated computation of the UAC, and the construction of geodesic path to define interfaces between lateral and septal, and anterior and posterior regions of the atria, to be used as boundary conditions for LD solves, which does not guarantee the consistent identifications of anatomical structures and reference point locations across different geometries. Moreover, UACs are always initially built and normalized over surface biatrial models and later extended to volumetric tissue by linear projection on the transmural mesh nodes, thus impairing a sound definition of transmural interfaces and UAC distribution. Lastly, the volumetric UACs were not tested across meshes with different resolutions.
Our approach overcomes these limitations by utilizing automatically selected anatomical landmarks and paths, and directly implementing UACs on volumetric meshes. We replace the anatomical paths previously used to divide the LA into posterior-anterior parts and the RA into lateral-septal parts with well-defined volumetric interfaces that separate not only the endo- and epicardial surface regions, but also the transmural mesh nodes. The computation of these interfaces is fully automated, based on pre-labeled anatomical regions and a set of rules to define reproducible points across anatomies. The resulting interfaces therefore ensure consistent identification of anatomical structures across different anatomical models. Moreover, they represent a well-defined transmural boundary for LD computation, thus avoiding previous ambiguity in the distribution of the transmural coordinate.
We demonstrate the robustness of our method for computing UACs by testing it on 50 biatrial geometries from real AF patients. Additionally, we show the applicability of our method across different mesh resolutions. The computation of our UACs is efficient on meshes suited for the R-E model, though it requires longer computational times when applied to finer grids appropriate for R-D models. The majority of the computational costs were attributed to solving the linear elasticity problem to normalize the UAC solutions. This was mainly due to the poorly deformed elements that could potentially result from the projection of the Laplace-Dirichlet solutions on the UAC subspace, and hinder the solver convergence. Enhancing the computational efficiency of UACs for finer meshes will be a focus of future work.
4.5 Modeling of inter-atrial connections
Electrical conduction between the atria is mediated by discrete ICs which play an important EP role. During normal sinus rhythm, the activation of the LA is mediated by ICs, determining the points of LA earliest activation which critically shape the mid- to terminal part of the P-wave. Further, ICs provide pathways for inter-atrial reentrant circuits, which represents a substrate for maintaining atrial flutter tachycardia.
Detailed histological studies identified five electrical main connections between the otherwise electrically isolated atria [98]: the BB, the coronary sinus bundle, an inferior-posterior bundle, a superior-anterior bundle, and the muscular ring around the fossa ovalis. These histo-anatomical insights are helpful for providing fundamental anatomical constraints to a model, but individual anatomy and EP properties may be highly variable. For instance, not all ICs may be present or electrically active in a given individual, the locations of RA origin and LA insertion, as well as the conduction properties of the ICs in between, may also vary to a significant extent. Thus, this leads to different ICs dominating inter-atrial activation and, thus, govern the site of early activation of the LA, or the RA for a retrograde atrial activation. As such, all factors defining the ICs must be considered variable, and, thus, flexibility represented to support their inference.
Three different approaches for incorporating the ICs in a biatrial model have been considered previously. These were: i) timed electrical stimuli on the RA to mediate inter-atrial conduction, without including any ICs physical representation ii) anatomical bridges, explicitly represented by meshing geometries of assumed ICs [61, 67, 111], and, iii) single ohmic resistor connecting RA and LA [94, 95]. All these approaches are limited in terms of flexibility and generalizability. Timed stimulation is flexible, but does not represent the mechanism mediating inter-atrial conduction, and as such does not generalize to physiological representations such as the atrial flutter. Explicit anatomical meshing is of limited flexibility and robustness, as any change in the origin or insertion site requires remeshing. This approach has been employed previously in [61], where, in absence of UACs, complex ad-hoc algorithms have been used to parameterize and explicitly ICs mesh [67, 111]. While feasible in principle, these approaches are complex and challenging to implement robustly, as the integration of thin inter-atrial strands with 3D atrial walls is highly prone to topological mesh errors. To provide an example, the explicit meshing of BB used in the study by [75] led to degenerated elements in all models throughout the cohort. Finally, fixed resistive 0D coupling, as used in various studies, using bilayer manifold models [94, 95] is flexible, but the approach is not suitable for connecting volumetric atria due to dimensionality mismatch between 0D and 3D elements, which may cause source-sink mismatches. In principle, this problem may arise also in manifold models where 0D resistors are used to couple the two 2D surfaces representing RA and LA. In the absence of a physiological interpretation of the coupling resistor, viable ranges for which transduction between the atria is feasible have to be found by trial and error [94]. Moreover, a further limitation is the inability to impose physiological constraints on the inter-atrial conduction delays, as transduction is rigidly dictated by the membrane time constant and the choice of coupling resistance.
Our novel approach to incorporating ICs in atrial models overcomes these limitations, as it is highly flexible, versatile, robust, and computationally efficient, and adds IC anatomy as a parameter that can be probed during model calibration. An arbitrary number of ICs can be included to connect arbitrary sites of origin and insertion on RA and LA, respectively, with prescribed conduction velocities governing the activation delay across the IC. The use of UACs to define origin and insertion sites, facilitates a seamless mapping of ICs between different anatomies. Further, modeling the ICs using a cable formulation computed with the same approach of generating the HPS, overcomes dimension mismatch problems between 1D and 3D model components.
4.6 Calibration of atrial EP models - using the P-wave as objective
Atrial EP modeling studies aiming to achieve a patient-specific calibration by 1:1 matching with direct observations – EAMs, EGMs or the ECG– are rare. Rather, adjustments of conductive and cellular dynamics properties informed by literature data are implemented to match global metrics such as the total atrial activation time. For a more accurate spatial calibration, EAM activation maps have been used to infer intrinsic tissue conductivities or conduction velocities [69]. High density EAM datasets covering both the RA and the LA appear ideal for calibrating atrial EP models, as they may provide a detailed view of the overall atrial activation sequence. However, while such datasets can be acquired, in principle, they are not widely available, as their acquisition tends to prolong procedures. Moreover, the spatiotemporal registration uncertainty between measurements of an EAM manifold and the image-derived model is significant, posing major challenges for calibration procedures. Using EGMs from which EAM maps are derived is even more challenging, as EGMs provide only a very local view on tissue activation. These may be helpful for inferring tissue characteristics from fibrotic patches, e.g. EGM magnitude and temporal separation of fractionated complexes in EGMs, correlate with the severity and structure of fibrosis, but do not offer benefits over using EAM maps directly.
In principle, the P-wave in the ECG appears a most natural choice for calibrating atrial EP models, as it is abundantly available and can be non-invasively recorded. However, the P-wave provides only a global view of the atrial activation sequence, and inferring space-varying model parameters from such limited data is challenging. Owing to the ill-posed nature of this inverse problem, this may not even be feasible. Also challenging but, in principle, feasible, as shown recently for the ventricular activation sequence [42, 45], is the identification of model parameters that produce atrial activation sequences and replicate, with high fidelity, the P-wave in a clinical standard ECG. However, there may be more than one, potentially many, parameter sets yielding the same P-wave which raises questions of identifiability and uniqueness [44]. Due to these challenges, only a few attempts have been made to calibrate an atrial EP model to the P-wave [68], mostly limited to qualitative visual comparisons between simulated and recorded P-waves, without a quantitative assessment of the differences, as shown in this work.
Further obstacle to P-wave-based model calibration can stem from incomplete parameterization that fails to accurately produce the actual activation sequence, and insufficient computational performance that hinders a feasible calibration process, especially when relying on traditional R-D models [31, 35, 38, 68, 74, 94] combined with high fidelity pseudo-bidomain or lower fidelity extracellular potential recovery models [62, 75], or limited fidelity in the predicted P-wave. Bilayer models are popular as they mitigate performance issues by reducing the overall problem size, but are still orders of magnitude slower compared to volumetric R-E models as used in this study, and the fidelity of predicted P-waves is limited. Volumetric biatrial R-D models immersed in a torso model using a full- or pseudo-bidomain are able to produce high-fidelity P-waves [68]. They offer the advantage of providing the entire potential field throughout the torso, in which ECG or more extensive body surface potential maps are embedded [38, 117]. However, the approach is computationally by far too expensive for calibration studies, and the additional information on the torso potential field is not readily exploited in the absence of body surface potential mapping data.
Our analysis clearly demonstrates that the RELF model, combined with an extensive parameter space – including also the anatomy of the ICs– is able to produce activation sequences and associated P-waves with full bidomain fidelity, and at real-time performance. As shown previously for a ventricular ECG model [42], and in line with atrial ECG model [74], the RELF model yields EGMs and ECGs that are not discernible from those produced with a full fidelity R-D bidomain model, as anticipated on theoretical grounds [39]. As shown in Figure 9, differences in activation sequence and P-wave are minor, and can be deemed negligible in view of the overall model uncertainties.
In our study we focused on demonstrating the flexibility and efficiency of our framework in supporting comprehensive automated exploration of physical and geometrical parameter spaces, and refrained from attempting to accurately calibrate the atrial EP model to the P-wave for various reasons. As the atrial model was integrated with torso geometry and electrode positions taken from a different subject, and none of the pathologies of the patient treated by AF ablation were considered, discrepancies can be anticipated, and the feasibility of achieving a good fit is not even guaranteed. Nonetheless, we quantified differences between simulated and real ECGs using the RMSE, showing that the P-wave can be closely captured in most leads, except aVL, aVR, and V1. P-wave features such as positivity in lead aVL and -aVR, as well as the biphasic characteristic of lead V1 were replicated by the model.
Importantly, the fidelity and efficiency of our framework support, in principle, a comprehensive exploration of the parameter space spanned by atrial anatomy and EP, and, thus, provides a basis for building future applications geared towards creating digital twins based on P-wave calibration. A full single forward simulation lasted only where the actual evaluation of the EP model amounted only to .
4.7 Role of left and right atrial electrophysiology in the genesis of the P-wave
Despite the vast acceleration in speed achieved with high fidelity EP forward models, such as the RELF, the use a priori knowledge on the genesis of the P-wave is key to constrain the inference by limiting the admissible parameter space and the potentially large number of different atrial activation sequences that produce the same P-wave.
From a macroscopic perspective, the genesis of the P-wave is well understood. However, at a mesoscopic size scale, that is the relation between the physics of depolarization wavefronts traversing individual atrial structures, and their relative contribution to the global P-wave, is still unclear. These aspects have been investigated only in a limited number of studies [38, 67, 68]. In [68], the separate contribution of RA and LA depolarization to the P-wave was investigated in two atrial and torso models derived from healthy subjects. Using a pre-defined activation sequence, the study showed that the RA predominantly influences the P-wave in precordial leads V1 and V2, as well as limb leads II, aVF, and III, while the LA governs the central to terminal portion of the P-wave. The effect of varying the atrial activation sequence on P-wave features such as positivity or negativity in different leads was investigated in [67] in eight biatrial models of healthy subjects by initiating atrial activation at a fixed set of locations representing the SAN exit sites. The relative contributions of different atrial regions to the P-wave was moreover analyzed in [38], for a fixed atrial activation sequence, with prescribed SAN exit sites and IC locations.
In our study, we investigate the envelope of P-waves associated with changes in both RA and LA anatomical and physiological factors, including the location and number of early activation sites in the LA, the position and shape of the SAN, and the conduction velocity in the fiber and sheet directions of the RA body. By separately analyzing the ECG variations due to these factors, we also highlight the roles of RA and LA activation in shaping the P-wave.
The generated P-wave envelop did not fully cover the P-wave observed in the modeled patient, most evident in the leads aVL and aVR (refer to Figure 13). The terminal phase of the P-wave is not well covered, most prominently visible in the more lateral precordial leads V3-V6, and in the leads aVR and II. This discrepancy may stem from various factors. Firstly, the model was built from a patient treated by AF ablation, with a significant fibrotic burden, which remained unaccounted for in our model, and was instead assumed to be structurally healthy. As such, the dipoles at the interface between healthy atrial tissue and fibrotic patches are missing, leading to a nearly zero dipole once both atria were fully activated. Finally, torso and lead positions were taken from another subject and were not specific to the given subject.
4.7.1 Discrete interatrial conduction
The site of earliest activation of the LA is governed by the RA activation sequence and the location and conductive properties of the ICs. In this study, we only investigated the effect of varying location and size of the insertion site of BB on the anterior wall of the LA upon the P-wave. The use of bundles for modeling ICs facilitates automated sweeps over these important parameters that govern the coupling spatio-temporal coupling of RA and LA. Consistent with [68], our simulations show that LA activation influences only the mid to terminal portion of the P-wave (see Figure 10). Major differences due to varying BB insertion in the LA were witnessed in leads aVL, I, aVR, and III, while effects in other limb leads and precordial leads were minor. Using three ICs to model a fan-like insertion of the BB into the anterior LA had led only to a minor spread in the P-wave envelope (see Figure 11).
4.7.2 Sino-atrial node
The SAN was originally described as a crescent-shaped area at the junction of the SVC and the RA [2, 56], and later found to extend along the CT, and toward the IVC [1, 3, 18, 29, 36, 71]. Normal SAN automaticity depends on its depolarized resting potential of relative to neighboring atrial tissue, with a more hyperpolarized resting potential of [29]. To prevent hyperpolarization of SAN and, thus, inhibition of automaticity, the SAN is electrically mostly insulated to safeguard pacemaker function [36, 53]. Electrical coupling of the SAN with surrounding atrial myocardium is limited to specific discrete sites,referred to as SAN exit pathways, which can number up to five [37, 66]. As such, the location of exit pathways and their activity determine the earliest atrial activation site and the shape of the initial depolarization wavefront, which not only affects the activation sequence of the RA, but may also influence the order of activation of the ICs, and, in turn, alter the earliest activation site on the LA [5, 66]. Consequently, SAN anatomy and exit pathways are crucial parameters to consider when modeling atrial activation and its reflection in the P-wave.
In modeling studies, the SAN is often represented as a spherical region at a fixed location [35, 38, 67], with only a few studies accounting for the anatomical shape of the SAN [41, 62]. In line with previous work [38, 67], here we demonstrate a marked dependency of the P-wave upon exit sites (refer to Figure 13). By easy variation of SAN size and location, we show that our framework may easily allow for inferring both SAN anatomy and exit sites based on ECG calibration.
4.7.3 Effect of the RA endocardium on the P-wave
The anterior and lateral endocardial walls of the RA are primarily composed of PMs and CT tissue and are attached to a thin-walled LA epicardium, consisting of only a few layers of myocytes [63, 70]. While explicitly accounted for in bilayer models, this is often not the case in volumetric models [94]. There, two different approaches have been used. Either, CT, PMs and the RA portion of BB were explicitly meshed, or a continuous right endocardial layer of prescribed thickness was generated to represent the RA endocardium, onto which the locations of the CT and PMs are projected either by using an anatomical atlas, or on a per-rule basis. Atrial EP in the RA endocardium is then simulated by assigning faster conduction velocities in the CT and PMs, and slower conduction velocities to the remaining endocardial tissue between the protruding structures [7, 38, 68, 94]. As such, the absence of tissue between the CT and PMs is typically not accounted for which can be interpreted as an increase in the effective epicardial wall width and the associated source strength.
We investigate the effect of modeling the RA endocardial tissue as an electrically active layer upon atrial sources and the P-wave. Treating the RA endocardial layer in between CT and PMs as blood pool slowed down the activation of the posterior-lateral wall of the RA and the RAA. While this had a minor impact on the total activation time of the RA, a noticeable reduction in peak P-wave amplitude by 1% of was witnessed, with no change in P-wave morphology. The observed deviations in P-wave can be deemed as minor relative to the overall uncertainty. This may be not the case when simulating endocardial recorded EGMs, when electrodes are located near the atrial sources.
5 Limitations
While our comprehensive end-to-end workflow for generating biatrial anatomies combined with a fast forward RELF model is able to deliver anatomically accurate models for predicting ECG and EGMs with full physical fidelity, numerous notable limitations exist.
Our study introduces a technological framework for the calibration of atrial EP models using observable extracellular recordings such as the EGMs and the ECG– specifically, the P-wave – as objective to infer the high dimensional parameter space of such models. However, in its current form, an immediate inference to match a P-wave is not readily feasible. Despite the computational efficiency, a brute force sampling approach may still be too expensive [42]. Similar to previous work on identifying the ventricular activation sequence, a dedicated approach combining a priori knowledge to constrain the search space in combination with an optimization approach that facilitates a gradient-based search for parameters is likely to be more accurate and efficient [43, 45]. Sampling narrow, physiologically constrained parameter corridors, as done here, may provide a better approximation than current standard methods. However, this improvement cannot be guaranteed for two key reasons. First, as the atrial activation sequence cannot be measured accurately, not even invasively with most advanced EAM methodology, a solid ground truth reference is missing. Secondly, it is highly likely that a large number of parameter choices exist which yield identical perfect matches of the ECGs. Thus, uniqueness and identifiability is a serious concern that must be adequately addressed to narrow down the number of different sampled parameters. The development of suitable strategies and their evaluation was beyond the scope of this study, and substantial further research efforts are required.
An important factor limiting the anatomical accuracy of models generated by our end-to-end workflow is the assumption of uniform wall thicknesses. As the accurate segmentation of the atrial walls from current clinical images is challenging, in our volumetric wall reconstruction, the atrial wall widths were prescribed and held constant over individual anatomical regions. However, atrial wall widths in a patient’s heart may be different and more heterogeneous than represented in the model. As a consequence, the local variation in local conduction velocity mediated by altered source-sink relation may not be accurately represented.
A further limitation is the reduced computational efficiency in generating finer resolutions for R-D models. This is largely caused by the computation of the UACs, and not due to the extra cost of generating finer meshes per se. Specifically, projecting the biatrial mesh onto the UAC space to solve the linear elasticity problem can induce mesh deformations and, consequently, iterative solver convergence issues. More advanced preconditioners will be incorporated [6] in the future to enhance computational efficiency. Due to the nearly identical anatomical meshes, a faster alternative may be the Euclidian interpolation of UACs from the lower resolution R-E to the higher resolution R-D mesh, but this has not been investigated here.
While our novel flexible and rapid approach to modeling ICs is advantageous for model calibration, the used of single cables only approximates the effects of conduction between the atria, but not the actual sources contributing to the extracellular potential fields. The actual anatomical structures underlying the ICs are rather muscular bands or 3D strands. As such, the volumetric source density of the cable approach underestimates the contribution to the potential field in their vicinity. While this does not constitute a problem for simulating activation sequences and the ECG, simulating the sensing of EGM will be inaccurate and also methodologically challenging to implement, owing to the non-conformity of IC grid with the atrial or the volume conductor mesh. This problem is readily mitigated by using bundles instead of single cables, which may be straightforwardly incorporated, as shown for modeling a fan-like insertion of the BB, where a bundle of three ICs was used (see Figure 11). Alternatively, the cable-based representation can be replaced with an explicit mesh of the ICs once the model has been calibrated.
Further, the cables representing the ICs are automatically generated, following the geodesic paths connecting two mesh nodes on RA and RA, respectively. This might result in a mismatch in trajectory and length between modeled and real IC and, thus, physiologically non-feasible conduction velocities may be required to meet prescribed inter-atrial conduction delays. Specifically, this may complicate the transfer of parameters from R-E to R-D models where conduction velocity ranges are limited.
Further, we have not included the segmentation of the torso along with the corresponding atrial geometries. Large clinical data cohorts often lack CT or MRI scans of the torso. Nevertheless, our workflow supports the meshing of a generic torso surface around the generated atrial geometries, making the integration of automatic torso segmentation and corresponding meshing into our workflow a straightforward enhancement.
Finally, we have not yet incorporated considerations for atrial disorders and pathologies, which would be essential for clinical applications. While idealized damage and non-conductive substrates can be easily modeled using our EP simulator—along with pacing protocols to simulate conditions such as AF, our current RELF model does not support ECG simulations for rhythm disorders with reentrant phenotypes, as the underlying Eikonal model driving activation does not accommodate reentrant patterns. Advancements in altering atrial depolarization profiles may be necessary. Furthermore, real damaged tissue data from clinical sources is not yet integrated into our workflow. However, our reference framework is designed to easily accommodate new functionalities and define complex parameter variations, paving the way for the automatic and near-real-time creation of atrial digital twins.
6 Conclusions
In this study, we developed an automated, efficient, and flexible multi-scale workflow for creating anatomically accurate biatrial models with high-quality meshes, suitable for various forward EP models, and extended it to a function twinning stage, where efficient model calibration based on ECG data is possible. The workflow utilizes a segmented blood pool and a deep learning-based segmentation network to automatically identify and label principal atrial structures. It moreover generates endocardial and epicardial walls based on predefined rules, ensuring robust model openings and high mesh quality. Detailed anatomical and functional structures, including fiber architecture and space-varying parameters, are incorporated into the models. We further introduced a flexible method for representing ICs using auto-generated cables, allowing for realistic and customizable conduction properties. Our framework finally includes a clinically compatible ECG forward generation system, integrating both R-D and R-E models with Lead Field methods for accurate ECG trace generation, and possibly allows for the integration of the Pseudo-bidomain approach or -recovery. Among these, we show that the RELF method proved effective for real-time ECG computation and reliable source approximation in sinus rhythm.
Overall, our workflow facilitates efficient exploration of the EP parameter space for calibration of biatrial models based on ECG data, making it a valuable tool for advancing cardiac EP research.
Acknowledgments
This research received support from the Austrian Science Fund (FWF) grant no. 10.55776/I6476, and from the European Union’s Horizon 2020 research and innovation program under the Marie Skłodowska-Curie grant TwinCare-AF (grant agreement no. 101148636). The National Institutes of Health supported this work under grant 1R01HL158667 and by the Austrian Science Fund (FWF) under grant 10.55776/P37063. E. Zappon acknowledges her membership to INdAM GNCS - Gruppo Nazionale per il Calcolo Scientifico (National Group for Scientific Computing, Italy).
![[Uncaptioned image]](/html/2502.03322/assets/images/eu_funded_en.jpg)
References
- Akima [1978] Akima, H., 1978. A method of bivariate interpolation and smooth surface fitting for irregularly distributed data points. ACM Transactions on Mathematical Software (TOMS) 4, 148–159.
- Anderson et al. [1983] Anderson, R.H., Ho, S.Y., Becker, A.E., 1983. The surgical anatomy of the conduction tissues. Thorax 38, 408–420.
- Anderson et al. [1978] Anderson, R.H., Siew Yen, H., Becker, A.E., Gosling, J.A., 1978. The development of the sinoatrial node, in: The Sinus Node: Structure, Function, and Clinical Relevance. Springer, pp. 166–182.
- Antz et al. [1998a] Antz, M., Otomo, K., Arruda, M., Scherlag, B.J., Pitha, J., Tondo, C., Lazzara, R., Jackman, W.M., 1998a. Electrical conduction between the right atrium and the left atrium via the musculature of the coronary sinus. Circulation 98, 1790–1795.
- Antz et al. [1998b] Antz, M., Otomo, K., Arruda, M., Scherlag, B.J., Pitha, J., Tondo, C., Lazzara, R., Jackman, W.M., 1998b. Electrical Conduction Between the Right Atrium and the Left Atrium via the Musculature of the Coronary Sinus. Circulation 98, 1790–1795. URL: https://www.ahajournals.org/doi/10.1161/01.CIR.98.17.1790, doi:10.1161/01.CIR.98.17.1790.
- Augustin et al. [2016] Augustin, C.M., Neic, A., Liebmann, M., Prassl, A.J., Niederer, S.A., Haase, G., Plank, G., 2016. Anatomically accurate high resolution modeling of human whole heart electromechanics: a strongly scalable algebraic multigrid solver method for nonlinear deformation. Journal of computational physics 305, 622–646.
- Azzolin et al. [2023] Azzolin, L., Eichenlaub, M., Nagel, C., Nairn, D., Sánchez, J., Unger, L., Arentz, T., Westermann, D., Dössel, O., Jadidi, A., Loewe, A., 2023. AugmentA: Patient-specific augmented atrial model generation tool. Computerized Medical Imaging and Graphics 108, 102265. URL: https://linkinghub.elsevier.com/retrieve/pii/S0895611123000836, doi:10.1016/j.compmedimag.2023.102265.
- Azzolin et al. [2020] Azzolin, L., Luongo, G., Ventura, S.R., Saiz, J., Dösse, O., Loewe, A., 2020. Influence of gradient and smoothness of atrial wall thickness on initiation and maintenance of atrial fibrillation, in: 2020 Computing in Cardiology, IEEE. pp. 1–4.
- Bachmann [1916] Bachmann, G., 1916. The inter-auricular time interval. American Journal of Physiology-Legacy Content 41, 309–320. doi:10.1152/ajplegacy.1916.41.3.309.
- Batdorf et al. [1997] Batdorf, M., Freitag, L., Ollivier-Gooch, C., Batdorf, M., Freitag, L., Ollivier-Gooch, C., 1997. Computational study of the effect of unstructured mesh quality on solution efficiency, in: 13th Computational Fluid Dynamics Conference, p. 1888.
- Bayer et al. [2018] Bayer, J., Prassl, A.J., Pashaei, A., Gomez, J.F., Frontera, A., Neic, A., Plank, G., Vigmond, E.J., 2018. Universal ventricular coordinates: A generic framework for describing position within the heart and transferring data. Medical Image Analysis 45, 83–93.
- Beinart et al. [2011] Beinart, R., Abbara, S., Blum, A., Ferencik, M., Heist, K., Ruskin, J., Mansour, M., 2011. Left atrial wall thickness variability measured by ct scans in patients undergoing pulmonary vein isolation. Journal of cardiovascular electrophysiology 22, 1232–1236.
- Bhagirath et al. [2024] Bhagirath, P., Strocchi, M., Bishop, M.J., Boyle, P., Plank, G., 2024. From bits to bedside: Entering the age of digital twins in cardiac electrophysiology. Europace .
- Bishop and Plank [2025] Bishop, M., Plank, G., 2025. Stochastic behaviour of arrhythmia induction in virtual heart models suggests caution in offering mechanistic insights. Nature Cardiovascular Research In press.
- Bishop et al. [2016] Bishop, M., Rajani, R., Plank, G., Gaddum, N., Carr-White, G., Wright, M., O’Neill, M., Niederer, S., 2016. Three-dimensional atrial wall thickness maps to inform catheter ablation procedures for atrial fibrillation. Europace 18, 376–383.
- Bishop and Plank [2011a] Bishop, M.J., Plank, G., 2011a. Bidomain ECG simulations using an augmented monodomain model for the cardiac source. IEEE transactions on biomedical engineering 58, 2297–2307.
- Bishop and Plank [2011b] Bishop, M.J., Plank, G., 2011b. Representing cardiac bidomain bath-loading effects by an augmented monodomain approach: application to complex ventricular models. IEEE transactions on bio-medical engineering 58, 1066–1075. doi:10.1109/TBME.2010.2096425.
- Boyett et al. [2000] Boyett, M.R., Honjo, H., Kodama, I., 2000. The sinoatrial node, a heterogeneous pacemaker structure. Cardiovascular research 47, 658–687.
- Boyle et al. [2019] Boyle, P.M., Zghaib, T., Zahid, S., Ali, R.L., Deng, D., Franceschi, W.H., Hakim, J.B., Murphy, M.J., Prakosa, A., Zimmerman, S.L., et al., 2019. Computationally guided personalized targeted ablation of persistent atrial fibrillation. Nature biomedical engineering 3, 870–879.
- van Campenhout et al. [2013] van Campenhout, M.J., Yaksh, A., Kik, C., de Jaegere, P.P., Ho, S.Y., Allessie, M.A., de Groot, N.M., 2013. Bachmann’s bundle. Circulation: Arrhythmia and Electrophysiology 6, 1041–1046. doi:10.1161/CIRCEP.113.000758.
- Chauvin et al. [2000] Chauvin, M., Shah, D.C., Haïssaguerre, M., Marcellin, L., Brechenmacher, C., 2000. The anatomic basis of connections between the coronary sinus musculature and the left atrium in humans. Circulation 101, 647–652.
- Conley et al. [2016] Conley, R., Delaney, T.J., Jiao, X., 2016. Overcoming element quality dependence of finite elements with adaptive extended stencil fem (aes-fem). International Journal for Numerical Methods in Engineering 108, 1054–1085.
- Corradi et al. [2011] Corradi, D., Maestri, R., Macchi, E., Callegari, S., 2011. The atria: from morphology to function. Journal of Cardiovascular Electrophysiology 22, 223–235.
- Corral-Acero et al. [2020] Corral-Acero, J., Margara, F., Marciniak, M., Rodero, C., Loncaric, F., Feng, Y., Gilbert, A., Fernandes, J.F., Bukhari, H.A., Wajdan, A., Martinez, M.V., Santos, M.S., Shamohammdi, M., Luo, H., Westphal, P., Leeson, P., DiAchille, P., Gurev, V., Mayr, M., Geris, L., Pathmanathan, P., Morrison, T., Cornelussen, R., Prinzen, F., Delhaas, T., Doltra, A., Sitges, M., Vigmond, E.J., Zacur, E., Grau, V., Rodriguez, B., Remme, E.W., Niederer, S., Mortier, P., McLeod, K., Potse, M., Pueyo, E., Bueno-Orovio, A., Lamata, P., 2020. The ’Digital Twin’ to enable the vision of precision cardiology. Eur. Heart J. , 1–11doi:10.1093/eurheartj/ehaa159.
- Costa et al. [2014] Costa, C.M., Campos, F.O., Prassl, A.J., Dos Santos, R.W., Sanchez-Quintana, D., Ahammer, H., Hofer, E., Plank, G., 2014. An efficient finite element approach for modeling fibrotic clefts in the heart. IEEE Transactions on Biomedical Engineering 61, 900–910. doi:10.1109/TBME.2013.2292320.
- Courtemanche et al. [1998] Courtemanche, M., Ramirez, R.J., Nattel, S., 1998. Ionic mechanisms underlying human atrial action potential properties: insights from a mathematical model. American Journal of Physiology-Heart and Circulatory Physiology 275, H301–H321.
- Coveney et al. [2022] Coveney, S., Roney, C.H., Corrado, C., Wilkinson, R.D., Oakley, J.E., Niederer, S.A., Clayton, R.H., 2022. Calibrating cardiac electrophysiology models using latent gaussian processes on atrial manifolds. Scientific Reports 12, 16572.
- Crozier et al. [2016] Crozier, A., Augustin, C., Neic, A., Prassl, A., Holler, M., Fastl, T., Hennemuth, A., Bredies, K., Kuehne, T., Bishop, M., et al., 2016. Image-based personalization of cardiac anatomy for coupled electromechanical modeling. Annals of biomedical engineering 44, 58–70.
- Csepe et al. [2016] Csepe, T.A., Zhao, J., Hansen, B.J., Li, N., Sul, L.V., Lim, P., Wang, Y., Simonetti, O.P., Kilic, A., Mohler, P.J., Janssen, P.M., Fedorov, V.V., 2016. Human sinoatrial node structure: 3D microanatomy of sinoatrial conduction pathways. Progress in Biophysics and Molecular Biology 120, 164–178. URL: https://linkinghub.elsevier.com/retrieve/pii/S0079610715002606, doi:10.1016/j.pbiomolbio.2015.12.011.
- David M. Harrild [2000] David M. Harrild, C.S.H.., 2000. A Computer Model of Normal Conduction in the Human Atria. Circulation Research 87, e25–e36. URL: https://www.ahajournals.org/doi/10.1161/01.res.87.7.e25, doi:10.1161/01.RES.87.7.e25. publisher: American Heart Association.
- Deng et al. [2012] Deng, D.d., Gong, Y.l., Shou, G.f., Jiao, P.f., Zhang, H.g., Ye, X.s., Xia, L., 2012. Simulation of biatrial conduction via different pathways during sinus rhythm with a detailed human atrial model. Journal of Zhejiang University Science B 13, 676–694.
- Dewland et al. [2013] Dewland, T.A., Wintermark, M., Vaysman, A., Smith, L.M., Tong, E., Vittinghoff, E., Marcus, G.M., 2013. Use of computed tomography to identify atrial fibrillation associated differences in left atrial wall thickness and density. Pacing and Clinical Electrophysiology 36, 55–62.
- Dobrzynski et al. [2005] Dobrzynski, H., Li, J., Tellez, J., Greener, I., Nikolski, V., Wright, S., Parson, S., Jones, S., Lancaster, M., Yamamoto, M., et al., 2005. Computer three-dimensional reconstruction of the sinoatrial node. Circulation 111, 846–854.
- Dössel et al. [2012] Dössel, O., Krueger, M.W., Weber, F.M., Wilhelms, M., Seemann, G., 2012. Computational modeling of the human atrial anatomy and electrophysiology. Medical & biological engineering & computing 50, 773–799.
- Fedele et al. [2023] Fedele, M., Piersanti, R., Regazzoni, F., Salvador, M., Africa, P.C., Bucelli, M., Zingaro, A., Quarteroni, A., et al., 2023. A comprehensive and biophysically detailed computational model of the whole human heart electromechanics. Computer Methods in Applied Mechanics and Engineering 410, 115983.
- Fedorov et al. [2012] Fedorov, V.V., Glukhov, A.V., Chang, R., 2012. Conduction barriers and pathways of the sinoatrial pacemaker complex: their role in normal rhythm and atrial arrhythmias. American Journal of Physiology-Heart and Circulatory Physiology 302, H1773–H1783. URL: https://www.physiology.org/doi/10.1152/ajpheart.00892.2011, doi:10.1152/ajpheart.00892.2011.
- Fedorov et al. [2010] Fedorov, V.V., Glukhov, A.V., Chang, R., Kostecki, G., Aferol, H., Hucker, W.J., Wuskell, J.P., Loew, L.M., Schuessler, R.B., Moazami, N., Efimov, I.R., 2010. Optical Mapping of the Isolated Coronary-Perfused Human Sinus Node. Journal of the American College of Cardiology 56, 1386–1394. URL: https://linkinghub.elsevier.com/retrieve/pii/S0735109710034571, doi:10.1016/j.jacc.2010.03.098.
- Ferrer et al. [2015] Ferrer, A., Sebastián, R., Sánchez-Quintana, D., Rodriguez, J.F., Godoy, E.J., Martinez, L., Saiz, J., 2015. Detailed anatomical and electrophysiological models of human atria and torso for the simulation of atrial activation. PloS one 10, e0141573.
- Geselowitz [1989] Geselowitz, D.B., 1989. On the theory of the electrocardiogram. Proceedings of the IEEE 77, 857–876.
- Gillette et al. [2021a] Gillette, K., Gsell, M.A., Bouyssier, J., Prassl, A.J., Neic, A., Vigmond, E.J., Plank, G., 2021a. Automated framework for the inclusion of a his–purkinje system in cardiac digital twins of ventricular electrophysiology. Annals of biomedical engineering 49, 3143–3153.
- Gillette et al. [2022] Gillette, K., Gsell, M.A., Strocchi, M., Grandits, T., Neic, A., Manninger, M., Scherr, D., Roney, C.H., Prassl, A.J., Augustin, C.M., et al., 2022. A personalized real-time virtual model of whole heart electrophysiology. Frontiers in Physiology 13, 907190.
- Gillette et al. [2021b] Gillette, K., Gsell, M.A.F., Prassl, A.J., Karabelas, E., Reiter, U., Reiter, G., Grandits, T., Payer, C., Štern, D., Urschler, M., Bayer, J.D., Augustin, C.M., Neic, A., Pock, T., Vigmond, E.J., Plank, G., 2021b. A Framework for the generation of digital twins of cardiac electrophysiology from clinical 12-leads ECGs. Medical image analysis 71, 102080. URL: https://doi.org/10.1016/j.media.2021.102080, doi:10.1016/j.media.2021.102080. publisher: Elsevier B.V.
- Grandits et al. [2021] Grandits, T., Effland, A., Pock, T., Krause, R., Plank, G., Pezzuto, S., 2021. GEASI: Geodesic-based earliest activation sites identification in cardiac models. International journal for numerical methods in biomedical engineering 37, e3505. URL: http://arxiv.org/abs/2102.09962, doi:10.1002/cnm.3505. arXiv: 2102.09962.
- Grandits et al. [2024a] Grandits, T., Gillette, K., Plank, G., Pezzuto, S., 2024a. Accurate and Efficient Cardiac Digital Twin from surface ECGs: Insights into Identifiability of Ventricular Conduction System. URL: http://arxiv.org/abs/2411.00165, doi:10.48550/arXiv.2411.00165. arXiv:2411.00165.
- Grandits et al. [2024b] Grandits, T., Verhülsdonk, J., Haase, G., Effland, A., Pezzuto, S., 2024b. Digital Twinning of Cardiac Electrophysiology Models From the Surface ECG: A Geodesic Backpropagation Approach. IEEE Transactions on Biomedical Engineering 71, 1281–1288. URL: https://ieeexplore.ieee.org/document/10339854, doi:10.1109/TBME.2023.3331876. conference Name: IEEE Transactions on Biomedical Engineering.
- Gray et al. [1996] Gray, R.A., Pertsov, A.M., Jalife, J., 1996. Incomplete reentry and epicardial breakthrough patterns during atrial fibrillation in the sheep heart. Circulation 94, 2649–2661.
- Gsell et al. [2024] Gsell, M.A., Neic, A., Bishop, M.J., Gillette, K., Prassl, A.J., Augustin, C.M., Vigmond, E.J., Plank, G., 2024. ForCEPSS—A framework for cardiac electrophysiology simulations standardization. Computer Methods and Programs in Biomedicine 251, 108189. URL: https://linkinghub.elsevier.com/retrieve/pii/S0169260724001858, doi:10.1016/j.cmpb.2024.108189.
- Hansson et al. [1998] Hansson, A., Holm, M., Blomström, P., Johansson, R., Lührs, C., Brandt, J., Olsson, S., 1998. Right atrial free wall conduction velocity and degree of anisotropy in patients with stable sinus rhythm studied during open heart surgery. European heart journal 19, 293–300.
- Harrild and Henriquez [2000] Harrild, D.M., Henriquez, C.S., 2000. A computer model of normal conduction in the human atria. Circulation research 87, e25–e36.
- Ho and Sánchez-Quintana [2009] Ho, S., Sánchez-Quintana, D., 2009. The importance of atrial structure and fibers. Clinical Anatomy: The Official Journal of the American Association of Clinical Anatomists and the British Association of Clinical Anatomists 22, 52–63.
- Honjo et al. [1996] Honjo, H., Boyett, M., Kodama, I., Toyama, J., 1996. Correlation between electrical activity and the size of rabbit sino-atrial node cells. The Journal of physiology 496, 795–808.
- Hopman et al. [2023] Hopman, L.H., Visch, J.E., Bhagirath, P., van der Laan, A.M., Mulder, M.J., Razeghi, O., Kemme, M.J., Niederer, S.A., Allaart, C.P., Götte, M.J., 2023. Right atrial function and fibrosis in relation to successful atrial fibrillation ablation. European Heart Journal-Cardiovascular Imaging 24, 336–345.
- Joyner and Van Capelle [1986] Joyner, R., Van Capelle, F., 1986. Propagation through electrically coupled cells. How a small SA node drives a large atrium. Biophysical Journal 50, 1157–1164. URL: https://linkinghub.elsevier.com/retrieve/pii/S0006349586835597, doi:10.1016/S0006-3495(86)83559-7.
- Kanchi and Masud [2007] Kanchi, H., Masud, A., 2007. A 3d adaptive mesh moving scheme. International Journal for Numerical Methods in Fluids 54, 923–944.
- Karabelas et al. [2018] Karabelas, E., Gsell, M.A.F., Augustin, C.M., Marx, L., Neic, A., Prassl, A.J., Goubergrits, L., Kuehne, T., Plank, G., 2018. Towards a Computational Framework for Modeling the Impact of Aortic Coarctations Upon Left Ventricular Load. Frontiers in physiology 9, 538. URL: http://www.ncbi.nlm.nih.gov/pubmed/29892227, doi:10.3389/fphys.2018.00538.
- Keith and Flack [1907] Keith, A., Flack, M., 1907. The form and nature of the muscular connections between the primary divisions of the vertebrate heart. Journal of anatomy and physiology 41, 172.
- Keller et al. [2010] Keller, D.U., Weber, F.M., Seemann, G., Dossel, O., 2010. Ranking the influence of tissue conductivities on forward-calculated ecgs. IEEE Transactions on Biomedical Engineering 57, 1568–1576.
- Kharbanda et al. [2019] Kharbanda, R.K., Özdemir, E.H., Taverne, Y.J., Kik, C., Bogers, A.J., de Groot, N.M., 2019. Current concepts of anatomy, electrophysiology, and therapeutic implications of the interatrial septum. JACC: Clinical Electrophysiology 5, 647–656.
- Knol et al. [2019] Knol, W.G., Teuwen, C.P., Kleinrensink, G.J., Bogers, A.J., de Groot, N.M., Taverne, Y.J., 2019. The bachmann bundle and interatrial conduction: comparing atrial morphology to electrical activity. Heart Rhythm 16, 606–614.
- Knupp [2022] Knupp, P., 2022. Worst case mesh quality in the target matrix optimization paradigm. Engineering with Computers 38, 5695–5711.
- Krueger et al. [2012] Krueger, M.W., Seemann, G., Rhode, K., Keller, D.U., Schilling, C., Arujuna, A., Gill, J., O’Neill, M.D., Razavi, R., Dossel, O., 2012. Personalization of atrial anatomy and electrophysiology as a basis for clinical modeling of radio-frequency ablation of atrial fibrillation. IEEE transactions on medical imaging 32, 73–84.
- Labarthe et al. [2014] Labarthe, S., Bayer, J., Coudiere, Y., Henry, J., Cochet, H., Jais, P., Vigmond, E., 2014. A bilayer model of human atria: mathematical background, construction, and assessment. Europace 16, iv21–iv29. URL: https://academic.oup.com/europace/article-lookup/doi/10.1093/europace/euu256, doi:10.1093/europace/euu256.
- Lang et al. [2022] Lang, R.M., Cameli, M., Sade, L.E., Faletra, F.F., Fortuni, F., Rossi, A., Soulat-Dufour, L., 2022. Imaging assessment of the right atrium: anatomy and function. European Heart Journal-Cardiovascular Imaging 23, 867–884.
- Lemery et al. [2007] Lemery, R., Birnie, D., Tang, A.S., Green, M., Gollob, M., Hendry, M., Lau, E., 2007. Normal atrial activation and voltage during sinus rhythm in the human heart: an endocardial and epicardial mapping study in patients with a history of atrial fibrillation. Journal of cardiovascular electrophysiology 18, 402–408.
- Lemery et al. [2003] Lemery, R., Guiraudon, G., Veinot, J.P., 2003. Anatomic description of bachmann’s bundle and its relation to the atrial septum. The American journal of cardiology 91, 1482–1482.
- Li et al. [2017] Li, N., Hansen, B.J., Csepe, T.A., Zhao, J., Ignozzi, A.J., Sul, L.V., Zakharkin, S.O., Kalyanasundaram, A., Davis, J.P., Biesiadecki, B.J., Kilic, A., Janssen, P.M.L., Mohler, P.J., Weiss, R., Hummel, J.D., Fedorov, V.V., 2017. Redundant and diverse intranodal pacemakers and conduction pathways protect the human sinoatrial node from failure. Science Translational Medicine 9, eaam5607. URL: https://www.science.org/doi/10.1126/scitranslmed.aam5607, doi:10.1126/scitranslmed.aam5607.
- Loewe et al. [2016] Loewe, A., Krueger, M.W., Holmqvist, F., Dössel, O., Seemann, G., Platonov, P.G., 2016. Influence of the earliest right atrial activation site and its proximity to interatrial connections on p-wave morphology. EP Europace 18, iv35–iv43.
- Loewe et al. [2015] Loewe, A., Krueger, M.W., Platonov, P.G., Holmqvist, F., Dössel, O., Seemann, G., 2015. Left and right atrial contribution to the p-wave in realistic computational models, in: Functional Imaging and Modeling of the Heart: 8th International Conference, FIMH 2015, Maastricht, The Netherlands, June 25-27, 2015. Proceedings 8, Springer. pp. 439–447.
- Lubrecht et al. [2021] Lubrecht, J.M., Grandits, T., Gharaviri, A., Schotten, U., Pock, T., Plank, G., Krause, R., Auricchio, A., Conte, G., Pezzuto, S., 2021. Automatic reconstruction of the left atrium activation from sparse intracardiac contact recordings by inverse estimate of fibre structure and anisotropic conduction in a patient-specific model. EP Europace 23, i63–i70. URL: https://academic.oup.com/europace/article/23/Supplement_1/i63/6158558, doi:10.1093/europace/euaa392.
- Matsuyama et al. [2004] Matsuyama, T.a., Inoue, S., Kobayashi, Y., Sakai, T., Saito, T., Katagiri, T., Ota, H., 2004. Anatomical diversity and age-related histological changes in the human right atrial posterolateral wall. EP Europace 6, 307–315.
- Monfredi et al. [2010] Monfredi, O., Dobrzynski, H., Mondal, T., Boyett, M.R., Morris, G.M., 2010. The anatomy and physiology of the sinoatrial node—a contemporary review. Pacing and clinical electrophysiology 33, 1392–1406.
- Multerer and Pezzuto [2021] Multerer, M., Pezzuto, S., 2021. Uncertainty quantification for the 12-lead ecg: a lead field approach. arXiv preprint arXiv:2102.09960 .
- Muñoz et al. [2011] Muñoz, M.A., Kaur, J., Vigmond, E.J., 2011. Onset of atrial arrhythmias elicited by autonomic modulation of rabbit sinoatrial node activity: a modeling study. American Journal of Physiology-Heart and Circulatory Physiology 301, H1974–H1983. doi:10.1152/ajpheart.00059.2011.
- Nagel et al. [2022] Nagel, C., Espinosa, C.B., Gillette, K., Gsell, M.A., Sánchez, J., Plank, G., Dössel, O., Loewe, A., 2022. Comparison of propagation models and forward calculation methods on cellular, tissue and organ scale atrial electrophysiology. IEEE Transactions on Biomedical Engineering 70, 511–522.
- Nagel et al. [2021] Nagel, C., Schuler, S., Dössel, O., Loewe, A., 2021. A bi-atrial statistical shape model for large-scale in silico studies of human atria: Model development and application to ECG simulations. Medical Image Analysis 74, 102210. URL: https://linkinghub.elsevier.com/retrieve/pii/S1361841521002553, doi:10.1016/j.media.2021.102210.
- Neic et al. [2017a] Neic, A., Campos, F.O., Prassl, A.J., Neiderer, S.A., Bishop, M.J., Vigmond, E.J., Plank, G., 2017a. Efficient computation of electrograms and ecgs in human whole heart simulations using a reaction-eikonal model.
- Neic et al. [2017b] Neic, A., Campos, F.O., Prassl, A.J., Niederer, S.A., Bishop, M.J., Vigmond, E.J., Plank, G., 2017b. Efficient computation of electrograms and ecgs in human whole heart simulations using a reaction-eikonal model. Journal of computational physics 346, 191–211. doi:10.1016/j.jcp.2017.06.020.
- Neic et al. [under review] Neic, A., Gsell, M., Karabelas, E., Prassl, A., Plank, G., under review. Automating image-based mesh generation and manipulation tasks in cardiac modeling workflows using meshtool. Software X .
- Neic et al. [2020] Neic, A., Gsell, M.A., Karabelas, E., Prassl, A.J., Plank, G., 2020. Automating image-based mesh generation and manipulation tasks in cardiac modeling workflows using meshtool. SoftwareX 11, 100454.
- Niederer et al. [2020] Niederer, S.A., Aboelkassem, Y., Cantwell, C.D., Corrado, C., Coveney, S., Cherry, E.M., Delhaas, T., Fenton, F.H., Panfilov, A.V., Pathmanathan, P., Plank, G., Riabiz, M., Roney, C.H., Dos Santos, R.W., Wang, L., 2020. Creation and application of virtual patient cohorts of heart models. Philos. Trans. A. Math. Phys. Eng. Sci. 378, 20190558. doi:10.1098/rsta.2019.0558.
- Padala et al. [2021] Padala, S.K., Cabrera, J.A., Ellenbogen, K.A., 2021. Anatomy of the cardiac conduction system. Pacing and Clinical Electrophysiology 44, 15–25.
- Payer et al. [2017] Payer, C., Štern, D., Bischof, H., Urschler, M., 2017. Multi-label whole heart segmentation using cnns and anatomical label configurations, in: International Workshop on Statistical Atlases and Computational Models of the Heart, Springer. pp. 190–198.
- Pezzuto et al. [2017] Pezzuto, S., Kal’avský, P., Potse, M., Prinzen, F.W., Auricchio, A., Krause, R., 2017. Evaluation of a rapid anisotropic model for ECG simulation. Front. Physiol. 8. doi:10.3389/fphys.2017.00265.
- Piersanti et al. [2021] Piersanti, R., Africa, P.C., Fedele, M., Vergara, C., Dedè, L., Corno, A.F., Quarteroni, A., 2021. Modeling cardiac muscle fibers in ventricular and atrial electrophysiology simulations. Computer Methods in Applied Mechanics and Engineering 373, 113468. URL: https://doi.org/10.1016/j.cma.2020.113468, doi:10.1016/j.cma.2020.113468. publisher: Elsevier B.V.
- Plank et al. [2021] Plank, G., Loewe, A., Neic, A., Augustin, C., Huang, Y.L., Gsell, M.A., Karabelas, E., Nothstein, M., Prassl, A.J., Sánchez, J., et al., 2021. The opencarp simulation environment for cardiac electrophysiology. Computer methods and Programs in Biomedicine 208, 106223.
- Platonov et al. [2002] Platonov, P., Mitrofanova, L., Chireikin, L., Olsson, S., 2002. Morphology of inter-atrial conduction routes in patients with atrial fibrillation. Europace 4, 183–192.
- Platonov [2007] Platonov, P.G., 2007. Interatrial conduction in the mechanisms of atrial fibrillation: from anatomy to cardiac signals and new treatment modalities. Europace 9, vi10–vi16.
- Potse [2018] Potse, M., 2018. Scalable and accurate ECG simulation for reaction-diffusion models of the human heart. Frontiers in physiology 9, 370.
- Potse et al. [2006] Potse, M., Dubé, B., Richer, J., Vinet, A., Gulrajani, R.M., 2006. A comparison of monodomain and bidomain reaction-diffusion models for action potential propagation in the human heart. IEEE Transactions on Biomedical Engineering 53, 2425–2435.
- Prassl et al. [2009] Prassl, A.J., Kickinger, F., Ahammer, H., Grau, V., Schneider, J.E., Hofer, E., Vigmond, E.J., Trayanova, N.A., Plank, G., 2009. Automatically generated, anatomically accurate meshes for cardiac electrophysiology problems. IEEE transactions on bio-medical engineering 56, 1318–1330. doi:10.1109/TBME.2009.2014243.
- Reddy et al. [2023] Reddy, V.Y., Kong, M.H., Petru, J., Maan, A., Funasako, M., Minami, K., Ruppersberg, P., Dukkipati, S., Neuzil, P., 2023. Electrographic flow mapping of persistent atrial fibrillation: intra-and inter-procedure reproducibility in the absence of ‘ground truth’. Europace 25, euad308.
- Roberts et al. [1979] Roberts, D.E., Hersh, L.T., Scher, A.M., 1979. Influence of cardiac fiber orientation on wavefront voltage, conduction velocity, and tissue resistivity in the dog. Circulation research 44, 701–712.
- Rodero et al. [2021] Rodero, C., Strocchi, M., Marciniak, M., Longobardi, S., Whitaker, J., O’Neill, M.D., Gillette, K., Augustin, C., Plank, G., Vigmond, E.J., Lamata, P., Niederer, S.A., 2021. Linking statistical shape models and simulated function in the healthy adult human heart. PLOS Computational Biology 17, e1008851. doi:10.1371/journal.pcbi.1008851.
- Roney et al. [2023] Roney, C., Solis Lemus, J.A., et al, 2023. Constructing bilayer and volumetric atrial models at scale. Interface Focus , 20230038.
- Roney et al. [2021] Roney, C.H., Bendikas, R., Pashakhanloo, F., Corrado, C., Vigmond, E.J., McVeigh, E.R., Trayanova, N.A., Niederer, S.A., 2021. Constructing a human atrial fibre atlas. Annals of biomedical engineering 49, 233–250.
- Roney et al. [2019a] Roney, C.H., Pashaei, A., Meo, M., Dubois, R., Boyle, P.M., Trayanova, N.A., Cochet, H., Niederer, S.A., Vigmond, E.J., 2019a. Universal atrial coordinates applied to visualisation, registration and construction of patient specific meshes. Med. Image Anal. 55, 65–75. doi:10.1016/j.media.2019.04.004, arXiv:1810.06630.
- Roney et al. [2019b] Roney, C.H., Pashaei, A., Meo, M., Dubois, R., Boyle, P.M., Trayanova, N.A., Cochet, H., Niederer, S.A., Vigmond, E.J., 2019b. Universal atrial coordinates applied to visualisation, registration and construction of patient specific meshes. Medical Image Analysis 55, 65--75. URL: https://www.sciencedirect.com/science/article/pii/S1361841518308089, doi:https://doi.org/10.1016/j.media.2019.04.004.
- Sakamoto et al. [2005] Sakamoto, S.I., Nitta, T., Ishii, Y., Miyagi, Y., Ohmori, H., Shimizu, K., 2005. Interatrial electrical connections: the precise location and preferential conduction. Journal of cardiovascular electrophysiology 16, 1077--1086.
- Sakata et al. [2024] Sakata, K., Bradley, R.P., Prakosa, A., Yamamoto, C.A.P., Ali, S.Y., Loeffler, S., Tice, B.M., Boyle, P.M., Kholmovski, E.G., Yadav, R., Sinha, S.K., Marine, J.E., Calkins, H., Spragg, D.D., Trayanova, N.A., 2024. Assessing the arrhythmogenic propensity of fibrotic substrate using digital twins to inform a mechanisms-based atrial fibrillation ablation strategy. Nature Cardiovascular Research 3, 857--868. URL: https://www.nature.com/articles/s44161-024-00489-x, doi:10.1038/s44161-024-00489-x. publisher: Nature Publishing Group.
- Schneider et al. [2018] Schneider, T., Hu, Y., Dumas, J., Gao, X., Panozzo, D., Zorin, D., 2018. Decoupling simulation accuracy from mesh quality. ACM transactions on graphics .
- Schotten et al. [2011] Schotten, U., Verheule, S., Kirchhof, P., Goette, A., 2011. Pathophysiological mechanisms of atrial fibrillation: a translational appraisal. Physiological reviews 91, 265--325.
- Schuler et al. [2021] Schuler, S., Pilia, N., Potyagaylo, D., Loewe, A., 2021. Cobiveco: Consistent biventricular coordinates for precise and intuitive description of position in the heart--with matlab implementation. Medical Image Analysis 74, 102247.
- Schuler et al. [2019] Schuler, S., Tate, J.D., Oostendorp, T.F., MacLeod, R.S., Dössel, O., 2019. Spatial Downsampling of Surface Sources in the Forward Problem of Electrocardiography, in: Coudière, Y., Ozenne, V., Vigmond, E., Zemzemi, N. (Eds.), Functional Imaging and Modeling of the Heart, Springer International Publishing, Cham. pp. 29--36. doi:10.1007/978-3-030-21949-9_4.
- Seemann et al. [2006] Seemann, G., Höper, C., Sachse, F.B., Dössel, O., Holden, A.V., Zhang, H., 2006. Heterogeneous three-dimensional anatomical and electrophysiological model of human atria. Philosophical transactions. Series A, Mathematical, physical, and engineering sciences 364, 1465--81. URL: http://www.ncbi.nlm.nih.gov/pubmed/16766355, doi:10.1098/rsta.2006.1781.
- Szili-Torok et al. [2023] Szili-Torok, T., Neuzil, P., Langbein, A., Petru, J., Funasako, M., Dinshaw, L., Wijchers, S., Bhagwandien, R., Rillig, A., Spitzer, S.G., et al., 2023. Electrographic flow--guided ablation in redo patients with persistent atrial fibrillation (flow-af): design and rationale. Heart Rhythm O2 4, 391--400.
- Tan et al. [2000] Tan, K., Chan, K., Choi, K., 2000. Detection of the qrs complex, p wave and t wave in electrocardiogram, in: 2000 First International Conference Advances in Medical Signal and Information Processing (IEE Conf. Publ. No. 476), IET. pp. 41--47.
- Thaler et al. [2021] Thaler, F., Payer, C., Bischof, H., Stern, D., 2021. Efficient multi-organ segmentation using spatial configuration-net with low gpu memory requirements. arXiv preprint arXiv:2111.13630 .
- Varela et al. [2017] Varela, M., Morgan, R., Theron, A., Dillon-Murphy, D., Chubb, H., Whitaker, J., Henningsson, M., Aljabar, P., Schaeffter, T., Kolbitsch, C., et al., 2017. Novel mri technique enables non-invasive measurement of atrial wall thickness. IEEE transactions on medical imaging 36, 1607--1614.
- Viceconti et al. [2020] Viceconti, M., Pappalardo, F., Rodriguez, B., Horner, M., Bischoff, J., Musuamba Tshinanu, F., 2020. In silico trials: Verification, validation and uncertainty quantification of predictive models used in the regulatory evaluation of biomedical products. Methods doi:10.1016/j.ymeth.2020.01.011.
- Vigmond and Clements [2007] Vigmond, E.J., Clements, C., 2007. Construction of a computer model to investigate sawtooth effects in the Purkinje system. IEEE Transactions on Biomedical Engineering 54, 389--399. doi:10.1109/TBME.2006.888817. iSBN: 0018-9294 (Print)\r0018-9294 (Linking).
- Wachter et al. [2015] Wachter, A., Loewe, A., Krueger, M.W., Dössel, O., Seemann, G., 2015. Mesh structure-independent modeling of patient-specific atrial fiber orientation. Current Directions in Biomedical Engineering 1, 409--412.
- Whitaker et al. [2016] Whitaker, J., Rajani, R., Chubb, H., Gabrawi, M., Varela, M., Wright, M., Niederer, S., O’Neill, M.D., 2016. The role of myocardial wall thickness in atrial arrhythmogenesis. Ep Europace 18, 1758--1772.
- Whittaker et al. [2020] Whittaker, D.G., Clerx, M., Lei, C.L., Christini, D.J., Mirams, G.R., 2020. Calibration of ionic and cellular cardiac electrophysiology models. Wiley Interdisciplinary Reviews: Systems Biology and Medicine 12, e1482.
- Yang et al. [2015] Yang, J., Li, H., Campbell, D., Jia, Y., 2015. Go-icp: A globally optimal solution to 3d icp point-set registration. IEEE transactions on pattern analysis and machine intelligence 38, 2241--2254.
- Yang et al. [2013] Yang, J., Li, H., Jia, Y., 2013. Go-icp: Solving 3d registration efficiently and globally optimally, in: Proceedings of the IEEE International Conference on Computer Vision, pp. 1457--1464.
- Yushkevich et al. [2006] Yushkevich, P.A., Piven, J., Cody Hazlett, H., Gimpel Smith, R., Ho, S., Gee, J.C., Gerig, G., 2006. User-guided 3D active contour segmentation of anatomical structures: Significantly improved efficiency and reliability. Neuroimage 31, 1116--1128.
- Zappon et al. [2024] Zappon, E., Manzoni, A., Quarteroni, A., 2024. A non-conforming-in-space numerical framework for realistic cardiac electrophysiological outputs. Journal of Computational Physics 502, 112815. URL: https://www.sciencedirect.com/science/article/pii/S0021999124000640, doi:https://doi.org/10.1016/j.jcp.2024.112815.
- Zheng et al. [2021] Zheng, T., Azzolin, L., Sánchez, J., Dössel, O., Loewe, A., 2021. An automate pipeline for generating fiber orientation and region annotation in patient specific atrial models. Current Directions in Biomedical Engineering 7, 136--139. URL: https://doi.org/10.1515/cdbme-2021-2035, doi:doi:10.1515/cdbme-2021-2035.