Test of electric charge conservation in dark matter direct detection experiment
Abstract
Electric charge conservation (ECC) is typically taken as an axiom in the standard model. Searching for small violations with high-performance experiments could lead us to new physics. In this work, we tested “invisible” electric charge nonconservation (ECNC) events with 1.16 tonyear electron recoil data from the XENON-nT experiment. There was no statistically significant signal, and the ECNC limit was updated to yr. This work increases the limit by two orders of magnitude and shows that dark matter direct detection experiments have great potential for further ECC testing.
Introduction. In 1957, Wu et al. reported that parity is not conserved in weak interactions in decay experiments Wu et al. (1957). In 1964, Christenson et al. discovered the violation of charge-parity invariance Christenson et al. (1964). These findings greatly shocked the community. Since then, new experiments have been conducted to examine fundamental laws, such as electric charge conservation (ECC).
ECC arises from the global symmetry gauge invariance of the electric field Noether (1918). The experimental evidence for ECC is that a photon has an extremely small upper limit on its rest mass Weinberg (1964). However, electric charge nonconservation (ECNC) is allowed in some theoretical frameworks beyond the standard model Edward (2018); CHU (1996); Ignatiev et al. (1979); Dubovsky et al. (2000). If ECNC is confirmed, then new physics will emerge. However, to date, no definite signal of ECNC has been found. In previous tests of ECC, the limits on the mean lifetime have gradually become increasingly stringent. The most recent result of yr was from the MAJORANA DEMONSTRATOR with a 37.5 kg yr exposure Arnquist et al. (2024a).
The MAJORANA experiment pursues neutrinoless double-beta decay via a high-purity germanium (HPGe) array with an ultralow background Phillips et al. (2012). Dark matter direct detection experiments such as XENON Aprile et al. (2024); Arnquist et al. (2023, 2024b) and PandaX Li et al. (2023) also have an ultralow background, can carry out the search for the other ultrarare physical events while searching for dark matter Arnquist et al. (2024b).
The event rate is approximately 0.06 Count/keV/kg/day, which is 21900 Count/keV/ton/yr at 5 keV, approximately 8000 Count/keV/ton/yr at 11 keV in the MAJORANA DEMONSTRATOR experiment Arnquist et al. (2024a), and approximately 12 Count/keV/ton/yr at 5 keV in the XENON-nT experiment Aprile et al. (2022). HPGe detector usually has an excellent energy resolution of approximately 80 eV at 5 keV. Although the energy resolution of XENON-nT (approximately 700 eV at 5 keV) can not match for that of the MAJORANA DEMONSTRATOR, XENON-nT has a lower event rate, which allows it to obtain better results. In this work, we tested the ECC with 1.16 tonyear exposure data from the XENON-nT experiment and updated the most stringent limit.
Expected signal
ECNC occurs when an electron decays into neutral particles. There are two main types of experiments on ECNC in electron decay:
I. “visible”, . This process splits the energy of the electrons equally, giving them 256 keV each. The photon can be picked up by the detector, so this process is “visible”. BOREXINO is a typical example of this type of experiment Agostini et al. (2015); Smirnov et al. (2017).
II. “invisible”, , the most favorable mode Workman et al. (2022). This process produces neutrinos instead of photons, so it is called “invisible” decay of the electron. When one of the inner electrons of an atom is lost by invisible decay, the outer electron fills the electron vacancy, and X-rays are be emitted.The atomic levels of xenon are listed in Table 1. For example, when an electron in the shell undergoes invisible decay in a Xe atom, X-rays of 34.6 keV are detected. In this work, we choose this most favorable mode to test ECC and search for ECNC.
| Shell | Energy (keV) | Electron Number |
|---|---|---|
| others |
Considering the energy resolution of the detector and the total efficiency of the experiment, the ECNC signal in the experiment can be described by Eq. 1. For the sake of expression, we define the signal that does not take into account as a physical signal , and the signal that takes into account as a detected signal .
| (1) |
where, and are the intensity and the energy resolution (standard deviation) of the -th peak, respectively.
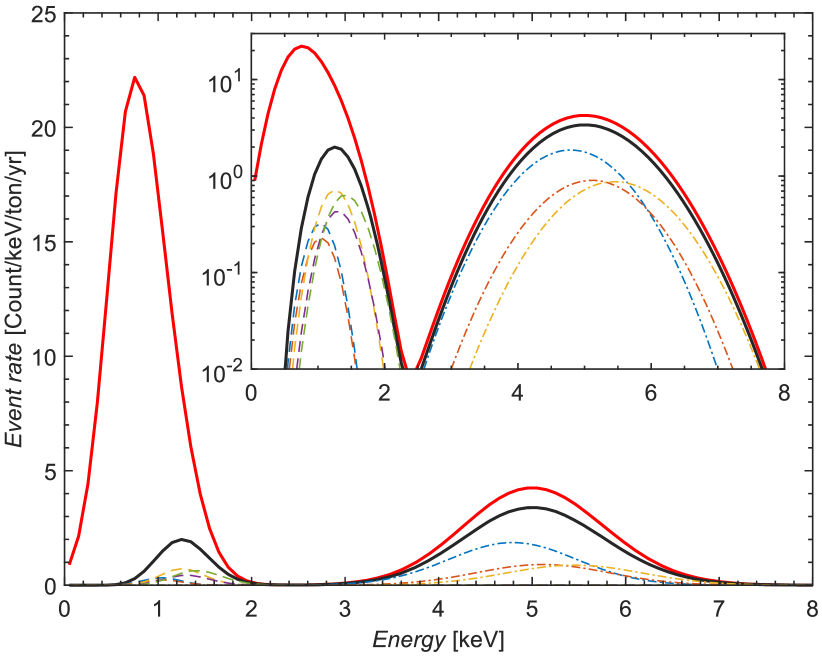
In the example shown in Fig. 1, the total intensity of ECNC is Count/ton/yr. We distribute the total intensity to the peaks in proportion to the number of electrons as listed in Table 1,. Owing to , the physical signal represented by the thick red line moves down to the expected signal in the xenon detector represented by the black line. The large peaks of the expected signal contain several smaller peaks (thin dotted and dash-dotted lines). The energy resolution is referenced from XENON-1T Aprile et al. (2020, 2022), and is derived from public data on XENON’s website XEN (2024).
Results and discussion
The expected energy spectrum consists of the detected signal () and the background (). The expected spectrum and the measured spectrum were compared via minimum- analysis:
| (2) |
where and denote the measured data and standard deviation with statistical and systematical components at the -th energy bin extracted from Fig. 5 in Ref. Aprile et al. (2022), respectively; denotes the ECNC event rate at the -th energy bin; and denotes the background contribution at the -th energy bin in Ref. Aprile et al. (2022); XEN (2024). We found that the no-signal hypothesis yielded a . The one-sided 90% CL limit was estimated with , based on Feldman-Cousins unified approach Feldman and Cousins (1998).
By Eq. 3, the event intensity can be converted into the mean lifetime .
| (3) |
where ton-1 is the number of Xe atoms per ton, and is the number of tested electrons in an atom.
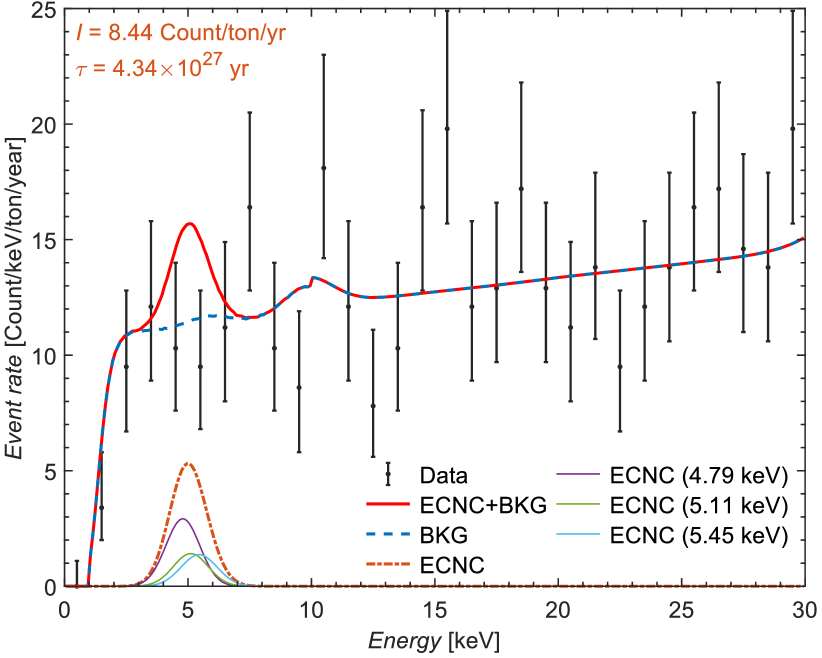
As shown in Fig.1, the shell with more electrons contributes less than the L shell does, so we chose to test only the 8 shell electrons (corresponding to , and ) to derive a more conservative and solid result. We did not test the shell electrons because not enough experimental data are currently available. There was no statistically significant signal in the experimental spectrum Aprile et al. (2022), as shown by the data points with error bars in Fig. 2. When Count/ton/yr, , as shown by the thick red line in Fig. 2. Thus, we can set a 90% CL limit of ECNC in “invisible” electron decay: yr.
As shown in Fig. 3, starting in 1959, researchers and collaborations have continually pushed the lower limit. The pace of updating results was relatively slow in the 1990s until the DAMA experiment in 1999 gave significantly stronger limits. After more than 20 years of silence, MAJORANA again significantly refreshed the limits. Finally, this work has rapidly increased the limit by two orders of magnitude with XENON-nT’s 1.16 tonyear electron recoil data.
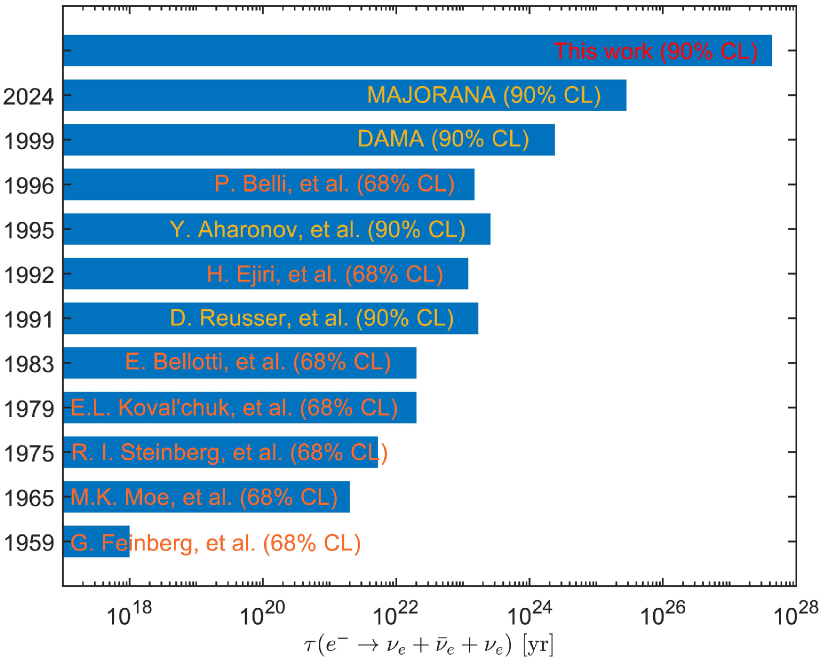
This work, together with the DAMA and MAJORANA’s explorations, reveals the advantages of dark matter detection experiments to examine ECC and search for ECNC cases. Experiments such as XENON and MAJORANA, which have ultralow background and excellent energy resolution, have great potential for further ECC testing and searching for new physical ECNC with their greater exposure.
References
- Wu et al. (1957) C. S. Wu et al., Phys. Rev. 105, 1413 (1957).
- Christenson et al. (1964) J. H. Christenson et al., Phys. Rev. Lett. 13, 138 (1964).
- Noether (1918) E. Noether, Nachrichten von der Gesellschaft der Wissenschaften zu Göttingen, Mathematisch-Physikalische Klasse 1918, 235 (1918).
- Weinberg (1964) S. Weinberg, Phys. Rev. 135, B1049 (1964).
- Edward (2018) W. Edward, Nat. Phys. 14, 116 (2018).
- CHU (1996) S.-Y. CHU, Mod. Phys. Lett. A 11, 2251 (1996), https://doi.org/10.1142/S0217732396002241 .
- Ignatiev et al. (1979) A. Ignatiev, V. Kuzmin, and M. Shaposhnikov, Phys. Lett. B 84, 315 (1979).
- Dubovsky et al. (2000) S. L. Dubovsky, V. A. Rubakov, and P. G. Tinyakov, J. High Energy Phys. 2000, 041 (2000).
- Arnquist et al. (2024a) I. J. Arnquist et al. (The MAJORANA Collaboration), Nat. Phys. 20, 1078 (2024a).
- Phillips et al. (2012) D. G. Phillips et al., J. Phys.: Conf. Ser. 381, 012044 (2012).
- Aprile et al. (2024) E. Aprile et al. (XENON Collaboration), Eur. Phys. J. C 84, 261001 (2024).
- Arnquist et al. (2023) I. J. Arnquist et al. (Majorana Collaboration), Phys. Rev. Lett. 130, 062501 (2023).
- Arnquist et al. (2024b) I. J. Arnquist et al. (Majorana Collaboration), Phys. Rev. Lett. 132, 041001 (2024b).
- Li et al. (2023) S. Li et al. (PandaX Collaboration), Phys. Rev. Lett. 130, 261001 (2023).
- Aprile et al. (2022) E. Aprile et al. (XENON Collaboration), Phys. Rev. Lett. 129, 161805 (2022).
- Agostini et al. (2015) M. Agostini et al. (Borexino Collaboration), Phys. Rev. Lett. 115, 231802 (2015).
- Smirnov et al. (2017) O. Y. Smirnov et al. (Borexino Collaboration), Phys. Part. Nuclei+ 48, 1026 (2017).
- Workman et al. (2022) R. L. Workman et al. (Particle Data Group), Prog.Theor.Exp. Phys. 2022, 083C01 (2022).
- Aprile et al. (2020) E. Aprile et al. (XENON Collaboration), Phys. Rev. D 102, 072004 (2020).
- XEN (2024) “Xenon dark matter project,” xenonexperiment.org (2024).
- Feldman and Cousins (1998) G. J. Feldman and R. D. Cousins, Phys. Rev. D 57, 3873 (1998).
- G. and Goldhaber (1959) F. G. and Goldhaber, P. Nati. A. Sci. 45, 1301 (1959).
- Moe and Reines (1965) M. K. Moe and F. Reines, Phys. Rev. 140, B992 (1965).
- Steinberg et al. (1975) R. I. Steinberg et al., Phys. Rev. D 12, 2582 (1975).
- Koval’chuk et al. (1979) E. L. Koval’chuk, P. A. A., and S. A. A., JETP Lett. 29, 163 (1979).
- Bellotti et al. (1983) E. Bellotti et al., Phys. Lett. B 124, 435 (1983).
- Reusser et al. (1991) D. Reusser et al., Phys. Lett. B 255, 143 (1991).
- Ejiri et al. (1991) H. Ejiri et al., Phys. Rev. C 44, 502 (1991).
- Aharonov et al. (1995) Y. Aharonov et al., Phys. Lett. B 353, 168 (1995).
- Belli et al. (1996) P. Belli et al., Astropart. Phys. 3, 217 (1996).
- Belli et al. (1999) P. Belli et al., Phys. Lett. B 460, 236 (1999).