Search for fractionally charged particles as lightly ionizing particles
using public data from an underground direct detection experiment
Abstract
Approximately 60 years after the Milligan oil drop experiment in 1909, fractionally charged particles (FCPs) were reported to have been discovered in air-shower cores, and the search for FCPs continues to the present day in space, terrestrial and underground experiments. In this letter, relativistic FCPs are examined as lightly ionizing particles in underground direct detection on the basis of electron recoil data from XENON-nT. For FCPs from supernova shocks, the best results are obtained via direct detection, excluding the FCP charge of corresponding to an FCP mass of 1 keV–556 GeV. For FCPs from general sources, the best limit is achieved, which is far ahead of other results in almost the entire parameter space, by excluding the FCP flux of cm s sr-1 corresponding to the FCP charge of .
Introduction. In 1909, Millikan obtained a precision measurement of the charge of an isolated ion and denoted the test value of an elementary charge as Millikan (1910, 1911). However, electric charge quantization is currently a mystery that is unexplained by the standard model (SM) of particle physics. In 1969, McCusker and Cairns reported a track in a delayed-expansion Wilson cloud chamber produced by a fractionally charged particle (FCP, denoted “”; also known as a “milli- or minicharged particle”) in an air-shower core McCusker and Cairns (1969). Moreover, some difficult problems, such as dark matter (DM) Trimble (1987) and neutrino oscillations Fukuda et al. (1998); Ahmad et al. (2002), suggest that there must be some new physics beyond the SM.
Some researchers have made great efforts to study unconfined and free FCPs (in contrast to the quark’s bound state) to extend the SM. Finding FCPs is helpful in testing some popular hypotheses, such as DM Chun et al. (1995); Kouvaris (2013); Shiu et al. (2013); Muñoz and Loeb (2018) and string theory Schellekens (1990); Abel et al. (2008); Shiu et al. (2013), as well expanding the SM. In this work, we search for FCPs as lightly ionizing particles (LIPs) with 1.16 tonyear exposure data obtained from the XENON-nT experiment Aprile et al. (2022) and update the limit on their parameter space.
Note that it is currently difficult to determine whether these FCPs are generated in the atmosphere or in outer space. Thus, we search for incident FCPs from general sources (including the atmosphere, the Sun and so on) in the view of the detector and mark them with the subscript “gen”. Some studies have also attempted to generate FCPs via SM particle interactions in nuclear reactors Gninenko et al. (2007); Singh et al. (2019) and accelerators Dobroliubov and Ignatiev (1990); Perl et al. (2009).
In addition, FCPs in dark cosmic rays can be produced through supernova shock (SNS) and accelerated by the Fermi mechanism. Then, they can undergo radiative cooling, Coulomb scattering and energy redistribution during transport Malkov (1998); Malkov et al. (2016); Drury et al. (2000); Berezhko, E. G. et al. (2006). Finally, they reach the Earth, and their flux in the unit of can be estimated via Eq. 1, which is derived from a comparison with protons Hu et al. (2017).
| (1) |
where is the FCP mass in units of GeV; is the FCP energy in units of GeV; is defined as ; is the charge carried by an FCP; and . When eV, the anisotropy of the FCP flux is not obvious. Impliedly, local DM density is 4.1 GeV/cm-3, and the enrichment factor of FCP is 4.
FCP signal When FCPs reach the detector in direct detection experiments, there is a probability of interaction with the target atoms, resulting in a recoil energy of for the atom electrons. The differential event rate of the interaction between FCPs and atoms in the detector is given by Eq. 2.
| (2) |
where is the number density of the target atoms and is the differential cross-section between the FCP and the atom. The number density of xenon atoms is ton-1, and is estimated with the equivalent photon approximation Weizsäcker (1934); Williams (1934), as shown in Eq. 3. Focusing on the relativistic FCPs from the SNS, we set and GeV.
| (3) |
where the fine structure constant is and is the photoelectric absorption cross-section of the xenon atom obtained from the Evaluated Nuclear Data File National Nulclear Data Center . The FCP is considered a LIP, which causes less ionization in the detector because is proportional to .
As shown in Eq. 4, the expected signal of FCPs is derived by convolving over the energy resolution of the detector and multiplying it by the total efficiency of the experiment. The difference between these signals is clearly indicated in Fig. 1. After considering the energy resolution and efficiency, the curve becomes smooth and decreases, especially in the lower-energy region. This implies that a detector with excellent energy resolution and a low energy threshold performs better at searching for FCPs.
| (4) |
where the energy resolution is referenced from XENON-1T Aprile et al. (2020, 2022) and the total efficiency is obtained from public data on XENON’s website XENON Collaboration .
From the perspective of the detector, the incident FCPs from general sources have an undefined distribution of mass and energy because of their diverse sources. In this letter, we use a conservative estimation, and Eq. 2 is simplified to Eq. 5. Moreover, in Eq. 3 is set to 10 here.
| (5) |
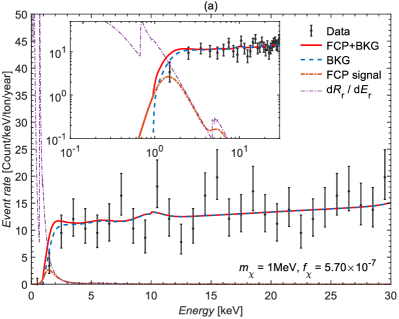
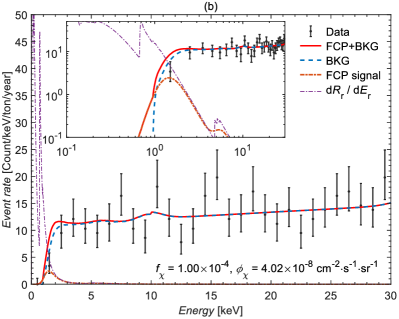
Results and discussion As shown in Fig. 1, the FCP signal (dotted-dashed line) and background (dashed line) contribute to the expected energy spectrum (solid line). The matching between the expected spectrum and the measured spectrum is obtained via minimum- analysis, as shown in Eq. 6. The limits on FCPs from SNS and general sources are plotted in Fig. 2(a) and (b), respectively.
| (6) |
where and are the experimental data and standard deviation with statistical and systematical components in the -th energy bin extracted from Fig. 5 in Ref. Aprile et al. (2022), respectively; is the FCP event rate in the -th energy bin; and is the background contribution in the -th energy bin, obtained from Ref. Aprile et al. (2022); XENON Collaboration .
We find that the no-signal hypothesis yields . On the basis of the Feldman–Cousins unified approach Feldman and Cousins (1998), the limit of the 90% one-sided confidence level is derived with .
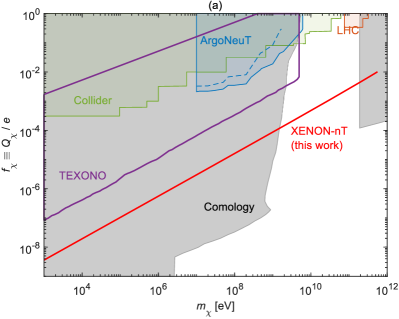
The constraint on as a function of the of FCPs from SNS obtained in this work is plotted as a red line in the top panel in Fig. 2. We use a cutoff of because an FCP with would behave like a muon, and the attenuation in the atmosphere and rock cannot be ignored. The results from cosmology, colliders, the LHC, ArgoNeuT and TEXONO are also plotted for comparison. This work updates the limits obtained from direct detection and accelerator experiments and fills the gap in cosmology observations for FCP masses ranging from 2 GeV to 200 GeV.
TEXONO and XENON-nT are both direct detection experiments for FCPs. In TEXONO, the BKG is Count/keV/kg/day, and the energy threshold is 300 eV. In XENON-NT, the BKG is Count/keV/ton/yr, and the energy threshold is 1 keV. The background of TEXONO is 365000 times that of XENON-nT, but the result obtained by TEXONO is only 25 times that of XENON-nT instead of 600 times. As discussed in the last section, the energy threshold and energy resolution are also two important factors in determining sensitivity to FCPs. Notably, the 2-hit result (blue shading) of ArgoNeuT is significantly better than the 1-hit result (blue dashed line). Both XENON-nT and ArgoNeuT are time-projection chambers; the travel length of the FCP is m in the ArgoNeuT detector but m in the XENON-nT detector Aprile et al. (2024). If the FCP is further considered to deposit energy multiple times in XENON-nT, the limit result will be more stringent.
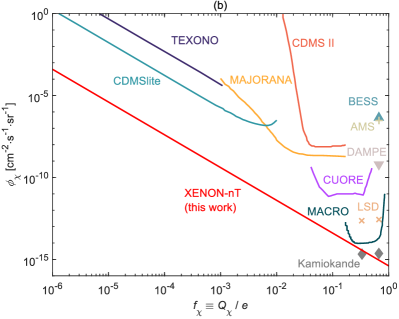
The constraint on as a function of the of FCPs from general sources is plotted as a red line in the bottom panel of Fig. 2. The results from space observations (BESS Aglietta et al. (1994a), AMS Sbarra et al. (2003) and DAMPE Alemanno et al. (2022)) and direct detection (LSD Aglietta et al. (1994b), Kamlikande Mori et al. (1991), MACRO Ambrosio et al. (2000), CDMS Agnese et al. (2015); Alkhatib et al. (2021), MAJORANA Alvis et al. (2018), TEXONO Singh et al. (2019) and CUORE Adams et al. (2024)) are also plotted for comparison. The most stringent limit is achieved, covering almost all of the range except .
In this work, the limits on for FCPs from SNS and for FCPs from general sources are derived, and the existing results are updated. In the future, as the radiation background and energy threshold are further reduced, the energy resolution is further improved, and the exposure is further increased, the search for FCPs and new physics beyond the SM in underground direct detection will continue play an advanced role with space and terrestrial experiments together.
References
- Millikan (1910) R. A. Millikan, Science 32, 436 (1910).
- Millikan (1911) R. A. Millikan, Phys. Rev. 32, 349 (1911).
- McCusker and Cairns (1969) C. B. A. McCusker and I. Cairns, Phys. Rev. Lett. 23, 658 (1969).
- Trimble (1987) V. Trimble, Annu. Rev. Astron. Astr. 25, 425 (1987).
- Fukuda et al. (1998) Y. Fukuda et al. (Super-Kamiokande Collaboration), Phys. Rev. Lett. 81, 1562 (1998).
- Ahmad et al. (2002) Q. R. Ahmad et al. (SNO Collaboration), Phys. Rev. Lett. 89, 011301 (2002).
- Chun et al. (1995) E. Chun, A. S. Joshipura, and A. Smirnov, Phys. Lett. B 357, 608 (1995).
- Kouvaris (2013) C. Kouvaris, Phys. Rev. D 88, 015001 (2013).
- Shiu et al. (2013) G. Shiu, P. Soler, and F. Ye, Phys. Rev. Lett. 110, 241304 (2013).
- Muñoz and Loeb (2018) J. B. Muñoz and A. Loeb, Nature 557, 684–686 (2018).
- Schellekens (1990) A. Schellekens, Phys. Lett. B 237, 363 (1990).
- Abel et al. (2008) S. Abel et al., J. High Energy Phys. 2008, 124 (2008).
- Aprile et al. (2022) E. Aprile et al. (XENON Collaboration), Phys. Rev. Lett. 129, 161805 (2022).
- Gninenko et al. (2007) S. N. Gninenko, N. V. Krasnikov, and A. Rubbia, Phys. Rev. D 75, 075014 (2007).
- Singh et al. (2019) L. Singh, J. W. Chen, H. C. Chi, C.-P. Liu, M. K. Pandey, H. T. Wong, C. P. Wu, M. Agartioglu, M. Deniz, H. B. Li, S. T. Lin, V. Sharma, M. K. Singh, V. Singh, and Q. Yue (TEXONO Collaboration), Phys. Rev. D 99, 032009 (2019).
- Dobroliubov and Ignatiev (1990) M. I. Dobroliubov and A. Y. Ignatiev, Phys. Rev. Lett. 65, 679 (1990).
- Perl et al. (2009) M. L. Perl, E. R. Lee, and D. Loomba, Ann. Rev. Nucl. Part. S. 59, 47 (2009).
- Malkov (1998) M. A. Malkov, Phys. Rev. E 58, 4911 (1998).
- Malkov et al. (2016) M. A. Malkov, P. H. Diamond, and R. Z. Sagdeev, Phys. Rev. D 94, 063006 (2016).
- Drury et al. (2000) L. Drury, D. Ellisson, and J.-P. Meyer, Nucl. Phys. A 663-664, 843c (2000).
- Berezhko, E. G. et al. (2006) Berezhko, E. G., Ksenofontov, L. T., and Völk, H. J., Astron. Astrophys. 452, 217 (2006).
- Hu et al. (2017) P.-K. Hu, A. Kusenko, and V. Takhistov, Phys. Lett. B 768, 18 (2017).
- Weizsäcker (1934) C. F. v. Weizsäcker, Zeitschrift für Physik 88, 612 (1934).
- Williams (1934) E. J. Williams, Phys. Rev. 45, 729 (1934).
- (25) National Nulclear Data Center, “Photoatomic reaction sublibrary,” nndc.bnl.gov.
- Aprile et al. (2020) E. Aprile et al. (XENON Collaboration), Phys. Rev. D 102, 072004 (2020).
- (27) XENON Collaboration, “Xenon dark matter project,” xenonexperiment.org.
- Feldman and Cousins (1998) G. J. Feldman and R. D. Cousins, Phys. Rev. D 57, 3873 (1998).
- Davidson et al. (2000a) S. Davidson, S. Hannestad, and G. Raffelt, J. High Energy Phys. 2000, 003 (2000a).
- Vogel and Redondo (2014a) H. Vogel and J. Redondo, J. Cosmol. Astropart. P. 2014, 029 (2014a).
- Mohapatra and Rothstein (1990) R. Mohapatra and I. Rothstein, Phys. Lett. B 247, 593 (1990).
- Vogel and Redondo (2014b) H. Vogel and J. Redondo, J. Cosmol. Astropart. P. 2014, 029 (2014b).
- Dubovsky et al. (2004) S. L. Dubovsky, D. S. Gorbunov, and G. I. Rubtsov, J. Cosmol. Astropart. P. 79, 1 (2004).
- Davidson et al. (1991a) S. Davidson, B. Campbell, and D. Bailey, Phys. Rev. D 43, 2314 (1991a).
- Vinyoles and Vogel (2016) N. Vinyoles and H. Vogel, J. Cosmol. Astropart. P. 2016, 002 (2016).
- Davidson et al. (1991b) S. Davidson, B. Campbell, and D. Bailey, Phys. Rev. D 43, 2314 (1991b).
- Davidson et al. (2000b) S. Davidson, S. Hannestad, and G. Raffelt, J. High Energy Phys. 2000, 003 (2000b).
- Jaeckel et al. (2013) J. Jaeckel, M. Jankowiak, and M. Spannowsky, Phys. Dark Universe 2, 111 (2013).
- Harnik et al. (2019) R. Harnik, Z. Liu, and O. Palamara, J. High Energy Phys. 2019 (2019), https://doi.org/10.1007/JHEP07(2019)170.
- Aglietta et al. (1994a) M. Aglietta et al., Astropart. Phys. 2, 29 (1994a).
- Sbarra et al. (2003) C. Sbarra et al., “Search for fractional charges in cosmic rays with ams,” (2003), arXiv:astro-ph/0304192 [astro-ph] .
- Alemanno et al. (2022) F. Alemanno et al. (DAMPE Collaboration), Phys. Rev. D 106, 063026 (2022).
- Aglietta et al. (1994b) M. Aglietta et al., Astropart. Phys. 2, 29 (1994b).
- Mori et al. (1991) M. Mori et al., Phys. Rev. D 43, 2843 (1991).
- Ambrosio et al. (2000) M. Ambrosio et al. (MACRO Collaboration), Phys. Rev. D 62, 052003 (2000).
- Alkhatib et al. (2021) I. Alkhatib et al. (SuperCDMS Collaboration), Phys. Rev. Lett. 127, 081802 (2021).
- Alvis et al. (2018) S. I. Alvis et al. (Majorana Collaboration), Phys. Rev. Lett. 120, 211804 (2018).
- Adams et al. (2024) D. Q. Adams et al. (CUORE Collaboration), Phys. Rev. Lett. 133, 241801 (2024).
- Aprile et al. (2024) E. Aprile et al. (XENON Collaboration), Eur. Phys. J. C 84, 261001 (2024).
- Agnese et al. (2015) R. Agnese et al. (CDMS Collaboration), Phys. Rev. Lett. 114, 111302 (2015).