Radial migration in the Galactic disc driven by a slowing bar
Abstract
Radial migration is an important dynamical effect that has reshaped the Galactic disc, but its origin has yet to be elucidated. In this work, we present evidence that resonant dragging by the corotation of a decelerating bar could be the main driver of radial migration in the Milky Way disc. Using a test particle simulation, we demonstrate this scenario explains the two distinct age-metallicity sequences observed in the solar vicinity: the plateauing upper sequence is interpreted as stars dragged outwards by the expanding corotation of the decelerating bar and the steeper lower sequence as stars formed locally around the solar circle. The upper migrated sequence dominates at guiding radii around the current corotation radius of the bar, , but rapidly dies away beyond this where the mechanism cannot operate. This behaviour naturally explains the radial dependence of the -bimodality, in particular the truncation of the high- disc beyond the solar circle. Under our proposed radial migration scenario, we constrain the Milky Way bar’s pattern speed evolution using the age-metallicity distribution of stars currently trapped at corotation. We find the bar likely formed with an initial pattern speed of km s-1 kpc-1 and began decelerating Gyr ago at a rate (where the quoted ranges include systematic uncertainties).
1 Introduction
Stars in the galactic disc can be scattered from their presumed near-circular birth orbits to their present-day orbits by secular processes or external perturbations. This change in stellar orbits can be decomposed into two different components, the drifting of the angular momentum (, dubbed “radial migration”, Sellwood & Binney 2002, or “churning”, Schönrich & Binney 2009), and the amplification in the radial oscillation or the radial action (, dubbed “radial heating” or “blurring”).
Many studies have shown that radial migration in the Milky Way disc is strong using age and metallicity of various kinds of tracers (e.g. Schönrich & Binney, 2009; Sanders & Binney, 2015; Frankel et al., 2018; Beraldo e Silva et al., 2021; Zhang et al., 2021; Lian et al., 2022a; Haywood et al., 2024). The age and metallicity of stars are important in understanding the migration history of the Galactic disc because they encode the birth radii of stars (Sellwood & Binney, 2002; Minchev et al., 2018; Lu et al., 2024b; Ratcliffe et al., 2024a). Frankel et al. (2020) quantified the strength of radial migration and heating in the Galactic disc and showed that radial migration in the Galactic disc is significantly more efficient than radial heating. Results from analytic studies and simulations have shown that radial migration could reshape the chemical properties of the Galactic disc, such as the azimuthal abundance distribution of the stars (Di Matteo et al., 2013), the -bimodality of the disc (Sharma et al., 2021a), and the age-metallicity distribution (Haywood et al., 2024). Therefore, it is important to understand better the driving mechanisms of radial migration to unveil the evolution of the Galactic disc.
Theoretical analysis and N-body simulations have shown that transient spiral arms can drive efficient radial migration of stars (Sellwood & Binney, 2002; Roškar et al., 2008, 2012), and many studies have emphasised the importance of evolving spiral arms and bar-spiral resonance overlap (Minchev & Quillen, 2006; Minchev & Famaey, 2010; Minchev et al., 2011; Solway et al., 2012; Daniel et al., 2019, and the reference therein). Giant molecular clouds and satellite galaxies also cause orbital scattering (Schönrich & Binney, 2009; Quillen et al., 2009; Carr et al., 2022). Hamilton et al. (2024) recently argued that using spiral arms to produce the required relative coldness of the migration process observed in the Galactic disc (Frankel et al., 2020) is challenging, partly because resonance overlap also heats stars during transportation. In response, Sellwood & Binney (2025) provided evidence that the heating may be overestimated by Hamilton et al. (2024) in their idealized simulations. Another important potential source of radial migration is the slowing of the Galactic bar. During deceleration, the orbital resonances of the bar (e.g. corotation and outer Lindblad) move outwards through the disc, trapping stars and dragging them outwards (Chiba et al., 2021; Chiba & Schönrich, 2021). This mechanism has been demonstrated in N-body simulated galaxies as an efficient way to transport stars (Halle et al., 2015, 2018; Khoperskov et al., 2020; Haywood et al., 2024). Crucially, Khoperskov et al. (2020) showed that stars transported with the corotation resonance of the bar had near-circular orbits when they left the corotation resonance (see also Chiba et al. 2021) meaning resonant dragging has exactly the required properties of the radial migration mechanism.
A key parameter of the Galactic bar is its angular frequency, or pattern speed . Past observations have constrained the pattern speed of the Galactic bar to around (Portail et al., 2017; Sanders et al., 2019; Bovy et al., 2019; Binney, 2020; Kawata et al., 2021; Chiba & Schönrich, 2021), and more recently, (Clarke & Gerhard, 2022; Dillamore et al., 2024a; Zhang et al., 2024b). This puts the corotation radius of the Galactic bar at kpc given that the rotation velocity of the disc is (McMillan, 2017). However, in the past, the Galactic bar may not have been rotating with the pattern speed we measure today. It has been demonstrated analytically and computationally that the Galactic bar could decelerate due to dynamical friction against the dark matter halo (Debattista & Sellwood, 2000; Athanassoula, 2003; Weinberg & Katz, 2007, and reference therein). Chiba et al. (2021) and Chiba & Schönrich (2021) used the kinematics and chemistry of the solar neighbourhood stars to constrain the deceleration rate of the Milky Way bar as . A slowing bar has been shown to be crucial in Milky Way modelling (Chiba et al., 2021; Dillamore et al., 2024b; Li et al., 2024; Yuan et al., 2024). In addition, the slowdown rate of the bar is an important tracer of the kinematics of the dark matter halo (Athanassoula, 2003), which opens a new window to constrain the nature of dark matter.
In this work, we compare the age-metallicity plane observed in the solar vicinity (Xiang & Rix, 2022) to a test particle simulation with a decelerating bar and investigate how bar-driven radial migration affects the age-metallicity plane in the solar vicinity. We describe the data and quality cuts that we adopted in Section 2. We present the setup of the test particle simulation in Section 3. In Section 4, we compare the age-metallicity plane of the test particle simulation to observation in Section 4.1; we discuss the implications of this radial migration mechanism to the disc -bimodality in Section 4.2; and we infer the pattern speed evolution history of the Milky Way bar in Section 4.3. In Section 5, we discuss other implications and other predictions that we expect to observe in the Milky Way under the bar-driven radial migration scenario.
2 Data
We use the stellar parameter and isochrone age measurements of subgiant stars derived from LAMOST DR7 spectra by Xiang et al. (2019) and Xiang & Rix (2022). The typical age uncertainty is for stars younger than Gyr and for older stars. To obtain stellar kinematics, we use the astrometric measurements from Gaia DR3 (Gaia Collaboration et al., 2022), geometric distances derived in Bailer-Jones et al. (2021), and the line-of-sight velocity measurements from LAMOST (Deng et al., 2012). We calculate the orbital parameters (e.g. eccentricity and guiding radius) of stars using the Milky Way potential in McMillan (2017) using AGAMA (Vasiliev, 2019). To ensure reliable orbital parameters, we select stars with small parallax uncertainties and small radial velocity uncertainties, i.e. and km s-1. We remove stars with metallicity error or age error Gyr. To select stars belonging to the Galactic disc, we keep stars with orbital , vertical height kpc, and Gyr. These values are consistent with the metallicity and age measurements of the spin-up epoch of the Milky Way (Miglio et al., 2021; Belokurov & Kravtsov, 2022; Rix et al., 2022; Conroy et al., 2022; Chandra et al., 2023; Zhang et al., 2024a; Queiroz et al., 2023; Belokurov & Kravtsov, 2024; Zhang et al., 2024c; Liao et al., 2024). There are stars left after these selections and of them reside within kpc of the Sun.
3 Simulation
We run a test particle simulation with a realistic galactic potential. We gradually release particles into the simulation to investigate the response of stars of different ages to a decelerating bar. We summarise the key information here and present the details in Appendix A.
We set up a time-evolving galactic potential using a similar approach to Dillamore et al. (2024a). To ensure the realism of the simulation, we adopt the potential of the inner Galaxy from Portail et al. (2017, ). We grow the galactic bar Gyr into the simulation, increasing the galactic bar strength following the prescription in Dehnen (2000). We let the bar reach its maximum strength at Gyr and slow the bar pattern speed after this. We set the initial pattern speed to and adopt a constant slowdown rate . We also adjust the bar length according to its pattern speed to ensure is constant as the bar length should increase during deceleration (Athanassoula, 1992). At the final time of Gyr, the pattern speed is , similar to the measurements of the Milky Way bar (Clarke & Gerhard, 2022; Zhang et al., 2024b), with corotation radius at kpc. The exact pattern speed evolution is described in Appendix A.
We initialise the phase space of the test particles using the quasi-isothermal disc model (Binney, 2010). We linearly increase the scale length of the disc model from 1 kpc to 3.5 kpc during the simulation to mimic the inside-out disc formation. The details for the initial phase space distribution of the generated test particles are in Appendix A. Every Myr, we sample particles from the disc model and add them to the simulation. To simulate the dynamical heating, we also give random velocity kicks to the stars by convolving their three Cartesian velocity components with an isotropic Gaussian distribution, , every Myr. The resulting age-velocity dispersion relation is roughly consistent with Milky Way observations (Sharma et al., 2021b). We assign a metallicity to each particle according to their birth radius and age using the method described in Lu et al. (2024b) to better compare observation and simulation. To mimic the spatial coverage of the data, we apply a simple spatial cut to the output of the test particle simulation. We place the Sun at kpc from the galactic center (Bland-Hawthorn & Gerhard, 2016) and an angle relative to the orientation of the galactic bar (Bovy et al., 2019). Particles beyond kpc from the Sun are removed. We use this subsample of the simulated test particles in the following sections unless otherwise stated.
4 Results
In this section, we analyse the results of the test particles and compare them to the observations in the solar vicinity.
4.1 Age-metallicity sequences in the solar vicinity
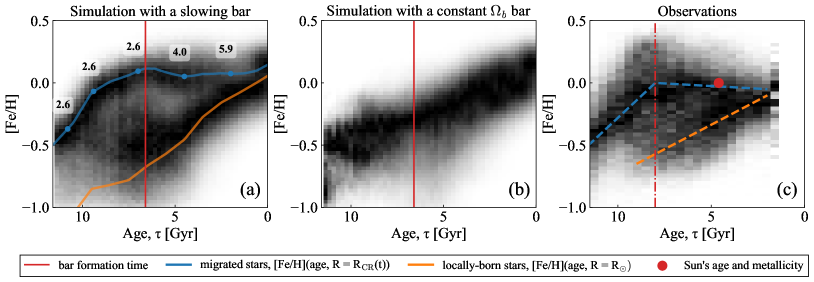
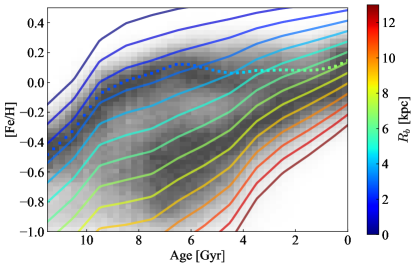
Panel (a) of Fig. 1 shows the column-normalised age-metallicity distribution of the simulated particles in the solar vicinity. Two clear sequences are apparent: an upper sequence that rises rapidly at early times and flattens for stars formed since the bar began decelerating (marked by the orange-solid line), and a lower sequence that exhibits a strong age-metallicity correlation all the way to young ages. We identify the two sequences with migrated and local stars respectively. The red solid line, , represents the evolution of metallicity for particles that formed at the present solar radius, , demonstrating that the local sequence is composed of stars born around the solar circle.
The migrated sequence is for particles that formed inside the solar circle and were dragged to the solar vicinity by the bar corotation resonance. The resonant dragging by the corotation of a decelerating bar increases the angular momentum of the trapped stars (Chiba et al., 2021), forcing them to migrate with the expansion of the corotation radius. This migration mechanism has also been identified in many N-body simulated galaxies (Halle et al., 2015, 2018; Khoperskov et al., 2020). For particles seeded before the bar formation, those that formed and reside around the initial corotation radius ( kpc in the simulation) are trapped at the moment of bar formation and are dragged later by the expansion of the corotation radius. This corresponds to the portion of the migrated sequence with a quick metallicity increase as a function of age. During bar deceleration, the corotation resonance expands and sweeps through the disc. The corotation resonance then traps particles born at larger radii, which have lower metallicity at the same age, causing the flattening in the age-metallicity sequence after bar formation. We use the blue solid line to denote the metallicity evolution for particles formed at the corotation radius at their birth time , i.e. , where
| (1) |
To summarise, the migrated sequence is composed of the age-metallicity relation at the initial corotation radius for the time before the bar formation and the chunks of age-metallicity relations at the corresponding corotation radii at later times. The migrated sequence after the bar formation is flatter than the expected age-metallicity sequence at a fixed radius because stars at larger radii are dragged, but the extent of flattening depends on the details of the chemical evolution history (see Fig. A1 and Section 4.3.1 for clarification).
As a comparison experiment, we run another test particle simulation that is the same as the previous simulation, except that the galactic bar is rotating with a constant pattern speed of . The resulting age-metallicity plane is shown in panel (b) of Fig. 1. A clear difference is that only one sequence is observed as the corotation resonance cannot drag particles from the inner galaxy to the outer disc, but instead only mixes stars around its corotation radius. Other non-axisymmetric perturbations (e.g., spiral arms) have to be involved in explaining the observation, which may lead to other inconsistencies (e.g. see Hamilton et al., 2024).
In panel (c) of Fig. 1, we show the column-normalised age-metallicity distribution for the subgiant star sample described in Section 2. As for the test particle simulation, there are two distinct sequences marked by the blue and orange dashed lines. The test particle simulation results suggest that the lower sequence is composed of stars that formed around , and the upper sequence is composed of stars formed in the inner Galaxy that have migrated with the expansion of the corotation radius. Xiang & Rix (2022) also pointed out the migrated origin of the upper sequence. Under this scenario, the turning point in the upper sequence, indicated by the red dashed line, gives an estimate of the bar formation epoch of Gyr ago, which is broadly consistent with other measurements of the bar formation time (Sanders et al., 2024; Haywood et al., 2024). We indicate the metallicity and age of the Sun with the red circle in panel (c). The Sun resides on the migrated sequence, suggesting that the Sun may have migrated to its current location with the corotation of the bar (Baba et al., 2024). A difference between panels (a) and (c) is that the upper envelope of the migrated sequence in the observations is decreasing slightly whilst its counterpart in the test particle simulation is flat. This implies that either the deceleration rate is underestimated (see discussion in Section 4.3.1) or other non-axisymmetric perturbations neglected in the simulation have enhanced the radial migration.
4.1.1 Age-metallicity sequences at different guiding radii
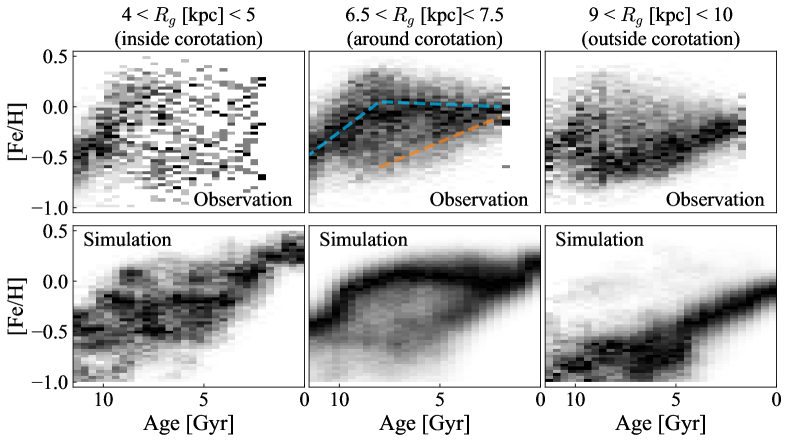
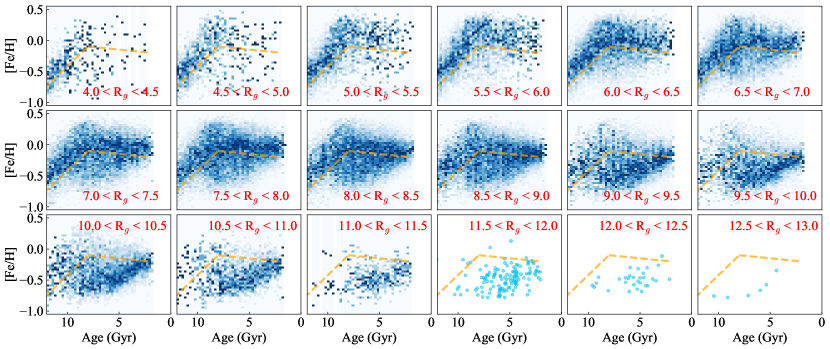
We further examine the dependence of the sequences in the age-metallicity plane on the guiding radii, , of stars. The upper (lower) panel of Fig. 2 shows the column-normalised age-metallicity distribution of stars (test particles) in guiding radii bins of , , and , corresponding to stars (test particles) that are inside, around and outside the current corotation resonance, respectively (see the full plot of the age-metallicity distribution in all guiding radii bins in Fig. B1 and B2). The distribution in the age-metallicity space strongly depends on the guiding radius in both the observation and simulation:
— Inside the current corotation radius (, left column), we do not find a strong correlation in the age-metallicity plane, except for a sequence of increasing metallicity for stars older than Gyr. This is the age-metallicity relation sequence for the high- disc as discussed in Xiang & Rix (2022) (see fig. 2 therein). Fewer stars are observed at lower ages because of the imposed birth radii selection, which requires stars to have rather eccentric orbits to be born in the inner Galaxy and observed in the solar vicinity. As a result, the trends in the young stars are inconclusive. Similar shapes of the age-metallicity sequences have also been observed with the APOGEE data (Lian et al., 2022a; Khoperskov et al., 2024). The test particle simulation suggests that this guiding radii bin is dominated by stars born at that radius, but stars born inside and outside have non-negligible contributions as well.
— For the observed stars with a guiding radius around the present-day corotation radius (, middle column), the upper age-metallicity sequence dominates, whereas the lower sequence also appears, but weakly. In the lower-middle panel, the age-metallicity plane of the test particles also shows the co-existence of these two sequences.
— Outside the corotation radius (, right column), the lower sequence in both the observation and the simulation dominates the age-metallicity plane. A similar result is also presented in Lian et al. (2022a) using the APOGEE survey.
The dependence of the age-metallicity distribution on guiding radius sheds light on the origin of the two age-metallicity sequences. The observation that the upper sequence is the strongest around the corotation radius further supports our argument that the stars in the upper sequence are migrated due to the corotation resonance. The guiding radii of stars trapped in corotation orbits oscillate around the corotation radii. The half peak-to-peak amplitude of this guiding radii oscillation in the potential model we used is kpc. Given that the present-day corotation radius is around kpc (Kawata et al., 2021; Chiba & Schönrich, 2021; Clarke & Gerhard, 2022; Dillamore et al., 2023, 2024a; Zhang et al., 2024b; Cao et al., 2024), we expect to see that the upper sequence exists only in the guiding radii bins between kpc, which is consistent with the observations (see Appendix B for more plots).
4.2 Implication for the disc -bimodality
Radial migration driven by a decelerating bar also naturally explains the -bimodality observed in the Galactic disc. We argued that the solar vicinity is occupied by stars with two different origins: the stars formed in the inner Galaxy that have experienced resonant dragging, and the stars formed around the solar circle. Due to the difference in the birth environment for these two groups of stars, the distribution of the -element abundance, , at the same metallicity should be different. Under the inside-out disc formation scenario and the age relation of the Milky Way (Miglio et al., 2021), stars from the inner part of the Galactic disc are expected to be more -rich compared to the outer disc stars at the same metallicity.
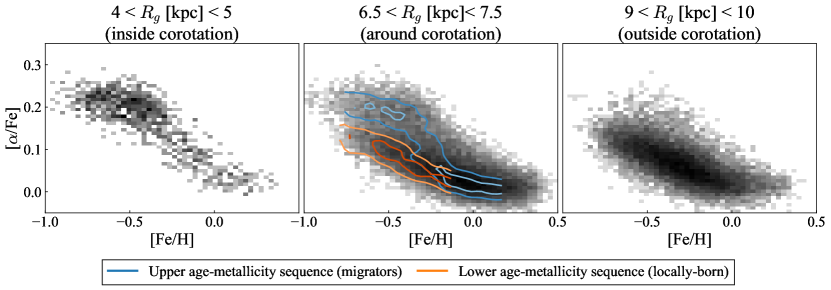
An -bimodality is reported in the LAMOST survey (Xiang et al., 2019; Wang et al., 2022). In Fig. 3, we show the distribution of for stars in the same guiding radii as chosen in Fig. 2. We do not see an -bimodality inside or outside the current corotation radius, as shown in the left and right panels. We have already discussed how the guiding radii bin of 4-5 kpc is impacted by the selection function which favours stars from the high- thick disc. However, a similar result is also reported using the APOGEE survey, which should be less affected by this effect (Hayden et al., 2015; Sharma et al., 2021a). In the middle panel, which shows the distribution of stars around the corotation radius, the blue (orange) contour illustrates the column-normalised distribution of stars located around the upper (lower) age-metallicity sequence denoted by the blue (orange) dashed line in the upper middle panel of Fig. 2. The distribution naturally separates into two distinct sequences, the sequence of migrated stars (high-), and the sequence of local stars (low-). The high- migrated stars are born in the inner Galaxy ( kpc, see the next section) before the bar starts to decelerate. With the slowing of the Galactic bar, the corotation resonance picks up stars at larger Galactocentric radii, which have lower values, causing a quick drop of for the migrated sequence at higher metallicity. The orange sequence is composed of the stars formed around the solar circle and hence has a lower value.
Our results supplement previous analyses that have shown that radial migration can reproduce the -bimodality in the Galactic disc (Sharma et al., 2021a; Chen et al., 2023). The scale length growth of the disc has to be more finely tuned to match the observed radial dependence of the plane for radial migration mechanisms that do not favour the current corotation radius. Our analysis suggests decelerating bar-driven radial migration is the key mechanism responsible for the disc -bimodality, which causes the migrated and local stars to co-exist around the present corotation radius, naturally. However, other effects in addition to radial migration could also cause -bimodality in the Galactic disc, and our results cannot rule out their existence (e.g. Khoperskov et al., 2021).
4.3 Inferred slowdown history of the Galactic bar
We have developed a qualitative picture of bar-driven radial migration and now turn to a more quantitative estimate of the required bar properties to explain the migrated age-metallicity sequence dragged by the bar corotation resonance. We describe a motivational model that gives an initial estimate and builds intuition for the effect before giving a fuller calculation utilising a more realistic birth radii method.
4.3.1 A motivational calculation
In a realistic galaxy model, the metallicities of stars depend on their birth time and radius, i.e. . Hence, the age-metallicity gradient of a sequence can be written as
| (2) |
Under the scenario that the migrated (upper) age-metallicity sequence is a consequence of the dragging of the bar corotation resonance, we relate to the bar deceleration rate as
| (3) |
We then rearrange Eq. (2) as
| (4) |
We can estimate from the slope of the local (lower) age-metallicity sequence in Fig. 1, which yields . We adopt and (McMillan, 2017; Bragança et al., 2019). As the age-metallicity gradient of the migrated sequence is almost flat, , we calculate from Eq. (4). From Eq. (2), we can see that the flatness of the migrated age-metallicity sequence is a consequence of the balance between the bar deceleration rate and the metallicity enrichment rate. A decline or increase in the migrated age-metallicity sequence after bar formation could also be expected if the deceleration rate is faster or slower.
4.3.2 Inference with the birth radii of stars
We can decipher radial migration in the Galactic disc in greater detail with inferred birth radii of stars. With stellar metallicity and age measurements, Lu et al. (2024b) improved on the method described in Minchev et al. (2018) and derived the empirical metallicity temporal evolution, , with the same subgiant star sample that we used in this work (Xiang & Rix, 2022). Using the metallicity evolution, they calculated the birth radii of these stars. The methodology is tested against various suites of cosmological simulations (see Lu et al., 2022; Ratcliffe et al., 2024b; Lu et al., 2024a, b, and some details in Appendix C). In our analysis, we adopt the birth radii inferred in Lu et al. (2024b). By projecting the age-metallicity plane to the age- plane, we are able to study the radial migration history of the Galactic disc in detail.
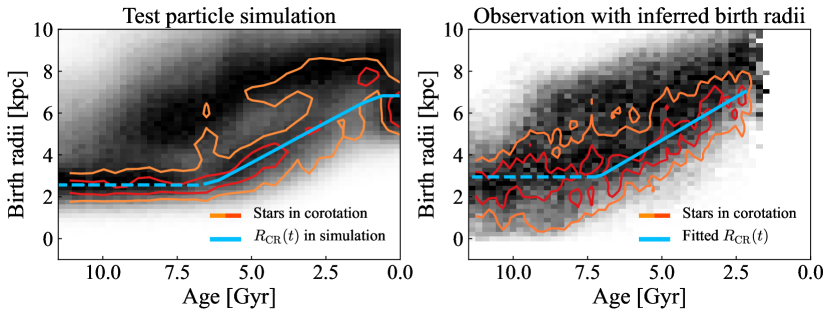
Corotation orbits are characterised by their special orbital shape, in which the corotation stars spend the majority of their orbital lifetime along one side of the Galactic bar. To select stars that are in corotation resonance with the Galactic bar, we integrate the orbits from their present-day phase space location for Gyr, and we classify a star as trapped in the corotation resonance if its orbit resides on one side of the Galactic bar over of this time. The stars in the present-day corotation resonance are candidates for stars that have migrated with the decelerating bar. In the left panel of Fig. 4, we show the column-normalised histogram of the age- plane for the test particle simulation in the background. The contours show the column-normalised distribution of the selected corotating stars. The blue line in the left panel indicates the temporal evolution of the corotation radius at different times in the test particle simulation, i.e. in Eq. (1). The blue line coincides with the distribution of trapped stars, demonstrating that we can use the birth radii of the corotating stars to infer the temporal evolution of the corotation radii in the Milky Way.
We repeat the analysis using the observed data and the birth radii inferred in Lu et al. (2024b). To select corotating stars, we integrate the orbits assuming that the current bar angle and pattern speed are and (Zhang et al., 2024b). In the right panel of Fig. 4, we show the column-normalised distribution of all the stars in the background and that of the selected corotating stars by the contours. The contours for the corotating stars behave very similar to the test particle results, notably a plateau for the old stars and a linear increase for the young stars. We fit a function, , to the innermost contour of the selected corotating stars using the least-squares method, where
| (5) |
is the initial corotation radius, the age that the Galactic bar starts to decelerate, the deceleration rate, and the rotation curve which we fix the value to (McMillan, 2017). The best-fit line is shown in blue in the right panel of Fig. 4. The best-fit values are kpc, , and Gyr. The statistical uncertainties on these parameters are significantly smaller than the systematic uncertainties discussed later. The inferred slowing down rate is similar to the previous approximate calculation and is consistent with the measurement in Chiba et al. (2021). The best-fit is consistent with previous measurements of the bar formation time (Sanders et al., 2024; Haywood et al., 2024). With the best-fit kpc, the initial pattern speed is then . These parameters agree with the pattern speed evolution of Milky Way-type galaxies in the TNG50 cosmological simulation suite (Semczuk et al., 2024).
Since the history of the MW is mostly unknown, the birth radii inference in Lu et al. (2024b) requires a few assumptions to obtain the metallicity evolution. Here, we experiment with adjusting the calibrated metallicity evolution model in Lu et al. (2024b) to assess the systematic uncertainties in the deceleration rate inference. By shifting the present-day metallicity at the Galactic center () and the value of the steepest metallicity gradient (), we re-derive the birth radii of stars in our sample. We find that the general shape of the distribution of the corotating stars in the age- plane remains the same, but the exact values of the best-fit parameters vary. The parameters vary in the range of Gyr, and , and . The variation of the initial pattern speed is the highest as the value is sensitive to a small variation in . These variations show the order of magnitude of the systematic uncertainty in our inference. We also vary the bar angle () and the present-day pattern speed () needed to select the corotating stars, but these give variations in the best-fit parameters that are significantly smaller than the systematic uncertainties induced by the birth radii inference method.
5 Discussion
5.1 Predictions for the bar-driven radial migration scenario
In addition to the results shown above, there is more observational evidence to support the decelerating bar-driven radial migration as the main driver for the migration in the Milky Way disc.
Azimuthal metallicity variation: Di Matteo et al. (2013) showed that ongoing radial migration can cause azimuthal abundance variations in the galactic disc. A key difference in the bar-driven radial migration scenario from other migration mechanisms is the azimuthal distribution of the migrated stars. Due to the characteristic shape of the corotation orbits, corotating stars naturally clump along the bar minor axis around the corotation radius. Therefore, the stars that experienced corotation dragging and migrated from the inner Galaxy would form an overdensity along the bar minor axis, causing the mean metallicity to peak along the bar minor axis. Azimuthal metallicity variation has been observed in the Milky Way disc (Poggio et al., 2022; Hawkins, 2023; Hackshaw et al., 2024). Recently, Khoperskov et al. (2024) measured the metallicity distribution of the entire Galactic disc with orbital reconstruction. As shown in fig. 22 therein, the metallicity for stars around guiding radii of kpc varies sinusoidally in the azimuthal direction and peaks along the bar minor axes. Such an azimuthal trend is not seen in stars at other guiding radii. This result is in agreement with the prediction of our model. However, kinematic fragmentation (Fragkoudi et al., 2017; Debattista et al., 2017; Zhang et al., 2024c) could also cause a similar result, as kinematically cold (more metal-rich) stars are easier to be trapped. Therefore, more analysis is needed to differentiate these mechanisms.
Azimuthal variation in the high- star fraction: As we discussed in Section 4.2, high- stars observed in the solar vicinity are members of the migrated star sequence. Therefore, similarly to the azimuthal variation of metallicity, we might also expect an azimuthal variation for the high- star fraction (/), where more high- stars are expected along the bar minor axes. We examine this using the sample we adopted in this work and a sample from APOGEE DR17. We indeed see an azimuthal variation in the fraction of high- stars around the corotation radius (see Fig. D1). THe fraction is smallest around the bar’s major axis and increases towards the minor axis. The prediction is also in agreement with the results shown in Khoperskov et al. (2024), who found that the high- sequence contributes more in the direction of the minor axes than the major axes.
Coldness of the Galactic disc: Frankel et al. (2020) found that diffusion in the angular momentum of the Galactic disc stars is much greater than the scattering of radial actions. Recently, Hamilton et al. (2024) showed that it is difficult to transport stars with such coldness with transient spiral arms unless the lifetime and pitch angle for the spiral arms are fine-tuned (but also see the counterevidence in Sellwood & Binney, 2025). However, in the bar-driven radial migration scenario, the angular momentum of the corotating stars increases with the slowing of the bar, but the radial actions are invariant (see Sellwood & Binney 2002; Chiba et al. 2021 for theoretical explanations). Computationally, Khoperskov et al. (2020) showed that the orbits of stars transported with the corotation resonance can remain circular. So, the bar-driven radial migration scenario could alleviate the problem of the coldness of the migration, but more experiments or quantitative analysis are required to demonstrate this.
Density profile of the disc: As argued, the Galactic high- and high- disc should also experience significant radial migration driven by the decelerating bar. Stars that experienced resonant dragging clump around the present-day corotation radius producing a maximum in the radial exponential surface density profile of the high- and high- disc leading to the broken-power law profiles as observed by (Yu et al., 2021; Lian et al., 2022b). More studies are required to quantify the correlation between disc density profiles and the bar-driven radial migration mechanism.
5.2 Caveats of the test particle simulation
Our test particle simulations have a number of simplifications and limitations.
First, we kept the bar strength constant since the bar’s formation. However, a realistic bar may experience a buckling instability during its evolution. When bar buckling occurs, the bar strength drops rapidly and many stars trapped by the corotation resonance may escape (Khoperskov et al., 2020). Hence, the efficiency of radial migration could have been overestimated in the test particle simulation. Nevertheless, the resonant drag of the galactic bar should still migrate the stars after the bar buckling, so it would not affect our argument. Similarly, the test particle simulation and our quantitative model in Section 4.3.2 both assumed a constant slowdown, , of the bar over its lifetime. Cosmological simulations (e.g. Semczuk et al., 2024, TNG50 as analysed by) show a diversity of slow-down histories (and even periods of spin-up) so it is likely the Milky Way’s bar history is more complex than our simple model. This simplifying assumption could then lead to an overestimate of the resonant trapping efficiency and hence the migration efficiency.
Secondly, we also adopted a specific chemical model to assign the metallicity of the particles in the simulation. The detailed quantitative results presented in this work depend on the method in Lu et al. (2024b). However, the nature of our argument is that the decelerating bar-driven radial migration causes stars from very different birth radii to co-exist around the corotation radius, and the metallicity of the migrated sequence naturally flattens after the bar formation because the corotation resonance moves outward. Hence, switching to a different chemical model does not affect our argument as long as the radial metallicity gradient in the model is reasonable. Furthermore, our motivational calculation in Section 4.3.1 and the observation of the break in the upper migrated age-metallicity sequence are direct empirical indicators which lead to very similar conclusions as the more detailed birth radii calculation.
6 Conclusion
In this work, we analysed the age-metallicity distribution of subgiant stars in the solar vicinity and observed two distinct age-metallicity sequences (see panel (c) of Fig. 1 for the observed age-metallicity plane). We ran a test particle simulation with a decelerating bar. The corotation resonance of the Galactic bar sweeps through the disc trapping particles. These trapped particles then experience resonant dragging and migrate with the expansion of the corotation radius. The simulation reproduces the two distinct sequences in age-metallicity: the upper age-metallicity sequence corresponds to the stars formed in the inner Galaxy that have migrated with the corotation resonance, while the lower sequence is composed of stars formed locally around the solar circle which have not undergone much radial migration. This explains the rapid metallicity increase at early times, the flattening at late times in the migrated sequence and the strong age-metallicity correlation in the local sequence.
We further showed the guiding radii dependence of the upper and lower age-metallicity sequences. The upper sequence is the dominant population around the present-day corotation radius, whereas the lower sequence dominates outside the corotation radius. We observed the upper sequence in the guiding radii bins of kpc, which is consistent with the expected radial range of the current corotation resonance and the amplitude of the libration oscillation (Chiba et al., 2021; Chiba & Schönrich, 2021). We find the same guiding radii dependence in our test particle simulation, strengthening the conclusion that this sequence is composed of migrators dragged by the corotation resonance.
We provided a series of other predictions if the slowing down of the Galactic bar is the main driver responsible for the radial migration in the Milky Way disc. We expect that: (1) the mean metallicity of stars is higher along the bar’s minor axis around the corotation radius; (2) the fraction of high- stars is the smallest along the bar’s major axis and increases towards the minor axis around the corotation radius, which is demonstrated in Fig. D1 using APOGEE survey; (3) the migrated stars experienced much more radial migration than radial heating; (4) the radial density profile of the high- and high-Fe stars should be consistent with a broken power law with the break close to the corotation radius. As discussed in Section 5.1, many of these predictions are consistent with observations in the Milky Way.
We also shed light on the origin of the disc -bimodality. Previous studies have discovered that radial migration could cause the -bimodality of the disc (Schönrich & Binney, 2009; Minchev et al., 2013; Sharma et al., 2021a; Chen et al., 2023). Here, we propose that migration driven by the decelerating bar could be the major mechanism, as the existence of the -bimodality also shows a clear dependence on the guiding radii and is perhaps most prominent around the present-day corotation resonance of the bar. We show that the two distinct age-metallicity sequences occupy different regions in the plane, resulting in the -bimodality (Khoperskov et al., 2024).
Finally, under the radial migration scenario, we use the ages and metallicities of stars currently trapped at corotation to infer the evolution history of the Galactic bar’s pattern speed. We used the birth radii inferred in Lu et al. (2024b) to track the temporal evolution of the corotation radius in the Milky Way’s past. The results suggest that the Galactic bar formed and started to decelerate Gyr ago with an initial pattern speed of and a constant slowdown rate , consistent with previous constraints (Chiba et al., 2021; Chiba & Schönrich, 2021; Sanders et al., 2024; Haywood et al., 2024).
Acknowledgments
Appendix A Details for the test-particle simulation
In this appendix, we describe the details of the test particle simulation we used in this work.
A.1 Time evolution of the galactic potential
We follow the same approach as in Dillamore et al. (2024a), except that we use a different bar formation time. We adopt the Milky Way potential in Sormani et al. (2022), which is an analytic approximation for the Made-to-Measure model of the inner Galaxy (Portail et al., 2017). We use the non-axisymmetric part of this potential as a model of the galactic bar. We run the test particle simulation for Gyr. The axisymmetric component of the potential is kept the same throughout the simulation so that the total mass is conserved. We let the bar component grow at Gyr since the start of the simulation and reach its maximum strength at Gyr, during which the pattern speed of the growing bar is constant. The smooth growth of the bar strength follows the same prescription as in Dehnen (2000).
We set the initial pattern speed of the galactic bar as . The galactic bar starts to decelerate after the galactic bar reaches its full strength. We slow the galactic bar using a constant slowdown rate (), which is roughly consistent with the value obtained for the Milky Way bar in Chiba et al. (2021). The exact formula for the galactic bar pattern speed evolution is (Chiba et al., 2021; Dillamore et al., 2024a):
where the initial pattern speed is km s-1 kpc-1, final pattern speed km s-1 kpc-1, Gyr, Gyr, Gyr, and Gyr. We also adjust the length of the bar scaled to its corotation radius so that the length of the bar matches its original value when the pattern speed is (the pattern speed value of the Portail et al. (2017) model). At the end of the simulation, the pattern speed is .
A.2 Initial condition of the test particles
The initial conditions of the stellar particles are generated from a quasi-isothermal disc model (Binney, 2010):
where , and are the radial, azimuthal and verticle actions, , the radial and verticle epicyclic frequencies, the circular angular frequency. The adopted parameters are kpc, kpc, and We increase the scale length, , of the disc model linearly from 1 kpc at the beginning of the simulation to 3.5 kpc at the end to mimic the inside-out disc formation. We generate stars using the sampling routine in Agama (Vasiliev, 2019). We release particles into the test-particle simulation for every Myr.
A.3 Dynamical heating
In addition to the heating induced by the growing bar, we give a random velocity kick to the particles in the simulation by convolving their three Cartesian velocities with an isotropic Gaussian distribution every Myr. This simulates the additional contribution of other scattering processes e.g. spirals, satellites etc. The resulting radial velocity dispersion for stars at kpc with age of Gyr in the test particle simulation is , which is compatible with the observation in the Milky Way (Sharma et al., 2021b).
A.4 Metallicity assignment
With the birth radius and age of a star, we assign metallicities to the particles in the simulation using the metallicity enrichment derived in Lu et al. (2024b), where is the birth radius of the particle. The method is calibrated for the LAMOST subgiant sample in Xiang & Rix (2022). the method assumes a monotonic increase in stellar metallicity at the Galactic centre and the radial metallicity gradient is constant throughout the time since the disc formation. In their method, the current metallicity gradient is -0.07 , taken from (Bragança et al., 2019), and the highest metallicity is dex in the Galactic center. The steepest metallicity gradient is -0.15 at Gyr ago, similar to what is seen in cosmological simulations. A more detailed description of the method is provided in Appendix C. Using this method, metallicity could also serve as an indicator for the birth radii of the particle, for which more metal-rich stars are formed in the inner part of the galaxy at the same ages. The detailed metallicity growth at different radii is present in Fig. A1.
We directly use this observational calibrated method for the metallicity assignment in our test particle simulation for a better comparison between the observation and simulation, as we run the simulation from approximately the same age as the Milky Way disc formation. In Fig. A1, we demonstrate that the (upper) migrated age-metallicity sequence follows the metal enrichment at the initial corotation radius before the bar formation and then crosses the age-metallicity relations at larger birth radii at a late time, causing its flattening.
Appendix B Age-metallicity distribution in all guiding radii bins
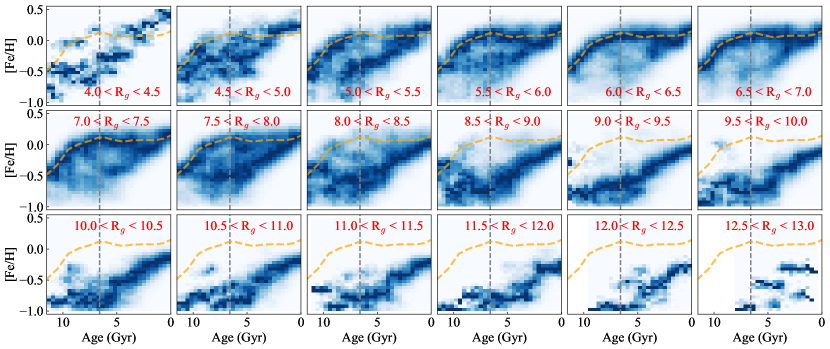
We present the age-metallicity distribution of stars and test particles in guiding radii bins of 4-5 kpc, 6.5-7.5 kpc, 9-10 kpc. Here, we show a more complete picture of the age-metallicity distribution with all guiding radii bins from 4-13 kpc with a width of 0.5 kpc. Fig. B1 shows that for the observations and Fig. B2 for the test particle simulation. The orange-dashed line in each panel of Fig. B1 is used to separate the upper and lower sequences, and the orange-dashed line in Fig. B2 is used to denote the expected occupation for the distribution of the particles transported by the corotation resonance (the same as the blue dashed line in Fig. 1).
The final corotation radius in the test particle simulation is kpc similar to the expected value for the Milky Way ( kpc). The amplitude of the guiding radii libration oscillation is kpc, and hence, the corotation stars are then expected to occupy the guiding radii range of kpc. In both the observation and test particle simulation, the upper sequence exists ubiquitously among this range of guiding radii, and thus, agree with the expectation from the bar-driven radial migration scenario.
Appendix C Birth radii calculation
The birth radii of stars are key information for decoding the radial migration in the Galactic disc. Lu et al. (2024b) improved upon the method described in Minchev et al. (2018) to derive the birth radii of subgiant stars in Xiang & Rix (2022). The method assumes that the radial metallicity gradient in the interstellar medium (ISM) is always linear after the stellar disc has started to form (tested using cosmological simulations in Lu et al., 2022), which we then can write the stellar metallicity for a star with age, , and birth radius as
| (C1) |
where represent the central metallicity, and the metallicity gradient at the age. The central metallicity is estimated using the upper envelope of the observed age-metallicity plane at the corresponding age. Lu et al. (2024b) postulated that the metallicity gradient at specific ages is linearly correlated with the stellar metallicity range observed at that age, , based on the simulated galaxies in NIHAO-UHD (Buck et al., 2020) and HESTIA (Libeskind et al., 2020). The linear correlation in written in the normalised metallicity range, , which lies between 0 and 1, and
| (C2) |
Recently, Ratcliffe et al. (2024a) further corrected this correlation by adding the impact of the size of the star-forming region for the galaxy. The parameters in this linear correlation are determined using the boundary condition that the current metallicity gradient in the Galactic disc is (Bragança et al., 2019), and the steepest metallicity gradient in the past. The latter is constrained by requiring that the youngest stars have close-to-zero migration and the disk forms inside-out on a reasonable timescale, which leads to a value , similar to what is found in cosmological simulations. With , we can then rewrite Eq. (C1) as
| (C3) |
The assumptions and methodology are tested and verified against the NIHAO-UHD (Buck et al., 2020) simulations in Lu et al. (2022). It has also been tested on HESTIA (Libeskind et al., 2020; Khoperskov et al., 2023), TNG50 (Nelson et al., 2019) for MW-like galaxies (Ratcliffe et al., 2024b), and NIHAO galaxies (Wang et al., 2015) down to the LMC mass (Lu et al., 2024a).
Appendix D Azimuthal variation for high- star fraction
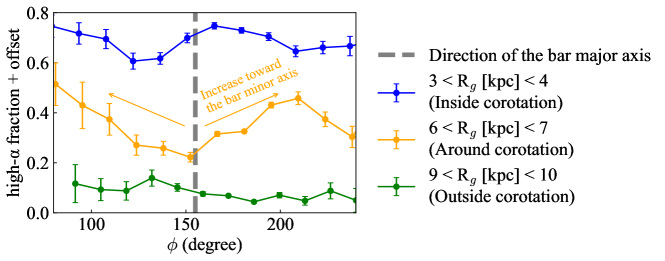
We use the metallicity and measured in the APOGEE survey (Abdurro’uf et al., 2022) as it has a larger azimuth coverage than the LAMOST subgiant sample we used for the main results. Similarly to the data selection in Section 2, we keep stars with small distance uncertainty, small metallicity uncertainty, and small uncertainty, i.e. , , and . Stars with are removed for disc star selection. We only analyse stars with to ensure that the -distributions of the selected stars are roughly the same at each azimuthal angle.
We classify stars as a high- star if for and for . We then take the ratio of the high- to the total stars at different azimuthal angles in each of the guiding radii bins as shown in Fig. D1. There is an obvious increase of the high- star fraction for the azimuthal angles away from the bar-major axis around the present-day guiding radii (), while the variation is much more insignificant inside and outside the corotation. This is in agreement with the expected consequence of the radial migration driven by the decelerating bar (see more discussion in Section 5.1).
References
- Abdurro’uf et al. (2022) Abdurro’uf, Accetta, K., Aerts, C., et al. 2022, ApJS, 259, 35, doi: 10.3847/1538-4365/ac4414
- Astropy Collaboration et al. (2013) Astropy Collaboration, Robitaille, T. P., Tollerud, E. J., et al. 2013, A&A, 558, A33, doi: 10.1051/0004-6361/201322068
- Astropy Collaboration et al. (2018) Astropy Collaboration, Price-Whelan, A. M., Sipőcz, B. M., et al. 2018, AJ, 156, 123, doi: 10.3847/1538-3881/aabc4f
- Athanassoula (1992) Athanassoula, E. 1992, MNRAS, 259, 345, doi: 10.1093/mnras/259.2.345
- Athanassoula (2003) —. 2003, MNRAS, 341, 1179, doi: 10.1046/j.1365-8711.2003.06473.x
- Baba et al. (2024) Baba, J., Tsujimoto, T., & Saitoh, T. R. 2024, ApJ, 976, L29, doi: 10.3847/2041-8213/ad9260
- Bailer-Jones et al. (2021) Bailer-Jones, C. A. L., Rybizki, J., Fouesneau, M., Demleitner, M., & Andrae, R. 2021, AJ, 161, 147, doi: 10.3847/1538-3881/abd806
- Belokurov & Kravtsov (2022) Belokurov, V., & Kravtsov, A. 2022, MNRAS, 514, 689, doi: 10.1093/mnras/stac1267
- Belokurov & Kravtsov (2024) —. 2024, MNRAS, 528, 3198, doi: 10.1093/mnras/stad3920
- Beraldo e Silva et al. (2021) Beraldo e Silva, L., Debattista, V. P., Nidever, D., Amarante, J. A. S., & Garver, B. 2021, MNRAS, 502, 260, doi: 10.1093/mnras/staa3966
- Binney (2010) Binney, J. 2010, MNRAS, 401, 2318, doi: 10.1111/j.1365-2966.2009.15845.x
- Binney (2020) —. 2020, MNRAS, 495, 895, doi: 10.1093/mnras/staa1103
- Bland-Hawthorn & Gerhard (2016) Bland-Hawthorn, J., & Gerhard, O. 2016, ARA&A, 54, 529, doi: 10.1146/annurev-astro-081915-023441
- Bovy et al. (2019) Bovy, J., Leung, H. W., Hunt, J. A. S., et al. 2019, MNRAS, 490, 4740, doi: 10.1093/mnras/stz2891
- Bragança et al. (2019) Bragança, G. A., Daflon, S., Lanz, T., et al. 2019, A&A, 625, A120, doi: 10.1051/0004-6361/201834554
- Buck et al. (2020) Buck, T., Obreja, A., Macciò, A. V., et al. 2020, MNRAS, 491, 3461, doi: 10.1093/mnras/stz3241
- Cao et al. (2024) Cao, C., Li, Z.-Y., Schönrich, R., & Antoja, T. 2024, ApJ, 975, 292, doi: 10.3847/1538-4357/ad7b0e
- Carr et al. (2022) Carr, C., Johnston, K. V., Laporte, C. F. P., & Ness, M. K. 2022, MNRAS, 516, 5067, doi: 10.1093/mnras/stac2403
- Chandra et al. (2023) Chandra, V., Semenov, V. A., Rix, H.-W., et al. 2023, arXiv e-prints, arXiv:2310.13050, doi: 10.48550/arXiv.2310.13050
- Chen et al. (2023) Chen, B., Hayden, M. R., Sharma, S., et al. 2023, MNRAS, 523, 3791, doi: 10.1093/mnras/stad1568
- Chiba et al. (2021) Chiba, R., Friske, J. K. S., & Schönrich, R. 2021, MNRAS, 500, 4710, doi: 10.1093/mnras/staa3585
- Chiba & Schönrich (2021) Chiba, R., & Schönrich, R. 2021, MNRAS, 505, 2412, doi: 10.1093/mnras/stab1094
- Clarke & Gerhard (2022) Clarke, J. P., & Gerhard, O. 2022, MNRAS, 512, 2171, doi: 10.1093/mnras/stac603
- Conroy et al. (2022) Conroy, C., Weinberg, D. H., Naidu, R. P., et al. 2022, arXiv e-prints, arXiv:2204.02989, doi: 10.48550/arXiv.2204.02989
- Daniel et al. (2019) Daniel, K. J., Schaffner, D. A., McCluskey, F., Fiedler Kawaguchi, C., & Loebman, S. 2019, ApJ, 882, 111, doi: 10.3847/1538-4357/ab341a
- Debattista et al. (2017) Debattista, V. P., Ness, M., Gonzalez, O. A., et al. 2017, MNRAS, 469, 1587, doi: 10.1093/mnras/stx947
- Debattista & Sellwood (2000) Debattista, V. P., & Sellwood, J. A. 2000, ApJ, 543, 704, doi: 10.1086/317148
- Dehnen (2000) Dehnen, W. 2000, AJ, 119, 800, doi: 10.1086/301226
- Deng et al. (2012) Deng, L.-C., Newberg, H. J., Liu, C., et al. 2012, Research in Astronomy and Astrophysics, 12, 735, doi: 10.1088/1674-4527/12/7/003
- Di Matteo et al. (2013) Di Matteo, P., Haywood, M., Combes, F., Semelin, B., & Snaith, O. N. 2013, A&A, 553, A102, doi: 10.1051/0004-6361/201220539
- Dillamore et al. (2024a) Dillamore, A. M., Belokurov, V., & Evans, N. W. 2024a, MNRAS, 532, 4389, doi: 10.1093/mnras/stae1789
- Dillamore et al. (2023) Dillamore, A. M., Belokurov, V., Evans, N. W., & Davies, E. Y. 2023, MNRAS, 524, 3596, doi: 10.1093/mnras/stad2136
- Dillamore et al. (2024b) Dillamore, A. M., Monty, S., Belokurov, V., & Evans, N. W. 2024b, ApJ, 971, L4, doi: 10.3847/2041-8213/ad60c8
- Fragkoudi et al. (2017) Fragkoudi, F., Di Matteo, P., Haywood, M., et al. 2017, A&A, 606, A47, doi: 10.1051/0004-6361/201630244
- Frankel et al. (2018) Frankel, N., Rix, H.-W., Ting, Y.-S., Ness, M., & Hogg, D. W. 2018, ApJ, 865, 96, doi: 10.3847/1538-4357/aadba5
- Frankel et al. (2020) Frankel, N., Sanders, J., Ting, Y.-S., & Rix, H.-W. 2020, ApJ, 896, 15, doi: 10.3847/1538-4357/ab910c
- Gaia Collaboration et al. (2022) Gaia Collaboration, Vallenari, A., Brown, A. G. A., et al. 2022, arXiv e-prints, arXiv:2208.00211, doi: 10.48550/arXiv.2208.00211
- Hackshaw et al. (2024) Hackshaw, Z., Hawkins, K., Filion, C., et al. 2024, ApJ, 977, 143, doi: 10.3847/1538-4357/ad900e
- Halle et al. (2015) Halle, A., Di Matteo, P., Haywood, M., & Combes, F. 2015, A&A, 578, A58, doi: 10.1051/0004-6361/201525612
- Halle et al. (2018) —. 2018, A&A, 616, A86, doi: 10.1051/0004-6361/201832603
- Hamilton et al. (2024) Hamilton, C., Modak, S., & Tremaine, S. 2024, arXiv e-prints, arXiv:2411.08944, doi: 10.48550/arXiv.2411.08944
- Hawkins (2023) Hawkins, K. 2023, MNRAS, 525, 3318, doi: 10.1093/mnras/stad1244
- Hayden et al. (2015) Hayden, M. R., Bovy, J., Holtzman, J. A., et al. 2015, ApJ, 808, 132, doi: 10.1088/0004-637X/808/2/132
- Haywood et al. (2024) Haywood, M., Khoperskov, S., Cerqui, V., et al. 2024, A&A, 690, A147, doi: 10.1051/0004-6361/202348767
- Kawata et al. (2021) Kawata, D., Baba, J., Hunt, J. A. S., et al. 2021, MNRAS, 508, 728, doi: 10.1093/mnras/stab2582
- Khoperskov et al. (2020) Khoperskov, S., Di Matteo, P., Haywood, M., Gómez, A., & Snaith, O. N. 2020, A&A, 638, A144, doi: 10.1051/0004-6361/201937188
- Khoperskov et al. (2021) Khoperskov, S., Haywood, M., Snaith, O., et al. 2021, MNRAS, 501, 5176, doi: 10.1093/mnras/staa3996
- Khoperskov et al. (2023) Khoperskov, S., Minchev, I., Libeskind, N., et al. 2023, A&A, 677, A91, doi: 10.1051/0004-6361/202244234
- Khoperskov et al. (2024) Khoperskov, S., Steinmetz, M., Haywood, M., et al. 2024, arXiv e-prints, arXiv:2411.16866, doi: 10.48550/arXiv.2411.16866
- Li et al. (2024) Li, C., Yuan, Z., Monari, G., et al. 2024, A&A, 690, A26, doi: 10.1051/0004-6361/202449742
- Lian et al. (2022a) Lian, J., Zasowski, G., Hasselquist, S., et al. 2022a, MNRAS, 511, 5639, doi: 10.1093/mnras/stac479
- Lian et al. (2022b) Lian, J., Zasowski, G., Mackereth, T., et al. 2022b, MNRAS, 513, 4130, doi: 10.1093/mnras/stac1151
- Liao et al. (2024) Liao, X., Li, Z.-Y., Simion, I., et al. 2024, ApJ, 967, 5, doi: 10.3847/1538-4357/ad38ba
- Libeskind et al. (2020) Libeskind, N. I., Carlesi, E., Grand, R. J. J., et al. 2020, MNRAS, 498, 2968, doi: 10.1093/mnras/staa2541
- Lu et al. (2024a) Lu, Y., Buck, T., Nidever, D., et al. 2024a, MNRAS, 532, 411, doi: 10.1093/mnras/stae1509
- Lu et al. (2022) Lu, Y. L., Ness, M. K., Buck, T., & Carr, C. 2022, MNRAS, 512, 4697, doi: 10.1093/mnras/stac780
- Lu et al. (2024b) Lu, Y. L., Minchev, I., Buck, T., et al. 2024b, MNRAS, 535, 392, doi: 10.1093/mnras/stae2364
- McMillan (2017) McMillan, P. J. 2017, MNRAS, 465, 76, doi: 10.1093/mnras/stw2759
- Miglio et al. (2021) Miglio, A., Chiappini, C., Mackereth, J. T., et al. 2021, A&A, 645, A85, doi: 10.1051/0004-6361/202038307
- Minchev et al. (2013) Minchev, I., Chiappini, C., & Martig, M. 2013, A&A, 558, A9, doi: 10.1051/0004-6361/201220189
- Minchev & Famaey (2010) Minchev, I., & Famaey, B. 2010, ApJ, 722, 112, doi: 10.1088/0004-637X/722/1/112
- Minchev et al. (2011) Minchev, I., Famaey, B., Combes, F., et al. 2011, A&A, 527, A147, doi: 10.1051/0004-6361/201015139
- Minchev & Quillen (2006) Minchev, I., & Quillen, A. C. 2006, MNRAS, 368, 623, doi: 10.1111/j.1365-2966.2006.10129.x
- Minchev et al. (2018) Minchev, I., Anders, F., Recio-Blanco, A., et al. 2018, MNRAS, 481, 1645, doi: 10.1093/mnras/sty2033
- Nelson et al. (2019) Nelson, D., Springel, V., Pillepich, A., et al. 2019, Computational Astrophysics and Cosmology, 6, 2, doi: 10.1186/s40668-019-0028-x
- Poggio et al. (2022) Poggio, E., Recio-Blanco, A., Palicio, P. A., et al. 2022, A&A, 666, L4, doi: 10.1051/0004-6361/202244361
- Portail et al. (2017) Portail, M., Gerhard, O., Wegg, C., & Ness, M. 2017, MNRAS, 465, 1621, doi: 10.1093/mnras/stw2819
- Queiroz et al. (2023) Queiroz, A. B. A., Anders, F., Chiappini, C., et al. 2023, A&A, 673, A155, doi: 10.1051/0004-6361/202245399
- Quillen et al. (2009) Quillen, A. C., Minchev, I., Bland-Hawthorn, J., & Haywood, M. 2009, MNRAS, 397, 1599, doi: 10.1111/j.1365-2966.2009.15054.x
- Ratcliffe et al. (2024a) Ratcliffe, B., Khoperskov, S., Minchev, I., et al. 2024a, arXiv e-prints, arXiv:2410.17326, doi: 10.48550/arXiv.2410.17326
- Ratcliffe et al. (2024b) —. 2024b, A&A, 690, A352, doi: 10.1051/0004-6361/202449268
- Rix et al. (2022) Rix, H.-W., Chandra, V., Andrae, R., et al. 2022, ApJ, 941, 45, doi: 10.3847/1538-4357/ac9e01
- Roškar et al. (2008) Roškar, R., Debattista, V. P., Quinn, T. R., Stinson, G. S., & Wadsley, J. 2008, ApJ, 684, L79, doi: 10.1086/592231
- Roškar et al. (2012) Roškar, R., Debattista, V. P., Quinn, T. R., & Wadsley, J. 2012, MNRAS, 426, 2089, doi: 10.1111/j.1365-2966.2012.21860.x
- Sanders & Binney (2015) Sanders, J. L., & Binney, J. 2015, MNRAS, 449, 3479, doi: 10.1093/mnras/stv578
- Sanders et al. (2024) Sanders, J. L., Kawata, D., Matsunaga, N., et al. 2024, MNRAS, 530, 2972, doi: 10.1093/mnras/stae711
- Sanders et al. (2019) Sanders, J. L., Smith, L., & Evans, N. W. 2019, MNRAS, 488, 4552, doi: 10.1093/mnras/stz1827
- Schönrich & Binney (2009) Schönrich, R., & Binney, J. 2009, MNRAS, 396, 203, doi: 10.1111/j.1365-2966.2009.14750.x
- Sellwood & Binney (2025) Sellwood, J. A., & Binney, J. 2025, A comment on ”Why is the Galactic disk so cool?”, by Hamilton et al. https://arxiv.org/abs/2501.17907
- Sellwood & Binney (2002) Sellwood, J. A., & Binney, J. J. 2002, MNRAS, 336, 785, doi: 10.1046/j.1365-8711.2002.05806.x
- Semczuk et al. (2024) Semczuk, M., Dehnen, W., Schönrich, R., & Athanassoula, E. 2024, A&A, 692, A159, doi: 10.1051/0004-6361/202451521
- Sharma et al. (2021a) Sharma, S., Hayden, M. R., & Bland-Hawthorn, J. 2021a, MNRAS, 507, 5882, doi: 10.1093/mnras/stab2015
- Sharma et al. (2021b) Sharma, S., Hayden, M. R., Bland-Hawthorn, J., et al. 2021b, MNRAS, 506, 1761, doi: 10.1093/mnras/stab1086
- Solway et al. (2012) Solway, M., Sellwood, J. A., & Schönrich, R. 2012, MNRAS, 422, 1363, doi: 10.1111/j.1365-2966.2012.20712.x
- Sormani et al. (2022) Sormani, M. C., Gerhard, O., Portail, M., Vasiliev, E., & Clarke, J. 2022, MNRAS, 514, L1, doi: 10.1093/mnrasl/slac046
- Vasiliev (2019) Vasiliev, E. 2019, MNRAS, 482, 1525, doi: 10.1093/mnras/sty2672
- Virtanen et al. (2020) Virtanen, P., Gommers, R., Oliphant, T. E., et al. 2020, Nature Methods, 17, 261, doi: 10.1038/s41592-019-0686-2
- Wang et al. (2022) Wang, C., Huang, Y., Yuan, H., et al. 2022, ApJS, 259, 51, doi: 10.3847/1538-4365/ac4df7
- Wang et al. (2015) Wang, L., Dutton, A. A., Stinson, G. S., et al. 2015, MNRAS, 454, 83, doi: 10.1093/mnras/stv1937
- Weinberg & Katz (2007) Weinberg, M. D., & Katz, N. 2007, MNRAS, 375, 460, doi: 10.1111/j.1365-2966.2006.11307.x
- Xiang & Rix (2022) Xiang, M., & Rix, H.-W. 2022, Nature, 603, 599, doi: 10.1038/s41586-022-04496-5
- Xiang et al. (2019) Xiang, M., Ting, Y.-S., Rix, H.-W., et al. 2019, ApJS, 245, 34, doi: 10.3847/1538-4365/ab5364
- Yu et al. (2021) Yu, Z., Li, J., Chen, B., et al. 2021, ApJ, 912, 106, doi: 10.3847/1538-4357/abf098
- Yuan et al. (2024) Yuan, Z., Li, C., Martin, N. F., et al. 2024, A&A, 691, L1, doi: 10.1051/0004-6361/202348593
- Zhang et al. (2024a) Zhang, H., Ardern-Arentsen, A., & Belokurov, V. 2024a, MNRAS, 533, 889, doi: 10.1093/mnras/stae1887
- Zhang et al. (2024b) Zhang, H., Belokurov, V., Evans, N. W., Kane, S. G., & Sanders, J. L. 2024b, MNRAS, 533, 3395, doi: 10.1093/mnras/stae2023
- Zhang et al. (2024c) Zhang, H., Belokurov, V., Evans, N. W., et al. 2024c, MNRAS, 535, 2873, doi: 10.1093/mnras/stae2546
- Zhang et al. (2021) Zhang, H., Chen, Y., & Zhao, G. 2021, ApJ, 919, 52, doi: 10.3847/1538-4357/ac0e92