Search for a diffuse flux of photons with energies above tens of PeV at the Pierre Auger Observatory
Abstract
Diffuse photons of energy above 0.1 PeV, produced through the interactions between cosmic rays and either interstellar matter or background radiation fields, are powerful tracers of the distribution of cosmic rays in the Galaxy. Furthermore, the measurement of a diffuse photon flux would be an important probe to test models of super-heavy dark matter decaying into gamma-rays. In this work, we search for a diffuse photon flux in the energy range between 50 PeV and 200 PeV using data from the Pierre Auger Observatory. For the first time, we combine the air-shower measurements from a 2 km2 surface array consisting of water-Cherenkov surface detectors, spaced at 433 m, with the muon measurements from an array of buried scintillators placed in the same area. Using 15 months of data, collected while the array was still under construction, we derive upper limits to the integral photon flux ranging from to km-2 sr-1 yr-1 above tens of PeV. We extend the Pierre Auger Observatory photon search program towards lower energies, covering more than three decades of cosmic-ray energy. This work lays the foundation for future diffuse photon searches: with the data from the next 10 years of operation of the Observatory, this limit is expected to improve by a factor of .
1 Introduction
The origin and acceleration of very-high-energy (VHE, ) cosmic rays can be investigated through the detection of photons produced by the interaction between cosmic rays and surrounding matter near their sources [1, 2, 3]. Photons with energies between eV and eV interact with background radiation fields, limiting their travel to at most a few megaparsecs (Mpc) [4], making them ideal probes for studying sources within our Galaxy and its vicinity. Recent observations have identified primary photons from Galactic sources with energies reaching up to eV [5, 6].
In addition to astrophysical sources, cosmogenic photons are expected to arise from interactions between cosmic rays and the cosmic microwave background, as well as the extragalactic background light, in intergalactic space [7, 8, 9]. Light particles have higher interaction cross-sections with these fields, leading to more frequent production of secondary photons than occurs with heavier nuclei [10]. Recent studies using the data acquired by the Large High Altitude Air Shower Observatory (LHAASO) suggest that the average cosmic-ray mass is heavier than helium at around eV with an increasing trend towards heavier elements up to about eV [11], after which the composition either remains constant or becomes lighter [12, 13, 14, 15, 16, 17].
Another significant contribution to the diffuse photon flux comes from the interactions between VHE cosmic rays and Galactic disk matter [18, 19]. Similar to fluxes from cosmic-ray propagation through radiation fields, this component depends on the flux and composition of the primary cosmic rays, as well as the distribution of the gas in the Galactic disk, and the interaction cross-sections. This flux diminishes as and may become the dominant component of the total cosmogenic photon flux below eV, though it remains four to five orders of magnitude lower than the energy-integrated cosmic-ray flux. Measurements from LHAASO provide further insight into the diffuse gamma-ray emissions from the Galactic plane, spanning energies between eV and eV. These measurements indicate that the gamma-ray flux is three times higher than predictions based on local cosmic-ray interactions with Galactic matter, particularly in the inner Galactic plane [20]. These results suggest additional emission sources or spatial variations in cosmic-ray fluxes, pointing to a more complex picture of gamma-ray production in the Milky Way. Upper limits on the diffuse photon flux between eV and eV have been set from the Northern Hemisphere using experimental facilities, including KASCADE-Grande [21], EAS-MSU [22] and CASA-MIA [23], while a diffuse search towards the Galactic plane has been performed with data measured by IceTop at eV [24].
The diffuse photon flux can also be used to constrain the lifetime of super-heavy dark matter (SHDM) within the Galactic center. The decay of SDHM may contribute to the diffuse photon flux above a few eV [25, 26, 27]. Since photons generated in the Galactic center are not significantly attenuated owing to the source proximity, they provide a prime signal for probing gamma-ray production across various SHDM decay channels [28, 29].
The searches for photons at ultra-high energies (UHE, ) are performed by measuring extensive air showers, i.e., cascades of secondary particles produced in the atmosphere. The main challenge in these searches is distinguishing primary photons from the overwhelming background of charged cosmic rays. The separation is based on air-shower properties: showers initiated by photon primaries develop almost entirely through electromagnetic processes, while those initiated by hadrons contain a much larger number of muons [30, 31, 32]. Due to the smaller multiplicity of electromagnetic compared to hadronic interactions, the atmospheric depth of maximum shower development, , is expected to be deeper for a photon than for a hadronic primary. Also, taking into account the muonic component, this leads to a flatter lateral spread of the shower for hadronic cosmic rays compared with primary photons. These distinctive characteristics of photon showers are used to discriminate them from hadronic showers.
The Pierre Auger Observatory [33] integrates multiple detection techniques to extract information from air showers reaching the ground using a surface detector (SD) and from the measurement of the light emitted by air showers using a fluorescence detector (FD). The Pierre Auger Collaboration, combining SD and FD measurements, has set the most stringent upper limits on the integral photon flux at energies above eV [34, 35, 36]. These analyses rely either on the rise-time and the integrated signal measured by water-Cherenkov detectors (WCDs) within the SD stations [33], the slope of the lateral signal fall-off, the indirect muon number estimation, or the measurement of the fluorescence radiation produced during the air-shower development.
In this study, we extend the search for primary photons done at the Auger Observatory towards lower energies, reaching down to eV. The extension is made possible by a dense array of WCDs deployed over 2 km2 and the direct measurements of the air-shower muonic component by an array of buried scintillators deployed in the same region, as discussed in Section˜2. The Monte Carlo-driven reconstruction of photon-initiated events and the definition of a unique energy scale to treat both photon and hadronic events are presented in Section˜3. The photon-hadron discrimination is performed using an observable, , defined as the event-wise weighted sum of the muon density measurements. The power of this photon-hadron discriminator is presented in-depth in Section˜4. The selection criteria considered in data are described in Section˜5. The results of the photon search are presented in Section˜6.
2 Detection systems and data
The surface detector of the Pierre Auger Observatory consists of three regular detector grids, spaced by 1500 m, 750 m and 433 m, each designed to probe different regions of the cosmic-ray energy spectrum. Among these, the SD-433 [37, 38] is used in this study and comprises of WCDs arranged in seven regular hexagons, covering an area of 2 km2. Each WCD operates independently, calibrated using atmospheric particles, with signals measured in units of vertical equivalent muons (VEM) [39]. A more detailed description can be found in [33, 40].
The SD triggering system starts with low-level triggers from individual WCDs, progressing to the high-level trigger (T5). This trigger is used to select events where the station with the highest signal is surrounded by five (5T5) or six (6T5) active stations present in the ring of nearest neighbors. It ensures an accurate reconstruction of the impact point on the ground and reduces the calculation of the exposure to purely geometrical arguments [41].
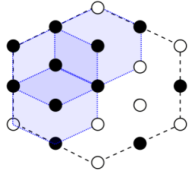
In the configuration used in this work, eleven stations of the SD-433 array are co-located with stations of the Underground Muon Detector (UMD), as illustrated in Fig.˜1, left. Each UMD station consists of three modules, each containing plastic scintillator bars measuring 400 cm in length, 4 cm in width and 1 cm in thickness providing a sensitive area of 10 m2 [42, 43]. The central station on the array’s western edge contains six modules, providing a sensitive area of 50 m2, compared to the standard 30 m2 area in all other stations. All modules are buried under 2.3 m of soil equivalent to a vertical shielding of 540 g/cm2, that filters out most of the particles produced in the air except muons with kinetic energies 1 GeV. When a charged particle passes through the module, the scintillation material emits photons that are collected by a 1.2 mm wavelength-shifter optical fiber and conducted to an array of silicon photomultipliers (SiPMs) Hamamatsu S13081-050CS [44]. Front-end electronics convert the analog pulses of each SiPM into binary signals, effectively translating the current pulses into a sequence of digital boolean samples. These output signals are sampled by a Field-Programmable Gate Array at 320 MHz, corresponding to a sampling interval of 3.125 ns, resulting in a binary trace of bits stored in the front-end memory. The back-end electronics handles all calibration, control, and monitoring tasks [45]. Additionally, the surface electronics, common to all UMD station modules, interfaces with the SD electronics to check for a trigger and retrieve and transfer the binary traces upon an event data request.
The highly segmented UMD modules are designed to count individual muons when triggered by the associated SD station. The counting procedure, performed on the binary traces, has been optimized to provide an unbiased estimate of the number of muons reaching a module. Specifically, muons are identified along the traces as a compact pattern of four consecutive “1” samples. Upon a successful match, an inhibition time window of samples is activated, preventing additional muon counts within this period [46, 47]. The estimated muon density is defined as the number of muons over the projected area of a module to account for the decrease of its sensitive area with the air-shower zenith angle.
To reconstruct the incoming direction of the primary particle and the lateral distribution function (LDF) [48] of the air showers we use the signals from the WCDs. The LDF is described by the Nishimura-Kamata-Greisen (NKG) function [49, 50] from which we extract the shower size, , defined as the value at an optimal distance, . For an array spacing of 433 m, is chosen as 250 m to minimize the uncertainties of the signal due to the imperfect knowledge of the functional form of the LDF in individual events [51]. The shower size, , corrected for the attenuation in the atmosphere serves as an observable that can be calibrated against the primary energy. Although for most events detected with SD-433 (hadronic showers) a data-driven energy calibration is employed [38, 52], the energy calibration for photon events is instead performed using detailed Monte Carlo simulations, as discussed in Section˜3.
The photon search strategy designed for this work relies on the SD-433 data to measure the air showers, providing information on the primary energy and shower geometry, and on the direct measurement of the air-shower muon content, as recorded by the UMD stations. To ensure a sufficient sampling of the air-shower muon content, leading to a suitable discrimination power as discussed in Section˜5, we select events acquired by the three highlighted hexagons of Fig.˜1, left. The data for this analysis were recorded from December 17, 2020, when the central UMD stations in the three employed hexagons were commissioned, to March 31, 2022, before the upgrade of the stations with new electronics [53].
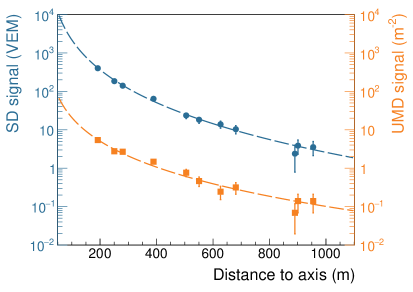
The flux of events acquired by the SD hexagons is expected to remain constant, apart from a negligible seasonal modulation. As the number of detected events follows Poisson statistics, identifying unstable periods in the data acquisition of the SD-433 involves searching for time intervals between consecutive events incompatible with the Poisson expectation111For example, consecutive events separated more than 1.1 hours when the seven hexagons of the array are operative are not compatible with a Poisson probability at a confidence level and hence identified as an unstable period.. The same methodology is employed for the UMD modules, based on the rate of 6T5 events acquired by the SD-433 during which a UMD module is registered as active. Unstable periods for each UMD module are identified by analyzing the time intervals between consecutive appearances in the data. After subtracting unstable periods for both detection systems based on the arrival time of 6T5 events, the final data set is composed of 5T5 and 6T5 events recorded during , equivalent to of data acquisition with the three hexagons operating under ideal conditions. The final data set is composed of 15,919 events with energies above eV and zenith angles up to . The energy threshold is derived with the Monte Carlo study presented in Section˜3.4, while the zenith angle range is discussed in Section˜3.1. One of these events is shown in Fig.˜1, right, where the LDF and energy calibration have been performed using the reconstruction used for the bulk of SD-433 events [38].
3 Energy assignment of photon and proton events
Unlike hadronic-initiated air showers [54], a data-driven energy calibration for photons is impractical because no photons have yet been detected above a few eV. Furthermore, given the depleted muon content in photon-initiated showers, a data-driven energy calibration would overestimate the photon energy because the SD is sensitive to muons. Stated otherwise, a photon and a hadronic primary of the same energy do not generate the same average signal in the WCDs. Consequently, simulated air showers with a sufficiently large probability to generate an event in the SD array are selected in Section˜3.1 before being employed to derive a dedicated energy calibration for photon-initiated events222The bias introduced by the muon deficit in hadronic models is not expected to significantly affect an energy calibration based on photon-initiated events given the minimal muonic content in such showers., as described in Section˜3.2.
The discrimination method is designed using protons as the only hadronic species, because proton-initiated air showers have a muon content most similar to photon-initiated showers among the hadronic primaries present in the cosmic-ray flux. The energy of simulated proton events is underestimated when employing a data-driven energy calibration, since current high-energy hadronic interaction models appear to underestimate the number of muons produced in air showers [42, 55]. Therefore, a Monte Carlo-based energy assignment is developed in Section˜3.3. This approach provides the most conservative background estimation, as discussed in Section˜4.
Because the nature of the primary cosmic rays is unknown in the data, one cannot apply separate energy calibrations for hadron- and photon-initiated showers. A unified energy scale is thus essential for accurately comparing events initiated by different primary species. To tackle this problem, the photon-equivalent energy scale is developed in Section˜3.4.
3.1 Trigger efficiency of photon and proton primaries
The probability of a shower to trigger the array depends on the characteristics of the primary particle. We quantify this probability, the trigger efficiency, using air-shower simulations. The simulation library covers an energy range between and , which follows an distribution and zenith angles uniformly distributed in up to 60 ∘. It contains 15,000 air showers for each primary, produced using CORSIKA v7.6400 [56] with EPOS-LHC [57] and Fluka2011.2x [58] as the high- and low-energy hadronic interaction models. The transition energy between these two regimes is set at 80 GeV. To manage the computational load, we employ a thinning algorithm as outlined in [59] with a thinning threshold of . Subsequently, the particle distributions at ground level are unthinned at the stage of the detector simulation as described in [60]. Each air-shower core is randomly positioned ten times around the central station of the array and the detector response is simulated using the Auger framework [61, 62].
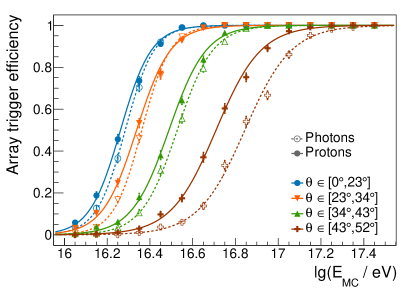
Figure˜2 depicts the trigger efficiency for the simulated photon and proton events. Air showers initiated by hadronic primaries, such as protons, reach the ground with a significantly more prominent muonic component than those initiated by photon primaries due to the decay of charged pions and kaons produced during hadronic interactions in the atmosphere. This increased muonic content is crucial for trigger generation, especially as the zenith angle increases and atmospheric attenuation of the electromagnetic particles becomes more significant. The trigger efficiency for proton-initiated air showers is thus consistently higher than that for photon events, with the difference becoming more pronounced at larger zenith angles.
A sigmoid model, represented by solid lines, describes the trigger efficiency based on the simulated energy, , and zenith angle, , with parameters estimated using a maximum likelihood method. Events generated by air showers with an expected trigger efficiency greater than and a zenith angle smaller than 52 ∘ are selected for the Monte Carlo-driven analyses throughout this article since the trigger efficiency for photon showers with more inclined directions is negligible. Around 59,000 (64,000) photon (proton) events survive the selection cuts, representing nearly of the total simulated events.
3.2 Photon-initiated events
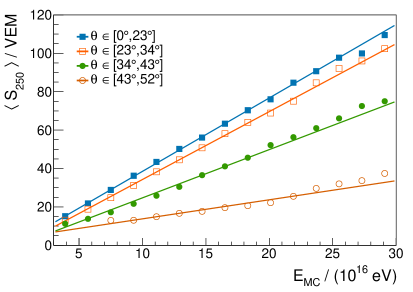
As described in Section˜2, the primary energy is calibrated using the signal interpolated at 250 m from the shower axis, . This value is determined by evaluating a parametrized LDF fitted to best match the observed signals in each triggered SD station. To achieve an accurate estimate of , the slope parameter of the LDF is parametrized as detailed in Appendix˜A. We utilize only one of the ten realizations of simulated events produced for each air shower to account for shower-to-shower fluctuations in the energy calibration. A power-law model is used to describe the relationship between and [63]:
| (3.1) |
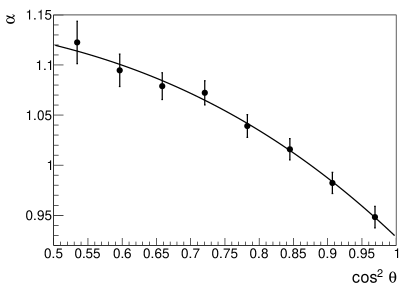
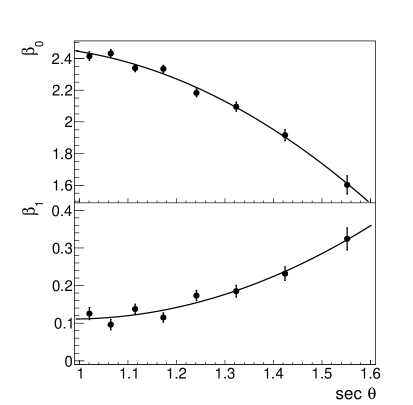
The power-law index, , is found for the subset of events in each of eight zenith-angle bins employing a minimization. As shown in Fig.˜3, left, is mildly dependent on the zenith angle with a relationship that can be modeled as:
| (3.2) |
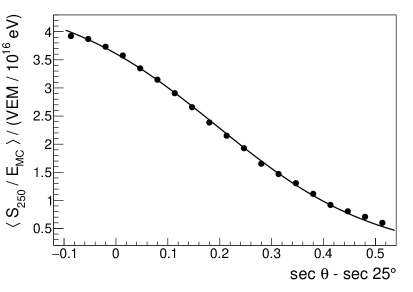
The three free parameters are listed in Table˜1. The power-law index is slightly below unity for vertical events due to the higher likelihood of these showers arriving at the observation level before reaching their maximum development, especially at the highest energies, compared to non-vertical events. The ratio decreases with the zenith angle, as shown in Fig.˜3, right, reflecting the atmospheric attenuation of electromagnetic air showers. Based on the universality of the electromagnetic longitudinal development, the signal-to-energy ratio can be described using a Gaisser-Hillas function [64]:
| (3.3) |
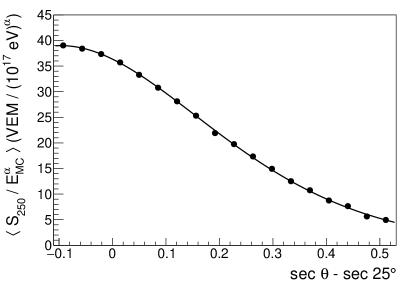
The free parameters, listed in Table˜1, are estimated via a minimization to the average ratio. Particularly, the parameter represents the expected signal measured by the SD-433 at 250 m from the axis of a shower initiated by a photon primary of eV with a zenith angle of 25 ∘.
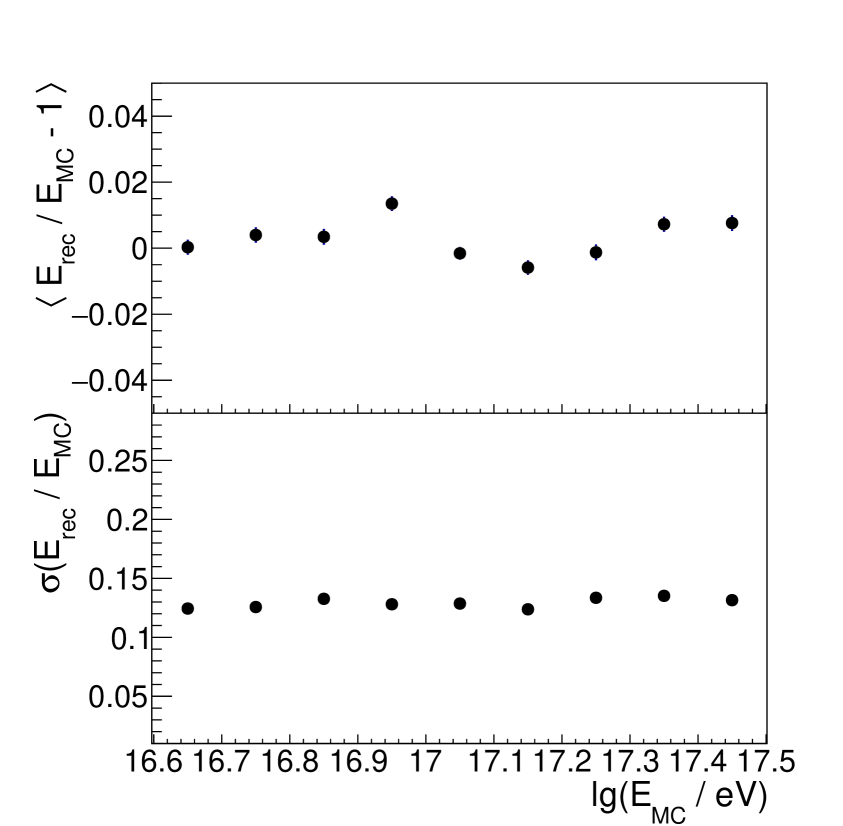
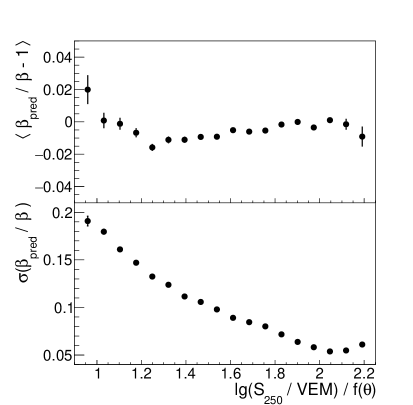
The calibration performance is evaluated by examining the relative difference between the reconstructed energy, , and the simulated energy, . This method reconstructs the photon energy with a bias of less than , as shown in Fig.˜4, top. The resolution of the calibration is defined as the standard deviation of the distribution of the relative difference between and . As shown in Fig.˜4, bottom, the zenith-integrated resolution remains nearly constant at around .
3.3 Proton-initiated events
This subsection details the energy assignment of simulated proton events, focusing on the relationship between and . As discussed above in the context of photon events, a single realization per air shower is used to properly account for shower-to-shower fluctuations. The LDF slope parametrized for the bulk of the SD-433 data [38] is utilized for the simulated proton events since it is suitable to describe hadronic-initiated events. A power-law is used to describe the correlation between and
| (3.4) |
in analogy with Eq.˜3.1. The attenuation function model for proton events, inspired by recent analyses with the SD-433 data [37, 38], is
| (3.5) |
We select a reference zenith angle of 30 ∘, as it corresponds to the median zenith angle of the simulated proton events, ensuring a representative selection. A combined fit of the attenuation function, , and the power-law index, , to the is conducted. In this process, the likelihood of observing the samples of is maximized by tuning the mentioned free parameters assuming an underlying Gaussian probability density function describing the theoretical shower size. The standard deviation of the predicted shower size is taken as the uncertainty coming from the event reconstruction. The estimated values for the parameters involved in Eqs.˜3.4 and 3.5 are summarized in Table˜2.
| (VEM) | ||||
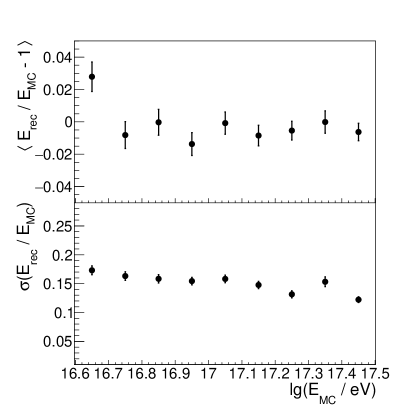
The bias and resolution provide insight into the reliability and precision of the calibration. As shown in the top panel of Fig.˜5, the reconstructed energy exhibits a bias below for energies above eV, while the resolution follows the expected trend with the primary energy, improving from to across the energy range under study, as presented in the bottom panel of Fig.˜5.
3.4 The photon-equivalent energy scale
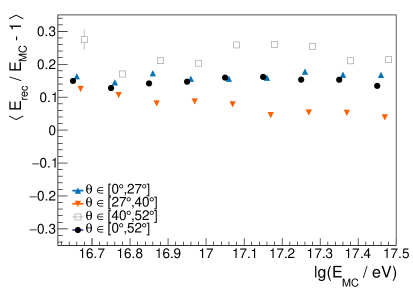
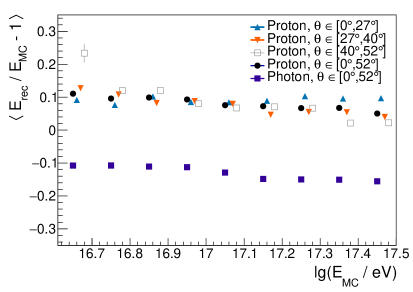
In the case of simulated proton events, the energy assignment tailored for photon primaries described in Section˜3.2 leads to a systematic overestimation of the reconstructed energy by , as shown by the black markers in Fig.˜6, left. This is due to the muonic component, larger in hadronic showers than in electromagnetic ones, in particular at 250 m from the shower axis. Furthermore, because proton and photon showers attenuate differently in the atmosphere, one can see in the figure a clear dispersion in the reconstructed energy across angular bins. To account for the different attenuation of hadron- and photon-initiated air showers, we define the photon-equivalent energy scale, . This scale is constructed using the attenuation curve derived from simulated proton events, i.e., from Eq.˜3.5, and the energy power-law index obtained for photon events, i.e., from Eq.˜3.1. Thus a reconstructed event with a shower size can be assigned an energy independently of the primary species and for both simulations and data.
The application of this energy scale to simulated proton events results in a bias of at decreasing to at the highest energies, as shown in Fig.˜6, right. Importantly, this bias shows no significant angular dependence, making a robust scale across different zenith angles. On the other hand, photon-initiated events, when analyzed using this scale, are assigned underestimated energies. The bias changes from to in the energy range of interest, as displayed in Fig.˜6, right. Consequently, in a given bin, simulated photon events are mixed with proton events that have true lower energies, and thus lower muon content. This mixing leads to a conservative estimation of the separation between hadron- and photon-initiated events based on the muon content that scales with the primary energy. Therefore, the discrimination method described in the next section is tailored and optimized in such a conservative scenario.
4 Discrimination between photon and proton events
The search for primary photons in the cosmic-ray flux is a classification problem of a tiny signal in the overwhelmingly dominant hadronic background. The muon density is a powerful observable for distinguishing between air showers dominated by the electromagnetic component and those with significant hadronic contributions. Using the simulated set described in Section˜3.1, we define in Section˜4.1 a muon-based observable that can be related to the mass of the primary cosmic ray. We optimize it to maximize the separation power between photon- and proton-initiated events in Section˜4.2, where the energy is assigned with the photon-equivalent energy scale, as discussed in Section˜3.4.
4.1 Muon content estimator,
For each event, the muon densities, , measured at various distances, , from the shower axis are combined to define the discrimination observable [65]:
| (4.1) |
Each measured muon density is normalized by the average muon density, , expected in proton-initiated events at a predefined reference distance, , and is parametrized in terms of the primary energy and zenith angle. This normalization serves a dual purpose in the discrimination method. First, it offers an initial estimate of the muon content, with hadronic-induced showers typically yielding positive values of and photon-initiated showers producing negative values. Second, by normalizing each muon density by , the energy and angular dependencies of are largely absorbed, while the composition-dependent scaling of the muon densities is preserved. The power-law index, , is selected to maximize the separation power of between photonic and hadronic events, as discussed in Section˜4.2.
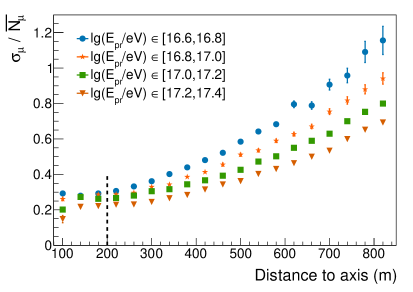
The reference distance, , is chosen to minimize fluctuations in the number of muons intersecting the sensitive area of a UMD station. The average number of muons, , decreases with the distance to the shower axis, following the lateral spread of the shower front. Conversely, the relative fluctuations, , increase with distance, as shown in Fig.˜7, left. These relative fluctuations are influenced by both the shower-to-shower and the Poissonian fluctuations sprouting from the decreasing number of impinging muons [66]. The relative fluctuations are estimated as the root-mean-square of the distributions in distance bins333At distances below 300 m, shower-to-shower fluctuations dominate in the energy range under study, exceeding the Poissonian fluctuations by a factor between and at distances between eV and eV.. A plateau in the relative fluctuations is observed up to m, mildly dependent on the primary energy and zenith angle. Consequently, we select a reference distance of , which corresponds to about statistical fluctuations in the number of muons with a minimal variation across the studied energy range.
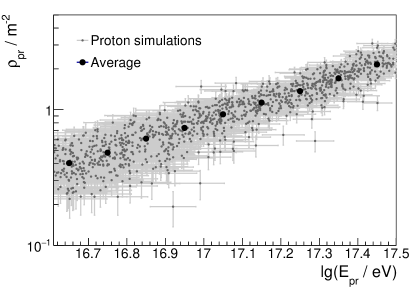
The normalization factor, , is then defined as the average of the muon density in proton-induced events at 200 m from the shower axis. It is parameterized in terms of the proton energy, , and zenith angle using the muon densities measured between m and m from the shower axis. The energy dependence of is illustrated in Fig.˜7, right, and can be described by:
| (4.2) |
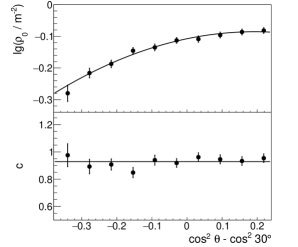
The estimated values of the free parameters, and , using events in different zenith angle intervals are depicted in Fig.˜8. The normalization, , decreases with the zenith angle, representing the atmospheric attenuation of the muon component. In contrast, the power-law index, , governs the energy-driven muon production and shows no significant angular dependence. A quadratic dependence on is proposed to describe , while is assumed to be a constant. These four free parameters are estimated using a maximum likelihood approach to the unbinned data and presented in Table˜3.
4.2 Optimization of
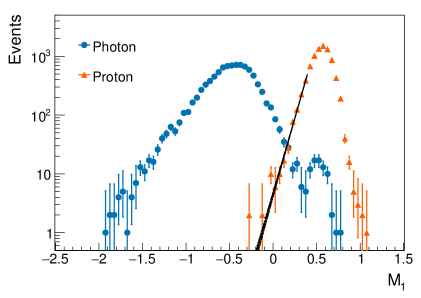
Because the number of muons on the ground decreases with increasing distance from the shower axis, the observed muon densities exhibit significant statistical uncertainties at large distances due to the finite detector size, independent of the primary particle. Therefore, is defined using the measurements taken with the “hottest” station (the one with the highest SD signal) and its six nearest neighbors, which together define the “hottest” hexagon of an event. An example of the distributions for photon- and proton-initiated events is displayed in Fig.˜9, left. While there is a clear separation between the two populations, a subset of muon-poor proton events is visible. These events generally correspond to showers with a dominant electromagnetic component, generated by the decay of leading produced in first interactions and carrying a substantial fraction of the primary cosmic-ray energy. Vice versa, a minor subset of photon showers with hadronic-like muon content is also observed. These events result from the decay of a leading , caused by a photonuclear interaction, which initiates a hadronic sub-shower early in the shower development.
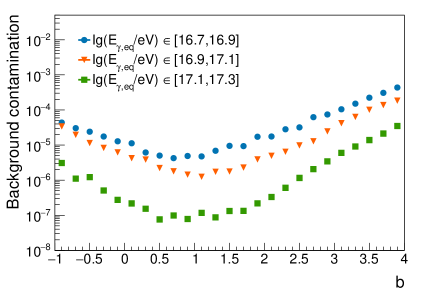
The choice of in Eq.˜4.1 aims to minimize the risk of misclassifying a background event as a photon event, while still ensuring a substantial probability of identifying photon events. The hadronic background is assumed purely of protons to provide a conservative estimation of the photon-hadron separation power, given the existence of a non-negligible contribution of primaries heavier than protons in the cosmic-ray flux [12, 14]. We define background contamination as the ratio of the number of proton events below a specified threshold to the total number of proton events. To estimate the former from the available statistics, the of the most photon-like proton events are fitted using an unbinned maximum likelihood procedure, assuming an exponential model (shown by the black line in Fig.˜9, left). Then the number of proton events below a given threshold is calculated from the integral of the fitted tail444This estimation of the background contamination does not depend on the size of the most photon-like background tail, i.e., it remains stable when considering between and of the proton events in the definition of the background tail, thus adding to the robustness of the method.. The signal efficiency, on the other hand, is defined as the ratio between the photon-initiated events having values of smaller than the threshold value and the total number of photon events.
As shown in Fig.˜9, right, the contamination is minimal for a range of values of around unity in the energy range of interest for a fixed signal efficiency of . It decreases with increasing energy due to the enhanced air-shower muon content. Therefore, is chosen as the index that minimizes the background contamination, defining the discrimination observable as .
The background contamination and signal efficiency can be computed by scanning over all possible values of the threshold, as exemplified in Fig.˜10. The contamination decreases with increasing primary energy, reflecting the increasing number of muons produced in hadronic air showers at higher energies. In addition, a larger signal efficiency can be reached at the expense of a larger background contamination.
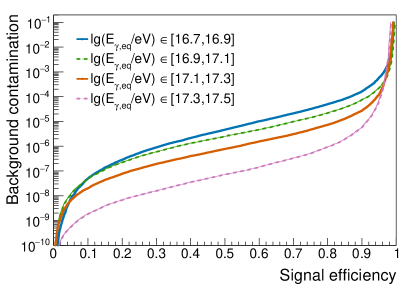
We note that the background contamination and signal efficiency shown in Fig.˜10 are obtained assuming a complete UMD hexagon, e.g., the north-west hexagon in Fig.˜1, left. We verified that the choice of remains effective even when considering missing UMD stations in the first ring of neighbors. However, the discrimination power, i.e. both the background contamination and signal efficiency, varies depending on the real configurations of the detector, as discussed in the next section.
5 Selection of photon events in data
In this section, we study the application of the discrimination method to data, considering the actual configuration of the detector. Given that the fraction of photon primaries expected to be present in the cosmic-ray flux may be well below , the standard event reconstruction, fine-tuned to hadronic events, is employed for the data. The event selection follows the procedure described in Section˜2. Both the estimated shower size and zenith angle are used to assign photon-equivalent energy to each event.
The observable quantifies the muon content of each event, as defined in Section˜4.2, and scales with the number of available UMD stations in the hottest hexagon. Air showers with low muon content, charactistic of photon-like events, would have smaller values of compared to hadronic events. However, if any UMD stations are missing, either due to not being deployed yet at the time of detection or to technical issues during data acquisition, less information on the muon content would be available. This results in smaller values of when fewer than seven UMD stations are operational, leading to an increase of the likelihood of misidentifying background events as photon-initiated. Thus, before applying the discrimination method to the selected data set, it is important to evaluate the impact of missing UMD modules across the seven stations of a hexagon.
Due to the irregular placement of UMD stations in the SD-433, as seen in Fig.˜1, left, the muon component arriving at the ground is sampled by a variable number of UMD stations. Therefore, the threshold value of to classify an event as a photon candidate, i.e., the photon candidate cut , is obtained according to the possible configurations in the hottest hexagon. The events are classified in six categories, as listed in Table˜4, depending on the following three criteria: the number of available UMD stations (i.e., stations with at least one active module), the total area spanned by these stations, and the relative position of any missing stations (i.e., stations without active modules). The hottest station must contain three active UMD modules regardless of the event category.
| Cat. |
|
|
|
|
||||||||
| I | 3,295 | |||||||||||
| II | 1,491 | |||||||||||
| III | non-NN | 8,417 | ||||||||||
| IV | NN | 298 | ||||||||||
| V | non-NN | 1,016 | ||||||||||
| VI | NN + non-NN | 1,402 | ||||||||||
| Total | 15,919 |
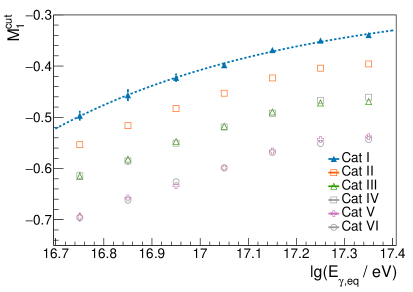
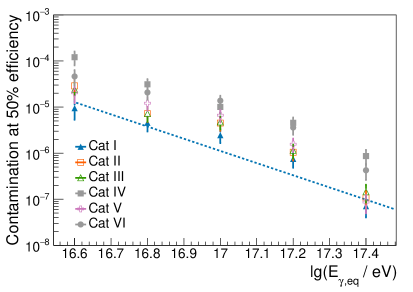
The discrimination power of a hexagonal grid that mimics the SD-433 is evaluated through simulations (see Section˜3.1), assuming each SD station is paired with a 30 m2 UMD station, except for the aforementioned 50 m2 station. UMD stations or individual modules are randomly masked to simulate missing measurements and assess the discrimination power for each event category. is defined as the threshold value at which the signal efficiency reaches , determined as the median of the distribution for simulated photon events in energy bins. Such signal efficiency is suitable to reach background contamination levels smaller than in all event categories. Therefore, an event is tagged as a photon candidate if . As shown in Fig.˜11, left, increases with primary energy and with the number of UMD stations in the hottest hexagon . The evolution of is described by a function of the logarithmic energy for each event category and reported in Appendix˜B. As depicted in Fig.˜11, right, the contamination remains below for events in category I, while it increases as the number of first-ring UMD stations decreases, with the relative position of missing UMD stations having a significant impact. For instance, the contamination in events with two missing neighboring stations is two to four times larger than in events with non-neighboring missing stations. The background contamination is modeled using an exponential function of logarithmic energy, as detailed in Appendix˜B.
The parameterization of the background contamination for each event category can be employed to obtain a conservative estimation of the number of hadronic events in data that would be misidentified as photon candidates. For instance, the expected number of fake photon events in the category I subset can be computed as by integrating the blue curve in Fig.˜11, right, above eV [68]. Since 3,295 events above eV fall in that event category, this is equivalent to one fake photon event approximately every 815,650 events555The expected number of fake photon events in the category IV and VI subsets, corresponding to the configurations with the largest background contamination, is and respectively. It can be translated to one fake photon event every 95,460 and 170,890 events in each of the subsets.. Considering that the category I events were acquired over of the observation time, this suggests that one fake photon event would be expected every 106 years per hexagon.
Given the low probability of observing a background event consistent with the photon hypothesis, a fraction of the selected data, referred to as the burnt data sample, is unblinded to check that the distribution in data agrees with simulations, before carrying on the unblinding of the full selected data set. The burnt data represent a fraction of the selected data set. The distributions of burnt data for each event category are compared with the simulated distributions, as exemplified in Fig.˜12. Simulated events are weighted by to obtain energy-integrated distributions, while no weighting is applied to the burnt data sample. As expected, the distribution for the burnt data is compatible with a hadronic origin. It is important to note that the photon-equivalent energy assigned to a data event is around higher than that assigned using the hadronic-optimized energy scale. This discrepancy arises from the larger muon content in cosmic-ray showers compared to the photon showers used to define the photon-equivalent energy calibration. As a result, the reference muon density used in the definition (see Eq.˜4.1) is shifted to higher values in data compared to simulations, leading to smaller values in the former case. Thus, the distribution for data is artificially shifted towards the simulated proton distribution. Nevertheless, the observable is optimized to discriminate between events with significantly different muonic components -such as photons versus all hadronic species- due to the logarithm scaling in its definition, making it largely insensitive to the primary hadronic mass. This limitation does not impact the search for photon events in data, as discussed in the next section.
6 Results of the photon search
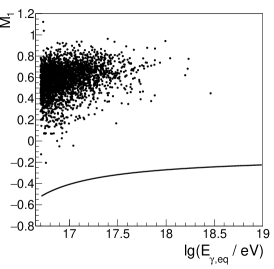
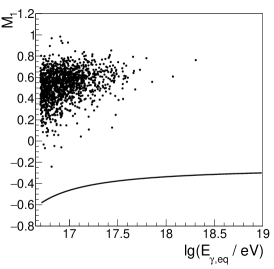
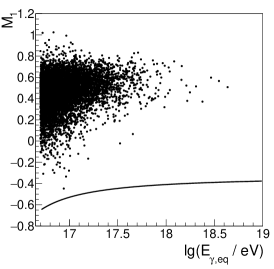
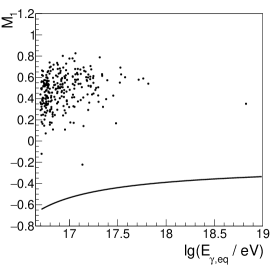
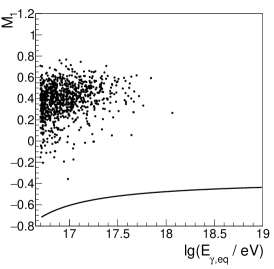
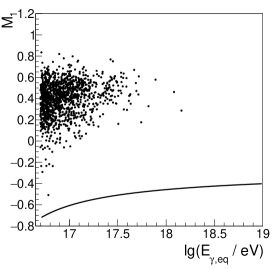
Excluding the burnt sample, the remaining events constitute the search data set. For each event, the observable is compared to the parametrized photon candidate cut for its respective event category, as shown in Fig.˜13. The parameterizations of , performed with simulated events up to eV, have been extrapolated to higher energies for comparison with the data. Nevertheless, all events exhibit values well above the parametrized , indicating that no photon candidate events are identified.
6.1 Upper limits calculation
From the absence of photon flux measurements, upper limits on the integral photon flux are calculated. These limits are inversely proportional to the exposure of the detection system, which accounts for both the operational uptime of the detectors and the efficiency in detecting photon events.
The accumulated exposure to photon primaries is derived from the continuous, real-time monitoring of the SD-433 array, as described in Section˜2. The operational status of each SD station is known every second, allowing stations to be classified as either “on” or “off”. This enables real-time monitoring of the status of each hexagon666Technical issues affecting eight out of the SD stations during distinctive periods (lasting between one day and one week) were identified, accounting for less than of the operation time. During these periods, the stations were considered “off”.. Following the 5T5 and 6T5 event selection criteria, a hexagon is considered active if at least five “on” WCDs are surrounding the hottest one. When a 6T5 condition is met, the effective area of a hexagon with a side length is the one of the unitary hexagon, i.e., . For the 5T5 condition, the area is reduced by a geometrical factor of to account for the missing nearest-neighbor station. Consequently, an active hexagon contributes to the exposure calculation with a time-dependent area, , reflecting its real-time status.
As discussed in Section˜5, a minimum area spanned by UMD modules is required to adequately sample the air-shower muon content. The number of “on” UMD modules at the central station and the first ring around it, as well as the relative position of any missing UMD stations in the first ring, are dynamic. They vary over time due to the absence of deployed modules or technical issues affecting normal operation. These requirements are mapped by a step function, , incorporated into the exposure calculation.
The trigger efficiency for photon-initiated showers, , must also be included in the exposure calculation. This efficiency depends on the primary energy and zenith angle, as discussed in Section˜3.2, and the instantaneous exposure decreases as the primary energy decreases.
The accumulated exposure to photon primaries is determined by integrating the effective area of each hexagon over the entire observation period, , above a given photon-equivalent energy, , and over the solid angle, , as:
| (6.1) |
The trigger efficiency can be integrated with a weight proportional to a spectrum, motivated by theoretical predictions of the diffuse galactic photon flux [19], top-down models [69] and previous photon searches by the Pierre Auger Collaboration [70].
The upper limit to the integral photon flux, , is calculated as:
| (6.2) |
where the numerator represents the upper limit to the number of photon-compatible events calculated using the Feldman-Cousins approach [67] given the null observation and a confidence level of . The exposure to photon primaries above given energy, , is reduced by a factor by construction and a factor , reflecting the average signal efficiency of the parameterizations across all event categories. Above threshold energies of , , and 200 PeV, the integrated exposure up to a zenith angle of 52 ∘ is , , and km2 sr yr, respectively, in which the dependence on the threshold energy comes in from the photon trigger efficiency model777The model for the trigger efficiency was computed in terms of . Thus, the energy bias between and , as explained in Section 3.4, was introduced before performing the integration.. An uncertainty of is assigned to the exposure rising from the uncertainty of the event rate per active SD-433 hexagon. The upper limits are computed under a conservative scenario, where the average exposure above each threshold energy is decreased by its uncertainty, resulting in integral upper limits of , , and km-2 sr-1 yr-1 above the mentioned threshold energies.
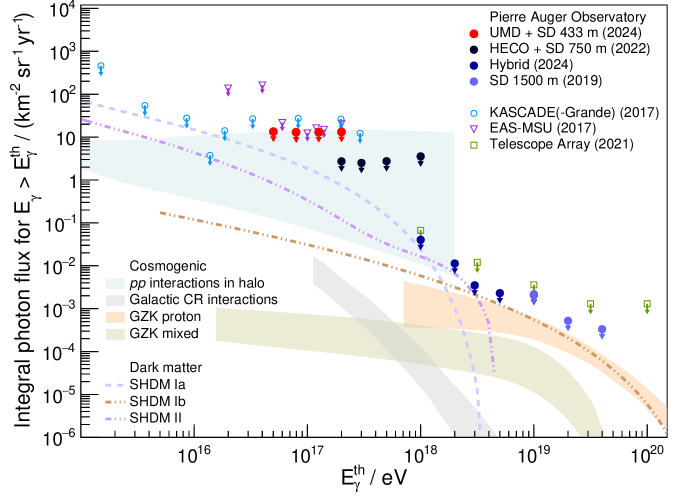
In Fig.˜14, we present the upper limits on the integral photon flux obtained in this study (represented by red markers), alongside the limits previously reported by the Auger Collaboration [71, 35], by KASCADE-Grande [21], by EAS-MSU [22], and by Telescope Array [72, 73]. The limits derived in this work are the only ones based on measurements from the Southern Hemisphere in the tens of PeV energy domain. This analysis extends the photon search program of Auger, covering over three decades of cosmic-ray energy. It is the first one in which direct measurements of air-shower muons provided by the UMD are employed.
Diffuse photon fluxes are expected from the interaction of UHE cosmic rays with background radiation fields [74, 8] and with the interstellar Galactic matter [75], as discussed in Section˜1. These are indicated by the shaded bands in Fig.˜14. The upper limits derived in this study are between two and three orders above these cosmogenic fluxes. However, the expected diffuse gamma-ray flux from proton-proton interactions in the galactic halo [76] is shown to be within the reach of the upper limits obtained in this work. Moreover, predictions from various phenomena beyond the Standard Model may emerge above these cosmogenic fluxes, e.g., those arising from the decay of super-heavy dark matter particles [26]. In the above-mentioned figure, we show the predicted diffuse fluxes in several scenarios: assuming decay channels into hadrons, a mass and a lifetime [77]; and [77]; and assuming decay into leptons, a mass and a lifetime [27]. Further sensitivity provided by the next 10 years of data taking will allow us to constrain the parameter space of the discussed models thanks to an expected improvement in the upper limits by a factor larger than .
6.2 Systematic uncertainties on the upper limits
Variations in the upper limits can arise from the energy bias related to the photon-equivalent energy scale, the exposure estimation and the changes in the number of photon candidate events.
The integral photon flux is a power law of the threshold energy , assuming an index . If the latter is adjusted to to account for a bias on the energy, , the relative effect on the integral flux, and hence on the upper limits, is:
| (6.3) |
Proton events are assigned an overestimated energy in the photon-equivalent scale, with an energy bias that decreases from to in the energy range of interest (see Fig.˜6, right). Following Eq.˜6.3, the effect of this bias on the upper limits ranges from to with increasing energy. Since this would imply a decrease in the upper limits, we neglect this effect to maintain a conservative calculation. Similarly, a negative energy bias between and , decreasing linearly with the logarithm of energy, is found for photon events in the photon-equivalent energy scale (see Fig.˜6, right). This bias leads to a relative increase of the upper limits, ranging from to with increasing energy.
The impact of variations in the spectral index assumed in the energy-integrated exposure calculation has been examined. A variation of in the spectral index results in an average change in the exposure of between and for the quoted threshold energies. Consequently, the upper limits on the integral flux increase by a factor ranging from to with increasing energy.
The number of photon candidate events can increase if the values of decrease. In the following, we discuss how varying the parameters in the definition might cause this effect. First, the measured muon density can decrease by up to when varying the parameters involved in the muon counting strategy used to convert digital traces to the number of muons in the UMD stations [46]. Second, the UMD simulation assumes a soil density of 2.38 g cm-3, leading to a fixed soil shielding to muons. The standard deviation of the soil density is 0.05 g cm-3 [78], which results in a increase in the reference muon density [42]. Lastly, different high-energy hadronic models predict varying numbers of muons in simulations, which could affect . The only model surpassing the employed one, EPOS-LHC, in terms of the predicted number of muons, is Sibyll2.3d by about [79]. Combining the three factors, the overall systematic effect translates into an absolute shift of across all values. Despite this shift, no event falls below the parametrized photon candidate cuts.
Following the conservative approach mentioned before, the upper limits above each threshold energy can be increased by the corresponding factors arising from the bias in the photon-equivalent energy and the spectral index employed in the exposure calculation. Thus, the final upper limits reported in this work, including a shift towards the worst-case scenario motivated by the considered systematic effects, are , , and km-2 sr-1 yr-1 for threshold energies of , , and 200 PeV. A summary of the upper limits before and after accounting for the systematic effects is presented in Table˜5. These limits translate into constraints on the photon fraction in the measured cosmic-ray flux [80]. Above the specified energy thresholds, the upper limits on the photon fraction are , , and at a confidence level .
| (PeV) | (km2 sr yr) | (km-2 sr-1 yr-1) | (km-2 sr-1 yr-1) |
7 Conclusions and outlook
The search for primary photons above 10 PeV has so far been conducted by experimental facilities exclusively located in the Northern Hemisphere, thereby presenting a restricted exposure towards the Galactic plane. This article presents the first search for a diffuse flux of primary photons above between and 200 PeV from the Southern Hemisphere. At these energies, primary photons may be expected from sources located not much further than the Galactic center. Leveraging the densest surface array and underground muon detectors of the Pierre Auger Observatory, we analyzed a high-quality data set comprising over 15,000 events above 50 PeV. The direct measurements of the air-shower high-energy muon component provided excellent photon-hadron separation power, resulting in a probability of incorrectly identifying a proton as a photon primary smaller than when the probability of observing a photon is set at , under the conservative assumption of a simulated pure proton background. Notably, no events consistent with a photon origin were found in our dataset.
Consequently, we established upper limits on the integral photon flux above to 200 PeV ranging from to km-2 sr-1 yr-1 at a confidence level. An average exposure of , equivalent to approximately eight months of ideal operation, conservatively reduced by one standard deviation, was employed for the computation of the upper limits. Furthermore, the reported limits were increased to account for systematic uncertainties based on the assumed spectral index of the diffuse photon flux and bias in the predicted photon energy due to the specific scale employed in this analysis.
Thanks to the addition of the surface and muon detectors spaced at 433 m, the search for primary photons can presently be conducted with data measured by the Auger Observatory spanning over three decades of cosmic-ray energy. The additional insights provided by the complementary detection techniques of the AugerPrime upgrade [81] will offer greater sensitivity in cosmic-ray mass composition studies. As the Observatory continues taking data, the exposure will progressively increase, leading to more stringent limits or possibly the discovery of the most energetic primary photons. Furthermore, the full deployment of UMD stations in the SD-433 array now enables the use of all seven hexagons in the array for photon searches. The expected exposure until the planned end of operations of the Auger Observatory will provide a significant opportunity to constrain the mass-lifetime phase-space for specific super-heavy dark matter models and to explore the expected photon flux from proton-proton interactions in the Galactic halo at tens of PeV. In addition to the search for a diffuse photon flux, this study lays the groundwork for a nearly real-time search for primary photons in the tens of PeV domain, enhancing the role of the Auger Observatory in the global multi-messenger astrophysics community.
Acknowledgments
The successful installation, commissioning, and operation of the Pierre Auger Observatory would not have been possible without the strong commitment and effort from the technical and administrative staff in Malargüe. We are very grateful to the following agencies and organizations for financial support:
Argentina – Comisión Nacional de Energía Atómica; Agencia Nacional de Promoción Científica y Tecnológica (ANPCyT); Consejo Nacional de Investigaciones Científicas y Técnicas (CONICET); Gobierno de la Provincia de Mendoza; Municipalidad de Malargüe; NDM Holdings and Valle Las Leñas; in gratitude for their continuing cooperation over land access; Australia – the Australian Research Council; Belgium – Fonds de la Recherche Scientifique (FNRS); Research Foundation Flanders (FWO), Marie Curie Action of the European Union Grant No. 101107047; Brazil – Conselho Nacional de Desenvolvimento Científico e Tecnológico (CNPq); Financiadora de Estudos e Projetos (FINEP); Fundação de Amparo à Pesquisa do Estado de Rio de Janeiro (FAPERJ); São Paulo Research Foundation (FAPESP) Grants No. 2019/10151-2, No. 2010/07359-6 and No. 1999/05404-3; Ministério da Ciência, Tecnologia, Inovações e Comunicações (MCTIC); Czech Republic – GACR 24-13049S, CAS LQ100102401, MEYS LM2023032, CZ.02.1.01/0.0/0.0/16_013/0001402, CZ.02.1.01/0.0/0.0/18_046/0016010 and CZ.02.1.01/0.0/0.0/17_049/0008422 and CZ.02.01.01/00/22_008/0004632; France – Centre de Calcul IN2P3/CNRS; Centre National de la Recherche Scientifique (CNRS); Conseil Régional Ile-de-France; Département Physique Nucléaire et Corpusculaire (PNC-IN2P3/CNRS); Département Sciences de l’Univers (SDU-INSU/CNRS); Institut Lagrange de Paris (ILP) Grant No. LABEX ANR-10-LABX-63 within the Investissements d’Avenir Programme Grant No. ANR-11-IDEX-0004-02; Germany – Bundesministerium für Bildung und Forschung (BMBF); Deutsche Forschungsgemeinschaft (DFG); Finanzministerium Baden-Württemberg; Helmholtz Alliance for Astroparticle Physics (HAP); Helmholtz-Gemeinschaft Deutscher Forschungszentren (HGF); Ministerium für Kultur und Wissenschaft des Landes Nordrhein-Westfalen; Ministerium für Wissenschaft, Forschung und Kunst des Landes Baden-Württemberg; Italy – Istituto Nazionale di Fisica Nucleare (INFN); Istituto Nazionale di Astrofisica (INAF); Ministero dell’Università e della Ricerca (MUR); CETEMPS Center of Excellence; Ministero degli Affari Esteri (MAE), ICSC Centro Nazionale di Ricerca in High Performance Computing, Big Data and Quantum Computing, funded by European Union NextGenerationEU, reference code CN_00000013; México – Consejo Nacional de Ciencia y Tecnología (CONACYT) No. 167733; Universidad Nacional Autónoma de México (UNAM); PAPIIT DGAPA-UNAM; The Netherlands – Ministry of Education, Culture and Science; Netherlands Organisation for Scientific Research (NWO); Dutch national e-infrastructure with the support of SURF Cooperative; Poland – Ministry of Education and Science, grants No. DIR/WK/2018/11 and 2022/WK/12; National Science Centre, grants No. 2016/22/M/ST9/00198, 2016/23/B/ST9/01635, 2020/39/B/ST9/01398, and 2022/45/B/ST9/02163; Portugal – Portuguese national funds and FEDER funds within Programa Operacional Factores de Competitividade through Fundação para a Ciência e a Tecnologia (COMPETE); Romania – Ministry of Research, Innovation and Digitization, CNCS-UEFISCDI, contract no. 30N/2023 under Romanian National Core Program LAPLAS VII, grant no. PN 23 21 01 02 and project number PN-III-P1-1.1-TE-2021-0924/TE57/2022, within PNCDI III; Slovenia – Slovenian Research Agency, grants P1-0031, P1-0385, I0-0033, N1-0111; Spain – Ministerio de Ciencia e Innovación/Agencia Estatal de Investigación (PID2019-105544GB-I00, PID2022-140510NB-I00 and RYC2019-027017-I), Xunta de Galicia (CIGUS Network of Research Centers, Consolidación 2021 GRC GI-2033, ED431C-2021/22 and ED431F-2022/15), Junta de Andalucía (SOMM17/6104/UGR and P18-FR-4314), and the European Union (Marie Sklodowska-Curie 101065027 and ERDF); USA – Department of Energy, Contracts No. DE-AC02-07CH11359, No. DE-FR02-04ER41300, No. DE-FG02-99ER41107 and No. DE-SC0011689; National Science Foundation, Grant No. 0450696, and NSF-2013199; The Grainger Foundation; Marie Curie-IRSES/EPLANET; European Particle Physics Latin American Network; and UNESCO.
References
- [1] G. Bhatta, Blazar Jets as Possible Sources of Ultra-High Energy Photons: A Short Review, Universe 8 (2022) 513 [astro-ph.HE/2209.13158].
- [2] M. Amenomori et al. [The TibetAS Coll.], First detection of photons with energy beyond TeV from an astrophysical source, Phys. Rev. Lett. 123 (2019) 051101 [astro-ph.HE/1906.05521].
- [3] Gopal-Krishna et al., Ultra-high energy cosmic rays from Centaurus A: Jet interaction with gaseous shells, Astrophys. J. Lett. 720 (2010) 2 [astro-ph.HE/1006.5022].
- [4] M. Settimo and M. De Domenico, Propagation of extragalactic photons at ultra-high energy with the EleCa code, Astropart. Phys. 62 (2015) 92-99 [astro-ph.HE/1311.6140].
- [5] Z. Cao et al. [The LHAASO Coll.], Ultrahigh-energy photons up to petaelectronvolts from -ray Galactic sources, Nature 594 (2021) 33-36.
- [6] A. U. Abeysekara et al. [The HAWC Coll.], HAWC observations of the acceleration of very-high-energy cosmic rays in the Cygnus Cocoon, Nat. Astron. 5 (2021) 465-471 [astro-ph.HE/2103.06820].
- [7] G. Gelmini, O. Kalashev and D. Semikoz, Upper Limit on the Diffuse Radio Background from GZK Photon Observation, Universe 8 (2022) 402 [astro-ph.HE/2206.00408].
- [8] A. Bobrikova et al., Predicting the UHE photon flux from GZK-interactions of hadronic cosmic rays using CRPropa 3, PoS Proc. Sci. 395 (2021) 449.
- [9] R. Alves Batista et al., Cosmogenic photon and neutrino fluxes in the Auger era, J. Cosmol. Astropart. Phys. 01 (2019) 002 [astro-ph.HE/1806.10879].
- [10] D. Hopper, A. Taylor and S. Sarkar, Cosmogenic photons as a test of ultra-high energy cosmic ray composition, Astropart. Phys. 34 (2011) 6 [astro-ph.HE/1007.1306].
- [11] Z. Cao et al. [The LHAASO Coll.], Measurements of All-Particle Energy Spectrum and Mean Logarithmic Mass of Cosmic Rays from to PeV with LHAASO-KM2A, Phys. Rev. Lett. 132 (2024) 131002 [astro-ph.HE/2403.10010].
- [12] A. Abdul Halim et al. [The Pierre Auger Coll.], Radio measurements of the depth of air-shower maximum at the Pierre Auger Observatory, Phys. Rev. D 109 (2024) 022002 [astro-ph.HE/2310.19966].
- [13] A. Abdul Halim et al. [The Pierre Auger Coll.], Demonstrating Agreement between Radio and Fluorescence Measurements of the Depth of Maximum of Extensive Air Showers at the Pierre Auger Observatory, Phys. Rev. Lett. 132 (2024) 021001 [astro-ph.HE/2310.19963].
- [14] A. Yushkov et al. [The Pierre Auger Coll.], Mass composition of cosmic rays with energies above eV from the hybrid data of the Pierre Auger Observatory, PoS Proc. Sci. 358 (2019) 482.
- [15] K. Fujita et al. [The Telescope Array Coll.], Cosmic ray mass composition measurement with the TALE hybrid detector, PoS Proc. Sci. 444 (2023) 401.
- [16] M. Plum et al. [The IceCube Coll.], Measurements of Cosmic Ray Mass Composition with the IceCube Neutrino Observatory, EPJ Web Conf. 283 (2023) 02007.
- [17] S. Knurenko and I. Petrov, Mass composition of cosmic rays above EeV by the Yakutsk array data, Adv. Space Res. 64 (2019) 12 [astro-ph.HE/1908.01508].
- [18] P. Lipari and S. Vernetto, Diffuse Galactic gamma-ray flux at very high energy, Phys. Rev. D 98 (2018) 043003 [astro-ph.HE/1804.10116].
- [19] C. Bérat et al., Diffuse Flux of Ultra-high-energy Photons from Cosmic-Ray Interactions in the Disk of the Galaxy and Implications for the Search for Decaying Super-heavy Dark Matter, Astrophys. J. 929 (2022) 55 [astro-ph.HE/2203.08751].
- [20] Z. Cao et al. [The LHAASO Coll.], Measurement of ultra-high-energy diffuse gamma-ray emission of the Galactic plane from TeV to PeV with LHAASO-KM2A, Phys. Rev. Lett. 131 (2023) 151001 [astro-ph.HE/2305.05372].
- [21] W. D. Apel et al. [The KASCADE-Grande Coll.], KASCADE-Grande Limits on the Isotropic Diffuse Gamma-Ray Flux between TeV and EeV, Astrophys. J. 848 (2017) 1 [astro-ph.HE/1710.02889].
- [22] Y. Formin et al. [The EAS-MSU Coll.], Constraints on the flux of eV cosmic photons from the EAS-MSU muon data, Phys. Rev. D 95 (2017) 123011 [astro-ph.HE/1702.08024].
- [23] M. C. Chantell et al. [The CASA-MIA Coll.], Limits on the Isotropic Diffuse Flux of Ultrahigh Energy Radiation, Phys. Rev. Lett. 79 (1997) 1805 [astro-ph/9705246].
- [24] M. G. Aartsen et al. [The IceCube Coll.], Search for PeV Gamma-Ray Emission from the Southern Hemisphere with Yr of Data from the IceCube Observatory, Astrophys. J. 891 (2020) 9 [astro-ph.HE/1908.09918].
- [25] P. Abreu et al. [The Pierre Auger Coll.], Cosmological implications of photon-flux upper limits at ultra-high energies in scenarios of Planckian-interacting massive particles for dark matter, Phys. Rev. D 107 (2023) 042002 [astro-ph.HE/2208.02353].
- [26] L. Anchordoqui et al., Hunting super-heavy dark matter with ultra-high energy photons, Astropart. Phys. 132 (2021) 102614 [hep-ph/2105.12895].
- [27] M. Kachelriess, O. Kalashev and M. Kuznetsov, Heavy decaying dark matter and IceCube high energy neutrinos, Phys. Rev. D 98 (2018) 083016 [astro-ph.HE/1805.04500].
- [28] R. Aloisio, S. Matarrese and A. V. Olinto, Super Heavy Dark Matter in light of BICEP2, Planck and Ultra High Energy Cosmic Rays Observations, J. Cosmol. Astropart. Phys. 08 (2015) 024 [astro-ph.HE/1504.01319].
- [29] M. Chianese et al., Constraints on heavy decaying dark matter with current gamma-ray measurements, J. Cosmol. Astropart. Phys. 11 (2021) 035 [hep-ph/2108.01678].
- [30] P. Grieder, Extensive Air Showers, Springer-Verlag Berlin Heidelberg (2010).
- [31] J. Blümer, R. Engel and J. R. Hörandel, Cosmic rays from the knee to the highest energies, Prog. Part. Nucl. Phys. 63 (2009) 2 [astro-ph.HE/0904.0725].
- [32] M. Risse and P. Homola, Search for ultra-high energy photons using air showers, Mod. Phys. Lett. A 22 (2007) 11 [astro-ph/0702632].
- [33] A. Aab et al. [The Pierre Auger Coll.], The Pierre Auger Cosmic Ray Observatory, Nucl. Instr. Meth. A 798 (2015) 172-213 [astro-ph.IM/1502.01323].
- [34] P. Abreu et al. [The Pierre Auger Coll.], A search for photons with energies above eV using hybrid data from the low-energy extensions of the Pierre Auger Observatory, Astrophys. J. 933 (2022) 125 [astro-ph.HE/2205.14864].
- [35] A. Abdul Halim et al. [The Pierre Auger Coll.], Search for photons above eV by simultaneously measuring the atmospheric depth and the muon content of air-showers at the Pierre Auger Observatory, Phys. Rev. D 110 (2024) 062005 [astro-ph.HE/2406.07439].
- [36] P. Abreu et al. [The Pierre Auger Coll.], Search for photons above eV with the surface detector of the Pierre Auger Observatory, J. Cosmol. Astropart. Phys. 05 (2023) 021 [astro-ph.HE/2209.05926].
- [37] G. Silli et al. [The Pierre Auger Coll.], Performance of the m surface array of the Pierre Auger Observatory, PoS Proc. Sci. 395 (2021) 224.
- [38] G. Brichetto et al. [The Pierre Auger Coll.], The second knee in the cosmic ray spectrum observed with the surface detector of the Pierre Auger Observatory, PoS Proc. Sci. 444 (2023) 398.
- [39] X. Bertou et al. [The Pierre Auger Coll.], Calibration of the surface array of the Pierre Auger Observatory, Nucl. Instr. Meth. A 568 (2006) 2 [astro-ph.HE/2102.01656].
- [40] I. Allekotte et al. [The Pierre Auger Coll.], The surface detector system of the Pierre Auger Observatory, Nucl. Instr. Meth. A 586 (2008) 3 [astro-ph/0712.2832].
- [41] J. Abraham et al. [The Pierre Auger Coll.], Trigger and aperture of the surface detector array of the Pierre Auger Observatory, Nucl. Instr. Meth. A 613 (2010) 1 [astro-ph.IM/1111.6764].
- [42] A. Aab et al. [The Pierre Auger Coll.], Direct measurement of the muonic content of extensive air showers between and eV at the Pierre Auger Observatory, Eur. Phys. J. C 80 (2020) 750.
- [43] A. Aab et al. [The Pierre Auger Coll.], Prototype muon detectors for the AMIGA component of the Pierre Auger Observatory, J. Instrum. 11 (2016) P02012 [physics.ins-det/1605.01625].
- [44] A. Aab et al. [The Pierre Auger Coll.], Muon counting using silicon photomultipliers in the AMIGA detector of the Pierre Auger Observatory, J. Instrum. 12 (2017) P03002.
- [45] A. Aab et al. [The Pierre Auger Coll.], Design and implementation of the AMIGA embedded system for data acquisition, J. Instrum. 16 (2021) T07008 [astro-ph.IM/2101.11747].
- [46] J. De Jesús et al. [The Pierre Auger Coll.], Status and Performance of the Underground Muon Detector of the Pierre Auger Observatory, PoS Proc. Sci. 444 (2023) 267.
- [47] A. M. Botti et al. [The Pierre Auger Coll.], Status and performance of the underground muon detector of the Pierre Auger Observatory, PoS Proc. Sci. 395 (2021) 233.
- [48] A. Aab et al. [The Pierre Auger Coll.], Reconstruction of events recorded with the surface detector of the Pierre Auger Observatory, J. Instrum. 15 (2020) P10021 [astro-ph.IM/2007.09035].
- [49] K. Kamata and J. Nishimura, The Lateral and the Angular Structure Functions of Electron Showers, Progr. Theor. Phys. Suppl. 6 (1958) 93-155.
- [50] K. Greisen, Progress in Cosmic Ray Physics, Science 125 (1957) 3243.
- [51] D. Newton, J. Knapp and A. A. Watson, The Optimum Distance at which to Determine the Size of a Giant Air Shower, Astropart. Phys. 26 (2007) 6 [astro-ph/0608118].
- [52] H. P. Dembinski et al., A likelihood method to cross-calibrate air-shower detectors, Astropart. Phys. 73 (2016) 44-51 [astro-ph.IM/1503.09027].
- [53] G. A. Anastasi et al. [The Pierre Auger Coll.], AugerPrime: The Pierre Auger Observatory upgrade, Nucl. Instr. Meth. A 1044 (2022) 167497.
- [54] P. Abreu et al. [The Pierre Auger Coll.], The Energy Spectrum of Cosmic Rays beyond the Turn-Down at eV as Measured with the Surface Detector of the Pierre Auger Observatory, Eur. Phys. J. C 81 (2021) 966 [astro-ph.HE/2109.13400].
- [55] L. Cazon et al. [The EAS-MSU, IceCube, KASCADE-Grande, NEVOD-DECOR, Pierre Auger, SUGAR, Telescope Array and Yakutsk Colls.], Working Group Report on the Combined Analysis of Muon Density Measurements from Eight Air Shower Experiments, PoS Proc. Sci. 358 (2019) 213.
- [56] D. Heck et al., CORSIKA: A Monte Carlo code to simulate extensive air showers, Forschungszentrum Karlsruhe Report 6019 (1998) .
- [57] T. Pierog et al., EPOS LHC: Test of collective hadronization with data measured at the CERN Large Hadron Collider, Phys. Rev. C 92 (2015) 034906.
- [58] F. Ballarini et al., The FLUKA code: an overview, J. Phys. Conf. Ser. 41 (2006) 151-160.
- [59] M. Kobal et al. [The Pierre Auger Coll.], A thinning method using weight limitation for air-shower simulations, Astropart. Phys. 15 (2001) 3.
- [60] P. Billoir, A sampling procedure to regenerate particles in a ground detector from a thinned air shower simulation output, Astropart. Phys. 30 (2008) 5.
- [61] E. Santos et al. [The Pierre Auger Coll.], Update on the Offline Framework for AugerPrime andproduction of reference simulation libraries using the VO Auger grid resources, PoS Proc. Sci. 444 (2023) 248.
- [62] S. Argiro et al., The offline software framework of the Pierre Auger Observatory, Nucl. Instr. Meth. A 580 (2007) 3 [astro-ph/0707.1652].
- [63] A. Aab et al. [The Pierre Auger Coll.], Measurement of the cosmic-ray energy spectrum above eV using the Pierre Auger Observatory, Phys. Rev. D 102 (2020) 062005 [astro-ph.HE/2008.06486].
- [64] T. K. Gaisser and A. M. Hillas, Reliability of the method of constant intensity cuts for reconstructing the average development of vertical showers, Int. Cosmic Ray Conf. 8 (1977) 353-357.
- [65] N. González et al., A muon-based observable for a photon search at PeV, Astropart. Phys. 114 (2020) 48-59.
- [66] V. Kizakke Covilakam, A. D. Supanitsky and D. Ravignani, Reconstruction of air shower muon lateral distribution functions using integrator and binary modes of underground muon detectors, Eur. Phys. J. C 83 (2023) 1157 [astro-ph.IM/2401.12015].
- [67] G. J. Feldman and R. D. Cousins, Unified approach to the classical statistical analysis of small signals, Phys. Rev. D 57 (1998) 3873 [physics.data-an/9711021].
- [68] N. González et al. [The Pierre Auger Coll.], Search for primary photons at tens of PeV with the Pierre Auger Observatory, PoS Proc. Sci. 444 (2023) 238.
- [69] R. Aloisio, V. Berezinsky and M. Kachelriess, Status of superheavy dark matter, Phys. Rev. D 74 (2006) 023516.
- [70] P. Abreu et al. [The Pierre Auger Coll.], Searches for Ultra-High-Energy Photons at the Pierre Auger Observatory, Universe 8 (2022) 11 [astro-ph.HE/2210.12959].
- [71] M. Niechciol et al. [The Pierre Auger Coll.], Latest results from the searches for ultra-high-energy photons and neutrinos at the Pierre Auger Observatory, PoS Proc. Sci. 444 (2023) 1488.
- [72] R. U. Abbasi et al. [The Telescope Array Coll.], Constraints on the diffuse photon flux with energies above eV using the surface detector of the Telescope Array experiment, Astropart. Phys. 110 (2019) 8-14 [astro-ph.HE/1811.03920].
- [73] O. E. Kalashev et al. [The Telescope Array Coll.], Telescope Array search for EeV photons, PoS Proc. Sci. 395 (2021) 864.
- [74] B. Sarkar et al., Ultra-High Energy Photon and Neutrino Fluxes in Realistic Astrophysical Scenarios, Int. Cosmic Ray Conf. 2 (2011) 1087.
- [75] J. M. Gonzalez et al. [The Pierre Auger Coll.], Combined fit to the spectrum and composition data measured by the Pierre Auger Observatory including magnetic horizon effects, PoS Proc. Sci. 444 (2023) 288.
- [76] O. E. Kalashev and S. V. Troitsky, IceCube astrophysical neutrinos without a spectral cutoff and -) eV cosmic gamma radiation, JETP Lett. 100 (2015) 761-765 [astro-ph.HE/1410.2600].
- [77] O. E. Kalashev and M. Kuznetsov, Constraining heavy decaying dark matter with the high energy gamma-ray limits, Phys. Rev. D 94 (2016) 063535 [astro-ph.HE/1606.07354].
- [78] B. Wundheiler, Rayos Cósmicos con Energías entre y eV, Univ. Buenos Aires PhD thesis (2013).
- [79] F. Riehn et al., Hadronic interaction model Sibyll 2.3d and extensive air showers, Phys. Rev. D 102 (2020) 063002 [hep-ph/1912.03300].
- [80] V. Novotny et al. [The Pierre Auger Coll.], Energy spectrum of cosmic rays measured using the Pierre Auger Observatory, PoS Proc. Sci. 395 (2021) 324.
- [81] C. Bérat et al. [The Pierre Auger Coll.], AugerPrime status and prospects, EPJ Web Conf. 283 (2023) 06001.
Appendix A Lateral distribution function for photon events
The analytical model for the LDF used is based on the Nishimura-Kamata-Greisen (NKG) function [49, 50]:
| (A.1) |
where in the case of SD-433 events. The slope parameter, , is parametrized a priori as follows:
| (A.2) |
using events with at least five triggered stations, none of which is saturated888A station is flagged as saturated when the digitized traces of the anode channel overflow., and between two and four stations located 100 m to 400 m from the shower axis. These criteria ensure that is obtained with at least two degrees of freedom in the event reconstruction and with topological coverage around 250 m, providing a solid lever arm for the LDF fit.
The function compensates for the dependence of on the zenith angle:
| (A.3) |
where the reference zenith angle, 25 ∘, is selected as the median of the -weighted zenith distribution. The three free parameters of are estimated by examining the approximately linear relationship between the and , as shown in Fig.˜A.1, left. Consequently, the ratio is mainly determined by the angular dependence, as depicted in Fig.˜A.1, right. The sigmoid function is fitted to the average ratio, resulting in parameters , and . This model captures the mean behavior within a margin.
The linear coefficients, and , depend quadratically on , as illustrated in Fig.˜A.2, left. The corresponding six parameters are estimated using an unbinned maximum likelihood method, assuming a Gaussian probability density function for . The resulting values are given in Eq.˜A.4. The performance of the parametrization is assessed by comparing the predicted slope from Eq.˜A.2, , with the reconstructed slope for each photon-initiated event, . The parametrization shows a negligible bias (within ) and a resolution better than as illustrated in Fig.˜A.2, right.
| (A.4) | ||||
Appendix B Parametrization of the background contamination and photon candidate cuts
The average background contamination at signal efficiency and the photon candidate cut were parametrized in terms of the photon-equivalent energy scale. As shown by the dashed line in both panels of Fig.˜11, the employed analytical models are:
| (B.1) |
| (B.2) |
The free parameters of both equations are given in Table˜A.1 for each event category.