Linking stellar populations to H II regions across nearby galaxies. II.
Infrared Reprocessed and UV Direct Radiation Pressure in H II Regions
Abstract
Radiation pressure is a key mechanism by which stellar feedback disrupts molecular clouds and drives H II region expansion. This includes direct radiation pressure exerted by UV photons on dust grains, pressure associated with photoionization, and infrared (IR) radiation pressure on grains due to dust-reprocessed IR photons. We present a new method that combines high resolution mid-IR luminosities from JWST-MIRI, optical attenuation and nebular line measurements from VLT-MUSE, and HST H-based region sizes to estimate the strength of radiation pressure in H II regions across 19 nearby star-forming galaxies. This is the most extensive and direct estimate of these terms beyond the Local Group to date. In the disks of galaxies, we find that the total reprocessed IR pressure is on average of the direct UV radiation pressure. This fraction rises to in galaxy centers. We expect reprocessed IR radiation pressure to dominate over UV radiation pressure in regions where . Radiation pressure due to H ionizations is lower than pressure on dust in our sample, but appears likely to dominate the radiation pressure budget in dwarf galaxies similar to the Small Magellanic Cloud. The contribution from all radiation pressure terms appears to be subdominant compared to thermal pressure from ionized gas, reinforcing the view that radiation pressure is most important in compact, heavily embedded, and young regions.
1 Introduction
Observations show that star formation is an inefficient process. Contrasting the typical volume density of a molecular cloud with the observed gas depletion time suggests that only a small fraction, , of the total molecular gas mass in galaxies is converted to stars per gravitational free-fall time (e.g., 2018UTOMO; 2022SUN; 2023SUN, in nearby galaxies). One popular explanation for this inefficiency is that stellar feedback disperses molecular clouds, thus regulating the rate of star formation (see e.g., 2016AGERTZ; 2022OSTRIKER). Here stellar feedback refers to the injection of energy and momentum into the ISM by young, massive stars. This feedback has multiple modes and shapes the ISM on multiple length and time scales (see recent reviews by 2016KLESSEN; 2023CHEVANCE; 2024SCHINNERER).
Recent results suggest a particularly important role for pre-supernova feedback in dispersing molecular clouds and regulating the star formation efficiency of molecular gas. This is supported by both simulations (e.g., 2002MATZNER; 2010MURRAY; 2012DALE; 2013DALE-winds; 2013AGERTZ; 2015SKINNER; 2016RASKUTTI-rp; 2017GATTO-wind-SN; 2017RAHNER; 2018KIM; 2020KANNAN; 2021JEFFRESON; 2021KIM; 2021LANCASTER-wind; 2022GRUDIC; 2023MENON-rp; 2024ANDERSSON) and observations (e.g., 2011MURRAY; 2018GRASHA; 2019GRASHA; 2019KRUIJSSEN; 2020CHEVANCE; 2021KIM-observ; 2021BARRERA-BALLESTEROSa; 2021BARRERA-BALLESTEROSb; 2022CHEVANCE; 2023BONNE; 2023KIM).
Given this importance, studies have examined the impact of different pre-supernova feedback mechanisms in driving the expansion of H II regions in the Galaxy (e.g., 2019RUGEL; 2019WATKINS; 2020BARNES; 2021OLIVIER), the Magellanic Clouds (e.g., 1996OEYa; 1996OEYb; 2011LOPEZ; 2014LOPEZ; 2016CHEVANCE; 2019LEE; 2019MCLEOD), and nearby galaxies (e.g., 2019KRUIJSSEN; 2020MCLEOD; 2021MCLEOD; 2021BARNES; 2022BARNES; 2022COSENS; 2022DELLABRUNA; 2023WATKINS; 2023EGOROV; 2023BLACKSTONE).
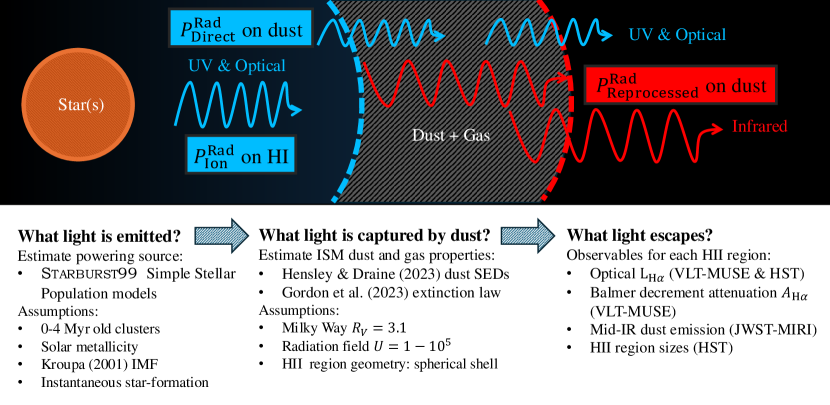
This paper focuses on one of the key modes of stellar feedback, radiation pressure, in H II regions, which is schematically illustrated in Fig. 1. Young, massive stars output most of their energy and momentum in far-UV (FUV) photons ( eV; 2019KRUMHOLZ). Most of these are captured by the surrounding ISM via photo-ionization, line absorption or scattering, and scattering or absorption by dust grains. Photons with energies eV can impart momentum to gas directly during photoionization. For lower energy photons, dust grains have larger scattering and absorption cross sections compared to gas. As a result, most optical–UV photons below the Lyman continuum limit interact with dust grains in metal-rich galaxies like the Milky Way. The momentum transfer of UV photons interacting with dust grains results in “direct” radiation pressure (1967MATHEWS; 2011DRAINE-rp), which also exerts a force on the gas which is dynamically coupled to dust under typical ISM conditions. This radiation pressure can help provide support against gravitational collapse, limit gas accretion onto massive stars, disperse molecular clouds, drive the expansion of H II regions, and even launch local outflows (e.g., 2001SCOVILLE; 2004GROVES; 2005DOPITA; 2006DOPITA; 2009KRUMHOLZ; 2010FALL; 2010MURRAY; 2010PETERS; 2011HOPKINS; 2014SHANE; 2016RASKUTTI-rp; 2018CROCKER-dirp; 2018KIM; 2021RATHJEN; 2023MENON-rp).
Dust re-emits energy from absorbed UV photons at infrared (IR) wavelengths. When absorbed, these “reprocessed” IR photons also deposit momentum into the ISM. In principle, in dusty regions, multiple absorptions can allow this reprocessed radiation pressure to even exceed the direct radiation pressure (e.g., 2005THOMPSON; 2010MURRAY; 2016KIM; 2018LEROY; 2021OLIVIER). Because reprocessed radiation pressure depends on the optical depth at IR wavelengths, it becomes more effective in regions with high gas column densities, for example during the early, obscured phase of star formation, in central molecular zones, or starburst galaxies (e.g., 1987WOLFIRE; 2005THOMPSON; 2010MURRAY; 2011ANDREWS; 2015SKINNER; 2018CROCKER; 2018LEROY; 2018REISSL; 2021RATHJEN; 2023MENON-rp; 2023BLACKSTONE)111Resonantly-scattered photons, especially Lyman-, can contribute analogously to the “reprocessed” term at low metallicity (e.g., 2018KIMM; 2023KAPOOR), but we study mostly massive, metal-rich targets where these photons get absorbed by dust before they have the chance to scatter repeatedly, and hence we do not consider this term here..
In practice, the importance of reprocessed radiation pressure to the disruption of molecular clouds and expansion of H II regions is debated (e.g., 2018REISSL; 2023MENON-rp) because the strength of radiation pressure has been difficult to estimate across a broad range of systems. This calculation requires resolving individual H II regions, which often have radii pc (1959SHARPLESS; 1960ROGERS; 2014ANDERSON) as well as estimating the dust opacity and UV, optical, and IR luminosities associated with each region. This requires good multiwavelength coverage at high physical resolution.
Here, we leverage multiwavelength, high resolution observations from the PHANGS surveys (Physics at High Angular resolution in Nearby Galaxies 2021LEROY; 2022EMSELLEM; 2022LEE; 2023LEE) to estimate the strength of this feedback term for 18,000 H II regions in 19 galaxies. We use new HST-based H II region size estimates (2022BARNES, R. Chandar, A Barnes et al. submitted; A. Barnes et al. in preparation), optical depth and luminosity estimates based on VLT/MUSE spectroscopy (2022EMSELLEM; 2023BELFIORE; 2023GROVES), and JWST-based IR luminosities. The ability of JWST-MIRI to measure the IR luminosity of individual regions for large samples of galaxies is particularly important. Previous IR telescopes have had poor angular resolution. For example, the resolution of Spitzer at m corresponds to pc at Mpc, making it almost impossible to even isolate individual H II regions outside the Local Group.
| Galaxy | R.A. | Dec. | res.aaPhysical resolution corresponding to the resolution of JWST-MIRI at F2100W at the distance to the galaxy. | SFR | |||
|---|---|---|---|---|---|---|---|
| deg | deg | deg | Mpc | pc | |||
| NGC0628 | 24.17 | 15.78 | 8.9 | 9.8 | 42.9 | 10.3 | 0.2 |
| NGC1087 | 41.60 | 0.50 | 42.9 | 15.9 | 69.1 | 9.9 | 0.1 |
| NGC1300 | 49.92 | 19.41 | 31.8 | 19.0 | 82.9 | 10.6 | 0.1 |
| NGC1365 | 53.40 | 36.14 | 55.4 | 19.6 | 85.3 | 11.0 | 1.2 |
| NGC1385 | 54.37 | 24.50 | 44.0 | 17.2 | 75.1 | 10.0 | 0.3 |
| NGC1433 | 55.51 | 47.22 | 28.6 | 18.6 | 81.3 | 10.9 | 0.1 |
| NGC1512 | 60.98 | 43.35 | 42.5 | 18.8 | 82.2 | 10.7 | 0.1 |
| NGC1566 | 65.00 | 54.94 | 29.5 | 17.7 | 77.2 | 10.8 | 0.7 |
| NGC1672 | 71.43 | 59.25 | 42.6 | 19.4 | 84.6 | 10.7 | 0.9 |
| NGC2835bbfootnotemark: | 139.47 | 22.35 | 41.3 | 12.2 | 53.4 | 10.0 | 0.1 |
| NGC3351 | 160.99 | 11.70 | 45.1 | 10.0 | 43.4 | 10.4 | 0.1 |
| NGC3627 | 170.06 | 12.99 | 57.3 | 11.3 | 49.1 | 10.8 | 0.6 |
| NGC4254 | 184.71 | 14.42 | 34.4 | 13.1 | 57.2 | 10.4 | 0.5 |
| NGC4303 | 185.48 | 4.47 | 23.5 | 17.0 | 74.1 | 10.5 | 0.7 |
| NGC4321 | 185.73 | 15.82 | 38.5 | 15.2 | 66.4 | 10.8 | 0.6 |
| NGC4535bbfootnotemark: | 188.58 | 8.20 | 44.7 | 15.8 | 68.8 | 10.5 | 0.3 |
| NGC5068ccDwarf galaxies that are atomic gas dominated, lower metallicity, with lower ISM pressure. | 199.73 | 21.04 | 35.7 | 5.2 | 22.6 | 9.4 | 0.6 |
| NGC7496 | 347.45 | 43.43 | 35.9 | 18.7 | 81.6 | 10.0 | 0.3 |
| IC5332ccDwarf galaxies that are atomic gas dominated, lower metallicity, with lower ISM pressure. | 353.61 | 36.10 | 26.9 | 9.0 | 39.3 | 9.7 | 0.4 |
HST H observations (R. Chandar, A. Barnes et al. submitted) still pending.
Note. — Central R.A., declination, and inclination from 2020LANG. Distances from 2021ANAND. Stellar masses and star-formation rates from 2021LEROY.
This work represents a natural next step and complement to studies of smaller samples of regions in the Milky Way (e.g., 2020BARNES; 2021OLIVIER), Magellanic Clouds (e.g., 2011LOPEZ; 2011PELLEGRINI; 2014LOPEZ), and the nearest galaxies (e.g., 2021MCLEOD; 2023BLACKSTONE). Our work also follows directly from 2021BARNES. They used PHANGS VLT/MUSE IFU mapping (2022EMSELLEM) to estimate the thermal gas pressure and direct radiation pressure for approximately the same set of regions that we study. Since then, A. Barnes et al. (in prep.) have produced HST-based region size estimates for many of these regions. As shown by 2022BARNES, the smaller sizes revealed by HST imply significantly higher radiation pressures than indicated by unresolved seeing-limited observations. The PHANGS-JWST survey (2023LEE) has also produced resolved mid-IR maps that yield luminosities for each individual region (e.g., 2023BELFIORE). This unlocks the ability to make the first robust estimates of all types of radiation pressure for a large sample of regions.
In §2, we introduce our multiwavelength dataset. In §3 we describe our method for calculating radiation pressures and present estimates of the reprocessed IR radiation pressure (§3.1), direct optical–UV radiation pressure on dust (§3.2), and direct radiation pressure on gas due to ionizing photons (§3.3). We then compare the radiation pressure components across different environments (§4). In §5, we discuss key sources of uncertainty and logical next steps. Section LABEL:sec:summary summarizes our key results.
2 Data and Methods
| Median | -weighted Median | Median | ||||||
|---|---|---|---|---|---|---|---|---|
| (1) | (2) | (3) | (4) | (5) | (6) | (7) | (8) | (9) |
| mag | mag | mag | 0.790 | 0.028 | 0.082 | 0.048 | 0.040 | 2.782 |
Note. — Balmer decrement based attenuation, in magnitudes from 2023GROVES for our targets sample of H II regions (§2.1). Columns report: (1) median and percentile range of treating all regions equally; (2) median and 16-84% range of weighting regions by ; (3) Corresponding median and range in V-band attenuation converting using the 2023GORDON extinction law; and (4)-(9) and multiplicative factors from G23 to convert between and attenuation at V-band, m, m, m, m, and our fiducial UV wavelength, nm. All conversions assume the Milky Way model. The corresponding optical depths can be derived as .
We estimate radiation pressures for H II regions in the 19 galaxies listed in Table 1. This sample represents the overlap of PHANGS-MUSE, PHANGS-JWST, and the HST H survey. The specific selection descends from the PHANGS–ALMA pilot study, but broadly the sample consists of massive spiral galaxies (stellar mass – , star formation rate 0.3 – 16.9 ) that lie on or near the main sequence of star-forming galaxies. The sample includes 17 barred galaxies and two lower-mass dwarf spirals.
We target H II regions defined by 2023GROVES based on VLT-MUSE spectral mapping. We also use the VLT-MUSE data to trace young stellar populations and estimate the local extinction. We estimate IR luminosities of regions from JWST-MIRI imaging. For 17 targets, we use high-resolution narrow-band HST H imaging to estimate region sizes. For H II without HST size measurements, we estimate sizes from H luminosities via a size-luminosity relation defined using HST data (A. Barnes et al. in prep.; see Appendix LABEL:sec:appendix:HST-to-MUSE-JWST-R-L-scaling).
2.1 PHANGS-MUSE and Nebular Catalogs
We target H II regions drawn from the PHANGS-MUSE nebular catalogs (2023GROVES, see also 2019KRECKEL; 2022SANTORO). In these catalogs, the footprints of individual H II regions are constructed by applying a modified version of HIIPHOT (2000THILKER) to the “convolved and optimized” PHANGS-MUSE H emission line maps (2022EMSELLEM). We use the Baldwin-Phillips-Terlevich (BPT; 1981BALDWIN) emission line diagnostics from 2023GROVES to select H II regions and remove contaminants such as AGN, planetary nebulae, or supernova remnants. This selection is not perfect, e.g., 35% of the supernova remnant candidates identified by 2024LI overlap BPT diagram-selected H II regions. But overall we expect the selection to work well, especially because H II regions represent the most numerous nebulae in our targets (e.g., out of our sample of 20,960 H II regions, only 3% overlap with SNR candidates).
For each H II region, the nebular catalog provides estimates of the extinction-corrected H luminosity, , and the H attenuation, , determined using the Balmer decrement method assuming a screen model and CCM89 extinction law (see also 2023BELFIORE, and note that we translate back to from the catalog-provided ). We use to infer the bolometric luminosity of the powering stellar population and to infer the dust attenuation in the IR and UV. Requiring reliable measurements yields a sample of 20,683 regions. Restricting our analysis to H II regions that have full JWST-MIRI coverage (i.e., excluding regions at the edge of MIRI mosaics), we arrive at a final sample of 17,615 H II regions.
In areas of high surface brightness, the H II region boundaries in the 2023GROVES catalog become unreliable and often blend smaller regions together. This inflates the size and luminosity of these regions. This is an issue in galactic centers, which in some galaxies contribute only a handful of H II regions despite containing a large fraction of the total H emission. By eye, many of the H II regions identified in galaxy centers indeed appear to be a blend of multiple sources. For example, in NGC 4303, the entire galaxy center is identified as two large H II regions, while in NGC 4535, the entire galaxy center is counted as a single H II region.
To address this, in galaxy centers we also calculate the radiation pressure for each individual pixel within H II regions (similar to 2011LOPEZ, spatial mapping of pressures in 30 Doradus). To do this, we use the PHANGS-MUSE maps of attenuation-corrected H intensity, , and maps of mid-IR emission. These “pixel-by-pixel” measurements would be appropriate in the case where each H II region has size approximately matched to that of our PSF, FWHM pc. However, this is still larger than the typical size of H II regions, even in the luminous star-forming regions in galaxy centers (e.g., 2023WHITMORE; 2023SCHINNERER; 2024SUN). We therefore expect that the size used in this calculation represents an upper limit on the true region size, and therefore our pixel-wise calculations yield lower limits on the pressures.
2.2 PHANGS-JWST
We use imaging data from the PHANGS-JWST Cycle-1 Treasury program (GO 2107, PI Lee; 2023LEE). We calculate the photometric intensities for each H II region in four JWST-MIRI filters: F770W, F1000W, F1130W, and F2100W, centered at 7.7, 10, 11.3, and 21 m. This combination of filters traces the emission from PAH complexes and the dust continuum, with F770W and F1130W more PAH-dominated (e.g., 2007SMITH), and F2100W more continuum-dominated (e.g., 2007DRAINELI). The nature of the m emission remains more ambiguous. The filter is sensitive to silicate absorption (e.g., 2005HAO) and continuum emission from small grains (2007DRAINELI). It may also trace the extended wings of the PAH vibrational bands, based on the observation that F1000W emission in PHANGS-JWST correlates well with the PAH-dominated F770W and F1130W bands (e.g., 2023LEROY; 2023SANDSTROM).
The PHANGS-JWST observations are described in 2023LEE, and the data processing is presented by 2024WILLIAMS, to which we refer the reader for details on these data. Briefly, the data are calibrated using a version of the STScI JWST pipeline222https://jwst-pipeline.readthedocs.io modified to handle extended sources (“pjpipe”333https://pjpipe.readthedocs.io). The JWST-MIRI calibration scheme yields an intensity scale accurate to better than (2023RIGBY). The MIRI mosaics are astrometrically aligned with paired NIRCam observations using bright point sources. Those NIRCam observations are in turn registered against HST imaging that has been aligned to Gaia DR3 sources. As a result, the overall astrometric accuracy of the images is significantly better than the FWHM of the JWST-MIRI PSF (2024WILLIAMS). The overall background levels of the MIRI images are set using previous mid-IR imaging and validated to be accurate to better than MJy sr (2023LEROY; 2023LEE; 2024WILLIAMS). The H II regions that we study appear bright in all bands in the MIRI images (2024PATHAK) and we detect essentially all of them at high SNR (2024PATHAK; 2023BELFIORE), making the uncertainty in the flux calibration and background level the most relevant sources of uncertainty. 97% of our 17,615 regions are detected at in at least one MIRI filter.
We use the MIRI images convolved to a Gaussian PSF with FWHM of . This is the smallest “safe” Gaussian PSF to which we can convolve the F2100W data (native PSF FWHM ) and the convolution improves the SNR of the images significantly 2024WILLIAMS. Table 1 reports the corresponding physical resolution of the convolved JWST-MIRI imaging. Note that the 2023GROVES catalogs and our own additional analysis use the “convolved and optimized” VLT-MUSE H maps (2022EMSELLEM), which have a median angular resolution of (range ). Thus, we treat the PHANGS-JWST data as effectively resolution matched to the PHANGS-MUSE maps.
2.3 PHANGS-HST H Imaging and Nebular Catalogs
Finally, we use complementary narrowband H data from HST (P.I. R. Chandar; R. Chandar, A. Barnes et al. submitted) for 17 of our 19 targets. These images are diffraction limited with a FWHM PSF , corresponding to 2-9 pc physical resolution. This is much sharper than the pc resolution of the PHANGS-MUSE data. A. Barnes et al. in preparation use these HST data to measure sizes for the 2023GROVES H II regions, providing a value-added catalog of resolved sizes and refined luminosities that augment the spectroscopic measurements produced by 2022SANTORO, published in 2023GROVES, with updated auroral line fits (and associated properties) from 2024BRAZZINI. They identify H II region boundaries within each individual 2023GROVES region via surface brightness cuts and then provide size and luminosity estimates that reflect only the smaller HST-visible region. Whenever available, we use their “circular” radii, which translate the area of the region at the isophotal boundary into an equivalent radius via . We also adopt the measured from the HST region, which is smaller than the MUSE value.
The HST narrowband H data have poorer surface brightness sensitivity, somewhat less areal coverage than the VLT-MUSE data, and catalogs for two of our targets were not available at the time of publication. As a result only 7,082 of the 17,615 selected 2023GROVES regions are detected in the HST maps. For regions without HST measurements, we use the MUSE H luminosity to predict the size and luminosity that HST would be expected measure following the procedures detailed in Appendix LABEL:sec:appendix:HST-to-MUSE-JWST-R-L-scaling. We leverage two tight ( dex scatter) scaling relations from Barnes et al. in preparation, one linking the HST and MUSE-derived H luminosities and the other linking the HST H luminosity to the measured size. We show both relations in Appendix LABEL:sec:appendix:HST-to-MUSE-JWST-R-L-scaling. Extrapolating in this way allows us to use all of the selected 2023GROVES regions, improving the statistical power of the results and expanding the analysis to include lower luminosity regions often not detected by HST.
Our calculations require estimates of the bolometric luminosity, , for each region. We infer this from the extinction-corrected H luminosity, . Similar to 2021BARNES, we perform a luminosity-weighted average over the first 4 Myr of simple stellar population (SSP) evolution to calculate a typical ratio of . Specifically, we use Starburst99 SSP models (1999LEITHERER; 2014LEITHERER) with the default parameters and a fully populated 2001KROUPA initial mass function (IMF) with a maximum stellar mass of . This yields . For reference, literature versions of this ratio span from near the zero age main sequence to for continuous star formation (e.g., see 2024SCHINNERER). We discuss subtleties related to this calculation in §5.
We provide a value-added catalog that complements the MUSE nebular catalog presented in 2023GROVES and A. Barnes et al. (in preparation) with the measurements needed to reproduce our work: region sizes, dust attenuations, optical depths, luminosities, and resulting pressure estimates. Table 4 provides a complete list of all columns contained in our value-added catalog of 17,615 H II regions.
3 Radiation Pressure in HII Regions
tion pressure scales with the amount captu per areared by the ISM. Quantifying thus involves estimating the relevant luminosity and size for each H II region, then estimating what fraction of this luminosity is captured by the. For reprocessed radiation pressure, the IR luminosity is relevant. Radiation pressure due to ionizations comes from photons with energy above eV. For direct radiation pressure on dust, the optical and non-ionizing UV radiation is most relevant, which will be a substantial fraction of the bolometric luminosity for a young star cluster.
For a spherical region with luminosity and radius , the local flux is
| (1) |
where is a geometric factor that depends on where the energy is captured by the ISM. For a shell of ISM material where the luminosity is concentrated within some ,
| (2) |
For absorbing ISM material uniformly distributed throughout the region, the volume-averaged local flux is
| (3) |
In principle, the simplest realistic geometric assumption for H II regions is a shell, and all radiation pressure estimates presented in this paper assume . Uniform-distribution pressures can be derived by simply multiplying all pressures by 3. We discuss these geometric considerations further in §5.2.
Finally, we estimate what fraction of the flux imparts momentum to the surrounding ISM by accounting for , the optical depth of the shell at wavelength :
| (4) |
When considering pressure due to H ionizations we only consider absorption. For a dusty shell, will have contributions from both absorption and scattering (e.g., 2018REISSL). For absorption, the full momentum of the incident photon contributes. For scattering, the momentum contribution is the product of the incident photon momentum and , where is the scattering angle (1985RYBICKI&LIGHTMAN). Averaged over many events, this becomes times the photon momentum, where will be a function of the dust grain size and . In general, momentum-transfer due to scattering is negligible for because the cross section for scattering drops rapidly past the near-IR (e.g., 2018REISSL). Therefore, we ignore scattering for the IR reprocessed pressure, and account for scattering when calculating direct UV-optical radiation pressure on dust.
Note that since and for a fixed angular size, where is the distance to a target, the expression for in Eq. 4 is independent of the distance as long as the region has been resolved. Also note that in regions with high IR optical depth, IR photons can encounter multiple dusty shells, where Eq. 4 applies for each shell, effectively increasing the reprocessed radiation pressure by a factor that will approach . Our target H II regions are optically thin to IR photons, so we neglect this effect and only consider a single dusty shell for both the reprocessed and direct terms.
3.1 Reprocessed Radiation Pressure
Following Eq. 4, estimating requires the IR luminosity, size, and IR optical depth for each H II region. The H II regions in our sample are optically thin to IR photons (Table 3), so we can approximate . Then the expression for reprocessed radiation pressure becomes an integral over the full IR spectrum (m),
| (5) |
where is the wavelength-specific IR luminosity from dust.444For reference, in the limit of large IR , the relevant optical depth is the Rosseland mean optical depth and photons diffuse outward through multiple dusty shells as described above. This yields .
JWST-MIRI provides mid-IR maps at high-enough resolution to isolate individual H II regions from the surrounding diffuse ISM (2024PATHAK). However, we lack access to longer wavelengths (m) at high resolution. To account for the impact of radiation at these longer wavelengths, we first calculate the radiation pressure contribution associated with each of the four MIRI filters – F770W, F1000W, F1130W, and F2100W. Then, we use dust SED models to scale from the mid-IR to total IR radiation pressure. For each MIRI filter FX, the pressure is
| (6) |
where is the integrated luminosity in that filter. Formally, should be the luminosity-weighted average optical depth over the filter. Since the optical depth does not vary significantly over the narrow width of the MIRI filters, we take to be the optical depth at the central wavelength of the filter.
To constrain the optical depth in each filter, we extrapolate from the H attenuation of each region, , measured by 2023GROVES. Formally, these Balmer decrement-based reflect the attenuation along the whole line of sight. However, the H and H used in the calculation are localized in H II regions, and we expect that the measured opacity is concentrated near the H II region. To convert from H to other wavelengths, we use the extinction law of 2023GORDON, which is based on multiwavelength observations of interstellar extinction along multiple sightlines and extends out to . Beyond m, we add a continuous transition to a classical power-law extinction curve with and at (2011DRAINE-book). Table 2 summarizes relevant conversions derived from from the G23 extinction curve and the 2023GROVES measurements. We discuss potential issues and next steps related to the extinction curve in §5.3.
In principle, an alternative approach would be to model the full IR spectral energy distribution (SED) and simultaneously constrain the radiation field and dust optical depth (e.g., 2007DRAINELI). Unfortunately, for targets beyond the Magellanic Clouds the physical resolution of far-IR imaging that captures the m peak of the SED remains far coarser than the scale of individual H II regions. We do note that lower resolution observations show a good correlation between and dust extinction derived from IR SED modeling (e.g., 2013KRECKEL).
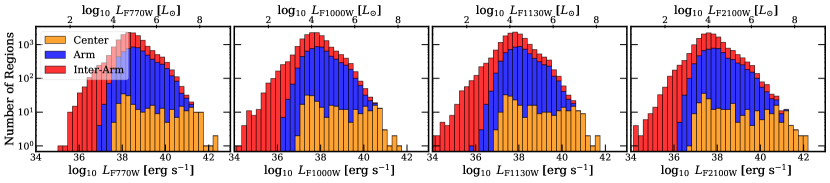
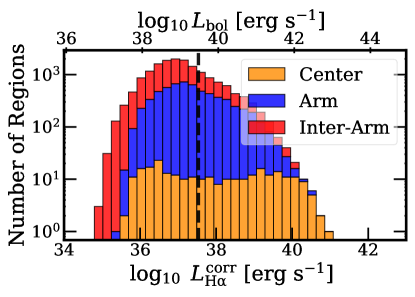
Figs. 2 and 3 show the result of these first two parts of the calculation and Table 3 reports related numbers. Fig. 2 shows the distribution of mid-IR luminosities for our target regions. Our regions show typical luminosities in the continuum-tracing F1000W and F2100W filters, and in the PAH-dominated F770W and F1130W filters. The mid-IR luminosities are dex lower than the median bolometric luminosity of regions (see §3.2), indicating that a significant fraction of the bolometric luminosity emerges in the mid-IR (see §5.4).
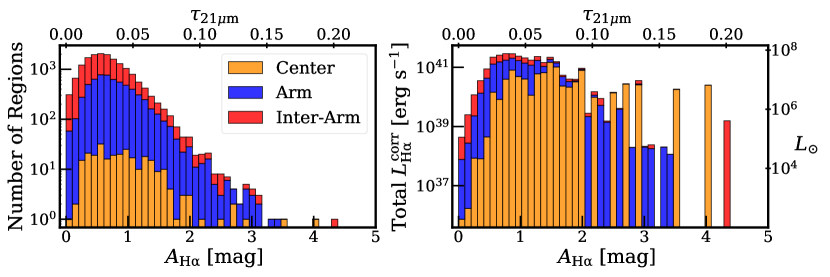
Fig. 3 and Tables 2 and 3 show the distribution of for our target regions. Treating all regions equally, the median mag, with a mag percentile range. The median rises to mag if we instead weight by H luminosity. he mid-IR optical depths are lower than by afactors of pwith median of 0.02 (m), 0.06 (m), 0.04 (m), and 0.03 (m) and a percentile range of 0.03. The optical depth falls rapidly beyond the mid-IR, so our regions are optically thin to IR photons.
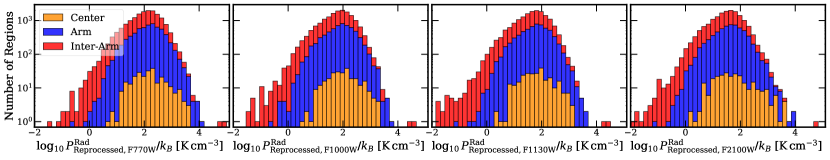
Fig. 4 shows the distribution of for each MIRI filter, which are of order . These estimates only capture the IR radiation pressure exerted by photons within the wavelength range of the filter. To estimate the fraction of the total captured by the MIRI filters, we combine the G23 extinction curves with the 2023HENSLEY&DRAINE dust SED models. Appendix LABEL:sec:appendix:MIR-to-TIR-conv details the full procedure. Briefly, we generate HD23 models for a range of interstellar radiation field (ISRF) intensities. Following 2007DRAINELI, we consider scaled versions of the 1983MATHIS radiation field, with the intensity indicated by , and the nominal Solar Neighborhood ISRF. We consider values from to , an approximate upper bound for plausible ISRF strength in the H II regions in our sample ( in 30 Doradus, e.g., 2019LEE).
In Appendix LABEL:sec:appendix:MIR-to-TIR-conv, we show that for a wide range of , the four MIRI filters together trace a roughly constant fraction, , of the total IR . This translates to a mid-IR-to-total conversion factor of . We adopt a conversion factor of , with uncertainty of across the plausible range of . For each region we thus calculate
| (7) |
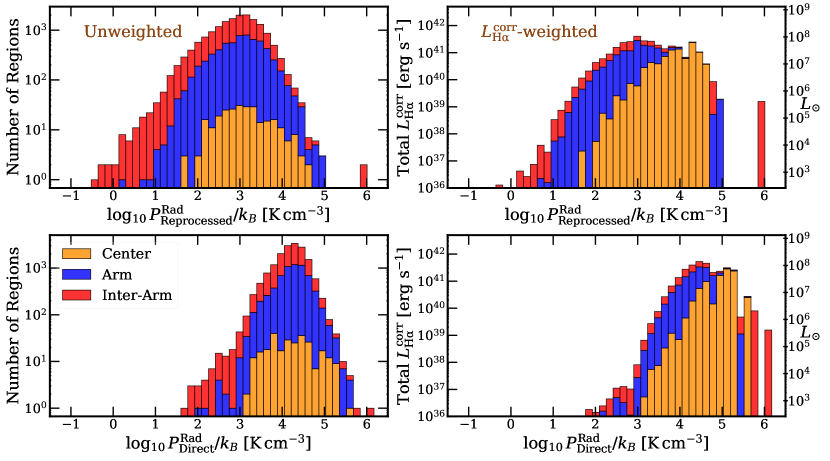
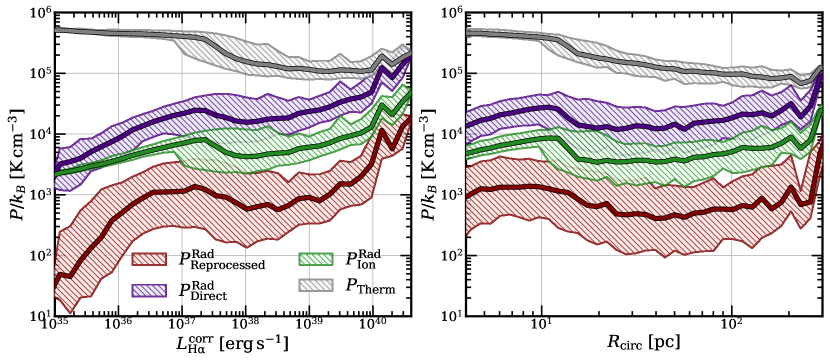
In the top row of Fig. 5 and Table 3 we summarize the distribution of total IR . We find median of order . The -weighted histograms shift to higher median highlighting how the subset of H II regions with the highest also have high . Using the spiral arm and galaxy center masks of 2021QUEREJETA, we check for variations in among galactic environments. H II regions in galactic centers show the highest , followed by regions in spiral arms. Inter-arm regions show the lowest . These environmental variations are consistent with the most luminous regions having the highest .
These are the first empirical estimates of for a large sample of H II regions outside the Local Group. We discuss that they appear consistent with previous Milky Way and Magellanic Cloud studies in §4. Here we emphasize that these are low, due to the low IR optical depths in our regions. In fact, the total IR luminosities of our regions are comparable to their bolometric luminosities (Table 3), but the IR optical depths are . Since , the IR pressures are also low.
3.2 Direct Radiation Pressure on Dust
Similar to , “direct” radiation pressure on dust grains by UV and optical photons depends on the luminosity of the source powering each H II region, the amount of dust present, the absorption and scattering properties of dust grains, and the size and geometry of the region. We estimate using Eq. 4, (§2.3), and assuming a shell geometry ().
Since young, massive stars emit most of their luminosity as UV photons, we treat the bolometric luminosity, , as the relevant one. We estimate from the attenuation-corrected as described in Section 2. Figure 6 and Table 3 includes the distribution of and the corresponding for our sample. Our regions show median , which rises in galaxy centers to . The corresponding -weighted median for our full sample and galaxy centers are and .
To estimate what fraction of is attenuated and results in momentum transfer, we calculate a “radiation pressure-mean” optical depth, , following 2023BLACKSTONE. Similar to §3.1, we begin with estimated from the Balmer decrement. Then we use the G23 extinction curve to estimate the corresponding , the optical depth at nm, a characteristic FUV wavelength.
While offers a useful point of reference, young stellar populations emit significant energy from FUV to optical wavelengths, and the relevant optical depth for should reflect the convolution of the stellar SED and the wavelength-dependent dust opacity and include the effects of scattering (see above). To account for these effects, we adopt the fiducial model from 2023BLACKSTONE and a dust-to-gas ratio of 1/100. They use a realistic grain size distribution, take into account wavelength-dependent absorption and scattering, and convolve these with model SEDs appropriate for a range of stellar population ages. In detail, we use their model to calculate the ratio between their spectrum-integrated opacity for radiation pressure , which is the relevant opacity for radiation pressure, and , which we infer from our data. This yields
| (8) |
for Myr old SSP with a variation across SSP ages Myr (see discussion in §5.4). Based on this, our regions show median of 1.6 and -weighted median of 2.66, confirming that they are optically thick to starlight. This is two orders of magnitude above the IR found in §3.1.
Putting together our estimates for and yields for each region, as summarized in Fig. 5 and Table 3. Our regions show median . H II regions in galaxy centers and spiral arms show the highest values, of order . These estimates are about an order of magnitude above , and are comparable to the ambient ISM pressure and turbulent pressure, but an order of magnitude below the thermal warm H II gas pressure (see §4.3).
3.3 Radiation Pressure from Gas Ionization
In addition to on dust, the photoionization of gas leads to additional radiation pressure, . Following the approach discussed in §3.3 and 3.5.1 of 2021BARNES, we estimate by considering the photon momentum contribution from the ionizing photons responsible for the observed H emission.
We estimate the rate at which photons are absorbed due to H-ionization interactions, , from the extinction-corrected H luminosity, , assuming case B recombination, so that
| (9) |
where is the energy of an H photon (e.g., 2011DRAINE-book; 2017BYLER). This corresponds to a luminosity of absorbed H-ionizing photons of
| (10) |
where is the mean energy of an ionizing photon. In detail, h depends on the SED of the central powering source, which is sensitive to the age of the stellar population and potentially affected by stochastic sampling of the IMF. Lacking precise stellar mass and age estimates for individual regions, we adopt eV, which represents a reasonable estimate for a young stellar population with a fully sampled IMF (2021BARNES). This translates to
| (11) |
Using this luminosity, we compute following Equation 4. We adopt because only refers to the ionizing photons that have been absorbed by H and led to H-ionization.
represents a distinct but potentially overlapping term with . In the limit where the dust optical depth is high, will already account for absorption of ionizing photons because we have used the full when calculating . However, at low depth, there will be photons that ionize the gas, but that would not have otherwise been blocked by dust. This can be an important term, given that for a Myr old SSP, ionizing photons (13.6 eV) account for –40% of the total luminosity (e.g., 1999LEITHERER). The condition where the two become comparable is
| (12) |
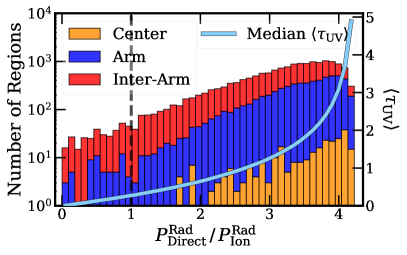
So for , pressure on dust will dominate over gas ionization. This corresponds to mag for our adopted extinction curve.
Fig. 7 shows this ratio for our sample. Only 2% of our target regions have , and the median . represents an important but not dominant term in our sample. does dominate over in regions with low dust attenuation. As a result, this term will be important in low-metallicity galaxies, which are often dwarf galaxies, such as most H II regions in the relatively dust-poor Small Magellanic Cloud (SMC) which show mag (2014LOPEZ). IC5332 and NGC5068, the two dwarf galaxies in our sample, indeed show the highest .
In detail, the exact where the two terms balance depends on details of the powering stellar population (see §5.4). The geometric factors in Eq. 4 might also differ between different pressure terms (see §5.2), e.g., if ionizations initially occur within a spherical H II region (), while dust is confined to the neutral gas in a shell at the edge of the region (). However in this case, the large will sweep up the gas into a shell, so it won’t remain spherical for long.
| Quantity | Unweighted | -weighted | |||||||
|---|---|---|---|---|---|---|---|---|---|
| unit | All | Center | Arm | Inter-Arm | All | Center | Arm | Inter-Arm | |
| pc | |||||||||
| - | |||||||||
| mag | |||||||||
| mag | |||||||||
| - | |||||||||
| - | |||||||||
| - | |||||||||
| - | |||||||||
| - | |||||||||
Note. — Summary of H II region properties: circular radius , attenuation-corrected , bolometric luminosity (§2.1 and 2.3), JWST-MIRI filter luminosities at F770W, F1000W, F1130W, and F2100W (§3.1), total IR luminosity at and (Appendix LABEL:sec:appendix:MIR-to-TIR-conv), , , V-band attenuation , optical depth at 21 m and radiation pressure-effective optical depth (Table 2), pressures (§3.1), (§3.2), (§3.3), , , , and (§4). The percentile range for each quantity is presented for all regions, regions in galaxy centers, spiral arms (and bars), and inter-arm regions. Finally, both unweighted and -weighted percentiles are included for comparison.
Note that our estimates of are independent of the fraction of ionizing photons that escape from a region, , because we base them on from the H II region itself. However, is sensitive to , since we use to estimate . If is high, will be an underestimate, and so will .
| Column | Unit | Description |
|---|---|---|
| gal_name | Galaxy name | |
| region_ID | Nebular region ID from 2023GROVES | |
| environment | Local environment following 2021QUEREJETA | |
| Rcirc | pc | following A. Barnes et. al (in preparation, see Appendix LABEL:sec:appendix:HST-to-MUSE-JWST-R-L-scaling) |
| A_HA6562 | mag | MUSE following 2023GROVES |
| A_V | mag | assuming G23 extinction curve and (§2.1) |
| tau_21micron | assuming G23 extinction curve and (§3.1) | |
| tau_UV | assuming G23 extinction curve, , following 2023BLACKSTONE | |
| L_HA6562_CORR | , estimated to match size of region (A. Barnes et al. in preparation, Appendix LABEL:sec:appendix:HST-to-MUSE-JWST-R-L-scaling) | |
| L_bol | estimated from (§3.2) | |
| L_F770W | estimated as and to match size of region (§3.1, Appendix LABEL:sec:appendix:HST-to-MUSE-JWST-R-L-scaling) | |
| L_F1000W | (as ) (§3.1) | |
| L_F1130W | (as ) (§3.1) | |
| L_F2100W | (as ) (§3.1) | |
| P_Rad_TIR_Reprocessed_kB | (§3.1) | |
| P_Rad_MIR_F770W_kB | (§3.1) | |
| P_Rad_MIR_F1000W_kB | (§3.1) | |
| P_Rad_MIR_F1130W_kB | (§3.1) | |
| P_Rad_MIR_F2100W_kB | (§3.1) | |
| P_Rad_Direct_kB | (§3.2) | |
| P_Rad_Ion_kB | (§3.3) | |
| P_Therm_kB | (§4.3) |
Note. — This table complements the catalogs of 2023GROVES and A. Barnes et al. (in preparation, version 0.9) with the measurements and derived quantities needed to reproduce our results. These catalogs can be joined using the region_ID from 2023GROVES. We request that users of these catalogs cite the original measurements from 2023GROVES and A. Barnes et al. (in preparation).
4 Contextualizing Radiation Pressures
4.1 Comparison with Literature Measurements
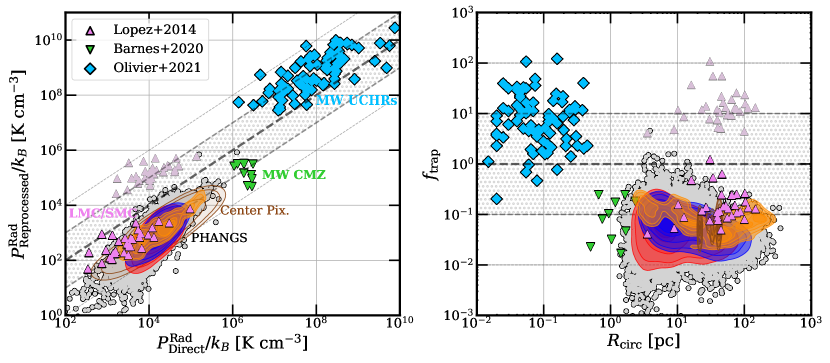
We compare our estimates of and to previous measurements in Fig. 8. These include H II regions in the Magellanic Clouds (2014LOPEZ), embedded H II regions in the Milky Way’s Central Molecular Zone (CMZ) (2020BARNES), and highly obscured ultra-compact Milky Way H II regions (UCHRs; 2021OLIVIER). These comparison datasets computed volume averaged pressures (, see §3). Therefore, we scale the literature values by to be consistent with our adopted spherical shell geometry ().
Our treatment of optical depths also differs from the literature by accounting for the IR and UV optical depths. Previous works do not include the factor of when estimating , instead assuming that the full bolometric luminosity of each region is absorbed by dust grains. In our sample, this discrepancy is typically small because most H II regions are effectively optically thick to UV photons (§3.2), but it will be important to consider in dust-poor environments.
In addition, the works that we compare to estimated the IR reprocessed component via , where is the radiation energy density in the region. While can reliably estimate when the region is optically thick to IR photons, it becomes an unreliable estimator when , which is the case for most of our regions. In these optically thin regions, neglects that only a small fraction of the IR radiation interacts with dust grains and is more appropriate. overestimates the true value by , where is the luminosity-weighted optical depth of IR photons.
H II regions in the LMC and SMC have low attenuations, and so we take the factor of and into account when comparing and , respectively, to those measurements. 2014LOPEZ provide extinction estimates based on stellar reddening maps from OGLE (their Table 3), yielding median mag in their LMC regions and mag in the SMC. We use the attenuation in each region with the G23 extinction curve and compute , and over following Appendix LABEL:sec:appendix:MIR-to-TIR-conv at the provided by 2014LOPEZ for each region. At , this yields typical for the LMC and for SMC, firmly in the optically thin regime for IR radiation.
Fig. 8 includes the original () pressures from 2014LOPEZ as faint purple triangles, and the optical depth-corrected pressures as bold purple triangles. After correcting for (and to a smaller extent), we see good agreement between and for the 2014LOPEZ LMC and SMC regions and H II regions in PHANGS galaxies.
The assumption seems more plausible for dusty CMZ regions and UCHRs. In any case we have no attenuation measurements for these systems. Therefore, we include them in the comparison as is, but note that obtaining estimates of would be valuable.
Our measurements yield ratios consistent with those found for the Milky Way CMZ regions by 2020BARNES. They do find higher pressures than even our galaxy center measurements. This is driven primarily by the small pc sizes that they find for CMZ regions. Our HST data do not access such small scales, and we would therefore assign them larger sizes and lower pressures if they were present in our data. It seems plausible that once resolved, regions in the central regions of our target galaxies will be found to have pressures similar to the Galactic CMZ regions.
The UCHRs from 2021OLIVIER show much higher pressures than any of our regions. This reflects their sub-pc sizes, which are 2–3 orders of magnitude smaller than PHANGS and LMC/SMC regions. In addition, 2021OLIVIER infer high interstellar radiation fields in regions of high dust obscuration (where ), which results in . The short-lived, high pressure, IR pressure dominated regions in 2021OLIVIER are thus distinct environments from the rest of the literature measurements.
High resolution observations of nearby galaxy centers exist in the literature and offer one prospect to bridge the gap between our measurements and sub-pc Galactic regions. ALMA and VLA observations of dust and free-free emission can reach pc resolution and resolve the regions associated with young, massive clusters (e.g., 2018LEROY; 2020EMIG; 2021LEVY; 2022LEVY; 2023SCHINNERER; 2023WHITMORE; 2024SUN). Measurements for star forming regions in galaxy centers suggest high pressures and high implying high (e.g., 2018LEROY). Future work will synthesize these measurements in the framework used here. We discuss other next steps for region selection in §5.1.
Lastly, 2021BARNES estimated for a subset of our regions. Their measurements had substantial uncertainty associated with the region sizes. After accounting for their different geometric assumptions (they use ), they found mean and for their minimum and maximum sizes, representing an upper and lower bound on without the optical depth factor of . They focused on the most luminous subset of 6,000 2023GROVES regions, which make our -weighted median in galaxy centers and spiral arms of a good comparison. This lies dex below their upper bound for , which is reasonable since the new HST-derived isophotal region sizes in the bright centers are still larger than , and trace large and luminous star-forming complexes instead of individual clusters. To illustrate, our median pc for all regions is a typical for 2021BARNES, while our -weighted median pc in galaxy centers and spiral arms. None of their are pc while this is a typical . As mentioned above, 2021BARNES also do not account for , which would account for an additional decrease.
4.2 Comparison Among Radiation Pressure Terms
Figs. 9, 10, and 11 and Table 3 compare radiation pressure terms within our sample, building on Fig. 8. Fig. 9 shows the magnitude of each term as a function of a region’s optical luminosity, , and size, . Figs. 10 and 11 focus on the ratio . This ratio is also referred to as the “trapping factor,”
| (13) |
captures the fractional increase or “boost” in total radiation pressure due to the inclusion of reprocessed IR photons. So, implies that IR protons increase the total radiation pressure by 10% in addition to UV direct radiation pressure.
The figures show across our sample. As we saw in §3.3, is on average times , increasing to a larger fraction in the lowest luminosity, lowest attenuation regions. For reference, the median mag for the SMC mentioned in §4.1 implies mag, almost exactly the condition for that we found §3.3. So while appears subdominant but important for our sample of massive, metal-rich galaxies, it may be dominant in the conditions similar to those found in the SMC.
Meanwhile, most massive galaxies show typical , a value consistent with radiation hydrodynamic simulations of giant molecular clouds (e.g., 2022MENON; 2023MENON-rp). is highest in galaxy centers (Table 3), higher luminosity regions (Fig. 9 left), and smaller regions (Fig. 8 right), although all these trends appear weak in our data.
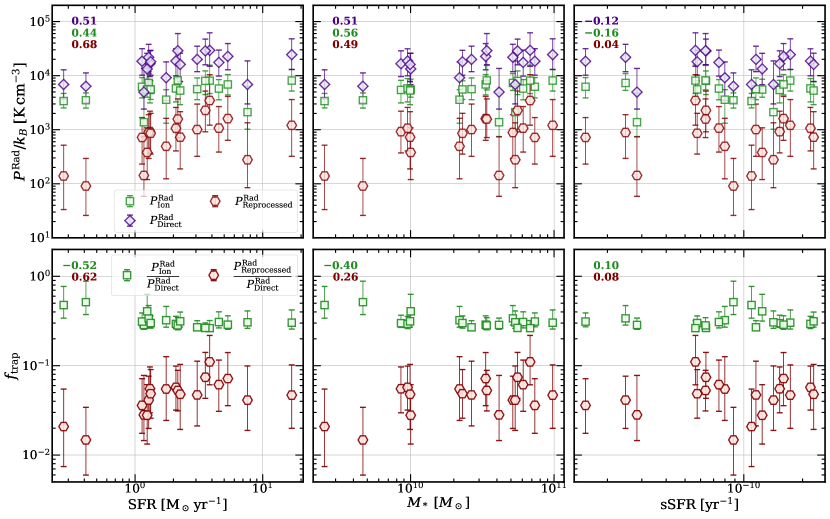
Fig. 10 compares the median radiation pressures and corresponding for our 19 galaxies. Each radiation pressure correlates moderately with the global star formation rate (SFR; Spearman ) and stellar mass (; ), and is uncorrelated with specific star formation rate (sSFR; ). While the IR-to-UV roughly increases with SFR and , decreases. As discussed in §3.3 and 4.1, is lowest and is highest for the two dwarf galaxies in our sample.
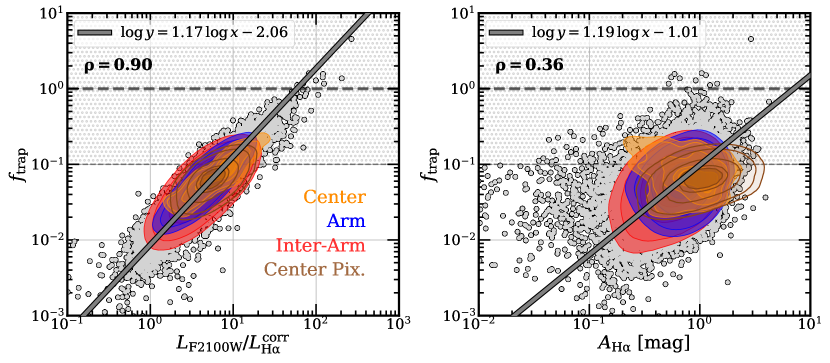
Finally, Fig. 11 shows that correlates with and . We find a tight relationship between and the luminosity ratio , which shows dex scatter. This correlation is expected. Algebraically, . There is an extensive literature linking the ratio to (e.g., 2007CALZETTI; 2023BELFIORE). The left panel in Fig. 9 shows that and scale with . The pressures also scale with IR luminosities, especially F2100W (not shown). Thus, the mid-IR-to-H ratio represents our best practical predictor for because it captures both relevant luminosities and is sensitive to the attenuation. Our best-fit bisector power law relation, given in Fig. 11, implies that when and when .
In the right panel of Fig. 11, shows a weaker correlation with , despite the expectation that for regions optically thick in the UV. The two quantities do correlate as expected, but the scatter in at fixed is dex, and an overall Spearman rank coefficient . In contrast to the left panel (strong correlation, ), the simplest explanation appears to be that does not trace the ratio well (, not shown). Since , scatter in that luminosity ratio at fixed would weaken the observed trend. Such scatter is present in the SFR tracer literature (e.g., see plots of vs. with large scatter in 2012LEROY; 2020KESSLER) but often obscured by the use of luminosity-luminosity plots.
The fact that does not trace perfectly, suggests a degree of breakdown in our model, which assumes: (1) a simple spherical geometry, (2) that traces the total light absorbed by dust, (3) that traces the relevant IR luminosity, and (4) that the VLT-MUSE can be used to trace attenuation at all scales and wavelengths. We discuss the path towards improving these components, including more robust tracers of attenuation and better constraints on region geometry in §5.
4.3 Comparison to Other Pressure Terms
We also compare radiation pressure to estimates of other terms driving the expansion of H II regions. In 2021BARNES the thermal gas pressure on a shell due to the enclosed ionized gas often represented the dominant term. Assuming all H and He enclosed is singly ionized, . 2021BARNES found , the range reflects uncertainty in the electron number density . Although measurements of the ratio of the lines in the [SII] doublet offer a means of measuring , the values were distinguishable from the low density limit only in a subset of the 2021BARNES H II regions. Also, even in cases where an [SII]-derived density could be measured, different assumptions about region size and clumpiness yielded a wide range of plausible . The electron temperature, , was better constrained via nitrogen auroral lines where available, and set to a representative otherwise.
The new HST regions sizes improve constraints on , and detailed new estimates of based on these will be presented in A. Barnes et al. (in preparation). Here we provide an approximate estimate of to compare to . We assume that the distribution of ionized gas in the H II region is well approximated by a uniform sphere (the Strömgren approximation) and adopt a representative . This yields
| (14) |
where is the H-ionizing photon production rate, estimated from (2006OSTERBROCK-book).
Fig. 9 and Table 3 compare radiation pressure terms to , median value . Thermal gas pressure dominates over all radiation pressure terms, with on average . However, as summarized in Table 3, becomes lower and radiation pressure more important in luminous regions where the dust attenuation is higher. In our sample, these are conditions associated with the inner, bar-fed regions of galaxies () or weighting by ( ). These results appear consistent with simulations (e.g., 2018KIM; 2021ALI) and models (e.g., 2009KRUMHOLZ), which show that while photoionization heating dominates over radiation pressure for typical star-forming regions, this situation can reverse for regions powered by the most massive clusters.
Stellar winds also contribute an outward pressure, but one that is harder to constrain with observations. 2021BARNES estimated the ram pressure due to stellar winds, , by assuming the fiducial mass-loss rate, wind velocity, and mechanical luminosity in the STARBURST99 models. In this setup, , the same dependence as . For a given size estimate, 2021BARNES found to be similar to , typically dex lower. Our measurements do not contribute new constraints on this ratio, but we do note that is significantly more uncertain than . X-ray observations do not recover the thermal energy expected from shocked hot stellar winds (2011LOPEZ; 2014ROSEN) and recent simulations suggest that rapid cooling significantly weakens the importance of shocked hot stellar winds (see, e.g., 2021LANCASTER-wind; 2021aLANCASTER).
Other terms may also contribute, for example cosmic ray feedback can be important on larger scales (e.g., 2024THOMPSON) and the assumption that H II regions are all “pre-SN” may also be violated in some cases. We have already removed a small number of supernova remnants coincident with H II regions (see §2.1 and 2024LI) from our sample. 2024MAYKERCHEN observed a minority of core collapse SNe and a majority of stripped-envelope supernovae that occurred recently in PHANGS galaxies to overlap the 2023GROVES regions. And in the Milky Way, LMC, and M33, SNe are observed to occur within or near IR-bright giant H II regions (e.g., 2011TOWNSLEY; 2024TOWNSLEY; 2024SARBADHICARY). These composite regions will make excellent targets for case studies that examine the complex interplay of multiple generations of stellar feedback.
Finally, we have not discussed the impact of radiation pressure in region expansion. Following 2021BARNES, a natural next step will be to compare the pressure of the ambient environment into which the regions expand and its balance with the outward push of stellar feedback and the restoring pull of stellar gravity. Kpc-scale equilibrium ISM pressures have been estimated for our sample of galaxies by 2020SUN; 2022SUN and are of the same order as (see 2021BARNES), requiring a detailed region by region comparison to assess their dynamical state. The stellar gravity of these regions has not been measured, but follow-up work leveraging PHANGS-JWST and PHANGS-HST imaging to constrain this term is underway.
5 Key Assumptions and Next Steps
5.1 Region Selection
Although we use HST sizes, we study regions identified as H peaks in the seeing-limited ( pc) VLT-MUSE maps. This tends to emphasize luminous, H-bright regions and our results can be viewed as reflecting the “middle-age” pre-supernova H II regions that contribute most of the H emission in galaxies. They may miss other types of H II regions.
A particular concern is that basing our sample on 2023GROVES excludes young, embedded regions in the earliest stages of region evolution. We expect these to be compact, with high IR-to-H ratios. These are likely to be the cases with the largest and highest , and represent an important bridge between our sample and the embedded regions studied in the Milky Way by 2021OLIVIER and 2020BARNES. Though this phase may be short-lived, populations of these sources do appear to be present in our targets, visible in high resolution imaging of m PAH emission (2024JIMENARODRIGUEZ) and long wavelength, high resolution observations of galaxy centers (2023SCHINNERER; 2024SUN, and refs in §4.1).
Star formation often occurs in crowded environments with populations of different ages near one another, e.g., in spiral arms, bar ends, and starburst galaxy centers. Such regions tend to be overshadowed by nearby larger, H-bright sources. Galactic and Magellanic Cloud observations often show such multi-generation star formation with exposed H II regions near mid-IR bright embedded sources, e.g., in regions like 30 Doradus (e.g., 2015CIGNONI) and Carina (e.g., 2014GETMAN; 2015CIGNONI; 2019POVICH). This juxtaposition makes selecting small, IR-bright, relatively H-faint regions from seeing-limited H maps challenging. In §2.1 and 4.1, we have already highlighted that this situation is particularly severe in Galactic centers, where 2023GROVES assign whole galactic centers to one or a few H II regions.
Given this, a clear next step will be to deliberately select compact embedded sources, particularly in galaxy centers. This may require modifying our approach, not just our selection. The spectroscopic data from MUSE that underpins our extinction measurements remains accessible only at scales. Meanwhile, additional high-resolution long-wavelength observations, e.g., with ALMA or the VLA will be needed to resolve the massive, highly obscured young clusters in galaxy centers.
5.2 Region Geometry
The relative geometry of dust, gas, and stars represents an important uncertainty in our calculations. We adopt the simplifying assumption that a single and a shell geometry (, Eq. 4) describes all thee radiation pressure terms. But these geometric factors are uncertain, with different literature studies assuming values that vary by a factor of . Beyond just uncertainty in the appropriate overall geometry to assume, different feedback-related pressures may occur in different locations within the region. This will lead to different and even different relevant region sizes for each term. For example, reprocessed radiation pressure may act outside the inner shells where direct radiation pressure acts, so that both have but distinct radii. Meanwhile, if the ionized gas in a region is volume-filling, then may be appropriate for the radiation pressure due to ionizations while the pressure on dust might be better described by . Finally, the thickness of dusty shells, and smaller high-attenuation clumps of dust embedded within a larger shell structure that we fail to resolve can contribute additional reprocessed radiation pressure. This may lead to a spatial disconnect between the optical (direct) and IR (reprocessed) components of on smaller scales.
Fortunately, prospects for next steps here are clear. Current or incoming JWST observations will capture near-IR recombination line emission, e.g., Paschen or Brackett imaging, and high-resolution dust emission that can be used to estimate the extinction on small scales and resolve the geometry of individual regions (e.g., 2024PEDRINI). This will allow detailed measurements of H II region substructure. These, combined with simulations that capture realistic structure (e.g., 2018KIM; 2022MENON; 2023MENON-rp) and more panchromatic studies of Local Group H II regions should combine to better constrain the appropriate geometry to estimate feedback terms.
5.3 Optical Depth and Extinction Curve
We adopt the 2023GORDON extinction curves with a typical Milky Way . This appears appropriate for some photo-dissociation regions (PDRs; e.g., 2024ABERGEL), but not all of them (e.g., 2007BLAGRAVE), and high have been observed towards cold molecular clouds (e.g., 2004VALENCIC; 2007FITZPATRICK). also varies moderately from galaxy-to-galaxy (see review in 2020SALIM) and exhibits both small (cloud) and large (kpc) scale spatial variations in the Milky Way (e.g., 2023ZHANG; 2024ZHANG). We assess the impact of variations in Appendix LABEL:sec:appendix:Rv-variation. Increasing from 3.1 to 4 decreases by , and increases by , resulting in a 1.5 times higher .
Given a predictive model for , one could adjust the G23 (or subsequent) curves region-by-region to reflect variations. There are good prospects for such a model, with JWST now regularly mapping multiple recombination lines, extensive optical spectral mapping of Milky Way and Magellanic Cloud H II regions underway (SDSS LVM, 2024DRORY; 2024KRECKEL), and new UV facilities on the horizon (e.g., UVEX, 2021KULKARNI).
Moreover, the 2023GORDON extinction curves only extend to . Beyond this, we assume with , but this could plausibly vary (2011DRAINE-book). Given the contribution to IR pressure at m (see Fig. LABEL:fig:bolometric_correction_factors in Appendix LABEL:sec:appendix:MIR-to-TIR-conv), this could represent an important uncertainty. Prospects for short-term improvement in understanding this term are less clear.
A related concern is the accuracy with which our Balmer decrement-based , estimated on pc scales, predicts the and relevant to . The VLT/MUSE observations do not reveal the structure of dust within any individual region and are not sensitive to compact, deeply embedded sources. They may include contributions from diffuse ionized gas, which has lower attenuation than bright H II regions (2022EMSELLEM; 2022BELFIORE). Each 2023GROVES region may also blend together multiple smaller star forming regions with different true (see §5.1). Due to this uncertainty, as discussed in §4 and Fig. 11 both our data and previous studies show significant scatter about the correlation between and the mid-IR-to-H ratio, which may indicate consistency issues related to our assumed geometry. Despite these concerns, we emphasize that these measurements do represent the best available region-by-region attenuation estimates for any sample of galaxies. Combining higher resolution HST and JWST recombination line mapping offer the best prospect to improve on these measurements in the near future.
5.4 Spectral Energy Distribution and Luminosity Estimates
| Age | ||||
|---|---|---|---|---|
| 0.01 Myr | 56 | 0.78 | 1 | 1 |
| 1 Myr | 61 | 0.78 | 1.01 | 1.09 |
| 2 Myr | 71 | 0.75 | 1.07 | 1.23 |
| 3 Myr | 132 | 0.72 | 1.80 | 2.25 |
| 4 Myr | 161 | 0.67 | 3.48 | 2.62 |
| 6 Myr | 637 | 0.61 | 26.85 | 9.68 |
Note. — Typical uncertainty from varying the age of the SSP on the -to- conversion factor, radiation pressure-effective UV optical depth (from 2023BLACKSTONE), inferred stellar mass relative to ZAMS (, essentially ), and inferred direct radiation pressure relative to ZAMS ().