Systematic Bias in Ionizing Radiation Escape Fraction Measurements from Foreground Large-Scale Structures
Abstract
We investigate the relationship between the Ly forest transmission in the intergalactic medium (IGM) and the environmental density of galaxies, focusing on its implications for the measurement of ionizing radiation escape fractions. Using a sample of 268 spectroscopically confirmed background galaxies at and a galaxy density map at within the COSMOS field, we measure the Ly transmission photometrically, leveraging the multiwavelength data available from the COSMOS2020 catalog. Our results reveal a weak but statistically significant positive correlation between Ly optical depth and galaxy density contrast, suggesting that overdense regions are enriched in neutral gas, which could bias escape fraction measurements. This emphasizes the need to account for the large-scale structure of the IGM in analyses of ionizing radiation escape fractions, and highlights the advantages of a photometric approach for increasing the number of sampled lines of sight across large fields. The photometric redshifts provided by upcoming all-sky surveys, such as Euclid, will make it possible to account for this bias, which can also be minimized by using fields separated in the sky by many degrees.
1 Introduction
New observations from the James Webb Space Telescope are revolutionizing our understanding of the galaxies that populate the Universe during the epoch of reionization (i.e., at Williams et al., 2023; Lin et al., 2024; Finkelstein et al., 2024). Not only are we able to routinely identify and spectroscopically confirm objects at these epochs, but we are now able to study their physical properties in detail (see, e.g., Adamo et al., 2024, for a recent review). These studies are showing that galaxies at share many of the properties of local galaxies with high escape fraction of ionizing radiation (Lin et al., 2024; Harikane et al., 2024; Hayes et al., 2024), possibly confirming the role of star-formation in the reionization of the Universe, although the role of active galactic nuclei is still debated (e.g., Madau et al., 2024). This conclusion, however, is weakened by our ignorance of how much ionizing radiation from galaxies escapes into the inter galactic medium (IGM).
There are no observations that can measure the escape of ionizing radiation at , as the diffuse neutral hydrogen in the IGM prevents leaked ionizing photons from reaching the observer. Accordingly, studies of escape fraction have focused on , with mixed success (e.g., Citro et al., 2024; Vanzella et al., 2018).
One of the primary challenges faced by escape fraction studies at is the uncertainty in correcting for the IGM absorption specific to the line of sight to each galaxy (Steidel et al., 2018). To overcome this, many high-redshift studies report average escape fractions, operating under the assumption that averaging across multiple sight lines allows for the use of the average attenuation factor measured from large numbers of QSO independent sight lines (Fan et al., 2006; Becker et al., 2015, 2018).
Steidel et al. (2018) demonstrated that the uncertainty related to the unknown effects of the intergalactic medium (IGM) can be reduced to less than 10% at by averaging over a large number () of lines of sight. However, these lines of sight must be truly independent for the statistical argument to hold. In cases where galaxies are observed over small patches of sky, this assumption may not be valid due to the clustering of the underlying matter density. For galaxies at , LyC photons are absorbed both ‘locally’ by optically thick Lyman limit systems (LLSs) and by the Ly forest at lower redshifts. Given that the mean free path of a LyC photon emitted at is relatively large (on the order of 100 pMpc, Becker et al., 2021), a significant fraction (approximately 40%) of the absorption results from the cumulative effect of the Ly forest at a redshift of around 2 for the galaxy in question. This latter component of the IGM attenuation is what can potentially introduce a correlation between the IGM correction and the large scale structure in the foreground.
Various studies suggest that the Ly forest absorption correlates on scales up to tens of comoving Mpc (e.g., Liske et al., 2000; Slosar et al., 2011; Mawatari et al., 2023). At , angular scales of 10 arcminutes correspond to approximately 20 cMpc implying that nearby sightlines are not completely independent. Existing measurements of LyC escape fraction at are confined to a handful of well–studied and relatively small fields (Naidu et al., 2017; Fletcher et al., 2019; Saxena et al., 2022), and are therefore affected by this limitation. Even the ‘large’ CANDELS fields only span linear scales of at most 18 cMpc, at . Applying an “all-sky-averaged” IGM transmission to small fields may not appropriate.
A few studies in the literature have observationally explored this effect. Mukae et al. (2017) investigated Ly forest absorption at along the lines of sight to nine quasars in the COSMOS field. Using galaxy densities estimated within pMpc cylinders, they detected a weak correlation between the Ly forest attenuation and galaxy density. Similarly, Liang et al. (2021) found comparable results by cross-correlating galaxy density fields, traced by Ly-emitters, with Ly forest attenuation measured against background quasars from the SDSS Baryon Oscillation Spectroscopic Survey (BOSS) database. A common limitation of these studies is their reliance on Ly forest attenuation measurements from the spectra of bright quasars, which restricts the analysis to a limited number of lines of sight. In this work, we adopt a different approach by using photometric data from galaxies rather than spectroscopic data from quasars. This method allows for a significantly larger number of lines of sight within a field, enhancing the sampling of the underlying large-scale structure, and emphasizing smaller transverse spatial scales.
In this paper we apply this approach to the COSMOS field (Scoville et al., 2007), where the wealth of ancillary data (Section 2) allows an accurate measurement of both the Ly forest attenuation (Section 2.4) and the galaxy density field (Section 2.3). In Section 3 we present our results and discuss how the foreground LSS affects the measurement of the LyC escape fraction. In what follows, we assume a cosmology of , and the AB magnitude system (Oke, 1990).
2 The strategy
2.1 Theory and available filters
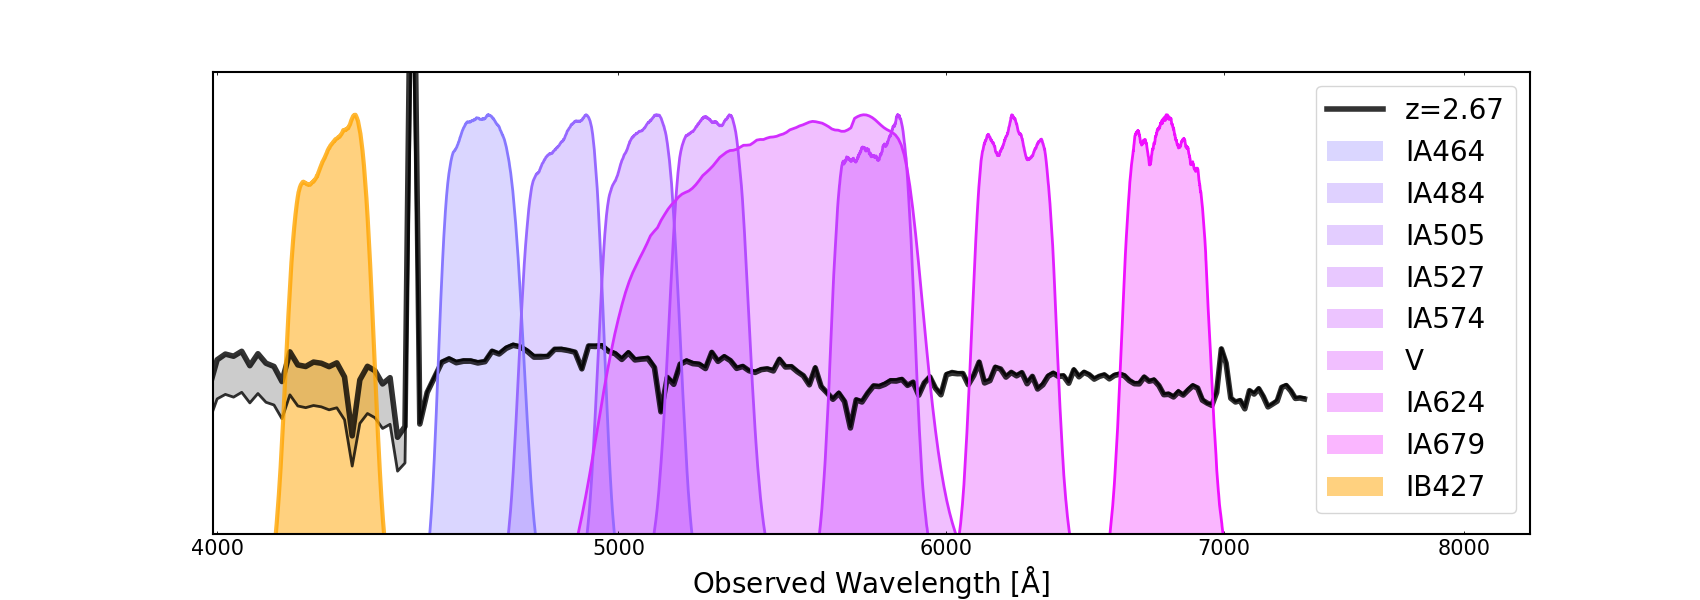
As a galaxy’s radiation traverses the IGM toward the observer, a series of absorption lines (typically referred to as the Ly forest, even though they are due to both hydrogen and metals) populate the spectrum blueward of the Ly emission line observed at ((1+)Å, where is the redshift of the galaxy). For a source at redshift , the LyC radiation that is not absorbed by a Lyman limit system in the galaxy’s local environment can travel almost freely until it resonates with the Ly line of neutral hydrogen at redshift . Resonant absorption in the higher order Lyman series is also possible, but the Ly cross section is 5.3 times higher than Ly and thereby provides the large majority of the opacity. We use photometric and spectroscopic data from the COSMOS survey to quantify the Ly forest absorption at using a sample of background galaxies with accurate spectroscopic redshifts.
In Figure 1, we illustrate the concept behind the measurement. The thick black line represents a spectral template of a star-forming galaxy at before its light is attenuated by the intervening IGM (computed using the average value for ). After passing through the IGM, the galaxy’s light is diminished by the Ly forest, as shown by the spectrum given by the thin line. The gray shaded area emphasizes the difference between the attenuated and unattenuated spectrum. The absorption due to the Ly forest can be measured using the combination of photometric bands available in COSMOS and shown in the Figure. Specifically, the COSMOS IB427 medium band filter (covering the wavelength range between 4170–4370Å) isolates Ly forest absorption from gas at , between and (corresponding to a scale of pMpcs). Accordingly, for background galaxies at , the comparison between the intrinsic and observed flux in the COSMOS IB427 filter provides an estimate of the IGM attenuation due to gas at .
In the following sections, we explain the selection of the background sources, the calculation of the Ly forest attenuation using the available photometric bands, and the calculation of the density contrast.
2.2 Background galaxy sample
To isolate the Ly forest transmission, and minimize the modeling uncertainty that could be introduced by contamination from Ly emission from the background galaxies, we limit the analysis to background objects in the . The low redshift limit ensures that the IB427 photometry is not contaminated by possible Ly emission of the background galaxy, while the high redshift cutoff avoids the Ly absorption. We use the latest compilation of spectroscopic redshifts in COSMOS, compiled by Khostovan et al. (2025, in prep) as the parent catalog. This catalog includes unique sources with spectroscopic redshifts either published in the astronomical literature or private to the COSMOS collaboration. From the compilation, we used the astrometry-corrected coordinates and the homogenized quality flags. We only include spectroscopic redshifts with quality assessment flag equal to either 3 or 4. This choice limits the selection to only reliable sources with a redshift confidence level %. When sources are observed in multiple surveys, we keep the preferred redshift characterized by the Priority=1 assessment flag. To ensure consistent photometric coverage in all bands, we limit to the central COSMOS area, with R.A. and Dec . Finally, we excluded sources with photometric and spectroscopic redshifts that differed by more than 0.2, as well as objects that were identified as AGN in the literature (e.g., Laloux et al., 2023).
For each galaxy in the spectroscopic sample we extracted the photometric measurements tabulated in the FarmerLephare COSMOS2020 catalog (Weaver et al., 2022), and we retain in the sample only galaxies with a signal-to-noise ratio greater than three in the IB427 filter, reducing the sample to 268 galaxies.
2.3 Galaxy environmental density maps
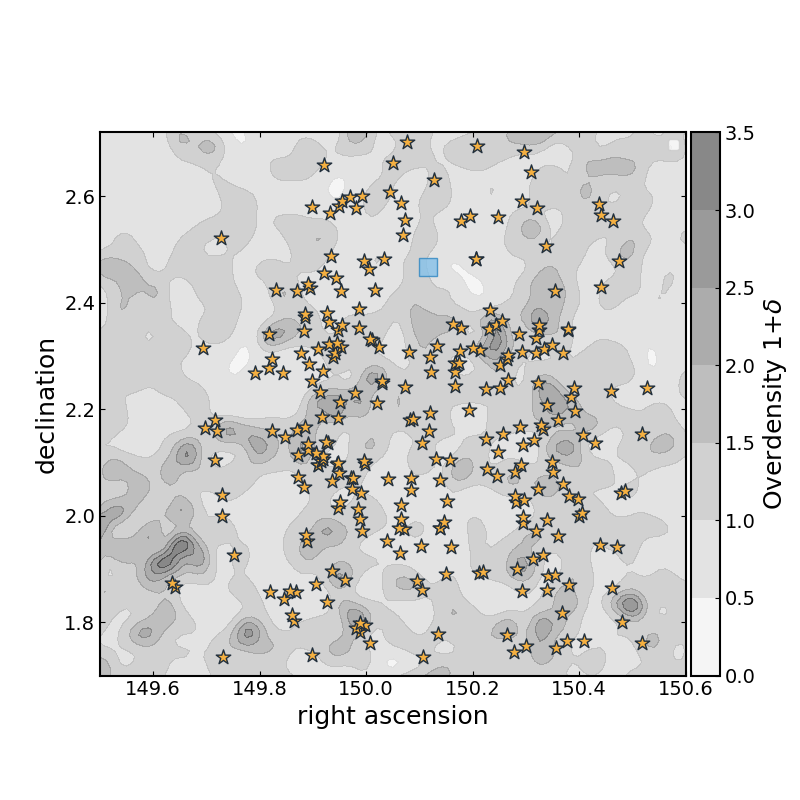
We employ the galaxy density maps (specifically, the map of 1, where ) from Taamoli et al. (2024), who reconstructed the galaxy underlying density field using the full photometric redshift probability distribution functions for galaxies in the COSMOS2020 catalog. The maps were computed in narrow redshift ranges using a weighted kernel density estimation approach, and correcting for edge effects and masked regions. In this work, we consider the stacked density map obtained within redshift range covered by the IB427 filter in Ly, i.e., . The density map is shown in Figure 2, where we also show the position of the background galaxies used for the measurement of the Ly forest transmission.
For each background galaxy, we extract the corresponding value of 1 along its line of sight, by computing a simple linear interpolation of the map at the specific position. We estimate the error associated with this overdensity by taking the standard deviation of the map values in a circle of 2.5 arcminute radius (corresponding to cMpc at ).
2.4 Optical Depth Calculation
We compute the average Ly transmission over the redshift range along the line of sight to each galaxy from the ratio between the observed () and intrinsic galaxy flux in the IB427 filter (), i.e., . The average Ly transmission is then used to compute the effective Ly optical depth defined as:
| (1) |
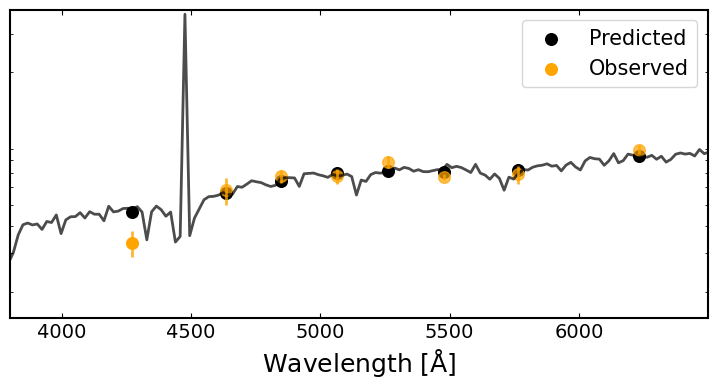
To estimate , we fit stellar population synthesis models to the background galaxies’ photometric measurements, limiting the fit to only bands sampling the spectral energy distribution between 1216Å and 2000Å in the rest frame of the galaxy, see Figure 3. We used the Bayesian Analysis of Galaxies for Physical Inference and Parameter Estimation code (BAGPIPES Carnall et al., 2018) to model the galaxies’ spectral energy distribution. Because of the uncertain impact of Ly radiative transport in the ISM of galaxies, we exclude photometric bands that can potentially be contaminated by Ly emission from the SED fit. Accordingly, depending on the specific redshift, we use either 8 or 7 bands for each galaxy. Before fitting the SED, we corrected the photometric measurements for Milky Way extinction, using the (Gordon et al., 2023) extinction law with a total-to-selective extinction . Additionally, the fluxes in the individual photometric bands were corrected using the magnitude offsets computed by the EAZY code (see details in Weaver et al., 2022).
For the BAGPIPES fit, we use Bruzual & Charlot (2003) stellar population synthesis models with an exponential star formation history and a Kroupa IMF Kroupa (2001). We vary the stellar ages, metallicities, and we include both nebular emission and dust attenuation (using the Calzetti et al. (2000) extinction law). We checked that considering a different extinction law, (Reddy et al., 2016), did not change the paper conclusions which are based on a relative comparison of observed transmissions among different lines of sight. During the fit, the redshift was kept fixed at the galaxy spectroscopic redshift.
Figure 3 shows an example of the modeling for an observed galaxy at . The black line shows the intrinsic best-fit model, i.e., the model that does not include the Ly forest attenuation. We used this spectrum to compute within the IB427 passband and compared this value to to compute , according to Equation 1. We do not apply a correction for metal absorption lines. This correction, however, is negligible, being of the order of 0.0245 (Kirkman et al., 2005).
3 Results and Discussion
Before we investigate the correlation between the Ly forest optical depth () and the galaxy overdensity we compute the average value including all lines of sight. We find that , a value somewhat higher than the average optical depth at similar redshift estimated from QSO lines of sight (e.g., , Kirkman et al., 2005; Monzon et al., 2020). One possibility is that the specific lines of sight we have identified (i.e., those corresponding to Lyman Break Galaxies) are more attenuated than the average line of sight as galaxies selected to be spectroscopically followed up are typically identified on the basis of a strong Lyman break feature.
3.1 The Ly optical depth and foreground galaxy density
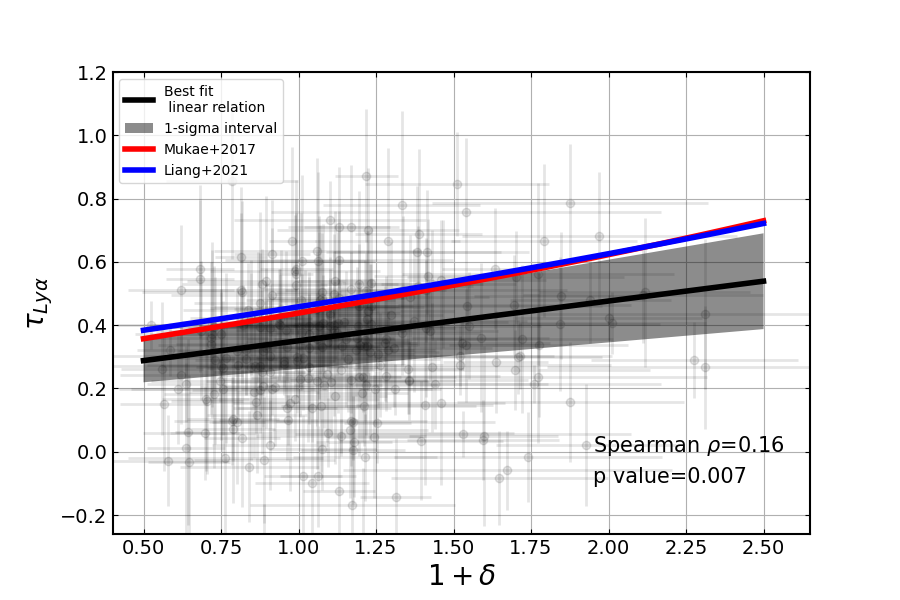
The main result of our analysis is presented in Figure 4 where we show the effective Ly forest optical depth as a function of the density enhancement. The data show that there is a weak correlation between the Ly optical depth and the density field, with lines of sight passing through overdense regions being on average less transparent to Ly photons than lines of sight passing through underdense regions.
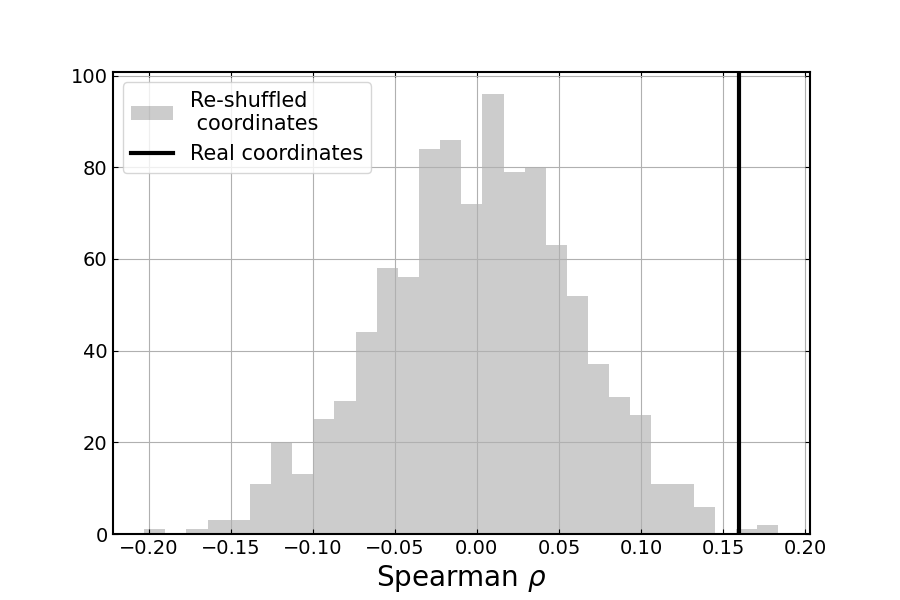
We quantify the strength of the correlation using the Spearman’s () correlation coefficient, based on the ranks of the data. We find that (with a p-value of 0.007), indicating that the correlation is weak, but significant. We also tested the reality of the correlation by shuffling the coordinates of the background galaxies, and recomputing the correlation coefficient for each realization. Because each background galaxy provides the attenuation along a specific sightline in the large scale structure at , shuffling the coordinates should erase any correlation. The results are shown in Figure 4, where we plot the distribution of the Spearman’s correlation coefficient between the Ly forest attenuation and the galaxy density contrast for the 1,000 realizations of the re-shuffled galaxy coordinates. The vertical line shows the value measured for the real galaxy positions. This figure clearly demonstrates that the observed correlation has a very low probability of rising by chance. The best-fit linear relation to the data, shown in black with the associated scatter, is:
| (2) |
The observed trend suggests that at , overdense environments are more enriched in neutral gas than less dense regions. This finding aligns with the observation that, at these redshifts, the average star formation rate (SFR) of galaxies is higher in denser environments– a trend that is reversed in the local Universe (e.g., Lemaux et al., 2022; Taamoli et al., 2024), and supports the idea that the increased SFR may be due to higher level of gas accretion in overdense environments.
A few studies have approached this problem in the literature measuring the Ly forest opacity using the spectra of bright background QSOs. Mukae et al. (2017) applied this technique to 16 QSOs in the COSMOS field, where they used galaxies’ photometric redshifts to estimate the environmental densities within 25 pMpc-high111In the redshift direction. cylinders, corresponding to , approximately half of the length of the redshift slice covered by the IB427 filter. Liang et al. (2021) used 64 QSO lines and constructed the galaxy density field using Ly emitters (LAEs) photometrically identified at over a narrow redshift range222LAEs may or may not be a good tracer of the underlying density field (e.g., Shi et al., 2019; Toshikawa et al., 2016) as the escape of Ly radiation from galaxies is a complex function of galaxies properties. . For the measurement of they averaged the IGM transmission over pMpc. Similar to our results, both studies find a weak but significant correlation between the Ly forest transmission and galaxy overdensity. The Mukae et al. (2017) and Liang et al. (2021) relations are shown in Figure 4. In both original works, they presented the results in terms of the Ly forest fluctuation, i.e., the fluctuation of the Ly forest transmission with respect to the cosmic Ly forest mean transmission333For the mean cosmic transmission, they adopt the value estimated by Faucher-Giguère et al. (2008), , corresponding to a , . Converting from to can be done with simple algebra, i.e., .
As can be seen from the comparison in Figure 4 our result agrees with these previous studies in terms of the observed slope of the correlations, but is slightly shifted toward lower values of optical depths. If real, this shift is hard to understand. From QSO absorption line studies, the cosmic average Ly forest transmission of the IGM at is , varying relatively little between redshift 2.2 and 2.6. We already noted that the average value we find in our analysis is larger than this cosmic average, and we suggested the possibility that this difference is due to the choice of background sources (galaxies instead of QSOs). The two studies mentioned above, however, target bright QSOs not galaxies. It is also unlikely that this difference is due to the specific lines of sight being considered, as the Mukae et al. (2017) measurement is performed in the COSMOS field over a very similar redshift range as used here, making it even more difficult to reconcile the different values.
3.2 Impact on measurements
Leaving the zero point aside, we now focus on the dependence of on the galaxies’ density and its implications for the measurement of the escape fraction () of ionizing radiation.
Although the slopes agree within 1, Figure 4 shows that our trend is slightly shallower than those reported in previous studies. This difference is likely due to variations in the volumes used to compute galactic environmental densities and optical depths, with our analysis employing the longest cylinders. Averaging over larger volumes likely weakens the correlation, which however is still found to be significant over the 40 cMpc scale (Å) used here.
The dependency of the relation on the wavelength interval () over which it is computed affects the IGM correction applied to escape fraction () measurements. Ionizing radiation from galaxies is typically measured either through spectroscopic observations over narrow wavelength intervals (( Å Bridge et al., 2010; Flury et al., 2022; Shapley et al., 2003), or through imaging data using filters with bandwidths ranging from a few tens to several hundred Å (Citro et al., 2024; Siana et al., 2007; Bridge et al., 2010). While measurements over smaller wavelength intervals are more sensitive to the dependence of on environmental density, we find that even using a 200Å interval has a significant impact: going from overdense () to underdense () regions, the Ly forest transmission increases from 58% to 74%.
This effect is distinct from the stochasticity in the number of Lyman Limit Systems (LLSs) near the observed galaxies, as studied by Steidel et al. (2018). That uncertainty is random and can be mitigated by averaging measurements across a large number of galaxies, even within the same field. In contrast, the effect we discuss here arises from correlated, large-scale absorption in the Ly forest at lower redshifts than the target galaxies. As shown in Figure 2, overdense and underdense regions extend across scales of several arcminutes (with the turquoise square representing the size of a Wide Field Camera 3 field of view). All galaxies located behind these overdense (underdense) regions will systematically experience greater (lesser) IGM attenuation, necessitating a larger (smaller) correction when measuring their escape fraction of ionizing radiation.
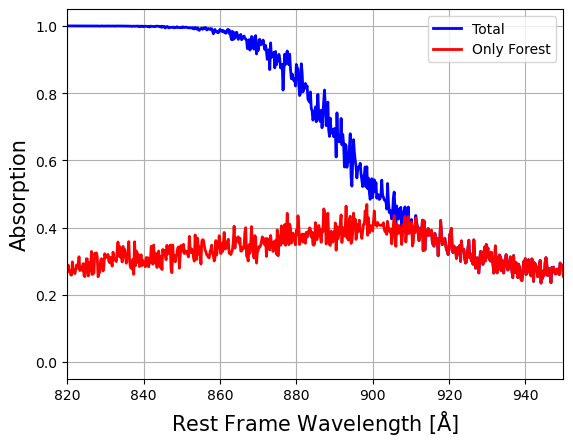
To assess the relative contributions of photoionization and Ly forest absorption to IGM attenuation, we simulated the absorption of ionizing radiation following the method outlined in Inoue et al. (2014). This simulation incorporates their parameterization of redshift- and column-density distributions, which were derived from widely separated QSO sight lines and thus assume a spatially uncorrelated universe. These distributions do not include an excess of absorbers associated with the circumgalactic medium (e.g., Rudie et al., 2013). Note, however, that Hayes et al. (2021) find no need for this additional absorption around galaxies based on the evolution of the average Ly profile (an effect that can only occur proximately) with redshift. We generated 500 sight lines to , computing both the total IGM absorption (including photoionization and Ly forest absorption) and the absorption due to the Ly forest alone. As shown in Figure 5, Ly forest absorption alone accounts for a substantial fraction—ranging from 30% to 90%—of the total attenuation at wavelengths between 900Å and 840Å. This highlights the significant role that large-scale structure plays in modulating ionizing radiation escape, reinforcing the need to account for these environmental effects when interpreting escape fraction measurements.
Wide-field surveys, such as Euclid (Euclid Collaboration: Mellier et al., 2024), will provide the necessary photometric data to construct, over vast areas of the sky, galaxy overdensity maps similar to those used in our analysis. By leveraging these maps alongside our measured relation and detailed IGM absorption models at specific redshifts, it will be possible to refine IGM corrections based on QSO sight lines and better account for the influence of large-scale structure. Additionally, the bias introduced by the observed correlation between optical depth and overdensity can be mitigated by selecting survey fields that are widely separated on the sky—at scales larger than the typical size of overdense structures (1 degree). This approach, adopted in programs such as the Hubble Parallel Ionizing Emissivity Survey (Scarlata et al., 2022), will ensure that escape fraction measurements remain unbiased by local environmental effects.
4 Conclusions
By adopting a photometric approach leveraging the extensive COSMOS data, we explore the Ly forest and its relation to cosmic density fields. We present evidence of a weak but significant correlation between galaxy overdensity and the Ly forest optical depth, indicating that overdense regions at exhibit reduced Ly forest transmission. This supports the hypothesis that such regions are enriched in neutral gas, which may contribute to elevated star formation rates. Comparing our results to previous studies, including Mukae et al. (2017) and Liang et al. (2021), we find consistent trends but note a shallower correlation slope likely due to the larger spatial scales used in our analysis.
Our findings further imply that the large-scale structure of the intergalactic medium affects the measurements of ionizing radiation escape fractions. Specifically, galaxies behind overdense regions require larger IGM corrections compared to those behind underdense environments. This underscores the importance of accounting for the environmental density of foreground galaxies in studies of the escape fraction of ionizing radiation.
We suggest that using fields separated in the sky by many degrees minimizes this bias.
References
- Adamo et al. (2024) Adamo, A., Atek, H., Bagley, M. B., et al. 2024, arXiv e-prints, arXiv:2405.21054
- Astropy Collaboration et al. (2022) Astropy Collaboration, Price-Whelan, A. M., Lim, P. L., et al. 2022, ApJ, 935, 167
- Becker et al. (2015) Becker, G. D., Bolton, J. S., Madau, P., et al. 2015, Monthly Notices of the Royal Astronomical Society, 447, 3402
- Becker et al. (2021) Becker, G. D., D’Aloisio, A., Christenson, H. M., et al. 2021, MNRAS, 508, 1853
- Becker et al. (2018) Becker, G. D., Davies, F. B., Furlanetto, S. R., et al. 2018, ApJ, 863, 92
- Bridge et al. (2010) Bridge, C. R., Teplitz, H. I., Siana, B., et al. 2010, ApJ, 720, 465
- Bruzual & Charlot (2003) Bruzual, G., & Charlot, S. 2003, Monthly Notices of the Royal Astronomical Society, 344, 1000
- Calzetti et al. (2000) Calzetti, D., Armus, L., Bohlin, R. C., et al. 2000, The Astrophysical Journal, 533, 682, publisher: IOP Publishing
- Carnall et al. (2018) Carnall, A. C., McLure, R. J., Dunlop, J. S., & Davé, R. 2018, MNRAS, 480, 4379
- Caswell et al. (2023) Caswell, T. A., Sales de Andrade, E., Lee, A., et al. 2023, Matplotlib/Matplotlib: REL: V3.7.4, ,
- Citro et al. (2024) Citro, A., Scarlata, C. M., Mantha, K. B., et al. 2024, arXiv e-prints, arXiv:2406.07618
- Euclid Collaboration: Mellier et al. (2024) Euclid Collaboration: Mellier, Y., Abdurro’uf, Acevedo Barroso, J., et al. 2024, A&A, accepted, arXiv:2405.13491
- Fan et al. (2006) Fan, X., Strauss, M. A., Becker, R. H., et al. 2006, The Astronomical Journal, 132, 117, publisher: IOP Publishing
- Faucher-Giguère et al. (2008) Faucher-Giguère, C.-A., Prochaska, J. X., Lidz, A., Hernquist, L., & Zaldarriaga, M. 2008, The Astrophysical Journal, 681, 831, publisher: IOP Publishing
- Finkelstein et al. (2024) Finkelstein, S. L., Leung, G. C. K., Bagley, M. B., et al. 2024, ApJ, 969, L2
- Fletcher et al. (2019) Fletcher, T. J., Tang, M., Robertson, B. E., et al. 2019, The Astrophysical Journal, 878, 87, publisher: The American Astronomical Society
- Flury et al. (2022) Flury, S. R., Jaskot, A. E., Ferguson, H. C., et al. 2022, The Astrophysical Journal, 930, 126, publisher: The American Astronomical Society
- Gordon et al. (2023) Gordon, K. D., Clayton, G. C., Decleir, M., et al. 2023, ApJ, 950, 86
- Harikane et al. (2024) Harikane, Y., Nakajima, K., Ouchi, M., et al. 2024, ApJ, 960, 56
- Harris et al. (2020) Harris, C. R., Millman, K. J., van der Walt, S. J., et al. 2020, Nature, 585, 357
- Hayes et al. (2021) Hayes, M. J., Runnholm, A., Gronke, M., & Scarlata, C. 2021, The Astrophysical Journal, 908, 36, publisher: The American Astronomical Society
- Hayes et al. (2024) Hayes, M. J., Saldana-Lopez, A., Citro, A., et al. 2024, arXiv e-prints, arXiv:2411.09262
- Inoue et al. (2014) Inoue, A. K., Shimizu, I., Iwata, I., & Tanaka, M. 2014, Monthly Notices of the Royal Astronomical Society, 442, 1805
- Kirkman et al. (2005) Kirkman, D., Tytler, D., Suzuki, N., et al. 2005, Monthly Notices of the Royal Astronomical Society, 360, 1373
- Kluyver et al. (2016) Kluyver, T., Ragan-Kelley, B., Pérez, F., et al. 2016, Jupyter Notebooks—a Publishing Format for Reproducible Computational Workflows, 87–90
- Kroupa (2001) Kroupa, P. 2001, Monthly Notices of the Royal Astronomical Society, 322, 231
- Laloux et al. (2023) Laloux, B., Georgakakis, A., Andonie, C., et al. 2023, MNRAS, 518, 2546
- Lemaux et al. (2022) Lemaux, B. C., Cucciati, O., Fèvre, O. L., et al. 2022, Astronomy & Astrophysics, 662, A33, publisher: EDP Sciences
- Liang et al. (2021) Liang, Y., Kashikawa, N., Cai, Z., et al. 2021, ApJ, 907, 3
- Lin et al. (2024) Lin, Y.-H., Scarlata, C., Williams, H., et al. 2024, Monthly Notices of the Royal Astronomical Society, 527, 4173
- Liske et al. (2000) Liske, J., Webb, J. K., Williger, G. M., Fernández-Soto, A., & Carswell, R. F. 2000, MNRAS, 311, 657
- Madau et al. (2024) Madau, P., Giallongo, E., Grazian, A., & Haardt, F. 2024, ApJ, 971, 75
- Mawatari et al. (2023) Mawatari, K., Inoue, A. K., Yamada, T., et al. 2023, AJ, 165, 208
- Monzon et al. (2020) Monzon, J. S., Prochaska, J. X., Lee, K.-G., & Chisholm, J. 2020, The Astronomical Journal, 160, 37
- Mukae et al. (2017) Mukae, S., Ouchi, M., Kakiichi, K., et al. 2017, The Astrophysical Journal, 835, 281, publisher: The American Astronomical Society
- Naidu et al. (2017) Naidu, R. P., Oesch, P. A., Reddy, N., et al. 2017, ApJ, 847, 12
- Oke (1990) Oke, J. B. 1990, AJ, 99, 1621
- Perez & Granger (2007) Perez, F., & Granger, B. E. 2007, Computing in Science and Engineering, 9, 21
- Reddy et al. (2016) Reddy, N. A., Steidel, C. C., Pettini, M., Bogosavljević, M., & Shapley, A. E. 2016, The Astrophysical Journal, 828, 108, publisher: The American Astronomical Society
- Rudie et al. (2013) Rudie, G. C., Steidel, C. C., Shapley, A. E., & Pettini, M. 2013, The Astrophysical Journal, 769, 146, publisher: The American Astronomical Society
- Saxena et al. (2022) Saxena, A., Pentericci, L., Ellis, R. S., et al. 2022, MNRAS, 511, 120
- Scarlata et al. (2022) Scarlata, C., Alavi, A., Bruton, S. T., et al. 2022, The Parallel Ionizing Emissivity Survey, HST Proposal. Cycle 30, ID. #17147, ,
- Scoville et al. (2007) Scoville, N., Aussel, H., Brusa, M., et al. 2007, ApJS, 172, 1
- Shapley et al. (2003) Shapley, A. E., Steidel, C. C., Pettini, M., & Adelberger, K. L. 2003, The Astrophysical Journal, 588, 65, publisher: IOP Publishing
- Shi et al. (2019) Shi, K., Huang, Y., Lee, K.-S., et al. 2019, ApJ, 879, 9
- Siana et al. (2007) Siana, B., Teplitz, H. I., Colbert, J., et al. 2007, ApJ, 668, 62
- Slosar et al. (2011) Slosar, A., Font-Ribera, A., Pieri, M. M., et al. 2011, J. Cosmology Astropart. Phys, 2011, 001
- Steidel et al. (2018) Steidel, C. C., Bogosavljević, M., Shapley, A. E., et al. 2018, ApJ, 869, 123
- Steidel et al. (2018) Steidel, C. C., Bogosavljević, M., Shapley, A. E., et al. 2018, The Astrophysical Journal, 869, 123, publisher: The American Astronomical Society
- Taamoli et al. (2024) Taamoli, S., Mobasher, B., Chartab, N., et al. 2024, The Astrophysical Journal, 966, 18, publisher: The American Astronomical Society
- Toshikawa et al. (2016) Toshikawa, J., Kashikawa, N., Overzier, R., et al. 2016, ApJ, 826, 114
- Vanzella et al. (2018) Vanzella, E., Nonino, M., Cupani, G., et al. 2018, MNRAS, 476, L15
- Virtanen et al. (2020) Virtanen, P., Gommers, R., Oliphant, T. E., et al. 2020, Nature Methods, 17, 261
- Weaver et al. (2022) Weaver, J. R., Kauffmann, O. B., Ilbert, O., et al. 2022, The Astrophysical Journal Supplement Series, 258, 11, publisher: The American Astronomical Society
- Williams et al. (2023) Williams, H., Kelly, P. L., Chen, W., et al. 2023, Science, 380, 416