Machine learning of microstructure–property relationships in materials with robust features from foundational vision transformers
Abstract
Machine learning of microstructure–property relationships from data is an emerging approach in computational materials science. Most existing machine learning efforts focus on the development of task-specific models for each microstructure–property relationship. We propose utilizing pre-trained foundational vision transformers for the extraction of task-agnostic microstructure features and subsequent light-weight machine learning of a microstructure-dependent property. We demonstrate our approach with pre-trained state-of-the-art vision transformers (CLIP, DINOV2, SAM) in two case studies on machine-learning: (i) elastic modulus of two-phase microstructures based on simulations data; and (ii) Vicker’s hardness of Ni-base and Co-base superalloys based on experimental data published in literature. Our results show the potential of foundational vision transformers for robust microstructure representation and efficient machine learning of microstructure–property relationships without the need for expensive task-specific training or fine-tuning of bespoke deep learning models.
keywords:
Vision transformers, microstructure–property relationships, microstructure representation, machine learning, principal component analysis1 Introduction
Structural alloys represent an important class of materials needed across all critical industries (energy, defense, transportation, infrastructure). Design of structural alloys relies on quantitative understanding of microstructure–property relationships. Computer models capable of capturing these relationships can significantly accelerate materials design endeavors. Machine learning is rapidly emerging as a powerful computational tool with models successfully trained on experiments [1], physics-based simulations [2, 3, 4, 5], or their combinations [6].
Enabling machine learning of microstructure–property relationships in structural materials relies on quantitative description of the microstructure. Robust description of microstructure is a non-trivial task because of the rich diversity of microstructures observable at different length scales and a variety of their aspects (spatial, geometric, statistical) relevant for properties [7]. One strategy is to use geometric descriptors of microstructures (e.g., phase volume fraction, grain size) that are intuitive and familiar from traditional models (e.g., Voigt/Reuss bounds, Hall-Petch relation [8, 9]). Another strategy is to describe microstructures with distribution functions: -point correlations [10, 11], lineal path functions [12], or chord length distributions [13, 14]. This strategy was shown successful for modeling a range of properties based on data from both simulations (e.g, [2, 15]) and experiments (e.g., [1]). A limitation of machine learning with traditional microstructure descriptors is the need to select the most appropriate set of descriptors or distribution functions for each individual property-specific model [16]. Besides geometric and statistical microstructure descriptions inspired by theories, purely data-driven approaches (e.g., CNNs) have also been explored. CNNs for modeling microstructure–property relationships are typically designed and trained from scratch for each specific property of interest [17, 18, 3, 19]. Similarly, training task-specific CNNs and designing their architectures for a variety of microstructure–property relationships is time consuming and computationally expensive.
While most machine learning studies on structural materials focus on task-specific models, research on language modeling and computer vision has undergone a paradigm shift towards task-agnostic foundational models [20]. Foundational models learn representations of high-dimensional data (texts, images) that are advantageously universal for a spectrum of downstream tasks. Modeling with universal features can yield even better results than task-specific neural networks [21]. This progress has been possible with the advent of the transformer architecture [22] and strategies for unsupervised learning from large unlabeled datasets [23, 24, 25]. SAM, CLIP, and DINOV2 are examples of recently developed foundational models in the field of computer vision. All of these models produce rich feature representations of images with a semantic meaning but differ in their unique specialty and pre-training strategy. CLIP focuses on learning multi-modal representations of images and the corresponding captions by maximizing their cosine similarity [26]. SAM allows promptable segmentation through a training process involving both manual and automated mask annotation [27], and DINOV2 utilizes discriminative self-supervised learning between image-level and patch-level features to create task-agnostic representations of images [28]. Given the success of these models on unseen computer vision tasks, materials research could benefit from the adoption and development of foundational models that facilitate learning relationships without task-specific reinvention of architectures, expensive training, or fine-tuning.
In this study, we demonstrate and evaluate multiple pre-trained vision transformers (ViTs) as microstructure feature extractors for machine learning of microstructure–property relationships. We hypothesize that the general-purpose visual features that pre-trained ViTs extract from images can serve as robust microstructure representation for modeling properties without training or fine-tuning the ViTs to any materials data. Using features obtained with the ViTs, we train simple regression-type models that predict engineering properties from the microstructure. We test and evaluate this approach (Section 2) on two case studies: elastic stiffness of synthetic two-phase microstructures learned from simulation data (Section 3.1) and microhardness of Ni-base and Co-base superalloys learned from experimental data (Section 3.2). We additionally explored the incorporation of compositional data as additional features for the experimental dataset of superalloys (Section 3.3).
2 ViT approach to modeling microstructure–property relationships
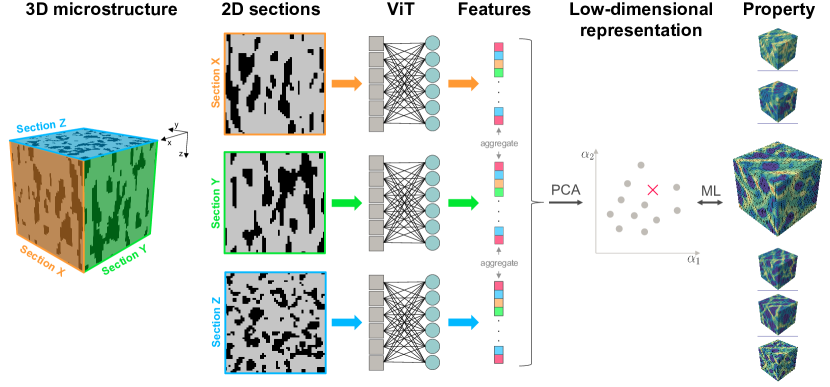
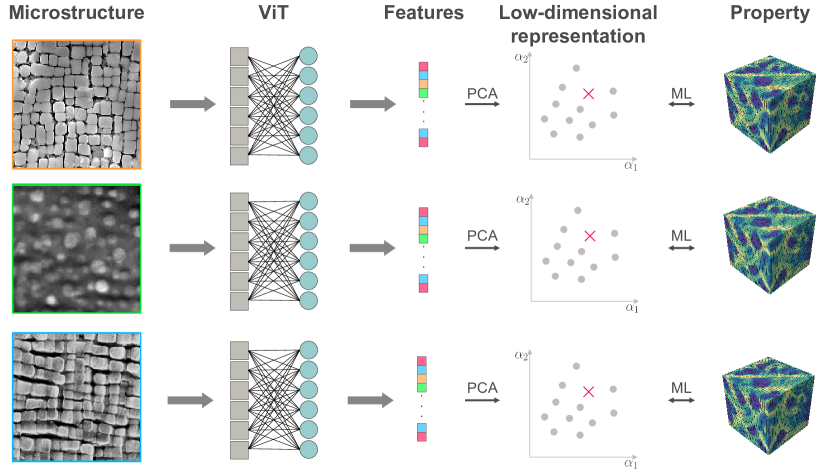
Our proposed approach (illustrated in Figures 6 and 1) utilizes microstructure features from images obtained with pre-trained ViTs for material property prediction. This ViT-based approach involves the following steps:
-
1.
collect training data: microstructure images and their corresponding properties of interest;
-
2.
obtain image-level features with a pre-trained ViT by a “forward pass” of each microstructure image;
-
3.
aggregate features from multiple images if multiple images are available for the same microstructure;
-
4.
reduce the dimensionality of high-dimensional feature vectors;
-
5.
train a lightweight regression-type machine learning model that captures the relationship between microstructure features and the property.
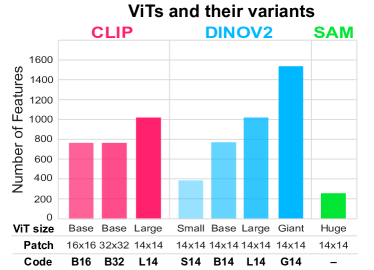
In this work, we test and critically evaluate three state-of-the-art ViTs and their variants (Figure 2): three CLIP variants (base and large with different patch sizes) [26], four DINOV2 variants (small, base, large, and giant with the same patch size) [28] and one SAM variant (huge) [27]. ViTs process images in patches — an elementary unit of the image similar to tokens in language processing [22, 29]. The patch size depends on the ViT and its variant: pixels for SAM and DINOV2; , , or pixels for different CLIP variants. To make microstructure images compatible as input to ViTs, step #2 above includes pre-processing of the images. For DINOV2, the microstructure images are (i) cropped to a width and height that are multiples of the patch size, and (ii) converted to RGB format (for non-RGB images). For CLIP and SAM, which require specific input sizes ( for CLIP and for SAM), the microstructure images are not only cropped and converted to RGB, but also resized via interpolation to the expected input size. Passing the processed images through CLIP or DINOV2 readily produces microstructure feature vectors that we seek for machine-learning microstructure–property relationships. For SAM, an additional mean pooling step is needed to transform the patch-level features into the desired image-level feature vector. If available, multiple images (e.g., orthogonal or oblique 2D sections) from the same microstructure may be individually passed through a ViT followed by aggregation of their features into a single microstructure feature vector. In this work, we explore concatenation and element-wise mean pooling of vectors as two aggregation methods. Depending on the ViT and its size, the feature vectors may be large and contain more than elements (Figure 2). To focus on the most salient features, enable efficient machine learning, and avoid overfitting, we reduce the dimensionality of the extracted microstructure descriptors as part of the overall approach. Different techniques (e.g., UMAP [30], or t-SNE [31]) can be used; here we adopt principal component analysis (PCA) given its successful use with high-dimensional statistical descriptions [15, 2, 32]. Following PCA, we train simple machine learning models (linear, polynomial, support vector machines) using regression to obtain a quantitative relationship between a property of interest and the reduced-order representation of the microstructure.
3 Results
We test and evaluate the proposed ViT framework in two case studies of learning the microstructure dependence of: (i) elastic stiffness of two-phase materials from simulation data and (ii) Vicker’s hardness (HV) from experimental data on Ni-base and Co-base superalloys. For both case studies, we compare simple regression-type models trained on microstructure features (i) obtained with ViTs (as proposed in Section 2); (ii) obtained with a domain-specific CNN [33]; and (iii) represented by two-point correlations [15, 34].
3.1 Case study 1: Young’s modulus of two-phase material (simulations)
Our first case study focuses on machine-learning Young’s modulus of 3D two-phase microstructures. To this end, we leverage a published dataset of two-phase 3D microstructures and their corresponding overall modulus values obtained with finite element simulations [17]. The microstructures consist of a stiff phase and a compliant phase with a stiffness ratio of 50 – a relatively high property contrast, which is generally challenging for traditional models [15, 18].
In this case study, we aim to predict the overall Young’s modulus from three orthogonal 2D sections of the microstructure. First, 2D microstructure images are much more widely accessible than 3D data given the high cost and need in highly specialized and expensive equipment for 3D characterization [35, 36, 37]. Second, 2D microstructure images are readily compatible with pre-trained ViTs, which typically work with 2D images or photographs in the general, non-materials domain of computer vision. Finally, property prediction based on three orthogonal 2D sections of microstructure was recently shown feasible with non-ViT microstructure descriptions [34]. Having three orthogonal sections for each microstructure, we first obtain features for each individual section using a ViT or “benchmark” method. To make the sections compatible with input to ViTs, the binary images are first cropped from size to multiples of the ViT-specific patch size (Figure 2), then converted to RGB by multiplying each binary value by 255 and replicating it across all three RGB channels. For example, for DINOV2 with a patch size of , each section represented as a binary image of 0 and 1 pixels is first cropped to size (42 is a multiple of 14 closest to 51), converted to RGB, and then passed as input to DINOV2 to obtain the corresponding feature vector. To critically evaluate the ViT approach, we additionally calculated two-point correlations and obtained features with a domain-specific CNN as “benchmark” microstructure representations. We calculated two-point auto-correlations for the stiff phase using the Spatial Correlation Toolbox implemented in MATLAB [38] resulting in a microstructure representation consisting of probability values. As a domain-specific CNN, i.e., a CNN “familiar” with microstructures of materials, we adopted a CNN developed for classification of micrographs of multiphase alloys trained on microstructure images [33]. A forward pass of a microstructure image through this pre-trained CNN produces a vector with features.
For all three descriptions (ViT features, two-point correlations, and domain-specific CNN features) we aggregated the three feature vectors from the three sections of each microstructure using either concatenation or mean pooling (see Figure 1). Following aggregation, we carried out PCA for dimensionality reduction of the aggregated features. We treated the number of principal components for machine learning as a tunable hyperparameter.
For training, hyperparameter tuning, and testing, we held out of the dataset as a test set and split the remaining samples into training and validation subsets with an ratio. We trained and compared linear regression (LR) and second-order polynomial regression models (PR) on the training set and used the mean absolute percentage error (MAPE) for the validation set as the error metric to minimize when searching for the optimal number of principal components. Since the number of principal components was our only hyperparameter, we used grid search as the hyperparameter tuning strategy.
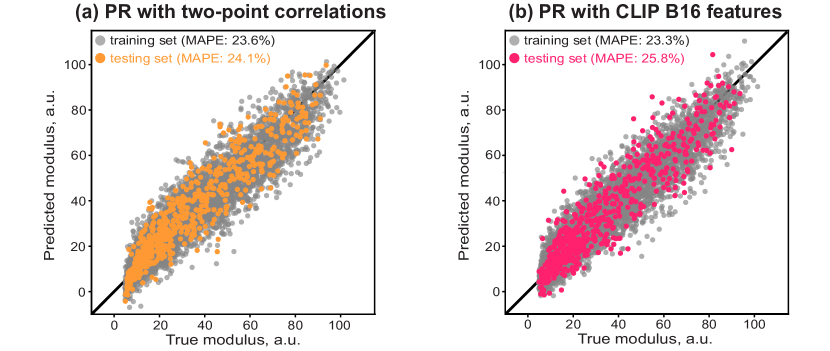
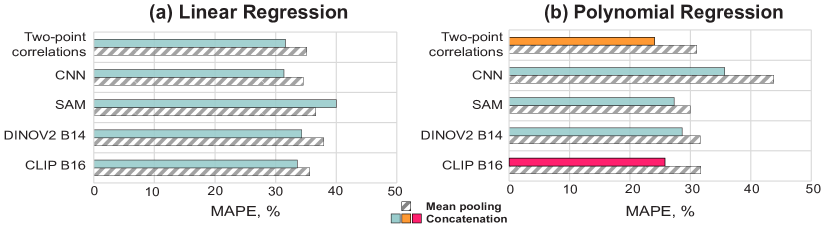
Figure 3 presents the results of the LR and PR models predicting Young’s modulus for the test set unseen during training. The results are shown for the cases of concatenation and mean pooling of features obtained with the ViTs, domain-specific CNN, and two-point correlation calculations. Here we visualize only the best performing variants of CLIP and DINOV2, however, all ViT variants shown in Figure 2 were tested. In almost all cases, concatenation of features for the three 2D sections leads to more accurate regression models compared to aggregation by mean pooling. With the exception of the domain-specific CNN features, the PR models (MAPE below for most cases using concatenation) outperformed all corresponding LR models (MAPE above ) indicating nonlinear relationships between overall Young’s modulus and the microstructure. Among the studied cases, the lowest MAPE of is obtained with a PR model that uses 24 principal components of two-point correlations. PR models trained on the concatenated features extracted by CLIP B16 achieve a slightly higher MAPE value of .
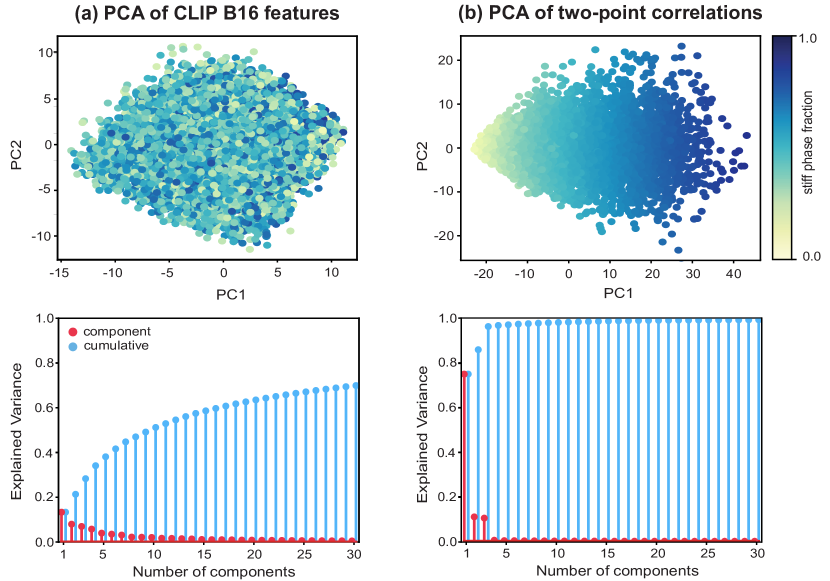
To better understand the microstructure features obtained with the ViTs in this case study, we visualize their low-dimensional representation in terms of the first two principal components from PCA (Figure 5). We focus on the PCA of the best performing CLIP features and compare it with PCA of two-point correlations previously discussed in literature [32, 15]. PCA leads to dense low-dimensional representations without any clusters in both cases of two-point correlations and CLIP features. The most striking difference between the two representations is that the first principal component of the two-point correlations is highly correlated with the volume fraction of the stiff phase, which is not the case for the principal components of the CLIP features. Indeed, the volume fraction steadily increases along the horizontal axis from zero to one (represented by color in Figure 5). The first principal component of the two-point correlation function (highly correlated with the volume fraction of the stiff phase) is also a significantly dominant one, capturing variance in the dataset as seen in the scree plot (Figure 5b). At the same time, the first few principal components are more balanced in terms of the explained variance in the case of the CLIP features (Figure 5a).
3.2 Case study 2: Vicker’s hardness of superalloys (experiments)
In the second case study, we utilized the ViT framework to predict Vicker’s hardness (HV) of Ni-base and Co-base superalloys from their microstructures based on experimental measurements. To this end, we extracted 149 scanning electron microscopy images (SEM) and their corresponding hardness from 19 papers, similar to a recent study using two-point correlations as the microstructure description [1]. Most hardness values in the 19 papers are reported in units. We converted the remaining data (28 values) reported in GPa, to the consistent units using the relationship with denoting the standard gravity [39].
As in the first case study, the experimental (grayscale) images were first pre-processed to the expected input for the ViTs. For instance, to pre-process an experimental image of an arbitrary size we first cropped the image to a square multiple of the patch size, converted to RGB, and, if needed (e.g., for SAM), scaled with interpolation.Following pre-processing, the images are passed through the ViTs to obtain the microstructure feature vectors.
As benchmark representations, we once again calculated the two-point correlations and obtained features from the domain-specific CNN ([33]) for comparison with ViT features. Since the experimental images are grayscale (unlike binary in the first case study), calculation of the two-point correlations of the phases required an additional step of image segmentation. We utilized the OpenCV package in Python [40] with a process described by Khatavkar et al. [1]: (i) convert images from RGB to BGR (expected input to OpenCV functions), (ii) denoise images with a non-local denoising method, and (iii) segment with adaptive thresholding. Following segmentation, we calculated two-point cross-correlation functions for the resulting binary images using the Spatial Correlation Toolbox ([38]). For consistency in two-point correlations obtained for microstructure images of various sizes, we center-cropped the correlation maps to a size corresponding to the smallest microstructure map in our dataset. Finally, we reshaped the correlation maps to -element feature vectors.
With all three types of features, we used PCA for dimensionality reduction and trained three classes of models using LR, PR, and support vector regression (SVR) to obtain the microstructure dependence of microhardness. We additionally tested the SVR model in this case study due to its suitability for machine learning based on small datasets [41, 42]. For the same reasons of limited data (149 samples), we used cross validation to perform hyperparameter tuning and evaluate the performance of the machine learning models [43]. We utilized nested 10-fold cross-validation with grid search to first select the optimal number of principal components followed by re-training and evaluation of the LR, PR, and SVR models.
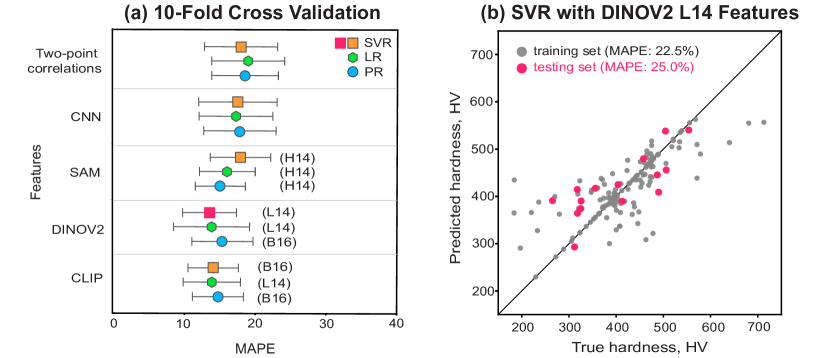
Figure 7 visualizes the 10-fold cross validation results for the LR, PR, and SVR models using ViT features, domain-specific CNN features, and two-point correlations. The results are shown in terms of the mean and standard deviation of MAPE values obtained across different folds. As in the first case study, we visualize the results only for a single, most accurate variant of both CLIP and DINOV2. The SVR model using 34 principal components of the microstructure feature vector obtained with DINOV2 L14 leads to the lowest mean MAPE; the parity plot for this model is shown in Figure 7b. Converse to the results in the first case study, the models based on two-point correlations had the highest mean MAPE in all three regression cases.
3.3 Complementing microstructure description with composition information
Building on the work of Khatavkar et al. [1], we explored improving property predictions by introducing alloy compositions into the model input in addition to the microstructure representations. For our dataset of Ni- and Co-base superalloys, concentrations of 22 elements constitute the compositions. For each set of the microstructure feature vectors (ViT, domain-specific CNN, two-point correlations), we appended the corresponding 22-element composition vectors to form an enhanced alloy representation as input for machine learning models. Following concatenation of the microstructure features and the elemental compositions, we standardized all the combined vectors to have a zero mean and a unit standard deviation. We then carried out PCA and trained the three regression models (LR, PR, and SVR) to capture the dependence of microhardness on both microstructure and composition of the superalloys.
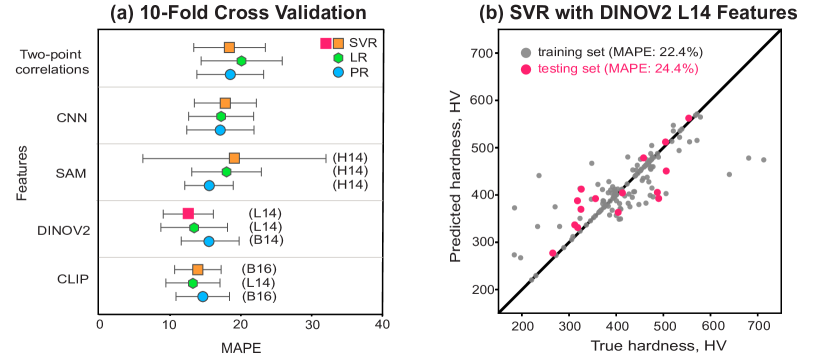
Figure 8 shows the 10-fold cross validation results for the regression models using the new concatenated feature vectors that include both compositions and microstructure features (ViT, domain-specific CNN, and two-point correlations). Overall, the results with the addition of the compositions are similar to those obtained with the microstructure description as the only input (Figure 7). However, some models show slight improvements: e.g., SVR based on DINOV2 L14 features improves mean MAPE by . This SVR model, which uses 49 principal components of DINOV2 L14 features, shows the best overall accuracy in our cross validation (Figure 8). Interestingly, the addition of the compositional information to SAM features results in a significantly large standard deviation of MAPE for an SVR model compared to all other cases (Figure 8a). The discrepancy in this particular case is caused by an outlier MAPE of obtained for one of the folds. This fold includes an alloy with a distinct composition having significantly higher concentrations of boron and silicon compared to all other alloys in the dataset: vs. less than for boron and vs. below for silicon. Without this outlier, the standard deviation for the same machine learning model drops from to , comparable to all other regression results.
4 Discussion
The two case studies presented above tested our hypothesis that foundational ViTs trained on very large datasets of general (non-materials) images can serve as microstructure feature extractors for machine-learning microstructure–property relationships in alloys. Polynomial models of Young’s modulus in two-phase alloys trained on the simulated dataset had comparable accuracy when based on best-performing ViT features and two-point correlations as the microstructure representation with the latter leading to a lower MAPE (Figure 4). The slightly lower accuracy with ViT features could arise from some loss of the microstructure information during image processing for ViT input that includes cropping to the size compatible with the expected ViT input. More advanced pre-processing workflows (e.g., change in resolution by interpolation instead of cropping) that prevent or minimize information loss could improve the accuracy of machine learning models using ViT features.
Even with the simple image processing used in this study, ViT features served as a better microstructure description for machine-learning microhardness as a function of microstructure from experimental data (Figure 7). We attribute this distinct outcome to the difference in the raw microstructure images in the two datasets: the simulation dataset contained binary images, whereas the experimental dataset consisted of grayscale images. While two-point correlations for phases can be readily and accurately calculated for binary (or any discrete) images, the computation of spatial statistics in grayscale images requires an additional step of segmentation. Segmentation of phases in real-world experimental images can be non-trivial, dependent on imaging conditions, and prone to errors [44]. Segmentation errors can negatively impact the calculation accuracy of two-point statistics (as other geometric descriptors [45]) and the corresponding machine learning models. In contrast, ViTs can provide features for non-discrete images without the need for segmentation. The second case study showed the advantage of avoiding the segmentation step and the associated errors: all machine learning models using ViT features outperformed the same models based on two-point correlations (Figure 7). Interestingly, complementing ViT features with compositional information only marginally improved the machine learning models of the microhardness for superalloys (Figure 8 vs. Figure 7). This result suggests that the microstructure implicitly “encodes” compositional effects and the microstructure alone is sufficient for predicting such properties as Vicker’s hardness.
In addition to better accuracy for real-world images and simpler workflows without segmentation, machine learning based on ViT features offer additional benefits of (i) modest requirements to the size of training datasets, and (ii) computational efficiency, when compared to training task-specific deep learning models. The pre-trained ViTs considered in this work provide microstructure features “out of the box”: that is, without training or fine-tuning to any materials-specific data. Trained on very large datasets of natural images, the ViTs have learned universal features, providing the benefits of a deep learning model without the need for large bespoke training datasets. This is especially advantageous for materials science applications with scarcely available training data. Without the need to train a task-specific CNN or fine-tune a ViT, the approach studied here is computationally efficient. For the larger dataset of microstructures, extracting features from the three 2D cross-sections using DINOV2 or CLIP takes between (smaller models) and (larger models) on a consumer-grade laptop (MacBook Air M1 with RAM). Training a task-specific CNN model on the same dataset from scratch was reported to take on a K80 GPU [17]. Only SAM ViT feature extraction requires a comparable (although without a GPU) due to the large input image size of .
While it is not straightforward to readily interpret microstructure features obtained with ViTs or their reduced order representation following PCA, we gained insight by comparing principal components of ViT features with those of two-point correlations (Figure 5). PCA of two-point correlations for microstructures with a wide range of phase volume fractions often leads to a largely dominant first principal component that highly correlates with the volume fraction of the phase for which the two-point autocorrelation is calculated (see Figure 5b and [15]). A principal component that captures a large extent of the the data variance while mostly representing a phase volume fraction may overlook more subtle details of the microstructure such as phase morphology or its spatial configuration. Capturing these details is essential for microstructure-sensitive property models. We found that the first principal component of ViT features was decoupled from the phase volume fraction and the first 30 principal components explained below of the variance in the ensemble of wo-phase microstructures (Figure 5). These characteristics of reduced-order representation of microstructures using principal components of ViT features can serve as a basis of property models with high sensitivity to fine microstructure details.
These results and findings in this study show the potential of machine learning approaches based on robust representations of microstructures independent of the specific material class or specific target properties. The development of materials-focused, yet foundational, ViTs (or other deep learning architectures) could prove even more powerful for universal microstructure description.
5 Conclusions
In summary, we demonstrated the potential of foundational ViTs for feature extraction from microstructure images for supervised learning of microstructure–property relationships. The key idea of this approach is to use pre-trained ViTs to obtain robust microstructure descriptions without training or fine-tuning these ViTs (or any other bespoke deep learning models) for each microstructure dataset or property of interest. Our first case study of ViT features for machine-learning Young’s modulus from simulation data led to the following conclusions:
-
1.
The overall Young’s modulus of two-phase materials can be predicted from microstructure features obtained and aggregated from three orthogonal 2D sections with about error on average for microstructures unseen during training;
-
2.
Concatenation of feature vectors from three orthogonal sections consistently gives better accuracy than aggregation by calculating the element-wise mean of the feature vectors;
-
3.
Among features obtained with three pre-trained ViTs, CLIP features result in the lowest error on a test set, while two-point correlations as a microstructure description leads to a polynomial model with the best accuracy: lower error compared to a polynomial model trained on CLIP features.
-
4.
The PCs of CLIP features are more balanced in terms of explained variance than the PCs of two-point correlations, where the first component captures of the variance in the dataset.
We further draw the following conclusions from the second case study on machine learning of microhardness of superalloys:
-
1.
Machine learning with ViT features leads to better accuracy than comparable models using two-point correlations in all considered scenarios.
-
2.
Unlike the calculation of two-point correlations for phases, microstructure description using ViT features eliminates the need for phase segmentation in experimental images avoiding negative impacts of segmentation errors on the accuracy of property models.
-
3.
An SVR model with DINOV2 features achieves the lowest 10-fold cross validation mean MAPE of (vs. MAPE obtained with two-point correlations and MAPE with domain-specific CNN features).
-
4.
Complementing microstructure descriptions with compositional information leads to overall similar results as machine learning with microstructure only; an SVR model with DINOV2 features appended with alloy compositions reaches a improvement in terms of mean MAPE over the best result without compositional information.
Acknowledgments
SEW acknowledges the support by the National Science Foundation Graduate Research Fellowship Program under Grant No. DGE-2137419. The views and conclusions contained herein are those of the authors and should not be interpreted as necessarily representing the official policies or endorsements, either expressed or implied, of the National Science Foundation.
Code availability
The code for this paper is made available on GitHub https://github.com/materials-informatics-az/MicroPropViT.
Conflict of interest
The authors declare that there is no conflict of interest.
References
- [1] N. Khatavkar, S. Swetlana, A. K. Singh, Accelerated prediction of vickers hardness of co-and ni-based superalloys from microstructure and composition using advanced image processing techniques and machine learning, Acta Materialia 196 (2020) 295–303.
- [2] M. I. Latypov, L. S. Toth, S. R. Kalidindi, Materials knowledge system for nonlinear composites, Computer Methods in Applied Mechanics and Engineering 346 (2019) 180–196.
- [3] O. Ibragimova, A. Brahme, W. Muhammad, D. Connolly, J. Lévesque, K. Inal, A convolutional neural network based crystal plasticity finite element framework to predict localised deformation in metals, International Journal of Plasticity 157 (2022) 103374.
- [4] G. Hu, M. I. Latypov, Anisognn: Graph neural networks generalizing to anisotropic properties of polycrystals, Computational Materials Science 243 (2024) 113121.
- [5] G.-J. Sim, M.-G. Lee, M. I. Latypov, Fip-gnn: Graph neural networks for scalable prediction of grain-level fatigue indicator parameters, Scripta Materialia 255 (2025) 116407.
- [6] D. C. Pagan, C. R. Pash, A. R. Benson, M. P. Kasemer, Graph neural network modeling of grain-scale anisotropic elastic behavior using simulated and measured microscale data, npj Computational Materials 8 (1) (2022) 259.
- [7] S. R. Kalidindi, Hierarchical materials informatics: novel analytics for materials data, Elsevier, 2015.
- [8] E. Hall, Variation of hardness of metals with grain size, Nature 173 (4411) (1954) 948–949.
- [9] N. Petch, Xvi. the ductile fracture of polycrystalline -iron, Philosophical Magazine 1 (2) (1956) 186–190.
- [10] Y. Jiao, F. Stillinger, S. Torquato, Modeling heterogeneous materials via two-point correlation functions: Basic principles, Physical review E 76 (3) (2007) 031110.
- [11] B. L. Adams, T. Olson, The mesostructure–properties linkage in polycrystals, Progress in Materials Science 43 (1) (1998) 1–87. doi:10.1016/S0079-6425(98)00002-4.
- [12] B. Lu, S. Torquato, Lineal-path function for random heterogeneous materials, Physical Review A 45 (2) (1992) 922.
- [13] S. Torquato, B. Lu, Chord-length distribution function for two-phase random media, Physical Review E 47 (4) (1993) 2950.
- [14] M. I. Latypov, M. Kühbach, I. J. Beyerlein, J.-C. Stinville, L. S. Toth, T. M. Pollock, S. R. Kalidindi, Application of chord length distributions and principal component analysis for quantification and representation of diverse polycrystalline microstructures, Materials Characterization 145 (2018) 671–685.
- [15] M. I. Latypov, S. R. Kalidindi, Data-driven reduced order models for effective yield strength and partitioning of strain in multiphase materials, Journal of Computational Physics 346 (2017) 242–261.
- [16] H. Xu, R. Liu, A. Choudhary, W. Chen, A machine learning-based design representation method for designing heterogeneous microstructures, Journal of Mechanical Design 137 (5) (2015) 051403.
- [17] A. Cecen, H. Dai, Y. C. Yabansu, S. R. Kalidindi, L. Song, Material structure-property linkages using three-dimensional convolutional neural networks, Acta Materialia 146 (2018) 76–84.
- [18] Z. Yang, Y. C. Yabansu, R. Al-Bahrani, W.-k. Liao, A. N. Choudhary, S. R. Kalidindi, A. Agrawal, Deep learning approaches for mining structure-property linkages in high contrast composites from simulation datasets, Computational Materials Science 151 (2018) 278–287.
- [19] R. Pokharel, A. Pandey, A. Scheinker, Physics-informed data-driven surrogate modeling for full-field 3d microstructure and micromechanical field evolution of polycrystalline materials, JOM 73 (11) (2021) 3371–3382.
- [20] K. He, H. Fan, Y. Wu, S. Xie, R. Girshick, Momentum contrast for unsupervised visual representation learning, in: Proceedings of the IEEE/CVF conference on computer vision and pattern recognition, 2020, pp. 9729–9738.
- [21] T. Brown, B. Mann, N. Ryder, M. Subbiah, J. D. Kaplan, P. Dhariwal, A. Neelakantan, P. Shyam, G. Sastry, A. Askell, et al., Language models are few-shot learners, Advances in neural information processing systems 33 (2020) 1877–1901.
- [22] A. Vaswani, N. Shazeer, N. Parmar, J. Uszkoreit, L. Jones, A. N. Gomez, Ł. Kaiser, I. Polosukhin, Attention is all you need, Advances in neural information processing systems 30 (2017).
- [23] M. Caron, P. Bojanowski, A. Joulin, M. Douze, Deep clustering for unsupervised learning of visual features, in: Proceedings of the European conference on computer vision (ECCV), 2018, pp. 132–149.
- [24] K. He, X. Chen, S. Xie, Y. Li, P. Dollár, R. Girshick, Masked autoencoders are scalable vision learners, in: Proceedings of the IEEE/CVF conference on computer vision and pattern recognition, 2022, pp. 16000–16009.
- [25] T. Chen, S. Kornblith, M. Norouzi, G. Hinton, A simple framework for contrastive learning of visual representations, in: International conference on machine learning, PMLR, 2020, pp. 1597–1607.
- [26] A. Radford, J. W. Kim, C. Hallacy, A. Ramesh, G. Goh, S. Agarwal, G. Sastry, A. Askell, P. Mishkin, J. Clark, et al., Learning transferable visual models from natural language supervision, in: International conference on machine learning, PMLR, 2021, pp. 8748–8763.
- [27] A. Kirillov, E. Mintun, N. Ravi, H. Mao, C. Rolland, L. Gustafson, T. Xiao, S. Whitehead, A. C. Berg, W.-Y. Lo, et al., Segment anything, in: Proceedings of the IEEE/CVF International Conference on Computer Vision, 2023, pp. 4015–4026.
- [28] M. Oquab, T. Darcet, T. Moutakanni, H. Vo, M. Szafraniec, V. Khalidov, P. Fernandez, D. Haziza, F. Massa, A. El-Nouby, et al., Dinov2: Learning robust visual features without supervision, arXiv preprint arXiv:2304.07193 (2023).
- [29] A. Dosovitskiy, An image is worth 16x16 words: Transformers for image recognition at scale, arXiv preprint arXiv:2010.11929 (2020).
- [30] L. McInnes, J. Healy, J. Melville, Umap: Uniform manifold approximation and projection for dimension reduction, arXiv preprint arXiv:1802.03426 (2018).
- [31] L. Van der Maaten, G. Hinton, Visualizing data using t-sne., Journal of machine learning research 9 (11) (2008).
- [32] S. R. Niezgoda, A. K. Kanjarla, S. R. Kalidindi, Novel microstructure quantification framework for databasing, visualization, and analysis of microstructure data, Integrating Materials and Manufacturing Innovation 2 (2013) 54–80.
- [33] J. Stuckner, B. Harder, T. M. Smith, Microstructure segmentation with deep learning encoders pre-trained on a large microscopy dataset, npj Computational Materials 8 (1) (2022) 200.
- [34] G. Hu, M. I. Latypov, Learning from 2d: machine learning of 3d effective properties of heterogeneous materials based on 2d microstructure sections, Frontiers in Metals and Alloys 1 (2022) 1100571.
- [35] M. P. Echlin, A. Mottura, C. J. Torbet, T. M. Pollock, A new tribeam system for three-dimensional multimodal materials analysis, Review of Scientific Instruments 83 (2) (2012) 023701.
- [36] R. Pokharel, J. Lind, S. F. Li, P. Kenesei, R. A. Lebensohn, R. M. Suter, A. D. Rollett, In-situ observation of bulk 3d grain evolution during plastic deformation in polycrystalline cu, International Journal of Plasticity 67 (2015) 217–234.
- [37] M. D. Uchic, L. Holzer, B. J. Inkson, E. L. Principe, P. Munroe, Three-dimensional microstructural characterization using focused ion beam tomography, MRS bulletin 32 (5) (2007) 408–416.
-
[38]
A. Cecen, S. R. Kalidindi, Matlab spatial correlation toolbox: Release 3.1, Integrating Materials and Manufacturing Innovation 5 (1) (2015) 1–15.
doi:10.5281/zenodo.31329.
URL https://doi.org/10.5281/zenodo.31329 - [39] A. E92-17, Standard test methods for vickers hardness and knoop hardness of metallic materials (2017).
- [40] G. Bradski, The OpenCV Library, Dr. Dobb’s Journal of Software Tools (2000).
- [41] A. J. Smola, B. Schölkopf, A tutorial on support vector regression, Statistics and computing 14 (2004) 199–222.
- [42] B. Mesut, A. Başkor, N. B. Aksu, Role of artificial intelligence in quality profiling and optimization of drug products, in: A Handbook of Artificial Intelligence in Drug Delivery, Elsevier, 2023, pp. 35–54.
- [43] G. James, D. Witten, T. Hastie, R. Tibshirani, J. Taylor, An introduction to statistical learning: With applications in python, Springer Nature, 2023.
- [44] B. Bales, T. Pollock, L. Petzold, Segmentation-free image processing and analysis of precipitate shapes in 2d and 3d, Modelling and Simulation in Materials Science and Engineering 25 (4) (2017) 045009.
- [45] S. E. Whitman, G. Hu, H. C. Taylor, R. B. Wicker, M. I. Latypov, Automated segmentation and chord length distribution of melt pools in complex 3d printed metal artifacts, Integrating Materials and Manufacturing Innovation 13 (1) (2024) 229–243.