Optical investigation of supernova remnant G206.7+5.9
Abstract
The shell-type supernova remnant (SNR) G206.7+5.9 was recently discovered in the radio band with the Five-hundred-meter Aperture Spherical radio Telescope (FAST). The remnant spans about 35 in diameter and exhibits bilateral shells. In this work, we present optical spectra of G206.7+5.9 with the Large sky Area Multi-Object fiber Spectroscopic Telescope (LAMOST), and narrow-band (H and [S ii]) images with the 1-m T100 telescope. The filamentary structure seen in H image shows a clear correlation with the radio emission. We use optical line ratios to determine the physical parameters of G206.7+5.9. The LAMOST spectra reveal large ratios of [S ii]/H (0.611.78) and [N ii]/H (0.631.92) consistent with that expected for a shock-heated SNR. The emission lines [O i] 6300, 6363 detected in the spectra also support the presence of shocks. Electron density () measurements based on the [S ii] 6716/6731 ratio suggest densities between 117 and 597 cm-3. We estimate the pre-shock cloud density () to be approximately 2.613.3 cm-3. We also investigate the archival Hi data and have newly identified an expanding gas motion of the Hi, whose velocity span is approximately 10 km s-1. We conclude that G206.7+5.9 is an SNR exhibiting properties remarkably similar to those seen in Galactic SNRs.
keywords:
ISM: supernova remnants ISM: individual objects: G206.7+5.9 ISM: evolution ISM: structure1 Introduction
Galactic supernova remnants (SNRs) are initially discovered through radio observations. SNRs predominantly emit non-thermal continuum radiation in the radio band, with typical spectral indices of (defined by ) (e.g. Dubner 2017). Currently, there are over 300 confirmed Galactic SNRs listed in catalogs (e.g. Ferrand & Safi-Harb 2012; Green 2024).
Many SNRs have been extensively studied at different wavelengths (e.g. Bamba et al. 2016; Temim et al. 2017; Kothes et al. 2017; Filipović et al. 2023; Araya 2024; Li et al. 2024), providing valuable insights into the physical processes occurring throughout their evolution. A more comprehensive view of the nature and evolution of SNRs is essential for understanding their interaction with the interstellar medium (ISM). For instance, optical filaments form in cooling regions behind the shock front and indicate the presence of shock-heated gas. However, only 30 per cent of Galactic SNRs exhibit optical emissions, typically identified through narrow-band filter imaging surveys (e.g. Mavromatakis et al. 2002; Neustadt et al. 2017; Palaiologou et al. 2022; Bakış et al. 2023; Paylı et al. 2024; Fesen et al. 2024).
G206.7+5.9 was identified as an SNR according to its non-thermal nature by showing steep radio continuum spectra with the Five-hundred-meter Aperture Spherical radio Telescope (FAST) L-band observations and the Effelsberg 11 cm polarization measurements (Gao et al., 2022). The observations showed that G206.7+5.9 has a size of about 35 in diameter with bilateral shells. It contains one shell on the eastern side and two shells on the western side. Using H i observations, they determined an average value of = 4.6 km s-1, indicating a kinematic distance of about 0.44 kpc. This situates G206.7+5.9 within the Local Arm, with an estimated physical size of approximately 27 pc.
The physical properties of G206.7+5.9 and its surrounding environment have not been studied in the other wavelengths. In this work, we investigate optical properties of the south-west (SW) and north-west (NW) parts of G206.7+5.9 using the Large sky Area Multi-Object fiber Spectroscopic Telescope (LAMOST). We also obtain H and [S ii] images of the SW region using the 1-m T100 telescope of TÜBİTAK National Observatory (TUG)111https://tug.tubitak.gov.tr in Türkiye. In the following, Section 2 outlines the optical observations and data reduction. Section 3 presents the analysis and results. In Section 4, we discuss the observational findings, and Section 5 offers our conclusions.
2 Optical observations and data reduction
In this study, we conducted a detailed optical analysis of SNR G206.7+5.9, utilizing data from both LAMOST and the T100 telescope. Our approach integrates medium-resolution optical spectra from LAMOST’s Data Release 9 (DR9) and complementary observations from T100, providing a unique dataset for analyzing the emission lines and physical properties of SNR regions.
Our work emphasizes optical diagnostics through the detection of faint emission lines. This optical analysis allows for the derivation of crucial physical parameters such as electron density and ionization states with greater precision than past efforts limited to a single instrument or wavelength range.
2.1 LAMOST data
LAMOST is a quasi-meridian reflecting Schmidt telescope with an effective aperture of approximately 4 meters and a 5 diameter field of view (FoV) (Cui et al., 2012). It functions in two main observational modes: one is a low-resolution mode, and the other is a medium-resolution mode.
The medium-resolution LAMOST spectra are divided into two channels: the blue channel covers wavelengths from 3700 to 5900 Å, and the red channel ranges from 5700 to 9000 Å. The slit (2/3) has a length of 144 mm and a width of 0.22 mm.
We obtain the processed LAMOST data from the DR9 toward G206.7+5.9. The observations were conducted on November 24, 2020, with an exposure time of 900s and the code pylamost222pylamost is a python interface for accessing these data, supporting both low and medium resolution data queries and file downloads. The main code is pylamost.py, with sample code available in pylamost-test.ipynb. See https://github.com/fandongwei/pylamost has been used to access the LAMOST spectral data.
2.2 T100 data
We performed H and [S ii] imaging of the SW region centred at RA=06h 56m 4367; Dec=+06 44 2706 of G206.7+5.9 with the 1.0 m fully automatic Ritchey-Chrétien T100 telescope on September 27, 2024. The CCD camera consists of pixels, each measuring 15 m 15 m, covering a arcmin2 FoV. The details of the imaging observations are presented in Table LABEL:Table1. We reduced the imaging data with Image Reduction and Analysis Facility (IRAF)333https://iraf-community.github.io/. We began by subtracting the bias and applying flat-field corrections. We cleaned the bad pixels and removed the cosmic rays from the CCD images. Finally, we combined the images and then subtracted the continuum image from the combined image.
| Filter | Wavelength | FWHM | Exposure time |
|---|---|---|---|
| (nm) | (nm) | (s) | |
| H | 656.0 | 10.8 | |
| S ii | 674.0 | 11.2 | |
| Cont. | 551.0 | 88 |
3 Analysis and Results
3.1 Optical images
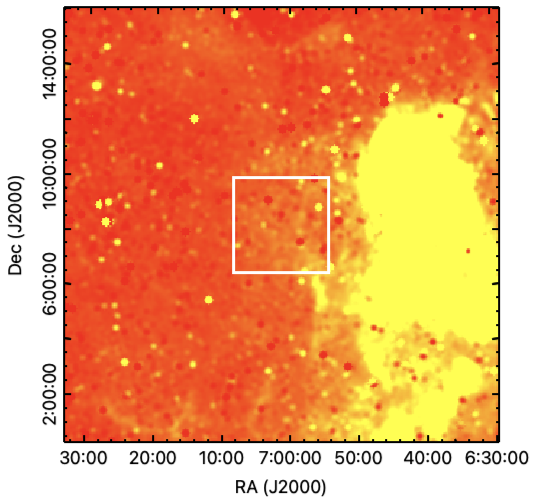
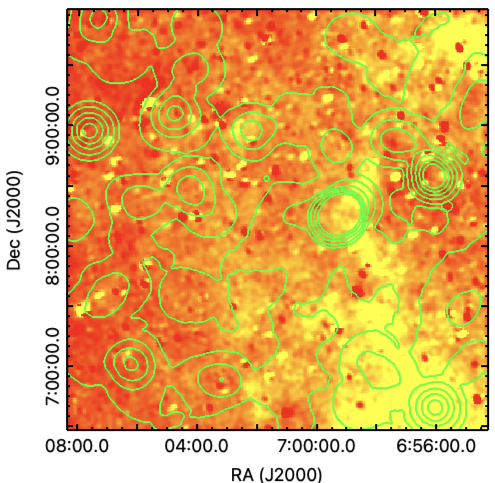
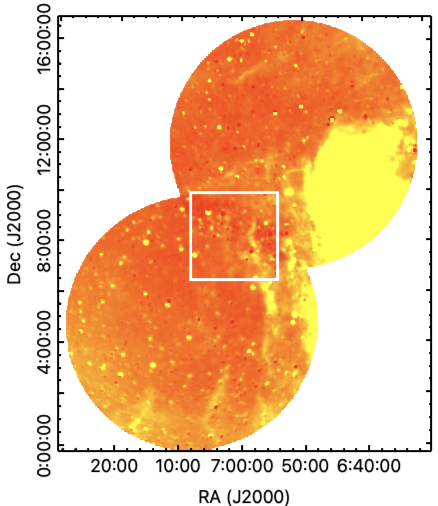
The SNR G206.7+5.9 has a large size in the radio continuum image from FAST given by Gao et al. (2022). To view the entire SNR and its surroundings, we present a map of H emission from the Southern H Sky Survey Atlas (SHASSA; Gaustad et al. 2001) and Virginia Tech Spectral-line Survey (VTSS; Dennison et al. 1998; Finkbeiner 2003) in Fig. 1.
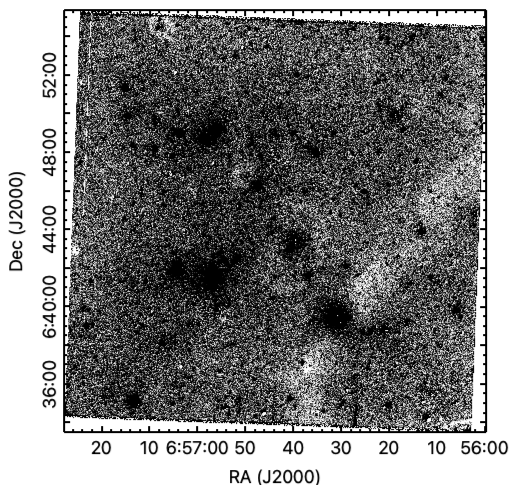
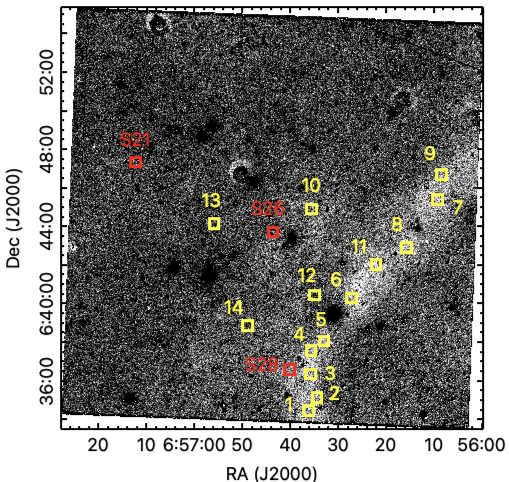
We show the H image of the SW region with T100 telescope in the left panel of Fig. 2. We provide the [S ii]/H image, generated using the imarith command in IRAF, which is displayed in the right panel of Fig. 2. Estimated [S ii]/H ratios and their errors taken from 17 different regions on the image are given in Table 2.
| ID | R.A. (J2000) ; Dec. (J2000) | Ratio |
|---|---|---|
| (h m s) ( ) | ||
| 1 | 06 56 36.2 ; +06 34 26.2 | 0.71 0.02 |
| 2 | 06 56 34.4 ; +06 35 07.9 | 0.66 0.02 |
| 3 | 06 56 35.8 ; +06 36 20.3 | 0.79 0.04 |
| 4 | 06 56 35.7 ; +06 37 32.9 | 0.51 0.01 |
| 5 | 06 56 32.9 ; +06 38 03.3 | 0.65 0.02 |
| 6 | 06 56 27.2 ; +06 40 16.8 | 0.52 0.03 |
| 7 | 06 56 09.2 ; +06 45 23.6 | 0.84 0.02 |
| 8 | 06 56 15.7 ; +06 42 53.0 | 0.93 0.04 |
| 9 | 06 56 08.4 ; +06 46 41.7 | 0.59 0.02 |
| 10 | 06 56 35.6 ; +06 44 53.5 | 0.73 0.02 |
| 11 | 06 56 22.1 ; +06 42 01.5 | 0.58 0.01 |
| 12 | 06 56 35.0 ; +06 40 26.2 | 0.72 0.04 |
| 13 | 06 56 55.9 ; +06 44 08.8 | 0.84 0.05 |
| 14 | 06 56 48.8 ; +06 38 52.1 | 0.67 0.02 |
| S21 | 06 57 12.3 ; +06 47 19.4 | 0.70 0.03 |
| S26 | 06 56 43.6 ; +06 43 42.6 | 0.92 0.02 |
| S28 | 06 56 40.1 ; +06 36 33.9 | 1.15 0.03 |
3.2 Optical spectra
Optical spectra were obtained at ten locations near the SW and NW regions of G206.7+5.9. The slit positions, labelled S30, S29, S28, S26, S23, S22, S21, S34, S53 and S52, are listed in Table LABEL:Table3.
| Slit | R.A. (J2000) ; Dec. (J2000) | Region |
|---|---|---|
| ID | (h m s) ( ) | |
| S30 | 06 58 16.8 ; +07 17 44.6 | SW |
| S29 | 06 57 33.5 ; +07 21 15.4 | SW |
| S28 | 06 56 40.1 ; +06 36 33.9 | SW |
| S26 | 06 56 43.6 ; +06 43 42.6 | SW |
| S23 | 06 57 05.3 ; +06 33 02.0 | SW |
| S22 | 06 57 30.4 ; +06 42 53.3 | SW |
| S21 | 06 57 12.3 ; +06 47 19.4 | SW |
| S34 | 06 57 17.3 ; +06 57 08.3 | SW |
| S53 | 06 54 24.6 ; +09 29 28.3 | NW |
| S52 | 06 54 31.9 ; +09 25 54.7 | NW |
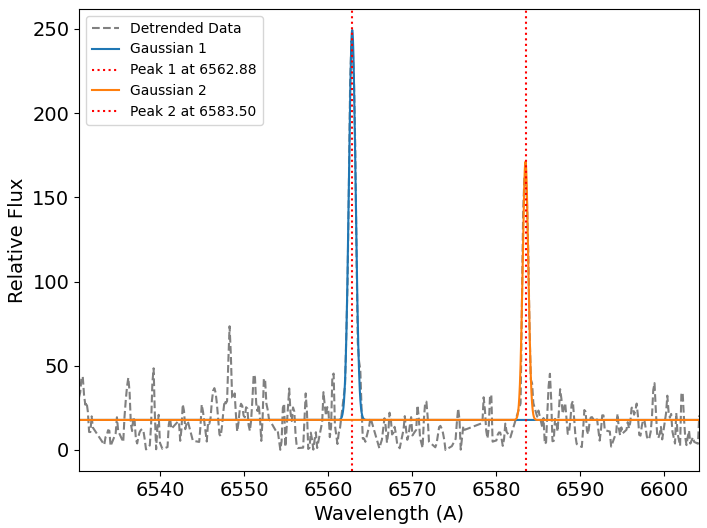
We employed a multi-step fitting approach using Gaussian profiles to analyse the emission lines in the spectra of SNR regions observed by the LAMOST. The spectral data were first pre-processed to remove wave-like fluctuations by fitting and subtracting a polynomial of degree 1-5 depending on the fluctuations, isolating the emission lines for clearer analysis. The user was then prompted to visually select the approximate centers of the emission lines, which served as initial estimates for the Gaussian fitting.
The emission lines were modelled as a sum of Gaussian functions, where the number of Gaussians to be fitted (ranging from 1 to 3) was determined based on the complexity of the spectral region. Each Gaussian function was parameterised by its peak position (central wavelength), width (sigma), and amplitude (flux).
The fitting process was carried out using the curvefit function from the scipy.optimize444https://docs.scipy.org/doc/scipy/reference/optimize.html package, which applies a non-linear least-squares optimization to match the model to the detrended data. The initial parameters for each Gaussian (center, sigma, and amplitude) were derived from the user-selected peaks. This approach allowed for greater flexibility in fitting complex spectral features with multiple overlapping lines.
The uncertainties in the fitted parameters were quantified using the covariance matrix produced by the curvefit routine. The diagonal elements of the covariance matrix were used to compute the standard errors for each parameter (i.e., central wavelength, sigma, and flux). These uncertainties reflect the statistical errors associated with the fitting process and were reported alongside the best-fit values.
For each Gaussian component, the peak position, width, and flux were expressed as follows:
-
•
Peak position (central wavelength):
-
•
Width (sigma):
-
•
Amplitude (flux): A
These values provide both the physical parameters of the emission lines and their associated uncertainties, facilitating the interpretation of line strengths and profiles in the context of the SNR’s physical conditions.
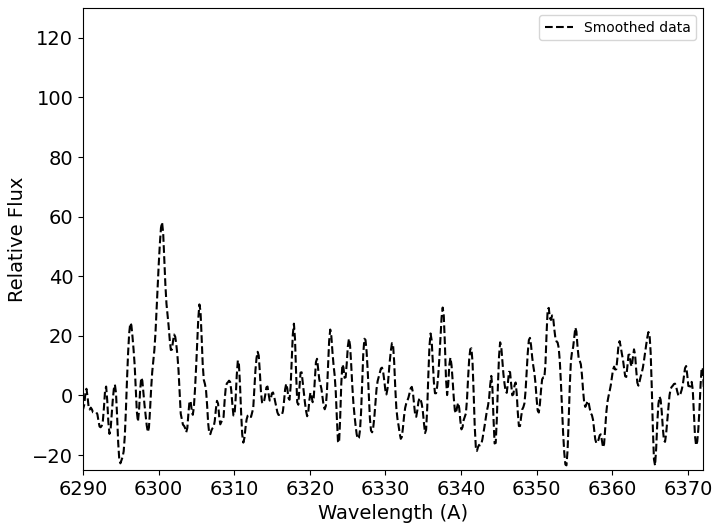
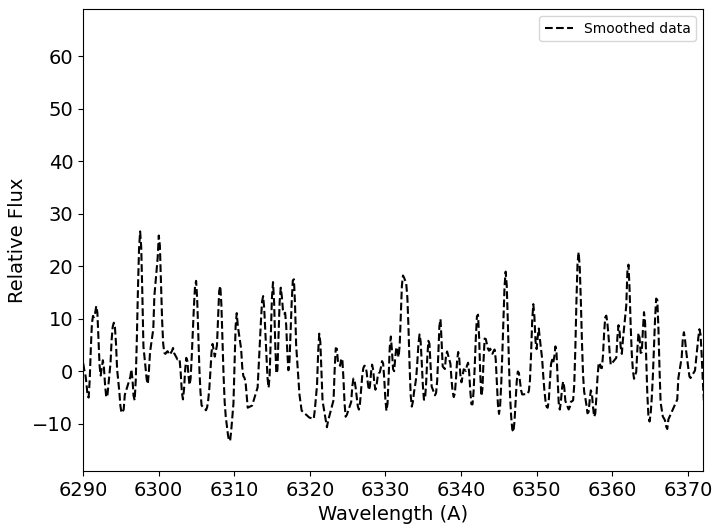
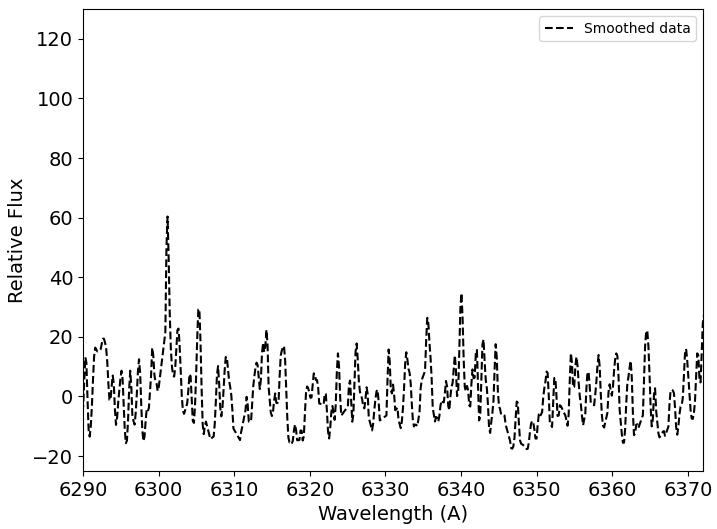
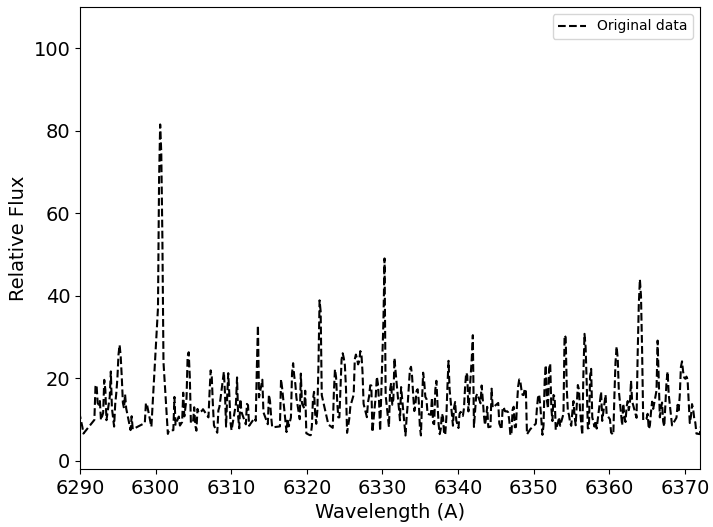
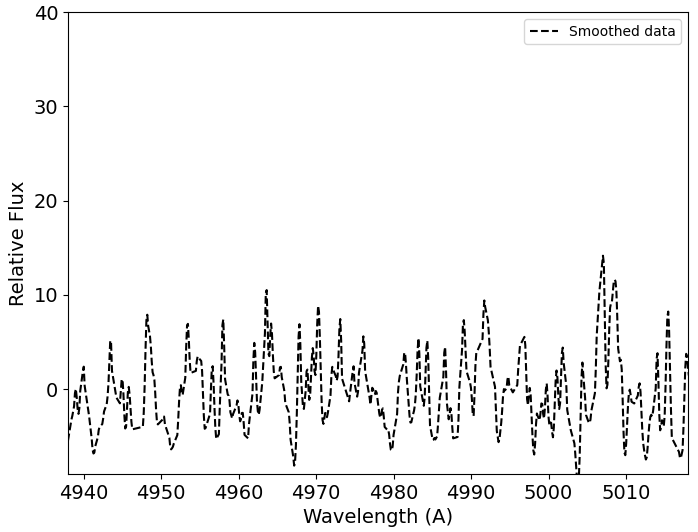
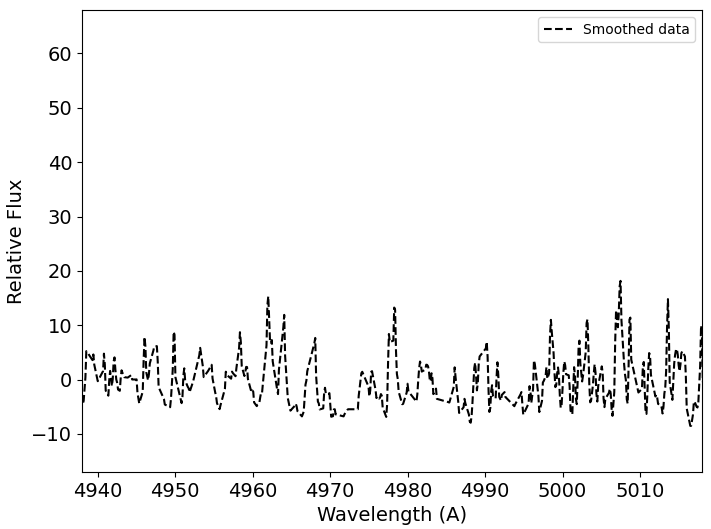
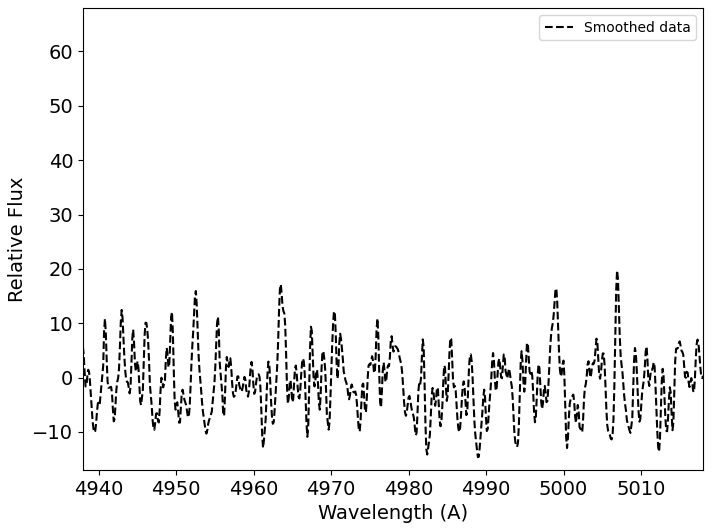
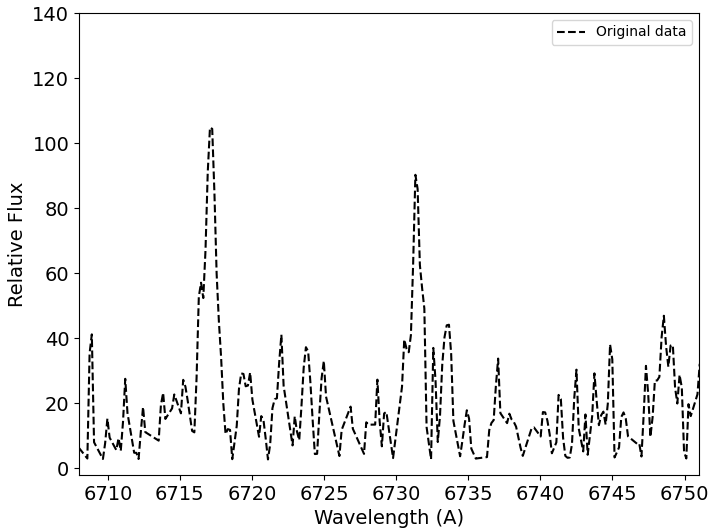
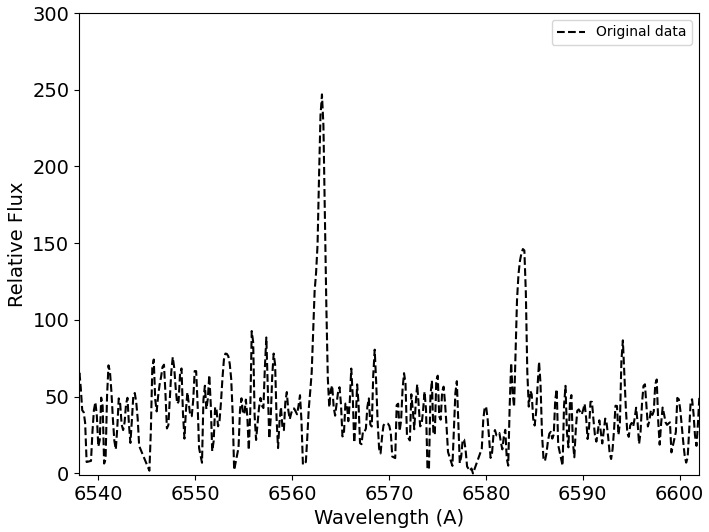
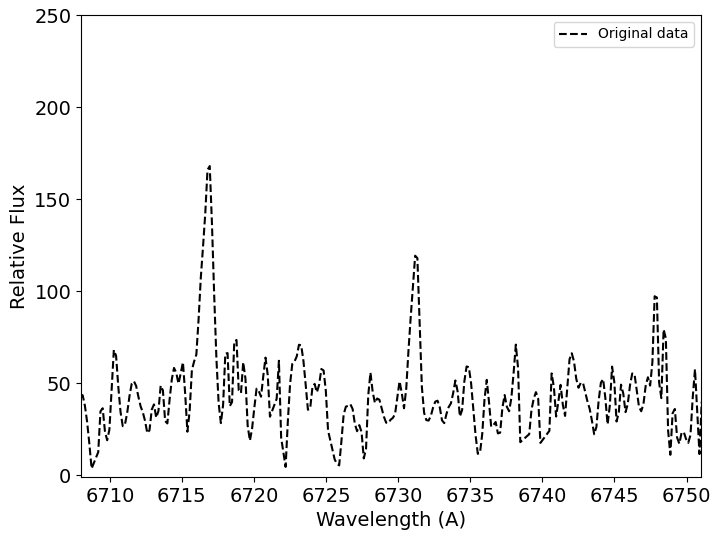
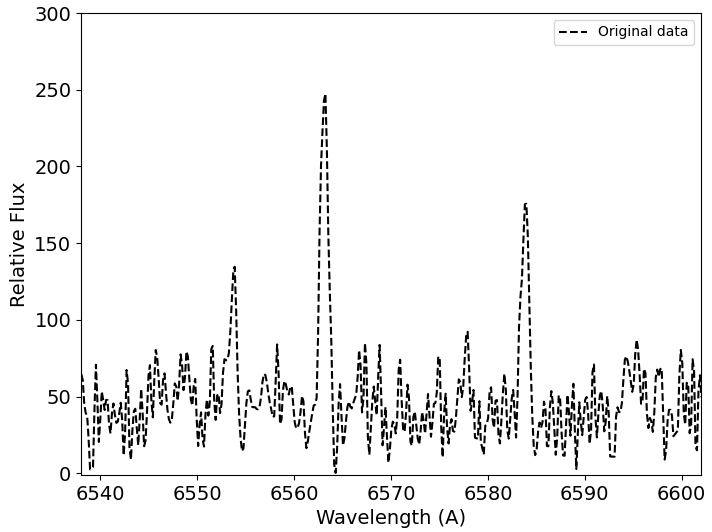
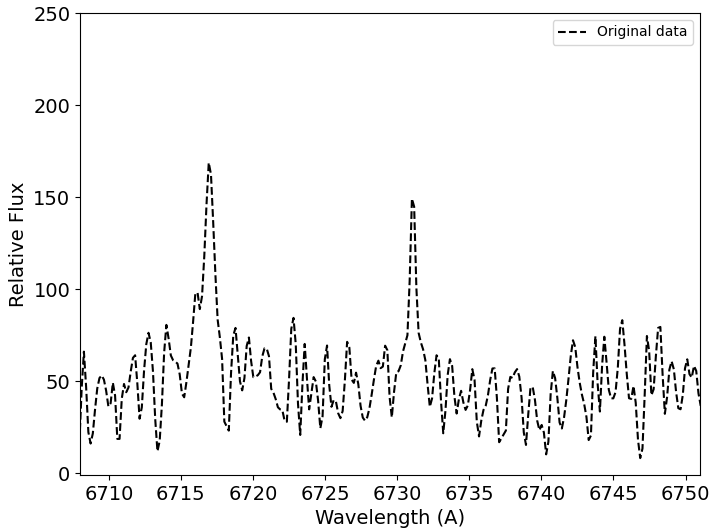
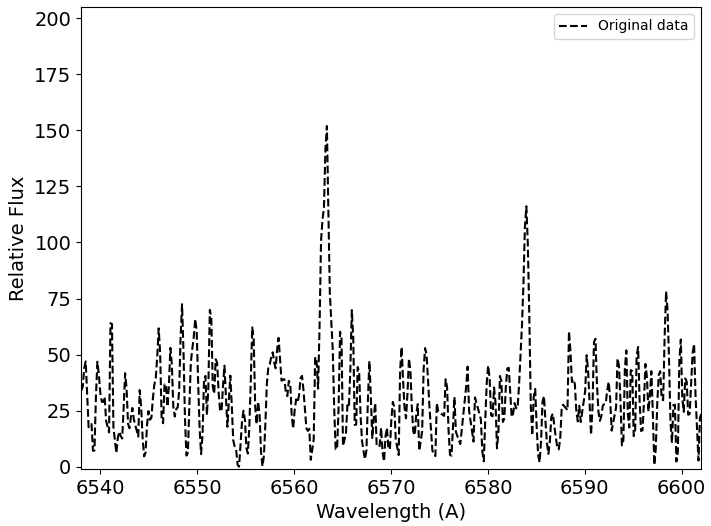
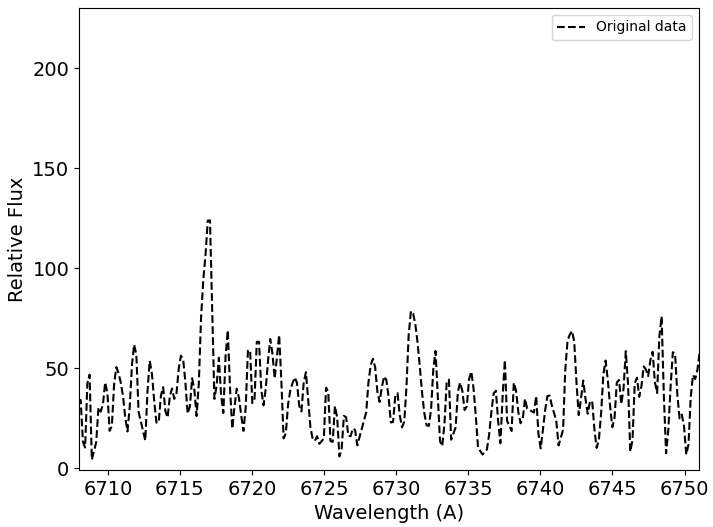
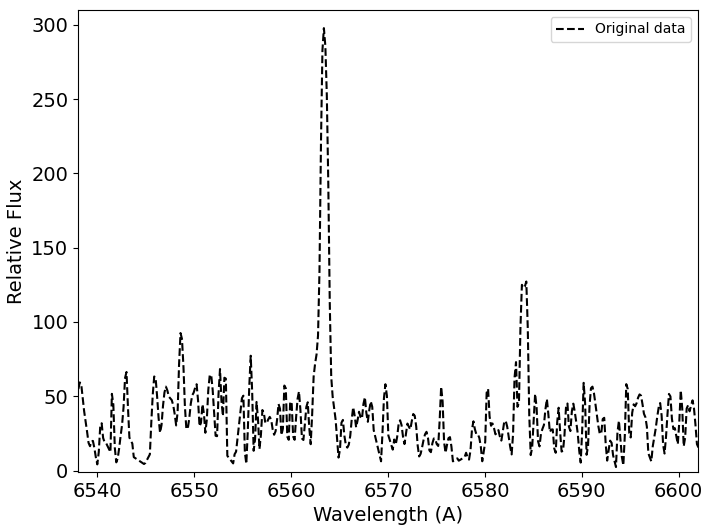
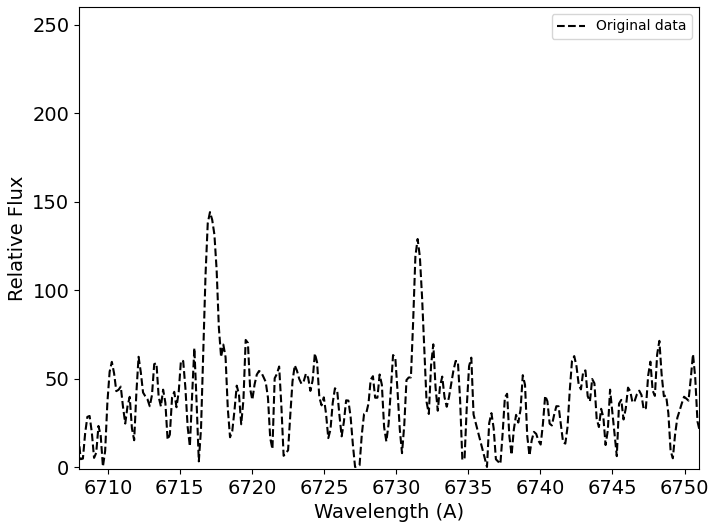
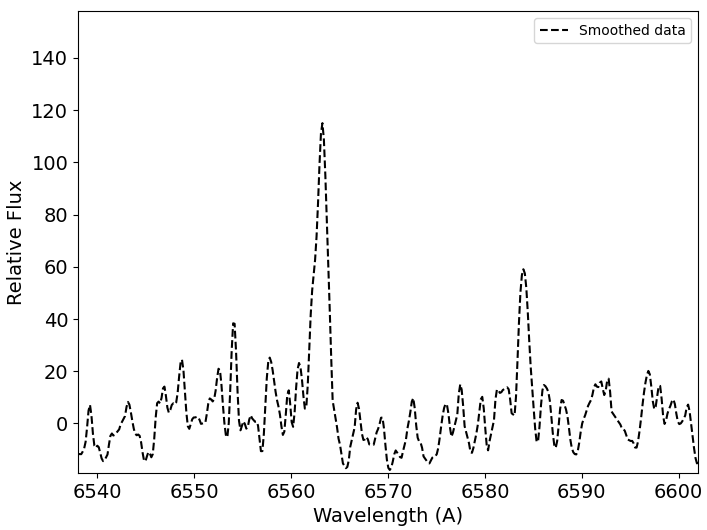
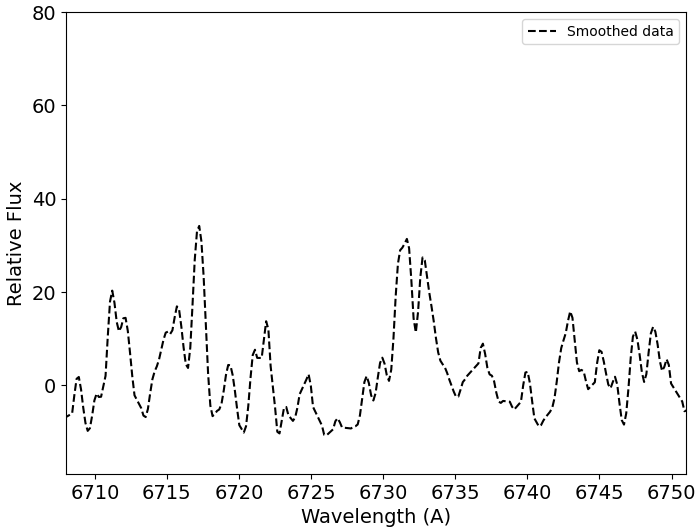
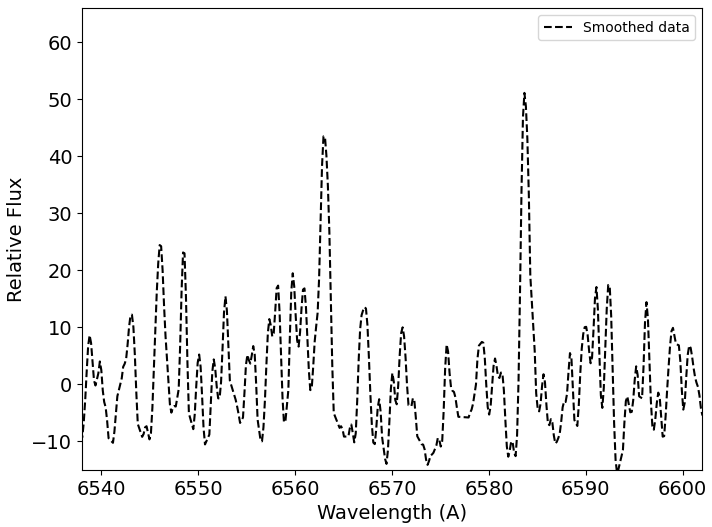
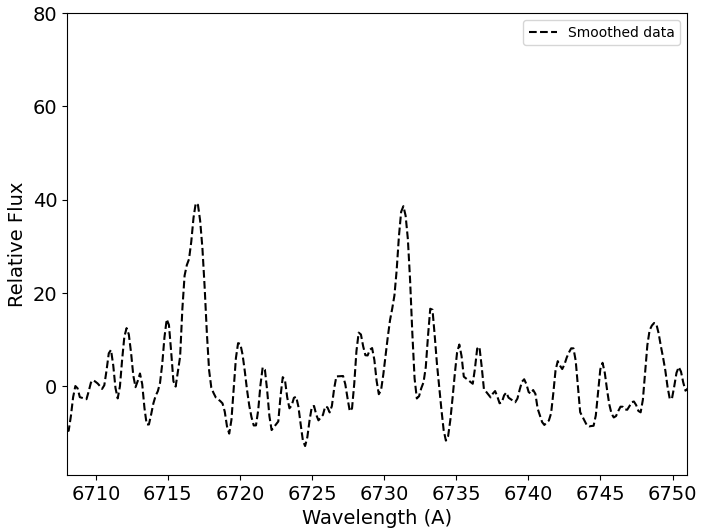
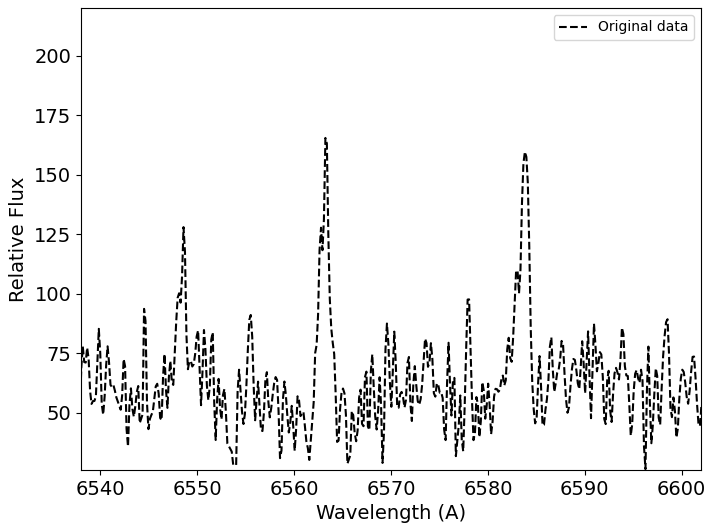
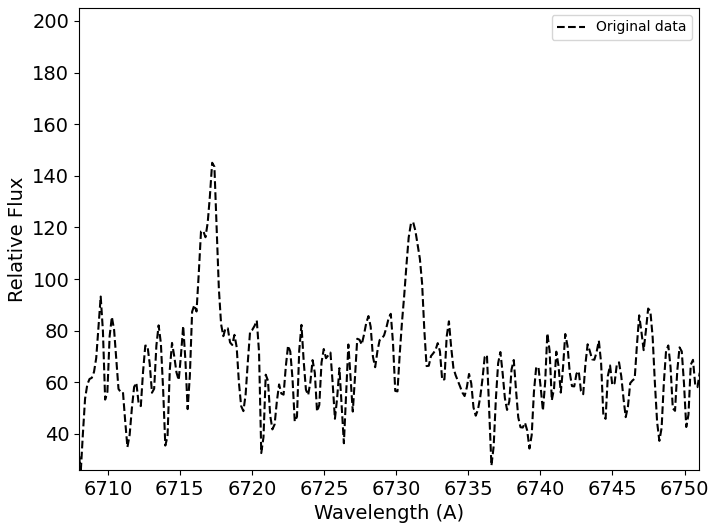
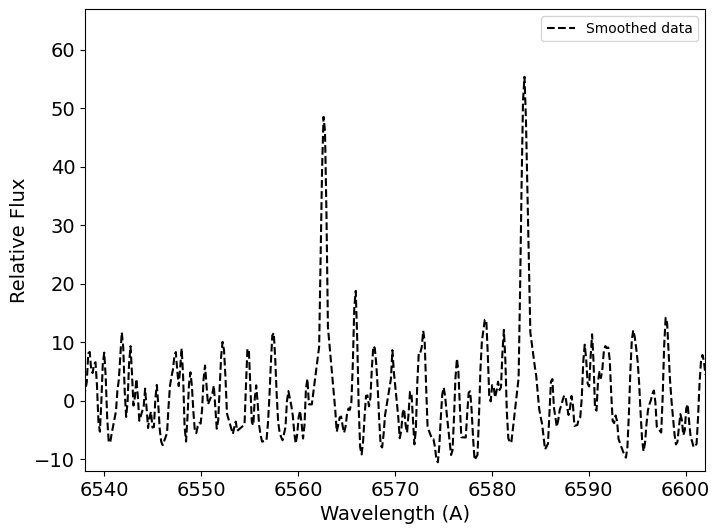
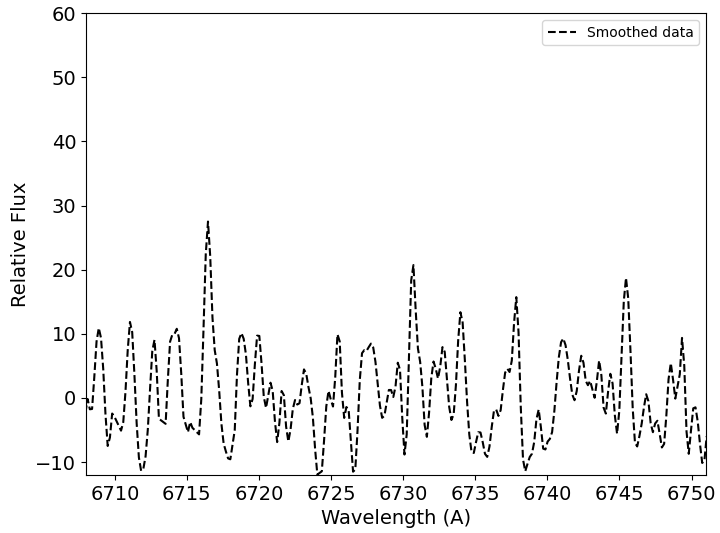
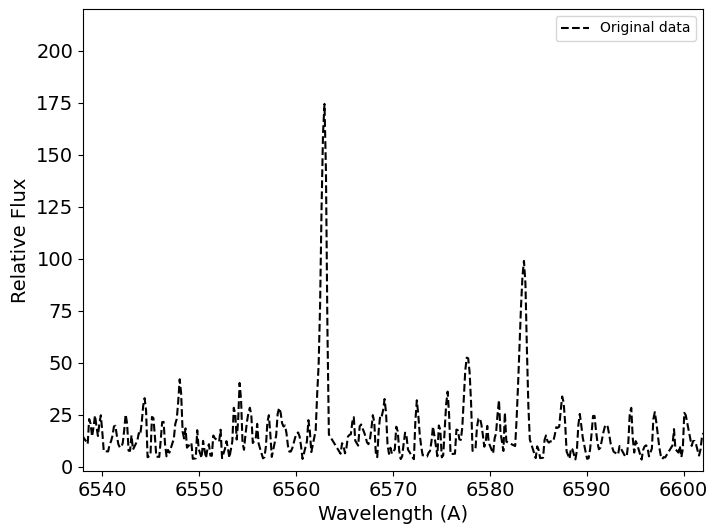
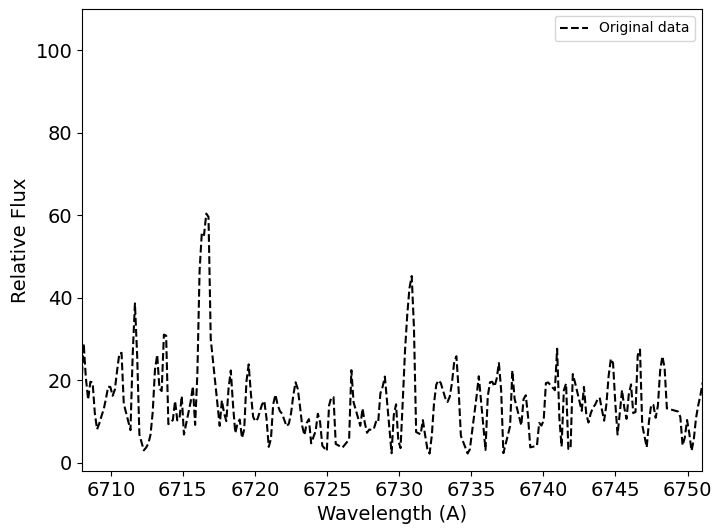
The LAMOST spectra exhibit several significant feature lines, including [O iii]5007, [O i]6300, 6363, [N ii]6548, H6563, [N ii]6584 and [S ii]6716, 6731. The H4861 line is not observed because it falls outside the wavelength range. We presented the spectra in the 65406600 Å and 67106750 Å range in Figs 35. The spectra, including [O iii]5007 and [O i]6300, 6363 emission lines, are shown in Appendix 7. Smoothing was performed for low signal/noise spectra and this was indicated in the related figures. The resulting emission-line measurements, line ratios ([S ii]/H, [N ii]/H, and [S ii] 6716/6731), and electron density () with errors are shown in Table 4.
| S30 | S29 | S28 | S26 | S23 | |
|---|---|---|---|---|---|
| O iii (5007) | 627 | 205 | 101 | ||
| O i (6300) | 402 | ||||
| O i (6363) | |||||
| N ii (6548) | 696 | 411 | 222 | 311 | |
| H (6563) | 1008 | 1005 | 1002 | 1004 | 1005 |
| N ii (6584) | 12312 | 653 | 684 | 424 | 795 |
| S ii (6716) | 928 | 415 | 382 | 493 | 896 |
| S ii (6731) | 868 | 404 | 303 | 422 | 543 |
| [S ii] (6716+6731)/ H | 1.780.02 | 0.800.05 | 0.690.02 | 0.910.02 | 1.420.04 |
| [N ii] (6548+6584)/ H | 1.920.02 | 1.060.01 | 0.900.04 | 0.730.02 | 0.790.01 |
| [S ii] 6716/6731 | 1.080.01 | 1.030.01 | 1.270.06 | 1.170.02 | 1.660.03 |
| Electron density (cm-3) | 5098 | 59730 | 20426 | 33818 | |
| S22 | S21 | S34 | S53 | S52 | |
| O iii (5007) | |||||
| O i (6300) | 351 | 961 | 462 | ||
| O i (6363) | 601 | ||||
| N ii (6548) | 578 | 192 | |||
| H (6563) | 1004 | 1005 | 10011 | 1005 | 1002 |
| N ii (6584) | 703 | 634 | 1068 | 562 | 1374 |
| S ii (6716) | 533 | 673 | 838 | 353 | 597 |
| S ii (6731) | 433 | 502 | 727 | 262 | 538 |
| [S ii] (6716+6731)/ H | 0.970.03 | 1.170.01 | 1.550.02 | 0.610.03 | 1.130.11 |
| [N ii] (6548+6584)/ H | 0.700.01 | 0.630.01 | 1.630.02 | 0.750.01 | 1.370.01 |
| [S ii] 6716/6731 | 1.240.02 | 1.340.01 | 1.150.01 | 1.350.01 | 1.110.04 |
| Electron density (cm-3) | 24310 | 1261 | 3696 | 1171 | 43782 |
3.3 Interstellar gaseous environment
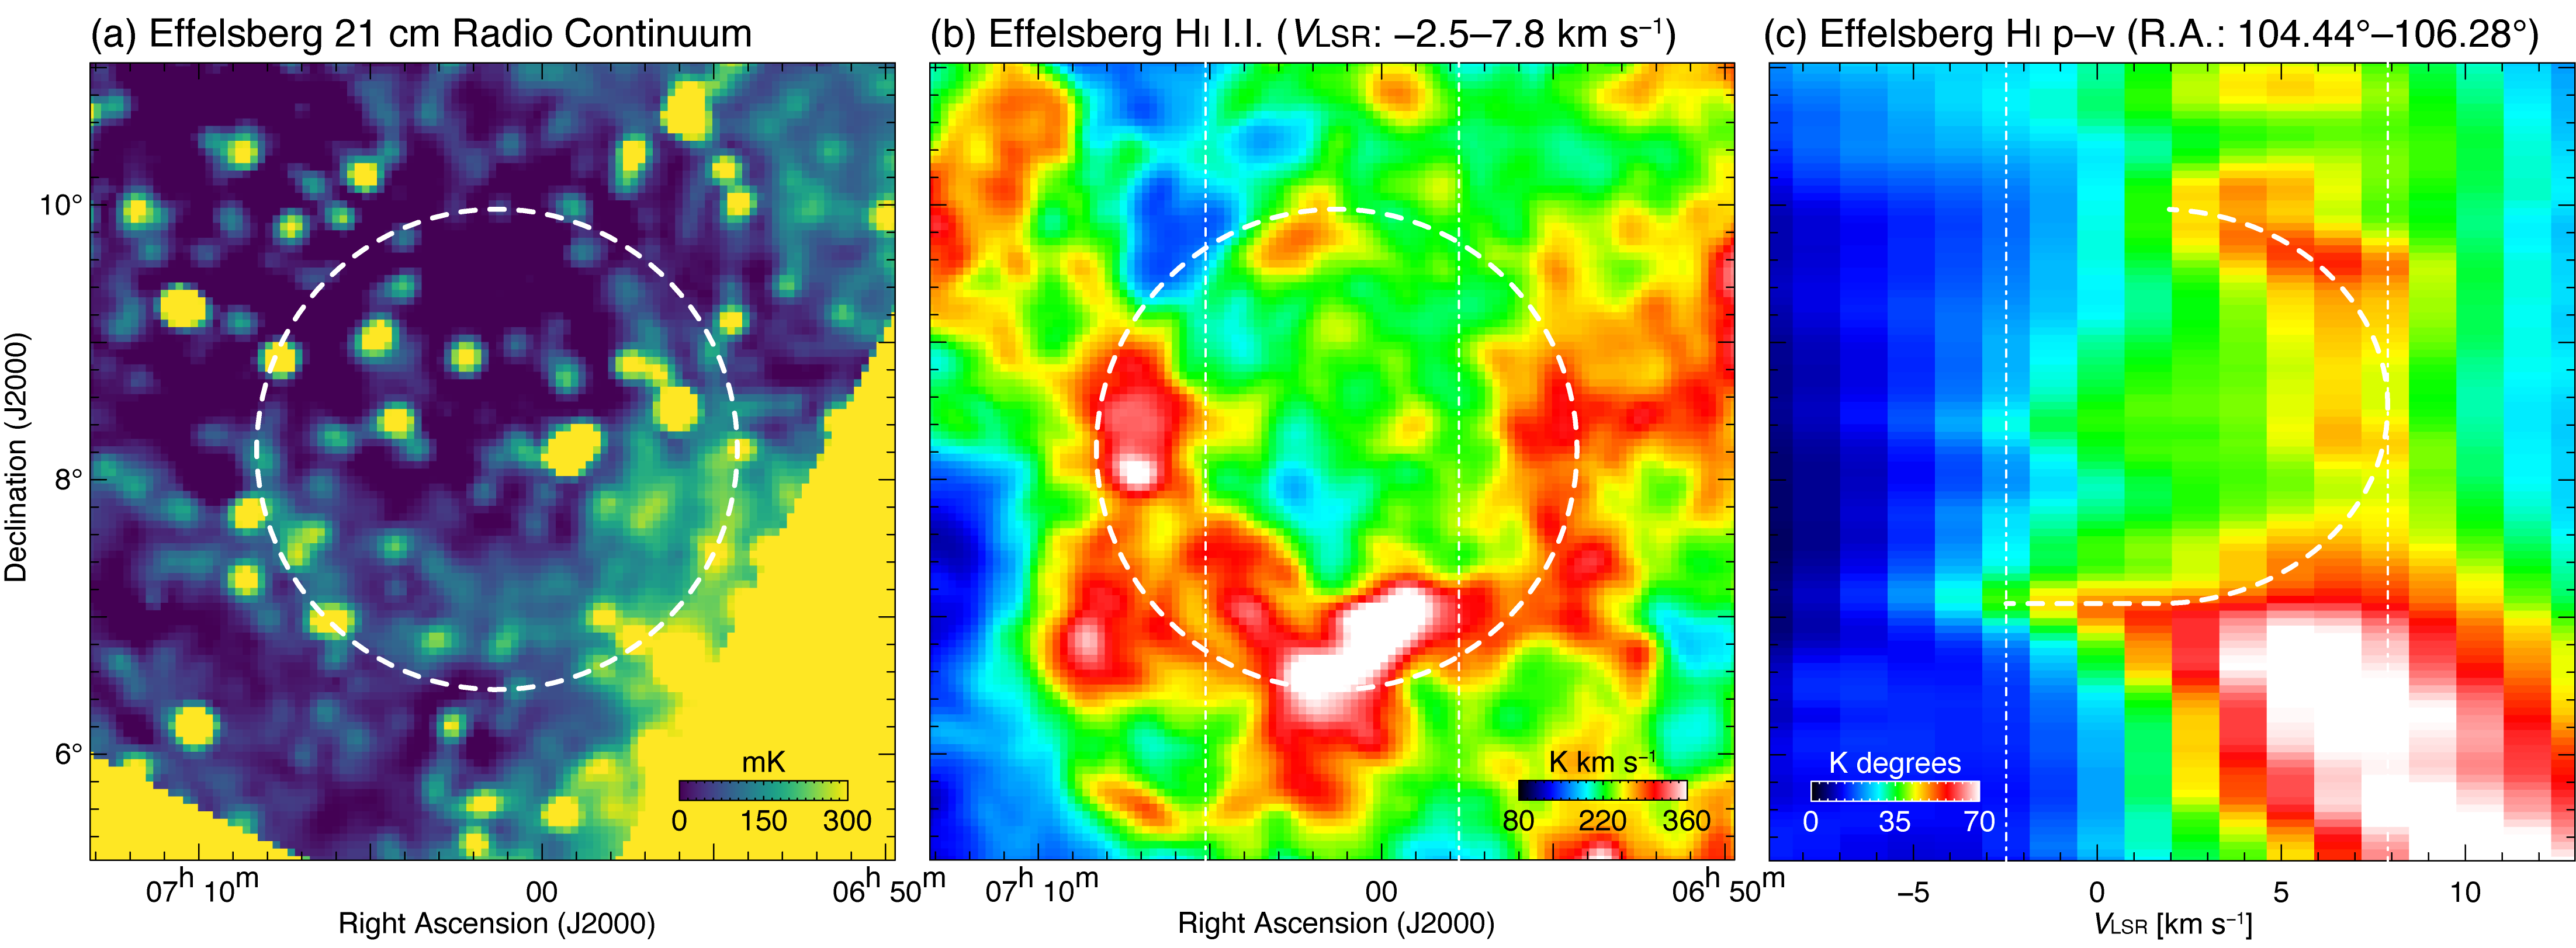
Figs 6(a) and 6(b) show maps of the 21 cm radio continuum and Hi line toward the SNR G206.7+5.9, respectively. The faint arc-like feature of the radio continuum and the obvious Hi shell are seen, which are roughly consistent with Gao et al. (2022). Fig. 6(c) shows the position–velocity (p–v) diagram of Hi. We newly identified an expanding gas motion of the Hi, whose velocity span is approximately 10 km s-1. Since the Declination range of the Hi cavity in the p–v diagram is roughly the same as the shell diameter of the SNR, the expanding gas motion of the Hi was formed by strong stellar winds from the massive progenitor and/or supernova blast waves (e.g., Koo et al., 1990; Koo & Heiles, 1991). In any case, our results are consistent with the scenario by Gao et al. (2022).
4 Discussion
In the following, we present the optical properties of G206.7+5.9 based on our new findings, compare G206.7+5.9 with other large size SNRs, and provide our conclusions regarding its nature.
4.1 Optical properties of G206.7+5.9
We observed the SW region of G206.7+5.9 using the H and [S ii] filters. The emission from this region shows filamentary structure seen in the H image (Fig. 2, left panel). The SHASSA and VTSS images show that there is H emission in a wide area around the remnant. We found a strong correlation between optical and radio emissions along the SNR, indicating that the emissions originate from the SNR shock (see Fig. 1, upper-right panel). The [S ii]/H ratio is the most conventional method used for the optical identification of SNRs (e.g. Fesen et al. 1985). Based on the CCD imaging, we found an average [S ii]/H ratio of approximately 0.74, indicating that the emission primarily originates from shock-heated gas.
Spectra from G206.7+5.9 reveal abundant emission lines (Figs 35). We calculated some line ratios, as shown in Table 4, since the physical parameters of the ionized gas can be determined using the ratios of certain emission lines (Osterbrock & Ferland, 2006). For example; the ratio of the [S ii]6716, 6731 lines can be used to estimate the electron density () and is nearly independent of electron temperature () (Osterbrock & Ferland, 2006). From the [S ii]6716/6731 lines ratio and assuming electron temperature = K, we derived the density of the region of G206.7+5.9. The electron densities between 117597 cm-3 with an average ratio around 327 cm-3. For the slit position (S53), we measured a [S ii]6716, 6731 ratio of approximately 1.35, indicating a density close to the low-density limit ( 117 cm-3). In contrast, the ratio for S29 was estimated to be 1.03, suggesting a much higher electron density (597 cm-3) than at the other slit locations.
The [S ii]/H line ratios from the LAMOST spectra (0.611.78; see Table 4), which are greater than 0.40.5, indicate the presence of shocks. The [N ii]/H line ratios are also generally high (0.631.92). Both ratios rule out any possible confusion with H ii regions.
The detection of [O i] 6300, 6363 emission lines in the LAMOST spectra further supports the presence of shock activity. The [O i] 6300, 6363 lines can be affected by imperfect subtraction of the strong [O i] night sky emission. Principal component analysis (PCA) is a well-established technique that has been applied to sky subtraction in fiber spectroscopy (Bai et al., 2017). Although LAMOST’s PCA-based sky subtraction reduces the average residuals, some emission lines may still be contaminated by residuals (e.g. Seok et al. 2020). Nevertheless, some spectra in our dataset which are obtained in the same observing night do not show any signs of [O i] line suggesting a non-existent or very weak contribution of the night sky emission in this wavelength.
We calculated the pre-shock cloud density 2.613.3 cm-3, assuming a shock velocity 100 km s-1, using the relation
| (1) |
from Dopita (1979); Fesen & Kirshner (1980), where is the electron density (see Table 4). The range of pre-shock cloud densities suggests that the SNR is interacting with a high-density clumpy ISM.
The age of the SNR in the cooling phase () can be estimated using the relation from Falle (1981)
| (2) |
where represents the average explosion energy in units of erg and denotes the pre-shock density in cm-3. By adopting = 0.5 and pre-shock densities of 2.613.3 cm-3, we estimated the range of the SNR age to be (0.61.4) 104 years.
The absorption column density () obtained from the nh tool555https://heasarc.gsfc.nasa.gov/cgi-bin/Tools/w3nh/w3nh.pl is 1.67 cm-2 (Dickey & Lockman, 1990). Using Eq. (9) from Foight et al. (2016), we converted the value to an optical extinction (), resulting in a value of approximately 0.58. Subsequently, using optical extinction datasets666https://explore-platform.eu/sda/g-tomo/ from Lallement et al. (2022), we derived an of 0.1 at a distance 0.44 kpc given by Gao et al. (2022). The difference between the two values obtained using different methods suggests that the distance of SNR exceeds 0.44 kpc.
4.2 Comparisons of G206.7+5.9 and other large-size shell type SNRs
We compared G206.7+5.9 with other larger angular size shell-type Galactic SNRs (from Green’s catalog777https://www.mrao.cam.ac.uk/surveys/snrs/) showing optical emission.
There are some remnants similar to G206.7+5.9. For example, G156.2+5.7 is a large ( arcmin2) SNR, and its H image reveals numerous non-radiative filaments (Katsuda et al., 2016). The optical spectra of the SNR indicate moderately high post-shock densities () of around 200300 cm-3, a pre-shock density () of approximately 10 cm-3, and a [S ii]/H ratio greater than 0.4 (Gerardy & Fesen, 2007).
For the S30, S34, and S52 slit positions, we measured a strong [N ii]6584 line (see Table 4). A similar feature was observed in optical spectroscopic studies of other large shell-type SNRs, such as G279.0+1.1 ( arcmin2) (Stupar & Parker, 2009) and G315.1+2.7 ( arcmin2) (Stupar et al., 2007). According to Kirshner & Chevalier (1980), the observed nitrogen strength is primarily due to the interaction of SNRs with the enriched material in the ISM, which they sweep up, rather than originating from the supernova ejecta itself.
5 Conclusions
In this work, we have investigated the optical properties of the SW and NW regions of G206.7+5.9. The H and [S ii] narrow-band images of the SW region, taken with the 1-m T100 telescope, show filamentary structure. The LAMOST spectra reveal large ratios of [S ii]/H (0.611.78) and [N ii]/H (0.631.92) consistent with that expected for a shock-heated SNR. The [O i] 6300, 6363 line detected in the spectra also support the presence of shocks. The [S ii] 6716/6731 ratios indicate densities ranging from 117 up to 597 cm-3. We concluded that G206.7+5.9 is an SNR with characteristics strikingly similar to those observed in Galactic SNRs.
Future, more detailed multifrequency studies will significantly enhance our understanding of the physical processes in this large Galactic SNR G206.7+5.9. These findings contribute to a more detailed understanding of SNR evolution and their interaction with the ISM.
Acknowledgements
We thank the referee for valuable comments and suggestions that helped to improve the paper. We also thank TÜBİTAK National Observatory for partial support in using T100 telescope with project number 2153. This research was supported by the Scientific and Technological Research Council of Türkiye (TÜBİTAK) through project number 124F089. This work has made use of data products from the Guoshoujing Telescope (the Large Sky Area Multi-Object Fiber Spectroscopic Telescope, LAMOST). LAMOST is a National Major Scientific Project built by the Chinese Academy of Sciences. Funding for the project has been provided by the National Development and Reform Commission. LAMOST is operated and managed by the National Astronomical Observatories, Chinese Academy of Sciences. This work has used the image obtained by the the Virginia Tech Spectral-Line Survey (VTSS), which is supported by the National Science Foundation and by the Southern H-Alpha Sky Survey Atlas (SHASSA), which is supported by the National Science Foundation. This work also has used tools developed as part of the EXPLORE project that has received funding from the European Union’s Horizon 2020 research and innovation program under grant agreement No. 101004214. This work was supported by JSPS KAKENHI grant No. 21H01136 (HS), 24H00246 (HS).
DATA AVAILABILITY
The optical data from the T100 telescope will be shared on reasonable request to the corresponding author. The LAMOST data can be accessed at https://www.lamost.org/dr9/v2.0/.
References
- Araya (2024) Araya M., 2024, A&A, 691, A225
- Bai et al. (2017) Bai Z.-R., et al., 2017, Research in Astronomy and Astrophysics, 17, 091
- Bakış et al. (2023) Bakış H., Bulut G., Bakış V., Sano H., Sezer A., 2023, MNRAS, 521, 1099
- Bamba et al. (2016) Bamba A., Sawada M., Nakano Y., Terada Y., Hewitt J., Petre R., Angelini L., 2016, PASJ, 68, S5
- Condon et al. (1998) Condon J. J., Cotton W. D., Greisen E. W., Yin Q. F., Perley R. A., Taylor G. B., Broderick J. J., 1998, AJ, 115, 1693
- Cui et al. (2012) Cui X.-Q., et al., 2012, Research in Astronomy and Astrophysics, 12, 1197
- Dennison et al. (1998) Dennison B., Simonetti J. H., Topasna G. A., 1998, Publ. Astron. Soc. Australia, 15, 147
- Dickey & Lockman (1990) Dickey J. M., Lockman F. J., 1990, ARA&A, 28, 215
- Dopita (1979) Dopita M. A., 1979, ApJS, 40, 455
- Dubner (2017) Dubner G., 2017, in Alsabti A. W., Murdin P., eds, , Handbook of Supernovae. p. 2041, doi:10.1007/978-3-319-21846-5_91
- Falle (1981) Falle S. A. E. G., 1981, MNRAS, 195, 1011
- Ferrand & Safi-Harb (2012) Ferrand G., Safi-Harb S., 2012, Advances in Space Research, 49, 1313
- Fesen & Kirshner (1980) Fesen R. A., Kirshner R. P., 1980, ApJ, 242, 1023
- Fesen et al. (1985) Fesen R. A., Blair W. P., Kirshner R. P., 1985, ApJ, 292, 29
- Fesen et al. (2024) Fesen R. A., et al., 2024, ApJS, 272, 36
- Filipović et al. (2023) Filipović M. D., et al., 2023, AJ, 166, 149
- Finkbeiner (2003) Finkbeiner D. P., 2003, ApJS, 146, 407
- Foight et al. (2016) Foight D. R., Güver T., Özel F., Slane P. O., 2016, ApJ, 826, 66
- Gao et al. (2022) Gao X., Reich W., Sun X., Zhao H., Hong T., Yuan Z., Reich P., Han J., 2022, Science China Physics, Mechanics, and Astronomy, 65, 129705
- Gaustad et al. (2001) Gaustad J. E., McCullough P. R., Rosing W., Van Buren D., 2001, PASP, 113, 1326
- Gerardy & Fesen (2007) Gerardy C. L., Fesen R. A., 2007, MNRAS, 376, 929
- Green (2024) Green D. A., 2024, arXiv e-prints, p. arXiv:2411.03367
- Katsuda et al. (2016) Katsuda S., Tanaka M., Morokuma T., Fesen R., Milisavljevic D., 2016, ApJ, 826, 108
- Kirshner & Chevalier (1980) Kirshner R. P., Chevalier R. A., 1980, ApJ, 242, L77
- Koo & Heiles (1991) Koo B.-C., Heiles C., 1991, ApJ, 382, 204
- Koo et al. (1990) Koo B.-C., Reach W. T., Heiles C., Fesen R. A., Shull J. M., 1990, ApJ, 364, 178
- Kothes et al. (2017) Kothes R., Reich P., Foster T. J., Reich W., 2017, A&A, 597, A116
- Lallement et al. (2022) Lallement R., Vergely J. L., Babusiaux C., Cox N. L. J., 2022, A&A, 661, A147
- Li et al. (2024) Li J.-T., Lu L.-Y., Mao H., Xia Z.-Q., Chen Y., Zhou P., Zhou X., 2024, A&A, 690, A42
- Mavromatakis et al. (2002) Mavromatakis F., Boumis P., Paleologou E. V., 2002, A&A, 387, 635
- Neustadt et al. (2017) Neustadt J. M. M., Fesen R. A., Black C. S., 2017, MNRAS, 469, 516
- Osterbrock & Ferland (2006) Osterbrock D. E., Ferland G. J., 2006, Astrophysics of gaseous nebulae and active galactic nuclei
- Palaiologou et al. (2022) Palaiologou E. V., Leonidaki I., Kopsacheili M., 2022, MNRAS, 515, 339
- Paylı et al. (2024) Paylı G., Bakış H., Aktekin E., Sano H., Sezer A., 2024, MNRAS, 527, 11685
- Seok et al. (2020) Seok J. Y., Koo B.-C., Zhao G., Raymond J. C., 2020, ApJ, 893, 79
- Stupar & Parker (2009) Stupar M., Parker Q. A., 2009, MNRAS, 394, 1791
- Stupar et al. (2007) Stupar M., Parker Q. A., Filipović M. D., 2007, MNRAS, 374, 1441
- Temim et al. (2017) Temim T., Dwek E., Arendt R. G., Borkowski K. J., Reynolds S. P., Slane P., Gelfand J. D., Raymond J. C., 2017, ApJ, 836, 129
- Uyaniker et al. (1999) Uyaniker B., Fürst E., Reich W., Reich P., Wielebinski R., 1999, A&AS, 138, 31
- Winkel et al. (2016) Winkel B., Kerp J., Flöer L., Kalberla P. M. W., Ben Bekhti N., Keller R., Lenz D., 2016, A&A, 585, A41
Appendix A ADDITIONAL PLOTS
In Fig. 7, we show LAMOST spectra (49405010 Å and 62906370 Å), including [O iii]5007 and [O i]6300, 6363 emission lines.