Observations of the X-ray Millihertz Quasiperiodic Oscillations in Hercules X-1
Abstract
With a systematic timing investigation of the persistent X-ray binary pulsar Her X-1 based on a large number of Insight-HXMT observations between 2017 to 2019, we confirm the presence of X-ray millihertz quasi-periodic oscillations (mHz QPOs) at Hz. By applying wavelet analysis in our data analysis procedures, we firstly identified Hz QPOs coexisting with the Hz QPOs. Wavelet analysis suggests that these QPO features show transient behaviors, frequencies of mHz QPOs evolved in short time scales. There exists a positive relation between QPO centroid frequency (from Hz) and the X-ray luminosity, while the 10 mHz QPO frequencies keep nearly constant for different luminosities, which suggests different physical mechanisms for two types of mHz QPOs. The 10 mHz QPOs in both X-ray and UV bands would have the same origin related to the beat frequency where the Alfvn radius is close to the corotation radius, and the 5 mHz QPOs may originate from magnetic disk precession.
1 Introduction
Hercules X-1 (Her X-1) is a bright persistent X-ray binary pulsar system, which was discovered in 1972 using Uhuru (Tananbaum et al., 1972). This intermediate-mass system hosts a highly magnetized 1.4 neutron star with a 1.24 s spin period in a 1.7-day orbit with its approximately optical companion, HZ Herculis (Reynolds et al., 1997). Similar to X-ray binaries with high-mass companions (HMXBs), this system shows pulsations, and its optical luminosity is primarily driven by the companion’s emission (Vrtilek et al., 2001). The orbit is nearly circular with a high inclination angle of causing a six-hour long eclipse (Staubert et al., 2009).
|
obs ID | 35-day cycle111The counting of 35-day cycle follows the convention proposed by Staubert et al. (1983) |
|
|
|
|
|
||||||||||||
| 2017 July | 01 | 477 | 57935.14 | 57936.95 | 57936.04 | 40 | 0.02 | ||||||||||||
| 2017 August | 02-03 | 478 | 57970.29 | 57971.95 | 57971.12 | 23 | 0.03 | ||||||||||||
| 2018 January | 04-05 | 483 | 58138.92 | 58141.52 | 58140.22 | 55 | 0.88 | ||||||||||||
| 2018 February | 06 | 484 | 58175.44 | 58175.81 | 58175.62 | 10 | 0.89 | ||||||||||||
| 2018 May | 07-12 | 486 | 58243.01 | 58249.04 | 58246.02 | 39 | 0.92 | ||||||||||||
| 2018 June | 13-16 | 487 | 58276.24 | 58279.64 | 58277.94 | 55 | 0.83 | ||||||||||||
| 2018 August | 17-21 | 489 | 58345.05 | 58349.68 | 58347.36 | 16 | 0.83 | ||||||||||||
| 2019 February | 22-25 | 494 | 58517.21 | 58542.68 | 58529.95 | 46 | 0.06 | ||||||||||||
| 2019 May | 26 | 495 | 58556.20 | 58556.72 | 58556.46 | 9 | 0.83 |
The system Her X-1 has been studied in X-rays, optical, and ultraviolet bands (Leahy et al., 2020; Leahy, 2003; Jimenez-Garate et al., 2002). The 35-day cycle is a prominent feature of Her X-1 (Leahy & Igna, 2011), arising from the precession of the accretion disk around the neutron star. This precession periodically obscures the neutron star, resulting in substantial X-ray variability (Petterson, 1975). The superorbital modulation manifests in four distinct phases: an 11-day main-on state characterized by a rapid increase in brightness, variable peak durations, and a gradual decline; an 8-day short-on state; and two intervening 8-day off states, during which the X-ray flux diminishes to nearly zero (Scott & Leahy, 1999). Her X-1 is also remarkable because of the first report of the cyclotron resonant scattering feature in its X-ray spectrum near 40 keV in 1977 with balloon observations (Trümper et al., 1978), implying a magnetic field strength (Xiao et al., 2019).
Another type of variability, known as millihertz quasi-periodic oscillations (mHz QPOs), is observed in HMXBs. Two primary models associated with the inner accretion disk are used to explain mHz QPOs in X-ray pulsars (XRPs): the Beat-Frequency Model (BFM; Alpar & Shaham 1985) and the Keplerian Frequency Model (KFM; Van der Klis et al. 1987). QPOs have been detected in several high-mass X-ray binary (HMXB) pulsars, concentrated in the low-frequency range from 10 mHz to 1 Hz, including 4U 0115+63 (10 mHz, 22 mHz, 41 mHz and 62 mHz; Ding et al. 2021), KS 1947+300 (20 mHz; James et al. 2010), IGR J19294+1816 (30 mHz; Raman et al. 2021), Cen X-3 (40 mHZ; Liu et al. 2022), SAX J2103.5+4545 (44 mHz; Inam et al. 2004), 1A 0535+262 (50 mHz; Finger et al. 1996), V 0332+53 (51 mHz; Takeshima et al. 1994), XTE J1858+034 (110 mHz; Paul & Rao 1998), EXO 2030+375 (200 mHz; Angelini et al. 1989), XTE J0111.2-7317 (1.27 Hz; Kaur et al. 2007; Devasia et al. 2011). However, QPOs in HMXB pulsars are rare and transient phenomena. Even in systems where QPOs have been observed, they are not consistently detected during every X-ray outburst (Paul & Naik, 2011).
Some mHz QPOs of multi-wavelength bands in X-ray pulsars are also reported, which would be more helpful to understand physical mechanism for these mHz QPOs. In transient X-ray pulsar , 48 mHz QPOs were found in both X-ray and optical bands, and the optical QPO is likely caused by reprocessing off the interface of the strongly irradiated companion star of an X-ray QPO (Chakrabarty, 1998). Her X-1 was found to show mHz QPOs in its ultraviolet (UV) continuum at frequencies of and mHz using Hubble Space Telescope, probably emitted on the heated atmosphere of HZ Her (Boroson et al., 2000). A series of low-frequency optical quasi-periodic oscillations (QPOs) with a central frequency near 35 mHz have also been observed with Keck Observatory (O’Brien et al., 2001). Evidence for some excess power at 10 mHz in Her X-1 is possibly interpreted as X-ray QPOs based on RXTE observations in 1996 (Moon & Eikenberry, 2001) and 1998 (O’Brien et al., 2001).
At present, there is still the lack of the solid evidence for X-ray mHz QPOs in Her X-1. In this paper, the light curve of Her X-1 is utilized to search for the millihertz QPOs with Insight-HXMT data from 2017 July to 2019 May. Section 2 describes the observations and data reduction methods. Section 3 provides the details of data analysis, and the QPO results based on the power density spectrum and wavelet methods. We discuss the physical origins of the observed QPOs in Section 4.
2 OBSERVATIONS
The Hard X-ray Modulation Telescope(Insight-HXMT) is the first X-ray astronomical satellite in China (Zhang et al., 2014), launched on 2017 June 15. Insight-HXMT consists of three main instruments: the High Energy X-ray telescope (HE) operating in 20–250 keV with the geometrical area of 5100 cm2 (Liu et al., 2020), the Medium Energy X-ray telescope (ME) operating in 5–30 keV with a geometrical detection area of 952 cm2 (Cao et al., 2020) and the Low Energy X-ray telescope (LE) covering the energy range 1–15 keV with a geometrical detection area of 384 cm2 (Chen et al., 2020).
From 2017 July to 2019 May, Insight-HXMT was triggered with 9 observations, focusing on the main-on states of Her X-1 (from 35d cycle No.477 333The counting of 35d cycles follows the convention used by Staubert et al. (1983): (O–C) = 0 for cycle No. 31 with turn-on near JD 2442410.) with total exposure time of . The zero phase is located at the peaks of the 35-day cycle and the reference time is 53753.1988 derived by Leahy & Wang (2020). Details of those observations are summarized in Table1.
The Insight-HXMT Data Analysis Software (HXMTDAS) v2.04 is used to analyze data (more details on the analysis were introduced in previous publications, e.g., Wang et al. 2021; Zhu & Wang 2024). To take advantage of the best-screened event file to generate the high-level products including the energy spectra, response file, light curves and background files, we use tasks to remove spike events caused by electronic systems and be utilized to select good time interval (GTI) when the pointing offset angle ; the pointing direction above earth ; the geomagnetic cut-off rigidity GeV and the South Atlantic Anomaly (SAA) did not occur within 300 seconds. Tasks helcgen, melcgen, and lelcgen are used to extract X-ray lightcurves with sec time bins.
3 DATA ANALYSIS AND RESULTS
3.1 Power density spectrum
We first carried out background subtraction processes on the extracted light curves obtained from each payload and exposure. Powspec from HEASOFT was employed to calculate the power density spectra (PDS) for the light curves in each observation, using a time interval of 1024 seconds and a corresponding time resolution of 1/128 seconds. We generated PDSs in the energy bands of 1-10 keV for LE data, 10-30 keV for ME data. The data with energy above 30 keV were excluded due to the photon count rate being less than 10 counts/s. The PDSs were averaged and normalized to ensure their integral equals the square of the RMS fractional variability. Subsequently, we identified observations with clear QPO signals.
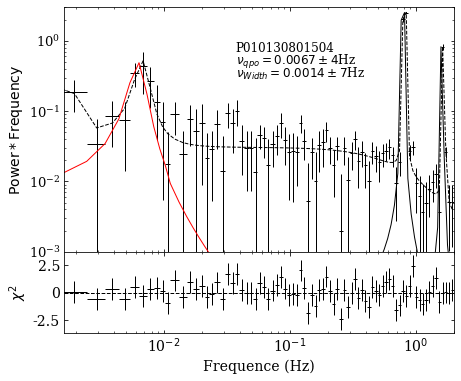
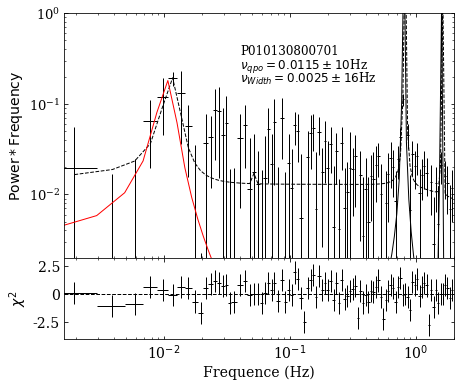
The PDSs can be characterized by a model generally consisting of a broad-band noise, a spin frequency peak at Hz, its harmonic at Hz, and a signature of QPO bump at Hz. To infer the fundamental parameters of the QPO, the PDSs were fitted with multiple Lorentz functions to describe broadband noise, QPO, and two spin components. The fractional root mean square (rms) of the QPO can be summarized as
| (1) |
where S represents the source count rate, R represents the normalization of the QPO’s Lorentzian component, and B represents the background count rate (Bu et al., 2015).
The examples based on the ME observations of P0101308015 and P0101308007 are presented in Figure 1 respectively. The average QPO centroid frequency was determined to be Hz for P01030800701, and Hz for P01030801504. The quality factor (where represents the frequency of the QPO and represents the full width at half maximum; FWHM) is calculated to be and the white noise subtracted RMS value of the QPO in the 10-30 keV is determined to be for the observations. We also test the fitting when excluding the Lorentz function near the 10 mHz QPO feature for the ObsID P010130800701. The value of changed from 84 (80 d.o.f., with the Lorentz function centered at 10 mHz included in the model) to 112 (83 d.o.f., without the 10 mHz Lorentz function).
Due to the short GTIs (less than 800 seconds) in the LE band (1-10 keV) for the observations, the statistical significance of the 10 mHz signal is low. Consequently, we employed wavelet analysis to systematically investigate the millihertz QPO, allowing for the detection of the signal within short time intervals by providing both time and frequency localization, which is particularly advantageous for capturing transient and non-stationary signals that may otherwise be missed by traditional Fourier analysis.
3.2 Wavelet analysis
Wavelet analysis is similar in essence to the Fourier transform as a signal processing technique used to decompose and analyze the frequency components of a time series. However, there are important differences between the two approaches. The Fourier transform assumes the signal is stationary and all-time domain information is lost. On the other hand, the basis functions of wavelet transform are finite in duration and can be scaled and translated, providing a more localized and flexible representation of the signal and therefore can be used to identify when specific frequencies appear in the time series. Torrence & Compo (1998) and the Addison (2017) introduced comprehensive review of wavelet transforms with elaborated step-by-step guide and examples. Consequently, wavelet analysis should be ideal for studying X-ray light curves to analyze the time-varying frequency content. For this work, we used the pycwt 444https://github.com/regeirk/pycwt package to compute the continuous wavelet transform (CWT).
The continuous wavelet transform of a time series is defined as the convolution of the time series with the complex conjugate of the wavelet basis vector:
| (2) |
Here the * means the complex conjugate, the parameters s and n represent the scaling and shifting of the wavelet basis vector . The scaling parameter s in the wavelet transform is similar to the scaling factor in the Fourier transform, as it represents each frequency component. The shift parameter n can be considered as the time, which is not present within the Fourier transform.
To calculate the wavelet power spectrum of a time series, it is necessary to define a wavelet basis vector(mother wavelet). A commonly used wavelet basis Morlet in our case is chosen, and has the following form:
| (3) |
where is a time parameter, and the Morlet wavelet at a central frequency of . means the has not been normalized. To ensure that the wavelet transforms at each scale s are directly comparable to each other and to the transforms of other time series, the wavelet function at each scale s is normalized to have unit energy:
| (4) |
where the properties of can be seen in Table 1 of Torrence & Compo (1998), is the angular frequency (see Equation 5 of Torrence & Compo (1998) for the definition). Using these normalizations, at each scale s satisfy:
| (5) |
Finally, by the convolution theorem, the wavelet transform is the inverse Fourier transform of the product:
| (6) |
where the * means the complex conjugate, is a discrete Fourier transform of time series (). Similar to how the PSD of a time series is determined by the modulus square of the Fourier transform. The wavelet power can be defined as the modulus square of the wavelet transform (Torrence & Compo, 1998). Therefore, the wavelet power spectrum can essentially be interpreted as the modulus squared of the inner product between the time series and the wavelet basis vector for each time-frequency pairing, a diffuse two-dimensional time-frequency graph is eventually displayed as the time index and the wavelet scale change. A more detailed introduction and application of wavelet analysis in X-ray light curve can be found in Ghosh et al. (2023) and Chen et al. (2022).
An important aspect of the wavelet power spectrum is to determine the significance level of QPO peaks in the wavelet spectrum, which can be determined by comparing the peaks in the wavelet power spectrum against the background spectrum. The method based on Torrence & Compo (1998) is outlined to estimate the red-noise background spectrum by the lag-1 autoregressive [AR(1)]. Background spectrum is calculated by multiplying the red-noise spectrum with the value of chi-square distribution, which is determined based on the given significance level (e.g., 0.95) and degrees of freedom. Finally, if a power in the wavelet power spectrum exceeds the 95 confidence level spectrum (i.e., is significant at the 5 level) and is deemed significant relative to the background spectrum. Another important aspect of the wavelet power spectrum is to understand the role of the Cone of Influence (COI), which highlights the region where edge effects are significant.
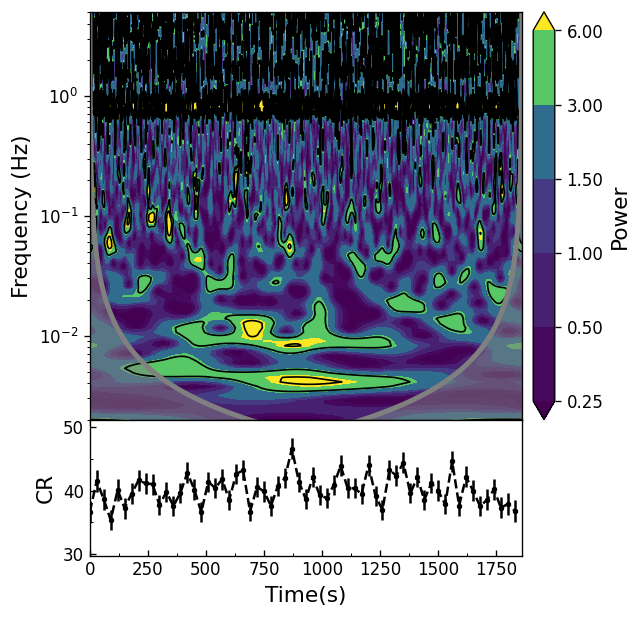
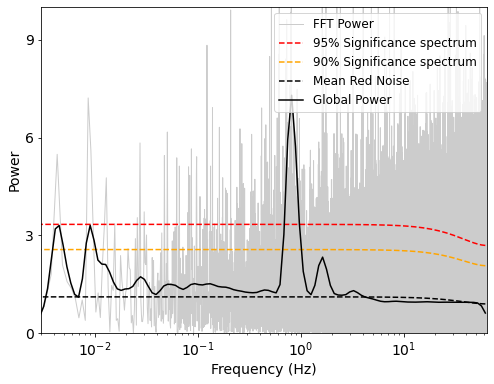
Since large time intervals are presented in nearly all light curves, we selected smooth and long-duration time series for wavelet analysis to improve accuracy. Examples of the most interesting maps have been presented in Figure 2. Results show a prominent QPO peak at mHz, which has also been observed in the ultraviolet (UV; Boroson et al. 2000). In addition, a mHz QPO also appeared in the wavelet power spectrum. The global wavelet power spectrum (by summing up the wavelet power spectra at all times) is presented in Figure 3, which is also compared to the power spectrum of red-noise random processes. We can see that the detection of the transient QPOs in the 1.86-ks long light curve reaches the expected levels of red noise at the 95 significance levels relative to red noise with =0.054. To quantify the QPOs features globally, the central frequency of the QPO, full width in half maximum (FWHM) are calculated and the quality factor(Q-factor) and R-factor are estimated accordingly.
Q factor has been calculated from the ratio of the central frequency to the FWHM:
| (7) |
R factor is the power of the global wavelet spectrum relative to the global 95 confidence spectrum:
| (8) |
For detecting the significant signals for further studies, we select the QPOs with factor greater than 0.9 and GTIs longer than 800 seconds. Therefore, in Table 2 we present detailed information for all QPO signals detected in each observation, including the energy band, exposure time, corresponding orbital phase, luminosity, and properties of 5 mHz and 10 mHz QPOs.
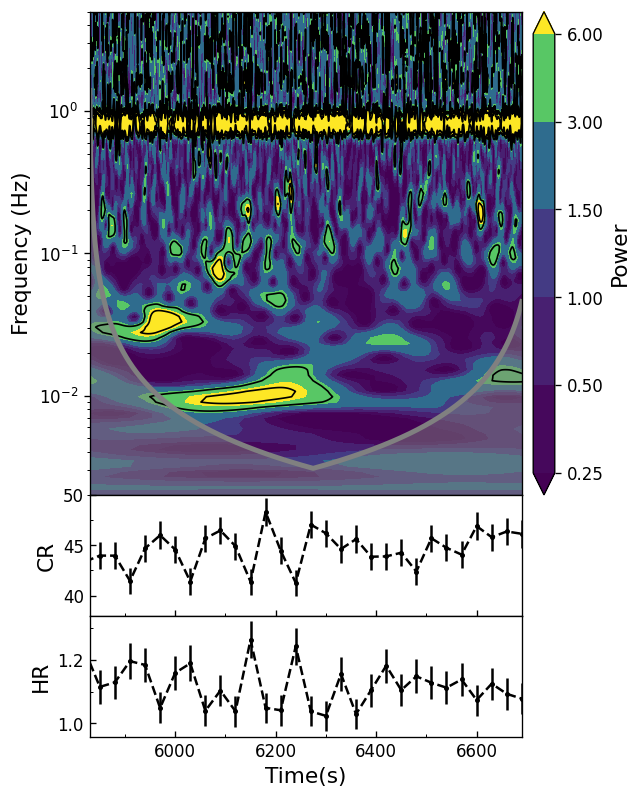
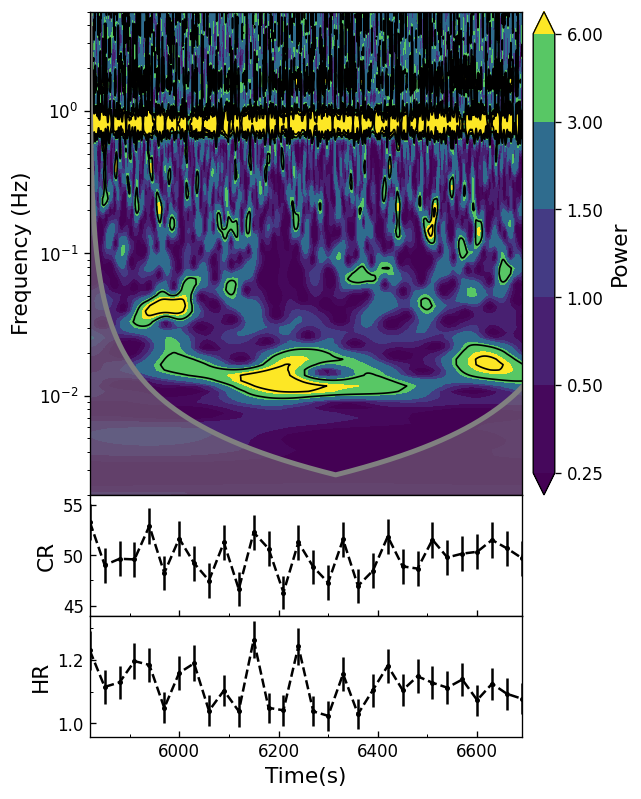
Utilizing the advantage of wavelet analysis to provide detailed time-frequency information, we found that the transient 10 mHz quasi-periodic signals appeared simultaneously in 1-10 keV and 10-30 keV based on the example ObsID (P010130800507) in Figure 4. The wavelet results show some detailed structure of QPO signals in different energy bands for both time and frequency domains. In the early stage, both LE and ME data has a short time scale of an oscillation signal near 40 mHz lasting about 100 s. After this 40 mHz signal disappears, the 10 mHz QPOs appear in both energy ranges with a different behavior. The QPO centroid frequencies in the ME (10-30 keV) are generally higher than that in the LE (1-10 keV). Besides, the mHz QPO of LE maintains a steady frequency around 10 mHz for ObsID P010130800507, while the QPO frequency undergoes significant evolution in ME, it starts around 15–18 mHz in the early stages, gradually decreases to near 10 mHz, and eventually splits into two frequencies around 10 mHz and 20 mHz. The QPOs in both energy bands last about 400 s. In Figure 4, the count rates in LE and ME bands, and the hardness ratio do not show the strong evolution, suggesting that the QPO feature may not be related to luminosity and spectral shapes. A similar energy dependence of QPO frequency is also observed in ObsID P010130800101: the LE data exhibit a transient QPO at 9 mHz for GTIs shorter than 700 seconds, and ME data simultaneously exhibit a transient QPO at 0.014 Hz with the relatively low R factor (, thus not present in Table 2).
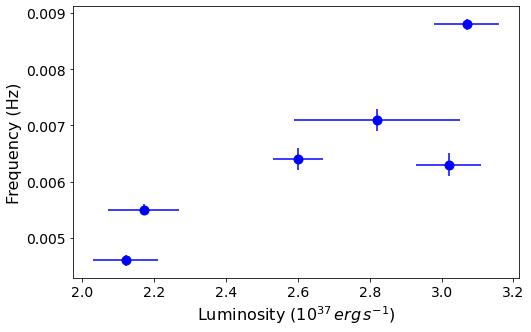
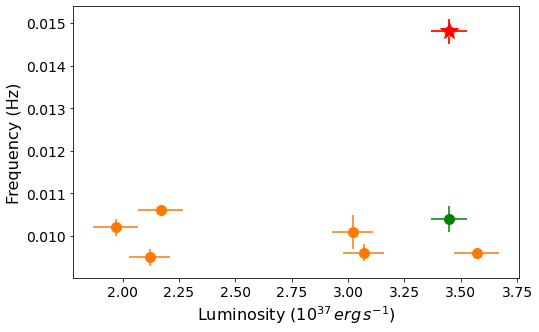
Based on the simple energy spectral fitting with the model of for the available observations, we derive the X-ray luminosity from 2-110 keV (assuming the distance of 6.6 kpc) for each observation, thus we also plot the relationships between luminosity and QPO frequencies derived from ME and LE data in Figure 5. The 5 mHz QPOs exhibit a positive correlation with X-ray luminosity, with the centroid frequency shifting from 5 mHz to 9 mHz as the luminosity increases from to . The 10 mHz QPOs exhibit a nearly stable frequency over luminosity, except for the ObsID 0507 (also see Table 2). The ME data in the ObsID 0507 show an average QPO frequency near 0.015 Hz, with the FWHM reaching approximately 4.5 mHz, nearly twice the average value observed in other observations. In addition, the wavelet analysis suggests that the QPO frequency shows a strong evolution from to 0.010 Hz in ME band, while the QPO frequency in LE band keeps constant at Hz. Therefore, the 10 mHz QPO frequency would be not dependent on luminosity evolution. Since two types of QPOs at and 10 mHz exhibit distinct dependencies on luminosity and approximately equal global wavelet power (see details in Table 2), we infer that different physical mechanisms are responsible for the two types of mHz QPOs.
| ObsID |
|
|
|
|
|
|
|
Q factor | R factor |
|
Q factor | R factor | ||||||||||||||||||
| 0207 | 10-30 | 57971.10 | 1860 | 0.46 | 0.03 | 2.12(9) | 0.0046(1) | 4.18(9) | 0.97(7) | 0.0095(2) | 4.13(17) | 0.95(8) | ||||||||||||||||||
| 0402 | 10-30 | 58139.11 | 1080 | 0.28 | 0.85 | 3.02(9) | 0.0063(2) | 3.71(24) | 0.92(11) | 0.0101(4) | 4.04(8) | 1.22(4) | ||||||||||||||||||
| 0406 | 10-30 | 58139.63 | 840 | 0.59 | 0.86 | 3.07(9) | - | - | - | 0.0096(2) | 4.17(13) | 1.08(8) | ||||||||||||||||||
| 0504 | 10-30 | 58140.69 | 840 | 0.21 | 0.90 | 3.57(10) | - | - | - | 0.0096(1) | 5.05(5) | 1.22(3) | ||||||||||||||||||
| 0507 | 1-10 | 58141.09 | 890 | 0.45 | 0.91 | 3.45(8) | - | - | - | 0.0104(3) | 4.00(16) | 1.02(9) | ||||||||||||||||||
| 10-30 | 58141.09 | 990 | 0.45 | 0.91 | - | - | - | 0.0148(4) | 3.36(14) | 1.07(8) | ||||||||||||||||||||
| 0702 | 10-30 | 58243.21 | 1140 | 0.51 | 0.84 | 3.07(9) | 0.0088(1) | 4.19(9) | 1.43(5) | - | - | - | ||||||||||||||||||
| 0801 | 10-30 | 58244.73 | 1109 | 0.40 | 0.88 | 2.17(10) | 0.0055(1) | 5.00(18) | 1.15(8) | 0.0106(2) | 3.03(11) | 1.00(6) | ||||||||||||||||||
| 0803 | 10-30 | 58244.99 | 1620 | 0.56 | 0.89 | 1.97(10) | - | - | - | 0.0102(1) | 3.45(3) | 0.94(2) | ||||||||||||||||||
| 1303 | 10-30 | 58276.54 | 1620 | 0.12 | 0.79 | 2.60(7) | 0.0064(2) | 2.67(12) | 1.01(6) | - | - | - | ||||||||||||||||||
| 1504 | 10-30 | 58278.66 | 1770 | 0.36 | 0.86 | 2.82(23) | 0.0071(2) | 2.15(12) | 1.09(6) | - | - | - |
4 DISCUSSION
The mHz QPOs have been commonly observed in both transient and persistent populations of accretion-powered X-ray pulsars (Paul & Naik, 2011). This intermediate-mass system Her X-1 shows similar behavior to HMXBs: the presence of highly magnetized neutron stars causes the inner disk radius to extend to approximately 1000 km, leading to Keplerian frequencies in the mHz range. As a result, we can anticipate detecting these X-ray mHz QPOs (approximately 1 mHz–1 Hz, Psaltis 2004) in Her X-1. In the previous section, we have identified mHz X-ray quasiperiodic oscillations around and 10 mHz and periodic pulsations from Her X-1 in both the power density spectrum and wavelet power spectrum. The discovery of X-ray mHz QPOs together with the previous report of UV QPOs in the same source, should be important to understand the physical origin of mHz QPOs in X-ray pulsars. This is unlike mHz QPOs observed in LMXBs, which are connected with some sort of nuclear burnings on the neutron star surface (Lyu et al., 2015). Here, we first aim to present a possible theoretical explanation for the mHz QPOs for Her X-1.
Various models have been proposed to explain the characteristics of mHz QPOs in HMXBs, among which the most widely accepted scenario attributes these oscillations to plasma instabilities generated around the magnetospheric boundary. Two notable models are the Keplerian Frequency Model (KFM; (Van der Klis et al., 1987) ) and the Beat Frequency Model (BFM; (Alpar & Shaham, 1985)). In the KFM, QPOs are generated by inhomogeneities in the inner accretion disc at the Keplerian frequency. Thus, the Keplerian frequency is = . However, the KFM is only applicable when the neutron star’s spin frequency is lower than the Keplerian frequency at the radius at which the QPO-generating inhomogeneity is located due to a faster rotating NS will give rise to centrifugal forces that will inhibit accretion. This scenario explains the case for some of the HMXBs like EXO 2030+375 (Angelini et al., 1989). The QPO frequency due to BFM is the difference between the spin frequency and the Keplerian frequency of the inner edge of the accretion disc, meaning that = -. Additionally, the BFM and KFM is used to explain the mHz QPOs observed for several pulsars (Manikantan et al., 2024), such as IGR J19294+1816 (30 mHz in 0.5-10 keV), V 0332+53 (40 mHz in 0.5-60 keV), XTE J1858 + 034 (180 mHz in 3-25 keV).
Her X-1 has a spin frequency of = 0.8 Hz, and the measured QPO frequency lies at 0.005-0.015 Hz. Since the , the KFM does not apply to this object in this scenario. To examine if the BFM is applicable, which assumes the generation of QPOs at the radius (Ghosh & Lamb, 1979), we obtain a magnetic field strength of with the mass and radius of cm and , respectively. The radius is about to which is also in agreement with the radius of cm estimated for QPO generation based on the BFM.
Subsequently, we attempt to interpret the mHz QPO in Her X-1 as a beat frequency. Due to higher-frequency QPOs being associated with a smaller radius in the accretion flow, an increase in the QPO frequency with higher energies could be expected. Therefore, the mHz QPO observed in the 10–30 keV appears to have a higher frequency in the 1–10 keV occurring in relatively outer regions as seen in Figure 4. Meanwhile, the radius of Her X-1 must be close to the corotation radius, causing the instability of the accretion flow near the boundary with variable inner radius relative to the pulsar, which would lead to fast variations of the mHz QPO in the 10–30 keV.
The 10 mHz X-ray QPOs are also comparable to the previously detected UV QPOs including the centroid frequency, rms amplitude, and Q factor. As noted by Chakrabarty (1998), the identification of the optical/UV QPOs at the same frequency in X-ray band suggests that a considerable fraction of the optical/UV luminosity from the binary system is a direct reflection of the X-ray emission and the optical/UV flux variations most likely originate as a reprocessing of the X-ray emission on the surface of the mass donor and the accretion disk (Middleditch et al., 1981). Therefore, the QPOs detected in both the X-ray and optical/UV bands at the similar frequency may provide a powerful tool for probing geometry of the binary system and physics of the accretion disk.
Two QPOs at and mHz show different behaviors in short time scales based on wavelet results, and have approximately equal global wavelet power (refer to Table 2 for details), then it would be problematic to just attribute the mHz QPOs to the harmonics of mHz QPOs. In addition, the 5 mHz QPO frequency has a correlation with X-ray luminosity, while the 10 mHz QPO has no relation to the luminosity, then the 5 mHz QPOs would have a different physical origin. Another possibility for causing such low-frequency mHz QPOs is the magnetic disk precession model (Shirakawa & Lai, 2002). In this scenario, the inner region of the accretion disk is subject to magnetic torques that can cause warping and precession of the accretion disk. Under typical conditions in X-ray pulsars, these magnetic torques can overcome the viscous damping and enable the instability mode to grow, which may in turn generate mHz QPOs. The QPO precessional frequency as specified by Equation (27) in Shirakawa & Lai (2002) is
| (9) |
where is the accretion disk viscosity parameter, and is the X-ray luminosity in units of erg s-1. Assuming an =0.023 (this choice comes from the model fits carried out by Roy et al. (2019) for the source 4U 0115+63), we obtain a predicted mHz at erg s-1 and the central frequency of the QPO changes to 9 mHz when the source reached an X-ray luminosity of erg s-1. Thus, a positive correlation between QPO centroid frequency and the X-ray luminosity seen in mHz QPOs may imply that the QPO features are caused by this mechanism.
Previously, the precession of the accretion disk in Her X-1 causing its warped edge to temporarily obscure the pulsar and lead to variations in luminosity (e.g., superorbital period) has been a mainstream hypothesis (Brumback et al., 2021). Recent IXPE observations have revealed that the approximately free precession of the modestly asymmetric crust drives the 35-day superorbital period, the spin axis of the crust has shifted relative to the magnetic axis of the neutron star, resulting in a change in the angle between the magnetic axis and the spin axis () within the superorbital period (Heyl et al., 2024). Magnetic torques that induce warping and precession of the disk are finite and vary with the (Lai, 1999). As the crust executes its precessional motion, the torque exerted on the disk by the magnetic field of the neutron star will also vary on the superorbital timescale. Consequently, the precession of the crust excites variations in the dielectric properties of the disk, causing the variation of the precession frequency over the superorbital period. A positive correlation between the QPO centroid frequency and the X-ray luminosity observed in mHz QPOs may provide evidence supporting this mechanism.
5 Summary
We have analyzed the timing characteristics of the persistent X-ray binary pulsar Her X-1 by using the observations for Insight-HXMT from 2017 to 2019. The 10 mHz X-ray QPOs that are comparable to the previously detected UV QPOs from the source are detected in the power density spectrum and wavelet power spectrum. We first identified QPOs at Hz coexisting with the 0.01 Hz QPOs in the light curve of Her X-1 within the 10–30 keV energy band in the wavelet power spectrum. The main findings show that the mHz QPO is positively correlated with luminosity, while the 10 mHz QPO has a nearly constant frequency over luminosity. The 10 mHz X-ray QPOs can be interpreted as a beat frequency in the Her X-1, the radius should be close to the corotation radius, and 10 mHz UV variability comes from the reprocessing of variable X-ray emission. The 5 mHz QPOs have the different origin from the 10 mHz feature, and would be caused by magnetic disk precession.
Acknowledgements
We are grateful to the referee for the suggestions to improve the manuscript. This work is supported by the the NSFC (No. 12133007) and National Key Research and Development Program of China (Grants No. 2021YFA0718503, 2023YFA1607901). This work has made use of data from the Insight-HXMT mission, a project funded by China National Space Administration (CNSA) and the Chinese Academy of Sciences (CAS).
References
- Addison (2017) Addison, P. S. 2017, The illustrated wavelet transform handbook: introductory theory and applications in science, engineering, medicine and finance (CRC press)
- Alpar & Shaham (1985) Alpar, M. A., & Shaham, J. 1985, Nature, 316, 239
- Angelini et al. (1989) Angelini, L., Stella, L., & Parmar, A. 1989, Astrophysical Journal, Part 1 (ISSN 0004-637X), vol. 346, Nov. 15, 1989, p. 906-911., 346, 906
- Boroson et al. (2000) Boroson, B., O’Brien, K., Horne, K., et al. 2000, The Astrophysical Journal, 545, 399
- Brumback et al. (2021) Brumback, M. C., Hickox, R. C., Fürst, F. S., et al. 2021, The Astrophysical Journal, 909, 186
- Bu et al. (2015) Bu, Q.-c., Chen, L., Li, Z.-s., et al. 2015, The Astrophysical Journal, 799, 2
- Cao et al. (2020) Cao, X., Jiang, W., Meng, B., et al. 2020, SCIENCE CHINA Physics, Mechanics & Astronomy, 63, 1
- Chakrabarty (1998) Chakrabarty, D. 1998, The Astrophysical Journal, 492, 342
- Chen et al. (2022) Chen, X., Wang, W., You, B., et al. 2022, Monthly Notices of the Royal Astronomical Society, 513, 4875
- Chen et al. (2020) Chen, Y., Cui, W., Li, W., et al. 2020, Science China Physics, Mechanics & Astronomy, 63, 1
- Devasia et al. (2011) Devasia, J., James, M., Paul, B., & Indulekha, K. 2011, Monthly Notices of the Royal Astronomical Society, 414, 1023
- Ding et al. (2021) Ding, Y., Wang, W., Zhang, P., et al. 2021, Monthly Notices of the Royal Astronomical Society, 503, 6045
- Finger et al. (1996) Finger, M., Wilson, R., & Harmon, B. 1996, Astrophysical Journal v. 459, p. 288, 459, 288
- Ghosh et al. (2023) Ghosh, A., Gallo, L., & Gonzalez, A. 2023, Monthly Notices of the Royal Astronomical Society, 524, 1478
- Ghosh & Lamb (1979) Ghosh, P., & Lamb, F. 1979, Astrophysical Journal, Part 1, vol. 234, Nov. 15, 1979, p. 296-316., 234, 296
- Heyl et al. (2024) Heyl, J., Doroshenko, V., González-Caniulef, D., et al. 2024, Nature Astronomy, 1
- Inam et al. (2004) Inam, S., Baykal, A., Swank, J., & Stark, M. 2004, The Astrophysical Journal, 616, 463
- James et al. (2010) James, M., Paul, B., Devasia, J., & Indulekha, K. 2010, Monthly Notices of the Royal Astronomical Society, 407, 285
- Jimenez-Garate et al. (2002) Jimenez-Garate, M., Hailey, C., den Herder, J., Zane, S., & Ramsay, G. 2002, arXiv preprint astro-ph/0206181
- Kaur et al. (2007) Kaur, R., Paul, B., Raichur, H., & Sagar, R. 2007, The Astrophysical Journal, 660, 1409
- Lai (1999) Lai, D. 1999, The Astrophysical Journal, 524, 1030
- Leahy (2003) Leahy, D. 2003, Monthly Notices of the Royal Astronomical Society, 342, 446
- Leahy & Igna (2011) Leahy, D., & Igna, C. 2011, The Astrophysical Journal, 736, 74
- Leahy et al. (2020) Leahy, D., Postma, J., & Chen, Y. 2020, The Astrophysical Journal, 889, 131
- Leahy & Wang (2020) Leahy, D., & Wang, Y. 2020, The Astrophysical Journal, 902, 146
- Liu et al. (2020) Liu, C., Zhang, Y., Li, X., et al. 2020, SCIENCE CHINA Physics, Mechanics & Astronomy, 63, 1
- Liu et al. (2022) Liu, Q., Wang, W., Chen, X., et al. 2022, Monthly Notices of the Royal Astronomical Society, 516, 5579
- Lyu et al. (2015) Lyu, M., Méndez, M., Zhang, G., & Keek, L. 2015, Monthly Notices of the Royal Astronomical Society, 454, 541
- Manikantan et al. (2024) Manikantan, H., Paul, B., Sharma, R., Pradhan, P., & Rana, V. 2024, Monthly Notices of the Royal Astronomical Society, 531, 530
- Middleditch et al. (1981) Middleditch, J., Mason, K., Nelson, J., & White, N. 1981, Astrophysical Journal, 244, 1001
- Moon & Eikenberry (2001) Moon, D.-S., & Eikenberry, S. S. 2001, The Astrophysical Journal, 552, L135
- O’Brien et al. (2001) O’Brien, K., Horne, K., Boroson, B., et al. 2001, Monthly Notices of the Royal Astronomical Society, 326, 1067
- Paul & Naik (2011) Paul, B., & Naik, S. 2011, arXiv preprint arXiv:1110.4446
- Paul & Rao (1998) Paul, B., & Rao, A. 1998, arXiv preprint astro-ph/9805366
- Petterson (1975) Petterson, J. A. 1975, Astrophysical Journal, vol. 201, Oct. 15, 1975, pt. 2, p. L61-L64., 201, L61
- Psaltis (2004) Psaltis, D. 2004, arXiv preprint astro-ph/0410536
- Raman et al. (2021) Raman, G., Paul, B., & Bhattacharya, D. 2021, Monthly Notices of the Royal Astronomical Society, 508, 5578
- Reynolds et al. (1997) Reynolds, A., Quaintrell, H., Still, M., et al. 1997, Monthly Notices of the Royal Astronomical Society, 288, 43
- Roy et al. (2019) Roy, J., Agrawal, P., Iyer, N., et al. 2019, The Astrophysical Journal, 872, 33
- Scott & Leahy (1999) Scott, D., & Leahy, D. 1999, The Astrophysical Journal, 510, 974
- Shirakawa & Lai (2002) Shirakawa, A., & Lai, D. 2002, The Astrophysical Journal, 565, 1134
- Staubert et al. (1983) Staubert, R., Bezler, M., & Kendziorra, E. 1983, Astronomy and Astrophysics, vol. 117, no. 2, Jan. 1983, p. 215-219., 117, 215
- Staubert et al. (2009) Staubert, R., Klochkov, D., & Wilms, J. 2009, arXiv preprint arXiv:0904.2307
- Takeshima et al. (1994) Takeshima, T., Dotani, T., Mitsuda, K., & Nagase, F. 1994, Astrophysical Journal, Part 1 (ISSN 0004-637X), vol. 436, no. 2, p. 871-874, 436, 871
- Tananbaum et al. (1972) Tananbaum, H. a., Gursky, H., Kellogg, E., et al. 1972, Astrophysical Journal, vol. 174, p. L143, 174, L143
- Torrence & Compo (1998) Torrence, C., & Compo, G. P. 1998, Bulletin of the American Meteorological society, 79, 61
- Trümper et al. (1978) Trümper, J., Pietsch, W., Reppin, C., et al. 1978, Astrophysical Journal, Part 2-Letters to the Editor, vol. 219, Feb. 1, 1978, p. L105-L110. Deutsche Forschungsgemeinschaft, 219, L105
- Van der Klis et al. (1987) Van der Klis, M., Stella, L., White, N., Jansen, F., & Parmar, A. 1987, Astrophysical Journal, Part 1 (ISSN 0004-637X), vol. 316, May 1, 1987, p. 411-426., 316, 411
- Vrtilek et al. (2001) Vrtilek, S., Quaintrell, H., Boroson, B., et al. 2001, The Astrophysical Journal, 549, 522
- Wang et al. (2021) Wang, W., Tang, Y., Tuo, Y., et al. 2021, Journal of High Energy Astrophysics, 30, 1, doi: https://doi.org/10.1016/j.jheap.2021.01.002
- Xiao et al. (2019) Xiao, G., Ji, L., Staubert, R., et al. 2019, Journal of High Energy Astrophysics, 23, 29
- Zhang et al. (2014) Zhang, S., Lu, F., Zhang, S., & Li, T. 2014, in Space Telescopes and Instrumentation 2014: Ultraviolet to Gamma Ray, Vol. 9144, SPIE, 588–595
- Zhu & Wang (2024) Zhu, H., & Wang, W. 2024, The Astrophysical Journal, 968, 106