Highly Variable Quasar Candidates Selected from 4XMM-DR13 with Machine Learning
Abstract
We present a sample of 12 quasar candidates with highly variable soft X-ray emission from the 4th XMM-Newton Serendipitous Source Catalog (4XMM-DR13) using random forest. We obtained optical to mid-IR photometric data for the 4XMM-DR13 sources by correlating the sample with the SDSS DR18 photometric database and the AllWISE database. By cross-matching this sample with known spectral catalogs from the SDSS and LAMOST surveys, we obtained a training data set containing stars, galaxies, and quasars. The random forest algorithm was trained to classify the XMM-WISE-SDSS sample. We further filtered the classified quasar candidates with proper motion to remove stellar contaminants. Finally, 53,992 quasar candidates have been classified, with 10,210 known quasars matched in SIMBAD. The quasar candidates have systematically lower X-ray fluxes than quasars in the training set, which indicates the classifier is helpful to single out fainter quasars. We constructed a sample of 12 sources from these quasars candidates which changed their soft X-ray fluxes by a factor of 10 over 20 years in the XMM-Newton survey. Our selected highly variable quasar candidates extend the quasar sample, characterized by extreme soft X-ray variability, to the optically faint end with magnitudes around . None of the 12 sources were detected in ROSAT observations. Given the flux limit of ROSAT, the result suggests that quasars exhibiting variations of more than two orders of magnitudes are extremely rare.
1 Introduction
The X-ray emission of active galactic nuclei (AGNs) is considered to be largely generated in the accretion-disk corona via inverse Compton scattering of the optical/UV radiation (e.g. Sunyaev & Titarchuk 1980; Yuan & Narayan 2014). Variability of the X-ray emission of AGNs is a useful probe of the underlying nature of the corona and innermost accretion flow encircling the supermassive black hole. X-ray variability from AGNs has been observed over a wide range of timescales from hours to years, with larger variability amplitudes observed on longer time scales. The observed red-noise-like X-ray power spectrum density in AGNs can usually be described by a broken power law, with a slope of -2 at high frequencies and a flatter slope of -1 at lower frequencies (e.g., Uttley et al. 2002; Gonzalez-Martin & Vaughan 2012). The characteristic timescales can be physically linked to AGNs and black hole X-ray binaries, indicating that the accretion process of supermassive black holes in AGNs is similar to that of smaller black holes (McHardy et al. 2006).
The X-ray flux variability amplitude intrinsic to the accretion disk and corona of AGNs typically does not exceed a factor of 2 (e.g., Gibson & Brandt 2012; Middei et al. 2017; Timlin III et al. 2020). Extreme X-ray variations with amplitude exceeding a factor of 10 or more in AGNs are still rare. Strong X-ray variability events have been observed in a few typical type 1 AGNs (e.g. Wang et al. 2022; Mehdipour et al. 2021 ), which were attributed to changes in the column density of the dust-free obscuring material along the observer’s line of sight. High amplitude changes in X-ray flux were also found in a few cases of changing-look AGNs, associated with significant X-ray spectral variability (e.g., Krumpe et al. 2017; Jana et al. 2021; Grupe et al. 2015; Ai et al. 2020; Liu et al. 2020; Yang et al. 2023). This extreme X-ray variation can be interpreted in the scheme of destruction and re-creation of the inner accretion disc and corona. In the case of AGN 1ES 1927+654, the extreme X-ray variation can also be explained between the interactions of the accretion disc and debris from a tidally disrupted star (Ricci et al. 2020; Cao et al. 2023).
Strong and sometimes rapid X-ray variability has been observed in some narrow-line Seyfert 1 galaxies (NLS1s), which are considered to have high or even super-Eddington accretion rates (e.g., Reeves & Braito 2019; Boller et al. 2021; Parker et al. 2021; Jin et al. 2023). Powerful disk winds launched via radiation pressure are generally expected in these systems (e.g., Jiang et al. 2019; Yang & Yuan 2024), and one interpretation for the variability is that variable X-ray obscuration from clumpy accretion disk winds. Extreme X-ray variations in higher luminosity quasars appear to be much rarer. Recently, a few such objects have been confirmed to exhibit extreme X-ray variations (e.g., Strotjohann et al. 2016; Liu et al. 2020; Ni et al. 2020; Wang et al. 2024). Most of these quasars are considered to have high or even super-Eddington accretion rates, similar to NLS1s. The strong X-ray variability detected in these high luminosity quasars is also likely to be related to dust-free obscuration from accretion disk winds.
Sample studies of X-ray highly variable AGNs have been concducted with the all-sky survey (R-ASS), Serendipitous Source Catalog (XMM-SL2)/XMM-Newton slew survey, SRG/eROSITA all-sky survey (Strotjohann et al. 2016; Medvedev et al. 2022; Bi et al. 2015). Most of them are bright AGNs with soft X-ray flux greater than 10-14 erg s-1 cm-2. The analysis in Timlin III et al. (2020), using serendipitous X-ray observations, indicates that extreme intrinsic X-ray variations are rare in radio-quiet quasars, with a maximum occurrence rate of 2.4% of observations. The quasars in the investigation are optically bright, with 20.2.
XMM-Newton has been surveying the sky in the X-ray band for 20 years. While this sky survey produces enormous amounts of data covering extensive regions of the sky, approximately 80% sources remain unclassified in 4XMM-DR13 (Webb et al. 2020). Machine learning algorithms have proven efficient in automatically classifying X-ray sources, as demonstrated by the classification of 4XMM-DR9 sources in Zhang et al. (2021). In the soft energy band (0.2-2 keV), the median flux in 4XMM-DR13 catalog is 5.2 10-15 erg s-1 cm-2, which is about two orders of magnitude deeper than the RASS/XMMSL2. Automated classification of X-ray sources is becoming increasingly valuable for identifying rare objects, such as tidal disruption events, changing-look AGNs, and ultraluminous X-ray sources.
In this paper, we first classify 4XMM-DR13 sources using a random forest approach with multi-wavelength data, and then perform a selection of highly variable X-ray sources among the classified quasar candidates. This paper is organized as follows. We describe the correlated 4XMM-DR13, SDSS, and ALLWISE data in Section 2. In Section 3 we give a detailed explanation of the random forest approach and the classification results. We present the process of selecting highly variable quasar candidates in Section 4. Finally, we discuss our results in the context of highly variable AGN populations in Section 5, and summarize in Section 6.
2 THE DATA
2.1 4XMM-DR13 and Multi-Wavelength Data
The 4XMM-DR13 catalog contains source detections drawn from 13,243 XMM-Newton EPIC observations (Webb et al. 2020), covering an energy interval from 0.2 keV to 12 keV. These observations were made between February 3, 2000, and December 31, 2000. All datasets, including 983,948 detections from 656,997 unique sources, were publicly available by December 31, 2022. We select reliable point-like sources that have no detected extent and are considered to be clean (SUMFLAG 2) in at least one detection. Furthermore, for the sources, we only keep the observations in which the object has a detection likelihood 10 and was detected with more than five counts. The X-ray properties from 4XMM-DR13 include energy fluxes, and the hardness ratio derived from different energy bands.
We cross-match the 4XMM-DR13 catalog with the Sloan Digital Sky Survey (SDSS; York et al. 2000) and AllWISE (Schlafly, 2012) databases to obtain multi-wavelength properties of X-ray sources. The matching radius is for SDSS and for ALLWISE, as proposed by Zhang et al. (2021). We use the software TOPCAT (Taylor 2005) and the website Cajobs111https://skyserver.sdss.org/casjobs/ for cross-matching the data. For the matched sources in SDSS, we filter the data to include only those with magnitudes below the limiting magnitudes in each band, and the corresponding magnitude errors no larger than 0.2. For the matched sources in ALLWISE, the data are filtered to satisfy 8 17.7 and 7 17.5. All photometries in this paper are extinction-corrected according to Schlafly (2012) and the AB magnitudes are adopted. Finally 100,183 sources are selected with qualified data from XMM-Newton, SDSS and ALLWISE. In the following, these sources are designated as the XMM-WISE-SDSS sample.
We then cross-match these sources with the objects identified spectroscopically by SDSS DR18 and the Large Sky Area Multi-object Fiber Spectroscopic Telescope (LAMOST; Cui et al. 2012; Luo et al. 2015) DR9, using a radius. To ensure the data quality, we set zWarning = 0 when downloading data from the DR18 SpecObj database. When objects are identified by both SDSS and LAMOST, only the spectral classification from SDSS is retained. The spectra were identified as stars, galaxies, or QSO by the SDSS and LAMOST automated classification pipelines using template fitting. If the objects in the XMM–WISE–SDSS sample with known spectral classes have counterparts in DR16Q, they are labeled as QSOs. Finally, the known sample include 3800 stars, 2875 galaxies, and 16,826 quasars with data from the X-ray, optical, and infrared bands.
| Class | No. | Proportion |
| GALAXY | 2875 | 12.23% |
| STAR | 3800 | 16.17% |
| QSO | 16,826 | 71.60% |
| Total No. | 23,501 | 100.00% |
We select the features log(), , , , , , W1, W2, , , , , , , log() from the known star, galaxy, and quasar samples used in this study. The selected features are described in Table 2. These attributes contribute to the classification to varying extents, as discussed in Zhang et al. (2021).
| Parameter | Definition | Catalogue | Waveband | ||||
| SC_HR1 |
|
XMM | X-ray band | ||||
| SC_HR2 |
|
XMM | X-ray band | ||||
| SC_HR3 |
|
XMM | X-ray band | ||||
| SC_HR4 |
|
XMM | X-ray band | ||||
| X-ray flux during 0.2-12keV | XMM | X-ray band | |||||
| X-ray-to-optical flux ration | XMM, SDSS | Optical and X-ray bands | |||||
| magnitude | AllWISE | Infrared band | |||||
| magnitude | AllWISE | Infrared band | |||||
| magnitude | SDSS | Optical band | |||||
| color | SDSS | Optical band | |||||
| color | SDSS | Optical band | |||||
| color | SDSS | Optical band | |||||
| color | SDSS | Optical band | |||||
| color | AllWISE, SDSS | Infrared and optical bands | |||||
| color | AllWISE | Infrared band |
2.2 Imbanlanced Data
As shown in Table 1, our dataset is imbalanced, with QSOs comprising 71.60% of the total sources, significantly outnumbering the other two classes. This imbalance can severely impact classifier performance, leading it to favor the majority class when classifying unidentified sources. Several methods can mitigate this issue. One straightforward approach is to assign weights to the source classes, thereby penalizing the algorithm more for misclassifying sources as the majority class. However, increasing the weight of the minority classes in this way could cause the model to overemphasize these samples, potentially resulting in overfitting to the training data and reduce generalization performance on new, unidentified data.
Another way to solve the imbalance problem is the use of an oversampling algorithm, such as the Synthetic Minority Over-sampling Technique222https://imbalanced-learn.org/ (SMOTE; Luque et al. 2019). For each minority class sample, SMOTE uses the K-Nearest Neighbor (KNN) algorithm to find its nearest neighbors, which should also belong to the minority class. One neighbor is randomly selected from its nearest neighbors. For each feature, the difference between the selected neighbor and the current minority class sample is calculated. A random number (ranging from 0 to 1) is generated, and this difference is multiplied by . The resulting product is then added to the features of the original minority class sample, creating a new synthetic sample. This process is repeated until the dataset is balanced or until the desired number of synthetic samples is generated.
To evaluate the effectiveness of SMOTE in this problem, this work conducted four experiments: one with default model parameters without SMOTE, one with best model parameter without SMOTE, one with default model parameter with SMOTE, and one with best model parameters with SMOTE. In terms of F1-score, the experimental results are 91.82%, 91.84%, 96.34% and 96.36% respectively. These results indicate that the SMOTE algorithm enhances the diversity of the minority class by generating new synthetic samples, which helps mitigate the risk of model overfitting. After balancing the categories, the classifier’s ability to identify minority classes is significantly improved, leading to better overall classification performance. Therefore, this work uses the SMOTE algorithm to deal with the imbalanced samples.
Additionally, missing data can occur due to insufficient survey depth, complex weather conditions, or lack of emission in specific bands. To address the impact of missing data on the SMOTE algorithm, we assign a placeholder value of -9999 to these missing entries.
3 METHOD
The primary method employed in this study to identify quasar candidates is the random forest (RF) algorithm. The performance of the classifier is evaluated using metrics such as Precision, Recall, and Accuracy. Additionally, we use cross-validation to assess the robustness and generalizability of the classifier.
3.1 Random Forest
RF is an ensemble learning algorithm based on decision trees and bagging techniques. It mitigates overfitting through randomness in two dimensions: by randomly selecting subsets of training samples and by each decision tree using a different subset of features. This approach improves the model’s robustness and reduces sensitivity to missing values. Due to its strong performance, RF is widely used in astronomical data processing. The method was initially introduced and termed as ‘random decision forests’ by Ho (1995) and later refined and renamed as ‘random forests’ by Breiman (2001). In this study, we construct our classifier based on the RF module in scikit-learn 333https://scikit-learn.org/stable/index.html (Pedregosa et al. 2011).
3.2 Evaluation Metrics
Accuracy, Precision, Recall, and F1-score are fundamental metrics for evaluating classification models from multiple perspectives. These metrics are derived from the counts of True Positives (TP), False Positives (FP), True Negatives (TN), and False Negatives (FN), each providing different insights into the model’s performance. Specifically, Accuracy is given by
| (1) |
which stands for how well the identification of quasars and non-quasars is.
Precision is given by
| (2) |
Taking quasars as an example, Precision means the percentage of quasars in the test set that can be correctly picked out among those classified as quasars.
Recall is used to assess how many quasars are selected in the true quasars, which is defined as
| (3) |
F1-score is a metric commonly used in binary classification tasks to assess the performance of the classification models by considering both Precision and Recall. It is the harmonic mean of Precision and Recall, providing a balance between these two metrics.
| (4) |
3.3 K-fold Cross-Validation
-fold cross-validation is a widely used technique for evaluating model performance and selecting optimal hyperparameters. In this method, the dataset is partitioned into equal-sized subsets. For each iteration, subsets are used to train the model, while the remaining subset is used for validation. This process is repeated times, with each subset serving as the validation set exactly once. The final performance metric is obtained by averaging the results from all iterations.
| Class | Precision (%) | Recall (%) | F1-score (%) |
| GALAXY | |||
| QSO | |||
| STAR | |||
| Weighted Avg. | |||
| Total Accuracy |
3.4 Hyperparameter Adjustment
The RF model has some adjusted hyperparameters. By adjusting these hyperparameters, we can find the best model parameters for the current problem to improve the performance of the model. The three most important parameters are: the number of decision trees generated by the RF algorithm (), the number of features to be considered when splitting nodes in each decision tree (), the maximum depth of each decision tree (). We estimate the optimal parameter configuration using a grid search algorithm with 5-fold cross-validation. The optimal value is for , and 151 for . Based on the results, we do not impose an upper limit on .
4 result
4.1 Additional Filtering with Gaia Proper Motions
We classify the 4XMM-DR13 sources into 54,782 quasars, 12,429 galaxies, and 9471 stars with the RF algorithm. In order to remove stellar contaminants from quasar candidates, we then apply an additional cut based on Gaia’s proper motion. We adopt the probabilistic cut algorithm introduced in Fu et al. (2021, 2024), which accounts for the uncertainties in proper motion measurement from Gaia. In this algorithm, the probability density of zero proper for a source is defined based on the bivariate normal distribution of proper-motion measurements as follows:
| (5) |
where represents pmra, represents pmdec, denotes pmra_pmdec_corr (correlation coefficient between pmra and pmdec), and are the proper motion uncertainties. Following Fu et al. (2024), we apply a cut of log to exclude potential stars while retaining most quasars.
We cross-match the classified 4XMM-DR13 quasar candidates with Gaia Data Release 3 within a radius of 5. A total of 18,000 sources are matched, of which 818 objects are potentially stellar contaminants with log. The result indicates the high precision of our quasar classification. These potentially stellar objects are removed from the quasar candidates, leaving 53,992 quasar candidates. We then correlate these quasar candidates with SIMBAD using a matching radius of 5, identifying 10,210 quasars among 167,69 counterparts. Finally we classify 37,223 unidentified 4XMM-DR13 sources as quasar candidates. In the following section, we describe the selection of X-ray highly variable sources from the classified quasar candidates. To assess the robustness of our approach, the same selection algorithms are also applied to the known quasars.
4.2 Quasar Candidates with Extreme X-ray Variability
In this paper we focus on selecting the X-ray highly variable, radio-quiet quasars as their variability mechanisms are quite different from those of radio-loud quasars, which exhibit a highly collimated emission component. To obtain a sample devoid of jet emission, we cross-match the classified quasar candidates with the Faint Images of the Radio Sky at Twenty centimeters (FIRST) survey using a matching radius of 5. Instead of using the radio-loudness parameter to exclude radio-loud quasars, we simply remove their FIRST counterparts from the sample. For the selection of X-ray variable quasars, we include only objects with at least two XMM-Newton flux measurements. The resulting sample consists of 12,821 quasars with 39,782 XMM-Newton observations. Among these quasars, approximately 40% are detected in more than two epochs.
We utilize the flux ratio in the soft band between XMM-Newton epochs to select highly variable quasars. The soft X-ray (0.2–2.0 keV) flux is calculated as the sum of the European Photon Imaging Camera (EPIC) fluxes listed in the 4XMM-DR13 catalog for bands 1, 2, and 3 (0.2–0.5, 0.5–1, and 1–2 keV, respectively). These observed fluxes are derived from the count rates, assuming an absorbed power-law spectral model with a photon index and a Galactic absorption column density of (Webb et al., 2020). For these selected extreme variable quasars, we can neglect the inaccuracies introduced in the flux ratios by use of this fixed spectral slope (Li et al., 2022; Saxton et al., 2011).
We select the candidates with a soft X-ray flux ratio between XMM-Newton epochs greater than a factor of 10. Considering the larger uncertainties in the measured flux of the relatively fainter sources, we reject the candidates with fluxes fainter than erg cm-2 s-1. This flux threshold corresponds to the median value in the soft X-ray band from the 4XMM-DR13 catalog(Webb et al. 2020). At this stage, 103 highly variable quasar candidates are selected. We then cross-match these sources with the NASA Extragalactic Database (NED) to exclude objects that have been spectroscopically classified. This results in the removal of 25 objects that are identified as variable AGNs, quasars, or tidal disruption event (TDE) sources. This step provides independent confirmation of the robustness of our quasar classification and extreme variable quasar selection. For the remaining highly variable quasar candidates, we visually inspect the light curves and corresponding X-ray images individually. Sources with only two observations and large flux uncertainties at both epochs are rejected. Additionally, we exclude sources where variability is due to ‘problematic’ observations, such as those detected near the edges of the field-of-view, in CCD gaps, or on readout streaks associated with saturated or bright sources.
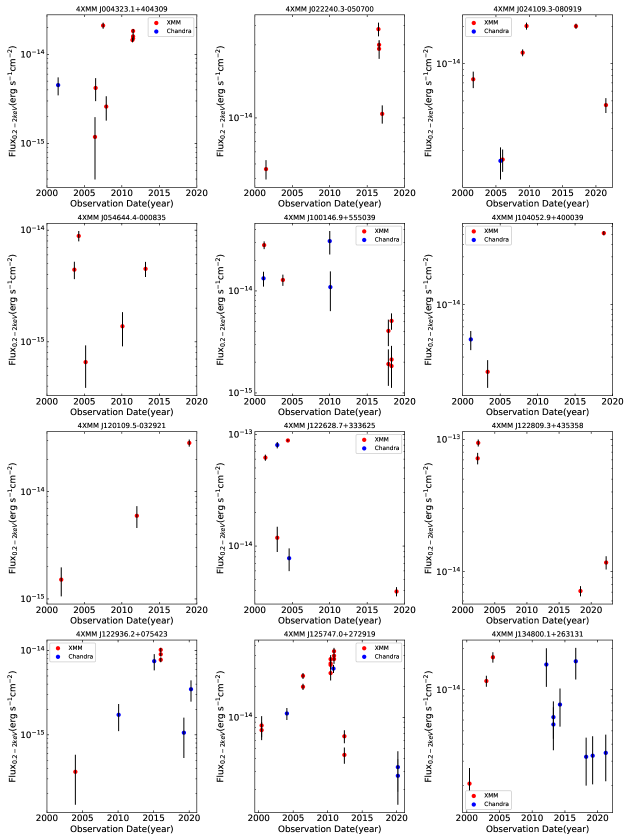
Finally, the carefully constructed sample comprises 12 quasar candidates, which display extreme variability with a factor greater than 10 in the 0.2–2 keV range between XMM-Newton observations. In Figure 1, we present the soft X-ray light curves for these highly variable quasar candidates. As shown in the figure,7 objects are also detected by the Chandra X-ray Observatory. The presented Chandra soft flux corresponds to the flux in the 0.2-2.0 keV band, as released in the Chandra Source Catalog, assuming a power-law spectral model with a photon index of 2.0 and accounting for Galactic extinction (Evans et al. 2024).
We also search for the X-ray observations of these quasars from other X-ray satellite missions, such as ROSAT, Swift, and SRG/eROSITA. None of these sources are detected in the ROSAT all-sky survey. The result can be attributed to the relatively deeper observations in the 4XMM-DR3 catalog compared to those from ROSAT. There are eight quasar candidates located within the range , while no sources are detected in the X-ray catalog of SRG/eROSITA during the all-sky survey in the celestial hemisphere. Additionally, 5 sources have multiple Swift-XRT observations; however, the measured soft X-ray fluxes are not sufficiently reliable due to significant uncertainties associated with these relatively fainter quasar candidates. As a result, we have excluded these measurements from the Swift-XRT observations.
| 4XMM name | Photo_za | XMM-Newton Fluxb | Obs Time | Chandra Fluxc | Obs Time |
| 4XMM J004323.1+404309 | 0.37 | 2.10 | 2007-07-22 | 0.45 | 2001-07-24 |
| 1.59 | 2011-07-13 | ||||
| 0.12 | 2006-06-30 | ||||
| 0.26 | 2007-12-29 | ||||
| 1.45 | 2011-06-27 | ||||
| 0.42 | 2006-07-08 | ||||
| 1.51 | 2011-07-05 | ||||
| 1.83 | 2011-07-07 | ||||
| 4XMM J022240.3-050700 | – | 3.80 | 2016-07-08 | ||
| 1.06 | 2017-01-01 | ||||
| 0.46 | 2001-07-04 | ||||
| 2.83 | 2016-08-14 | ||||
| 3.00 | 2016-08-13 | ||||
| 4XMM J024109.3-080919 | 0.70 | 1.22 | 2009-01-14 | 0.16 | 2005-09-18 |
| 0.46 | 2021-07-16 | ||||
| 0.75 | 2001-08-15 | ||||
| 0.17 | 2006-01-12 | ||||
| 2.01 | 2017-01-17 | ||||
| 2.01 | 2009-08-12 | ||||
| 4XMM J054644.4-000835 | – | 0.14 | 2010-02-28 | ||
| 0.89 | 2004-04-03 | ||||
| 0.45 | 2013-03-09 | ||||
| 0.44 | 2003-09-03 | ||||
| 0.07 | 2005-03-24 | ||||
| 4XMM J100146.9+555039 | – | 0.19 | 2017-11-01 | 1.09 | 2010-02-01 |
| 0.18 | 2018-04-17 | 3.08 | 2010-01-17 | ||
| 0.51 | 2018-04-23 | 1.33 | 2001-03-07 | ||
| 2.81 | 2001-04-13 | ||||
| 0.41 | 2017-11-27 | ||||
| 0.21 | 2018-04-21 | ||||
| 1.28 | 2003-10-14 | ||||
| 4XMM J104052.9+400039 | – | 5.17 | 2018-11-13 | 0.45 | 2001-02-04 |
| 0.21 | 2003-05-24 | ||||
| 4XMM J120109.5-032921 | 0.70 | 0.60 | 2012-01-06 | ||
| 2.85 | 2019-01-04 | ||||
| 0.15 | 2001-12-11 | ||||
| 4XMM J122628.7+333625 | – | 1.19 | 2003-01-03 | 8.02 | 2003-01-27 |
| 8.81 | 2004-06-02 | 0.78 | 2004-08-07 | ||
| 0.39 | 2018-12-13 | ||||
| 6.18 | 2001-06-18 | ||||
| 4XMM J122809.3+435358 | 0.67 | 0.71 | 2018-05-11 | ||
| 7.18 | 2002-05-25 | ||||
| 1.17 | 2022-05-08 | ||||
| 9.41 | 2002-06-02 |
-
a
Photo-z from SDSS. Only for 4XMMJ134800.1+263131, photo-z is from Fu et al. (2024).
-
b
XMM-Newton 0.2-2.0 keV fluxes in units of 10-14 erg s-1 cm-2
-
c
Chandra 0.2-2.0 keV fluxes in units of 10-14 erg s-1 cm-2
| Table 4. Continued | |||||
| 4XMM name | Photo_z | XMM-Newton Flux | Obs Time | Chandra Flux | Obs Time |
| 4XMM J122936.2+075423 | 0.36 | 0.90 | 2016-01-05 | 0.17 | 2010-02-27 |
| 0.04 | 2004-01-01 | 0.75 | 2015-02-24 | ||
| 0.78 | 2016-01-07 | 0.11 | 2019-04-17 | ||
| 1.02 | 2016-01-09 | 0.35 | 2020-04-09 | ||
| 4XMM J125747.0+272919 | – | 0.75 | 2000-06-27 | 2.98 | 2010-11-11 |
| 2.53 | 2006-06-14 | 1.09 | 2004-02-17 | ||
| 0.84 | 2000-06-11 | 0.27 | 2020-03-04 | ||
| 0.43 | 2012-06-02 | 0.33 | 2020-03-04 | ||
| 3.97 | 2010-12-05 | ||||
| 3.69 | 2010-12-11 | ||||
| 3.34 | 2010-06-18 | ||||
| 3.68 | 2010-06-16 | ||||
| 2.69 | 2010-06-20 | ||||
| 3.24 | 2010-06-24 | ||||
| 4.39 | 2010-12-03 | ||||
| 1.98 | 2006-06-11 | ||||
| 0.66 | 2012-06-04 | ||||
| 4XMM J134800.1+263131 | 1.69 | 1.16 | 2003-01-13 | 1.53 | 2012-03-25 |
| 1.73 | 2004-01-25 | 0.35 | 2021-04-25 | ||
| 0.21 | 2000-06-26 | 0.78 | 2014-04-03 | ||
| 0.33 | 2019-04-18 | ||||
| 0.56 | 2013-04-10 | ||||
| 0.63 | 2013-04-08 | ||||
| 0.32 | 2018-04-15 | ||||
| 1.62 | 2016-09-01 | ||||
5 Discussion
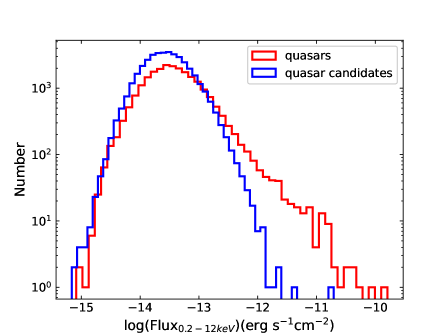
We compare the broadband (0.2-12 keV) X-ray flux distributions of the 39,101 quasar candidates with those of the training data (TD) in Figure 2. The quasar candidates exhibit a systematically lower X-ray flux compared to the TD quasars. Specifically, at flux below 10-13 erg s-1 cm-2, the fraction of quasar candidates is noticeably higher than that of TD quasars (Figure 2). This discrepancy likely reflects the fact that brighter quasars are easier to study and classify using spectroscopy, as discussed in Yang et al. 2022. Deep optical spectroscopic observations are necessary to identify and characterize the nature of these faint quasar candidates.
The results above indicate that our selection of highly variable quasar candidates may extend the X-ray highly variable quasar sample into a relatively faint range. We then construct a comparative sample of quasars that exhibit variability of at least a factor of 10, as observed in the XMM-Newton survey. To compile this sample, we select highly variable quasars from the 16,826 quasars in TD using the same criteria outlined in Section 4.2. Approximately 40 quasars meet this selection criterion. As described in Section 4.2, 25 of the initially selected highly variable quasar candidates are identified as classified quasars in the NED database. We visually inspect the light curves of these 65 quasars and eliminate those with significant flux uncertainties. In the end, 43 highly variable quasars remain in the sample.
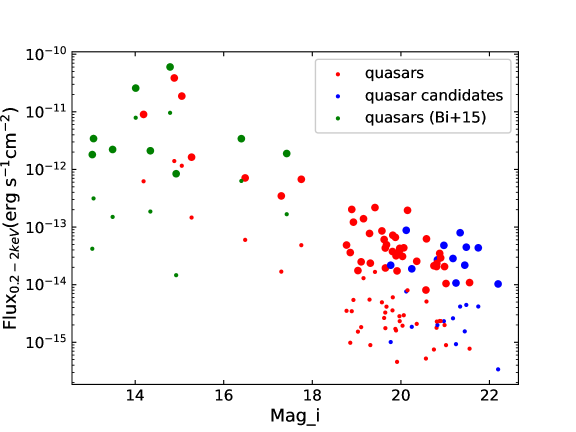
We show the soft X-ray flux variation versus optical SDSS -band magnitude for the 43 highly variably quasars and 12 quasar candidates in Figure 3. For each object, we present only the brightest and faintest soft X-ray XMM-Newton flux for clarity. Our selected variable quasar candidates, identified using the random forest algorithm, extend the quasar sample with extreme soft X-ray variability to an optical faint end at -band magnitude of 22. In the figure, we also show the distribution of AGNs with soft X-ray flux drops by a factor 10, as reported by Bi et al. 2015, who compared the ROSAT and XMM-Newton survey data. As shown in Figure 3, all AGNs/quasars, whether with bright or faint optical emission, exhibit highly variable soft X-ray emission.
As shown in Figure 3, the soft X-ray fluxes of the quasars brighter than are predominantly distributed in the range of 10-11 to 10-13 erg s-1 cm-2. In contrast, quasars with exhibit soft X-ray fluxes between 10-13 and 10-15 erg s-1 cm-2. None of the 12 selected highly variable quasar candidates are detected in the ROSAT survey. This suggests that for optically faint quasars, the soft X-ray fluxes are typically no brighter than the flux limit of the RASS catalog, approximately a few 10-13 erg s-1 cm-2. These results also imply that quasars with variability factors of 100 or more are exceedingly rare.
6 Summary
In this study, we apply a random forest algorithm to classify X-ray sources in 4XMM-DR13 using data from the X-ray, optical, and infrared bands, along with the spectral classes of known X-ray sources. A total of 53,992 quasar candidates are classified, primarily located in the relatively faint X-ray region compared to known quasars. From this dataset, we select a sample of 12 highly variable quasar candidates within the XMM-Newton survey. All of these candidates exhibit variability in soft X-ray flux by a factor of at least 10. Compared to previous studies, our sample extends the known population of highly variable quasars to the faint end of the optical band, with -band magnitude of 22. Acquiring their rest-frame ultraviolet/optical spectra would help confirm whether they are indeed quasars. A joint investigation of extreme X-ray variability alongside variability in the optical and mid-infrared bands could provide valuable insights into the physical nature of these objects. Our study of these highly variable quasars will be further developed in subsequent papers in this series.
7 ACKNOWLEDGMENTS
We thank the support of the Natural Science Foundation of Top Talent of SZTU (GDRC202208), Shenzhen Science and Technology program (JCYJ20230807113910021), and Guangdong Basic and Applied Basic Research Foundation No. 2022A1515012151. We acknowledge the the National Natural Science Foundation of China under grants No. 12133001 and 12273076.
This research has made use of data obtained from the 4XMM XMM-Newton serendipitous source catalogue compiled by the 10 institutes of the XMM-Newton Survey Science Centre selected by ESA. This publication makes use of data products from the Wide-field Infrared Survey Explorer, which is a joint project of the University of California, Los Angeles, and the Jet Propulsion Laboratory/California Institute of Technology, funded by the National Aeronautics and Space Administration.
We acknowledge LAMOST and SDSS databases. The Guoshoujing Telescope (the Large Sky Area Multi-object Fiber Spectroscopic Telescope, LAMOST) is a National Major Scientific Project built by the Chinese Academy of Sciences. Funding for the project has been provided by the National Development and Reform Commission. LAMOST is operated and managed by the National Astronomical Observatories, Chinese Academy of Sciences.
Funding for the Sloan Digital Sky Survey V has been provided by the Alfred P. Sloan Foundation, the Heising-Simons Foundation, the National Science Foundation, and the Participating Institutions. SDSS acknowledges support and resources from the Center for High-Performance Computing at the University of Utah. The SDSS website is www.sdss.org. SDSS is managed by the Astrophysical Research Consortium for the Participating Institutions of the SDSS Collaboration, including the Carnegie Institution for Science, Chilean National Time Allocation Committee (CNTAC) ratified researchers, the Gotham Participation Group, Harvard University, Heidelberg University, The Johns Hopkins University, L’Ecole polytechnique fédérale de Lausanne (EPFL), Leibniz-Institut fr Astrophysik Potsdam (AIP), Max-Planck-Institut fr Astronomie (MPIA Heidelberg), Max-Planck-Institut fr Extraterrestrische Physik(MPE), Nanjing University, National Astronomical Observatories of China (NAOC), New Mexico State University, The Ohio State University, Pennsylvania State University, Smithsonian Astrophysical Observatory, Space Telescope Science Institute (STScI), the Stellar Astrophysics Participation Group, Universidad Nacional Autnoma de Mxico, University of Arizona, University of Colorado Boulder, University of Illinois at Urbana-Champaign, University of Toronto, University of Utah, University of Virginia, Yale University, and Yunnan University.
This work has made use of data from the European Space Agency (ESA) mission Gaia (https://www.cosmos.esa.int/gaia), processed by the Gaia Data Processing and Analysis Consortium (DPAC, https://www.cosmos.esa.int/web/gaia/dpac/consortium). Funding for the DPAC has been provided by national institutions, in particular, the institutions participating in the Gaia Multilateral Agreement.
This research has made use of the NASA/IPAC Extragalactic Database (NED) which is operated by the California Institute of Technology, under contract with the National Aeronautics and Space Administration.
This research has made use of the SIMBAD database, operated at CDS, Strasbourg, France.
References
- Ai et al. (2020) Ai, Y., Dou, L., Yang, C., et al. 2020, The Astrophysical Journal Letters, 890, L29
- Bi et al. (2015) Bi, D., Liu, T., & Wang, J. 2015, Science China Physics, Mechanics & Astronomy, 58, 1
- Boller et al. (2021) Boller, T., Liu, T., Weber, P., et al. 2021, Astronomy & Astrophysics, 647, A6
- Breiman (2001) Breiman, L. 2001, Machine learning, 45, 5
- Cao et al. (2023) Cao, X., You, B., & Wei, X. 2023, Monthly Notices of the Royal Astronomical Society, 526, 2331
- Cui et al. (2012) Cui, X.-Q., Zhao, Y.-H., Chu, Y.-Q., et al. 2012, Research in Astronomy and Astrophysics, 12, 1197, doi: 10.1088/1674-4527/12/9/003
- Evans et al. (2024) Evans, I. N., Evans, J. D., Martínez-Galarza, J. R., et al. 2024, arXiv preprint arXiv:2407.10799
- Fu et al. (2021) Fu, Y., Wu, X.-B., Yang, Q., et al. 2021, The Astrophysical Journal Supplement Series, 254, 6
- Fu et al. (2024) Fu, Y., Wu, X.-B., Li, Y., et al. 2024, The Astrophysical Journal Supplement Series, 271, 54
- Gibson & Brandt (2012) Gibson, R. R., & Brandt, W. 2012, The Astrophysical Journal, 746, 54
- Gonzalez-Martin & Vaughan (2012) Gonzalez-Martin, O., & Vaughan, S. 2012, Astronomy & Astrophysics, 544, A80
- Grupe et al. (2015) Grupe, D., Komossa, S., & Saxton, R. 2015, The Astrophysical Journal Letters, 803, L28
- Ho (1995) Ho, T. K. 1995, in Proceedings of 3rd international conference on document analysis and recognition, Vol. 1, IEEE, 278–282
- Jana et al. (2021) Jana, A., Kumari, N., Nandi, P., et al. 2021, Monthly Notices of the Royal Astronomical Society, 507, 687
- Jiang et al. (2019) Jiang, Y.-F., Blaes, O., Stone, J. M., & Davis, S. W. 2019, The Astrophysical Journal, 885, 144
- Jin et al. (2023) Jin, C., Done, C., Ward, M., et al. 2023, Monthly Notices of the Royal Astronomical Society, 518, 6065
- Krumpe et al. (2017) Krumpe, M., Husemann, B., Tremblay, G., et al. 2017, Astronomy & Astrophysics, 607, L9
- Li et al. (2022) Li, D., Starling, R. L. C., Saxton, R. D., Pan, H.-W., & Yuan, W. 2022, Monthly Notices of the Royal Astronomical Society, 512, 3858, doi: 10.1093/mnras/stac714
- Liu et al. (2020) Liu, Z., Liu, H.-Y., Cheng, H., Qiao, E., & Yuan, W. 2020, Monthly Notices of the Royal Astronomical Society, 492, 2335
- Luo et al. (2015) Luo, A. L., Zhao, Y.-H., Zhao, G., et al. 2015, Research in Astronomy and Astrophysics, 15, 1095, doi: 10.1088/1674-4527/15/8/002
- Luque et al. (2019) Luque, A., Carrasco, A., Martín, A., & de las Heras, A. 2019, Pattern Recognition, 91, 216, doi: 10.1016/j.patcog.2019.02.023
- McHardy et al. (2006) McHardy, I. M., Koerding, E., Knigge, C., Uttley, P., & Fender, R. 2006, Nature, 444, 730
- Medvedev et al. (2022) Medvedev, P., Gilfanov, M., Sazonov, S. Y., Sunyaev, R., & Khorunzhev, G. 2022, Astronomy Letters, 48, 735
- Mehdipour et al. (2021) Mehdipour, M., Kriss, G., Kaastra, J., et al. 2021, Astronomy & Astrophysics, 652, A150
- Middei et al. (2017) Middei, R., Vagnetti, F., Bianchi, S., et al. 2017, Astronomy & Astrophysics, 599, A82
- Ni et al. (2020) Ni, Q., Brandt, W., Yi, W., et al. 2020, The Astrophysical Journal Letters, 889, L37
- Parker et al. (2021) Parker, M. L., Alston, W. N., Härer, L., et al. 2021, MNRAS, 508, 1798, doi: 10.1093/mnras/stab2434
- Pedregosa et al. (2011) Pedregosa, F., Varoquaux, G., Gramfort, A., et al. 2011, Journal of Machine Learning Research, 12, 2825, doi: 10.48550/arXiv.1201.0490
- Reeves & Braito (2019) Reeves, J., & Braito, V. 2019, The Astrophysical Journal, 884, 80
- Ricci et al. (2020) Ricci, C., Kara, E., Loewenstein, M., et al. 2020, The Astrophysical Journal Letters, 898, L1
- Saxton et al. (2011) Saxton, R., Read, A., Esquej, P., Miniutti, G., & Alvarez, E. 2011, arXiv e-prints, arXiv:1106.3507, doi: 10.48550/arXiv.1106.3507
- Schlafly (2012) Schlafly, E. F. 2012, PhD thesis
- Strotjohann et al. (2016) Strotjohann, N., Saxton, R., Starling, R. L., et al. 2016, Astronomy & Astrophysics, 592, A74
- Sunyaev & Titarchuk (1980) Sunyaev, R., & Titarchuk, L. 1980, Astronomy and Astrophysics, vol. 86, no. 1-2, June 1980, p. 121-138., 86, 121
- Taylor (2005) Taylor, M. B. 2005, in Astronomical Society of the Pacific Conference Series, Vol. 347, Astronomical Data Analysis Software and Systems XIV, ed. P. Shopbell, M. Britton, & R. Ebert, 29
- Timlin III et al. (2020) Timlin III, J. D., Brandt, W. N., Zhu, S., et al. 2020, Monthly Notices of the Royal Astronomical Society, 498, 4033
- Uttley et al. (2002) Uttley, P., McHardy, I., & Papadakis, I. 2002, Monthly Notices of the Royal Astronomical Society, 332, 231
- Wang et al. (2024) Wang, S., Brandt, W. N., Luo, B., et al. 2024, The Astrophysical Journal, 974, 2
- Wang et al. (2022) Wang, Y., Kaastra, J., Mehdipour, M., et al. 2022, Astronomy & Astrophysics, 657, A77
- Webb et al. (2020) Webb, N. A., Coriat, M., Traulsen, I., et al. 2020, Astronomy & Astrophysics, 641, A136
- Yang et al. (2022) Yang, H., Hare, J., Kargaltsev, O., et al. 2022, The Astrophysical Journal, 941, 104
- Yang & Yuan (2024) Yang, H., & Yuan, F. 2024, arXiv preprint arXiv:2408.16595
- Yang et al. (2023) Yang, Q., Green, P. J., MacLeod, C. L., et al. 2023, The Astrophysical Journal, 953, 61
- York et al. (2000) York, D. G., Adelman, J., Anderson, John E., J., et al. 2000, AJ, 120, 1579, doi: 10.1086/301513
- Yuan & Narayan (2014) Yuan, F., & Narayan, R. 2014, Annual Review of Astronomy and Astrophysics, 52, 529
- Zhang et al. (2021) Zhang, Y., Zhao, Y., & Wu, X.-B. 2021, MNRAS, 503, 5263, doi: 10.1093/mnras/stab744