Several problems on the measured hyperorder cumulants of net-proton distributions in heavy-ion collisions
Abstract
Hyperorder cumulants and are recommended as sensitive observables to explore the QCD phase transition in heavy-ion collisions. Precisely measuring their results remains a difficult task in experiments, when employing the Centrality Bin Width Correction (CBWC) to suppress the initial volume fluctuations. Various techniques within the CBWC formula can lead to notable differences in the results. We will systematically investigate the application of the CBWC method to the measured net-proton and using the UrQMD model and Skellam-based simulations at = 11.5 GeV in Au + Au collisions. A recommended approach is proposed to calculate and in 0-40% centrality. With statistics comparable to the RHIC Beam Energy Scan phase II (BES-II), our studies provide a baseline for analyzing net-proton and in relativistic heavy-ion collisions.
1 Introduction
High-order cumulants of conserved quantities, such as net-baryon, net-charge and net-strangeness, are sensitive observables for investigating the QCD phase diagram [1, 2, 3, 4, 5, 6]. Lattice QCD calculations show that the fifth-to-first order () and the sixth-to-second order () order cumulant ratios exhibit a negative signal in the crossover region [7, 8, 9, 10]. The QCD-assisted low-energy effective theory and the QCD based models, such as the Polyakov loop extended quark-meson (PQM) and the Nambu-Jona-Lasinio (PNJL) models, also support the idea that these two ratios turn negative near the chiral crossover transition [11, 12, 13, 14, 15].
In experiment, the STAR Collaboration has reported the beam energy and collision centrality dependence of net-proton and in Au + Au collisions at center-of-mass energies from 3 to 200 GeV [16, 17]. Except at 3 GeV, the measured values for 0-40% centrality collisions display a progressively negative trend with decreasing energy. Conversely, for 0-40% centrality collisions from 7.7 to 200 GeV exhibits a weak beam energy dependence and fluctuates about zero. However, these behaviors can also be theoretically explained without taking into account the QCD phase transition. The negative is also noted in the sub-ensemble acceptance method [18, 19, 20] and hydrodynamics calculations [21], encompassing global conservation, system non-uniformity, and momentum space acceptance. In addition, both the experimental behaviors of these two ratios can also be attributed to low statistics effects without necessitating the consideration of any phase transition [22, 23]. Consequently, It is important to accurately measure these two ratios and eliminate the impacts of non-phase transitions. [24, 25, 26, 27, 28, 29].
Currently, removing the initial volume fluctuations remains one of the most challenging issues in accurately measuring the cumulants [30, 31, 32]. Experimentally, the impact of initial volume fluctuations is typically mitigated using the centrality bin width correction (CBWC) method [33, 34, 35]. This is achieved by computing cumulants or cumulant ratios in each multiplicity bins before combining the results within a specific centrality bin width, such as 0-10%, 10-20%, 20-30%,, 70-80% centralities. The effectiveness of the CBWC method has been a topic of extensive discussion. In the case of net-proton and , the measured results exhibit a strong statistical dependence with insufficient statistics, and the CBWC method exacerbates the impact of low statistics on the measured hyperorder cumulant [36, 22, 23]. In addition, when aggregating results into a specific centrality, the event-weighted scheme has proven successful for cumulants up to the sixth order, while the error-weighted scheme may lead to underestimation of the measurement [37, 38, 39].
Nevertheless, to precisely quantify the hyperorder cumulants, there are still various specific intricacies of the CBWC method that necessitate in-depth discussions. In particular, a wider centrality bin width of 0-40% is constructed for analyzing and to reduce uncertainties. This adjustment could enhance the sensitivity of the measurements to the specific schemes of the CBWC method. When utilizing the CBWC method to calculate (and also ), one has the option to either compute and separately or to directly calculate in each multiplicity bin. In this paper, we will demonstrate that choosing the latter approach results in the volume cancellation effect being more closely aligned with theoretical predictions, and the related statistical uncertainties are significantly reduced. This reduction in uncertainties is particularly beneficial for analyzing and in experiment, even with the collected statistics at RHIC/BES-II.
Moreover, after calculating and in 0-10%, 10-20%, 20-30% and 30-40% centralities, the consequences of constructing these two ratios in 0-40% centrality by using error-weighted or event-weighted schemes will also require examination. It will be demonstrated that the event-weighted approach is better suited for analyzing and using minibias data samples at RHIC/BES-II. Implementing the error-weighted scheme leads to that the result in 0-10% has no any contribution to the final value in 0-40% centrality. The results in 10-40% and 0-40% centralities are identical, encompassing both the measured central value and its associated statistical uncertainty. This lack of contribution from the 0-10% centrality is mainly attributed to the larger uncertainty in this centrality compared to the others.
The paper is organized as follows. In Section II, we will offer a thorough explanation and provide formulas for the different CBWC methods. The results derived from the UrQDM model and Skellam-based Monte Carlo simulations will be demonstrated in section III. Finally, a summary is given in section IV.
2 Various CBWC methods
As we know, in thermal equilibrium, cumulants of the conserved charge are connected to the thermodynamic susceptibilities which are determined by taking derivatives of the logarithm of the QCD partition functions with respect to the chemical potentials of conserved charges:
| (1) |
The formula of the cumulants are expressed as follows:
| (2) | |||||
| (3) | |||||
| (4) | |||||
| (5) | |||||
| (6) | |||||
| (7) | |||||
here , is the number of particles in one event, and the average is taken over all events. Eq. (1) demonstrates that cumulants are extensive variables that are directly proportional to the volume of the collision system and thermal susceptibilities. Ignoring the impact of temperature fluctuation effects, the cumulant ratios, given by
| (8) |
are utilized to study of the QCD phase transition, as they are sensitive to it and can also mitigate the volume contributions. A Skellam distribution, defined as the difference between two independent Poisson distributions, is typically utilized as a statistical baseline [40, 41, 42], which is unity for , , and .
Experimentally, due to the impact of initial volume fluctuations, the cumulants are not directly calculated in a given centrality bin, such as 0-5%, 5-10% and 30-40% centralities. The CBWC method is applied to suppress the the initial volume fluctuations on the measured cumulants [33, 34, 35]. The procedure is mathematically expressed in the equation below:
| (9) |
where is the number of events in the th multiplicity bin for the centrality determination. The corresponding weight for the th multiplicity bin is . represents the th order cumulant of particle number distributions in the th multiplicity bin. In this case, the cumulant ratio in a finite centrality interval can be described as :
| (10) |
This method is denoted as the CBWC-I method in this paper. However, the impact of volume elimination shown in Eq. (10) does not entirely align with the theoretical expectations as illustrated in Eq. (8).
Alternatively, we can directly calculate and then obtain the centrality dependency using the corresponding formula is :
| (11) | |||||
This is referred to as CBWC-II method in this paper. It is clear that this formula aligns more closely with the theoretical expectations outlined in Eq. (8).
Essentially, both the CBWC-I and -II methods correspond to the event-weighted average. Experimentally, the error-weighted average is also employed for data analysis in experiments, which can result in smaller statistical uncertainties. Nonetheless, when constructing the results in each multiplicity bin to eight centralities, several studies have suggested that the error-weighted average can underestimate the measured cumulant [37, 38]. In this paper, we will further investigate whether the ratios in the 0-40% centrality can be averaged by considering the results in the 0-10%, 10-20%, 20-30%, and 30-40% centralities using the error-weighted scheme. the corresponding formula is :
| (12) |
Here, and represent the cumulant ratio and its associated error within the specified four centrality bins. Disregarding the uncertainty of , the error of in 0-40% centrality can be determined using the error propagation formula, as follows:
| (13) |
It is called the CBWC-III method in this paper.
3 Comparisons and Discussions
We analyze how these three CBWC methods affect the net-proton and using the UrQMD model (version 3.4) [43, 44]. We generate a total of 125M minimum bias events in Au + Au collisions at = 11.5 GeV. In an effort to avoid auto-correlations and improve the centrality resolutions, this study utilizes the Refmult3X multiplicity, which is calculated based on the count of charged pions and kaons within the pseudorapidity range of in each event. This criterion is specified by the RHIC/BES-II cumulant analysis [45]. The kinematic intervals of transverse momentum and rapidity are GeV/ and . The statistical error is estimated by the Bootstrap method [46, 47].
3.1 CBWC-I and -II methods
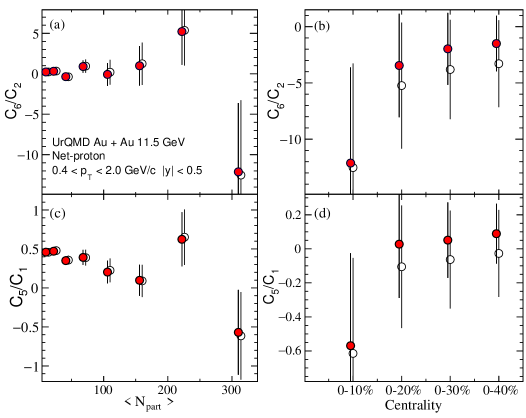
Fig. 1 shows the net-proton ratios and using CBWC-I and CBWC-II methods, denoted by , , and , respectively. The results shown are for the eight centralities (0-10%, 10-20%, 20-30% 70-80%) and different centrality bin widths (0-10%, 0-20%, 0-30%, and 0-40%). In the case of the eight centralities, the discrepancy between the CBWC-I and CBWC-II methods in calculating the ratios and is negligible for all centralities, including both the measured values and the estimated statistical uncertainties. However, with the widening of the centrality bin width, variations in the measured values for both and are observed. The discrepancies in the measured uncertainties become more pronounced as the centrality bin width increases. In 0-40% centrality, the errors of and are 68.8% and 63.7%, respectively, compared to those of and . Therefore, the impact of the decreased uncertainties for the CWBC-II method is significantly in the UrQMD calculations.
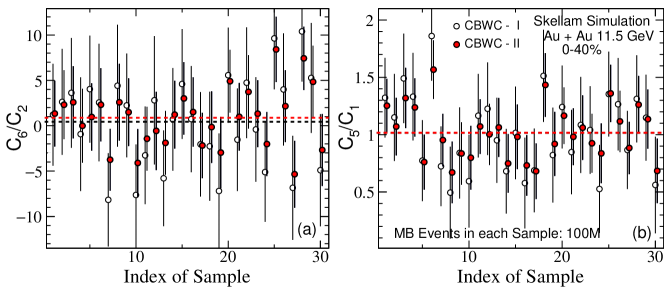

To comprehensively assess the effectiveness of these two methods at a given statistics and centrality bin, we further conducted extensive Skellam-based Monte Carlo simulations. 30 samples have been generated, each consisting of (100M) minimum bias (MB) events. In each event, the simulated Refmult3X follows the same distributions as the UrQMD model, and and obey Poisson distributions, with and obtained from the corresponding Refmult3X bin in the UrQMD model. Hence, the simulated data we generated are minimum bias samples, and the net-proton number follows the Skellam distributions in each Refmult3X bin. Consequently, the excepted values of and in 0-40% centrality should be unity.
In Fig. 2, the simulated (left panel) and (right panel) values in 0-40% centrality by these two methods are denoted by , , , and , respectively. The corresponding averages of these four variables in 0-40% centrality over all 30 samples are represented by black and red dashed lines in left and right panels, respectively. Indeed, these four averages are all near unity, aligning with the Skellam baseline. Here the averages of and almost identical, resulting in the black and red dashed lines overlapping in the right panel. All four variables display random fluctuations around their average values. The measured values and estimated uncertainties follow statistical principles.
In Fig. 2(a), the differences between each and is visible. Above the line of average, the value of each lie below its corresponding . Below the line of the average value, the value of each is higher than that of . In particular, below 1 of the average (where the error bar does not touch the expectation line), the value of each is significantly closer to the theoretical expectation. Meanwhile, Fig. 2(b) shows similar results for and . Therefore, with a given statistics, these two ratios calculated by CBWC-II method is more close to its expectation in 0-40% centrality.
For these two ratios, Fig. 2 also shows that the errors obtained by CBWC-II are significantly smaller than those obtained by CBWC-I. The ratios of and are shown in Fig. 2(c) and (d), respectively. For these two ratios, all errors obtained using CBWC-II are approximately compared to those obtained using CBWC-I. This decrease in statistical error also aligns with what was demonstrated in the UrQMD results shown in Fig. 1. As we know, when the statistical sample doubles, the associated statistical uncertainty becomes approximately (70.7%) of the original. Therefore, the reduction in uncertainties with the CBWC-II method is akin to doubling the statistical sample in experiment.
In addition, the formula of CBWC-II method is more equivalent to the theoretical formula as shown in Eq. (11). Consequently, the CBWC-II method is a more suitable calculation method for data analysis in 0-40% centrality. So in comparison to the CBWC-I, the CBWC-II method more precisely measures the hyperorder cumulants.
3.2 Influence of weighted factor in average
Before implementing the CBWC-III method, let’s first discuss why the error-weighted average can underestimate the measured values of and in the 0-10%, and , and centralities. As stated in Ref [39], the error of the cumulants is intricate and significantly depended on the actual shape of the underlying multiplicity distribution. In addition, the error of is influenced by its measured value, as the same data sample is used to calculate both the measured and its error. Consequently, the error-weighted average can lead to significantly different values of the cumulants.
Simple Skellam simulations are employed to investigate this phenomenon. We initially randomly generate 50 independent samples, each containing events following the Skellam distribution with the input parameters:. Results of the simulated are displayed in Fig. 3(a). In most scenarios, the statistical error associated with tends to rise as the measured value of increases, as shown in Fig. 3(a). With the error-weighted factor being as depicted in Eq. (13), the error-weighted average of is lower that obtained by the event-weighted average. As a result, the error-weighted average of is lower compared to the event-weighted average, illustrated by the red and black lines, respectively.
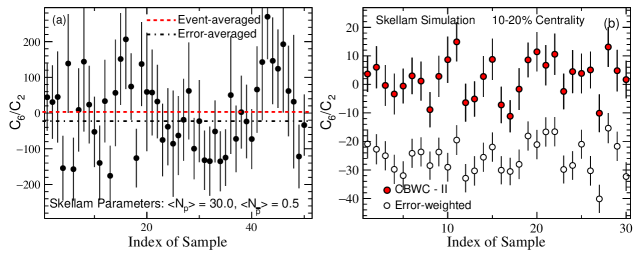
In the central collisions of MB data, there are numerous Refmult3x bins in every centrality, each containing a limited number of events. For instance, with 100M MB data in the UrQMD model at GeV, there are already over 100 Refmult3X bins in the 10-20% centrality, with most of them containing fewer than 0.1M events. Consequently, the effects of the error-weighted in the MB data sample in 10-20% centrality may similar than that shown in Fig. 3(a). Using the Skellam-based simulation data identical to that in Fig. 2, Fig. 3(b) illustrates the difference of in 10-20% centrality between event- and error-weighted averages. It reveals that the measured obtained via event-weighted averages exhibit random fluctuations from the Skellam expectation of unity. Conversely, the values of calculated using error-weighted averages are significantly lower compared to those obtained through event-weighted averages and the Skellam expectation. Therefore, with the RHIC/BES-II statistics, the error-weighted average method cannot be applied to calculate in each centrality in central collisions.
If the events-weighted method is initially utilized to calculate () in each centralities. Subsequently, their values in the 0-40% centrality are weighted according to their respective errors, leading to the development of the proposed CBWC-III method. Although the error-weighted averages can lead to much smaller uncertainties, it does not imply that the CBWC-III method is a superior option for computing and in centrality. This is due to the characteristics of their statistical uncertainties. In a normal distribution, the delta theorem method shows that the error of is :
| (14) |
Here is the standard deviation of the net-proton multiplicity distributions. From peripheral to central collisions, there is a noticeable increase in the standard deviation, as evident in Fig. 1. The minimum bias data sample shows nearly identical numbers of events in the 0-10%, 10-20%, 20-30% and 30-40% centralities. Therefore, there is a significant rise in the associated statistical error from peripheral to central collisions. When employing the error-weighted scheme illustrated in Eq. (13) to determine the results of hyper-order cumulants in 0-40% centrality, the results in the 0-10% centrality can be almost negligible.

By using CBWC-III method, Fig. 4 shows the Skellam-based simulation results of net-proton (a) and (b) in 0-40% and 10-40% Au + Au collisions centralities at = 11.5 GeV. As anticipated, the statistical uncertainties of and in 0 - 40% centrality obtained by the CBWC-III method are significantly smaller for each sample, comparing to those obtained by CBWC-II method shown in Fig. 2. However, the values of both and in 0-40% and 10-40% central collisions are almost the same, with the central value measured and the statistical uncertainty associated being indistinguishable. The measurement of the cumulant ratio in centrality is widely recognized as crucial for studying the QCD phase transition, including of net-proton number, net-charge and net-kaon, among others [49, 50, 51]. Therefore, when employing the CBWC-III method with the MB trigger data sample, it is essential to carefully assess the measured and .
3.3 Comparisons in the UrQMD model
We start by summarizing the factors considered to evaluate the method’s suitability in our research. Initially, the result should align with theoretical expectations and not be underestimated. Additionally, as it is most probable to reach thermal equilibrium and undergo a phase transition in the most central collisions (0-10%), the result in 0-10% centrality hold the most significance and should not be disregarded. Lastly, combined with these two conditions, having smaller statistical errors is preferred, particularly due to the limited statistics available for analyzing these two ratios.
Fig. 5 shows the net-proton and in 0-40% and 10-40% centralities at = 11.5 GeV in the UrQMD model using the CBWC-I, -II, and -III methods. With the CBWC-III method, the results of these two ratios in 0-40% and 10-40% centralities are found to be identical. It means that the result in 0-10% centrality is disregarded. On the contrary, the values of these two ratios in the 0-40% centrality are notably lower than those in the 10-40% centrality. This discrepancy is attributed to the significantly lower results of these ratios in the 0-10% centrality compared to the 10-20%, 20-30%, and 30-40% centralities in the UrQMD model, as illustrated in Fig. 1. This indicates that the results in the 0-10% centrality play a significant role in determining the final measured results in the 0-40% centrality.
Fig. 5 also illustrates that the errors of these two ratios calculated using CBWC-II are notably smaller than those calculated using CBWC-I. Furthermore, as demonstrated in Fig. 2, the values of these ratios align with the theoretical expectations when computed using both methods. As a result, the CBWC-II method is deemed more appropriate for data analysis.
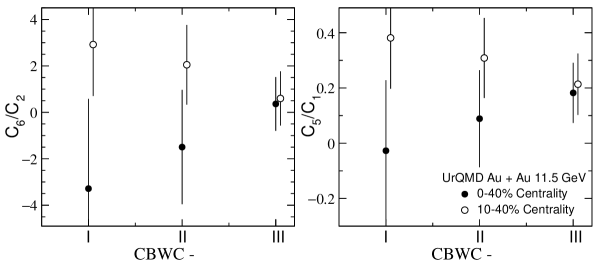
Of course, here we propose using the CBWC-II method to calculate these two ratios within a large 0-40% centrality when employing the CBWC method. However, the UrQMD results in Fig. 1 show that these two ratios in 0-10% centrality differ significantly from those in other centralities. Consequently, fundamentally, the results obtained by a higher statistics sample of events in 0-10% centrality are still remain the most valuable for studying the QCD phase transition.
4 Summary
The hyperorder cumulants are proposed to study the QCD phase transition. To minimize uncertainty, experimental analysis focuses on studying the energy dependence within a broader centrality bin width of 0-40%, rather than narrower widths like 0-10% or 0-5%. This expanded centrality bin width makes the hyperorder cumulants more sensitive to the schemes of the CBWC method, which are utilized to suppress initial volume fluctuations. Variations in volume cancellation methods or weighting schemes within the CBWC formula can result in notable discrepancies in the obtained results.
We examine the impact of various CBWC methods on the net-proton and measurements in Au + Au collisions using the UrQMD model and Skellam-based simulations. Utilizing MB data samples to calculate these ratios in the 0-40% centrality, it reveals that the error-weighted average can not be used to calculate these two cumulant ratios in any scenario. Directly applying the error-weighted average in the 0-10%, 10-20%, 20-30%, and 30-40% centralities can result in underestimated measurements. In contrast, the event-weighted method is initially employed to calculate () in those four centralities. Subsequently, the () values in the 0-40% centrality are weighted according to their respective errors (CBWC-III). This approach can lead to the and values in the 0-10% centrality being almost negligible. The results in the 10-40% and 0-40% centralities are indistinguishable, encompassing both the measured central value and its associated statistical uncertainty. This lack of distinction is not conducive for using these two ratios to analyze the QCD phase transition, as it is more probable to approach thermal equilibrium and undergo a phase transition in the most central collisions.
By employing the event-weighted scheme, the direct calculation of in each multiplicity bin (CBWC-II) is favored over the separate computation of and in each bin (CBWC-I). The formula of the CBWC-II method aligns more closely with the theoretical rationale of eliminating volume contributions. In our research, for eight centralities from 0-10% to 70-80%, the discrepancies in the measured values of (and ) between these two methods are negligible. However, with a wider centrality bin width of 0-40%, the errors for both and obtained using the CBWC-II method are significantly reduced, approximately 60% 70% compared to those obtained through CBWC-I method. This impact of the decreased uncertainty is equivalent to doubling the statistical sample in experiment.
The statistics in our calculations can be compared with RHIC/BES-II data. The centrality has already been determined using Refmult3X. Therefore, our results and discussions provide a straightforward reference for the measurements of and in relativistic heavy-ion collisions.
5 Acknowledgements
This work is supported by the National Key Research and Development Program of China (No. 2022YFA1604900); the National Natural Science Foundation of China (No. 12275102), and the Scientific Research and Innovation Team Program of Sichuan University of Science and Engineering (No. SUSE652A001). We also acknowledge the High Performance Computing Center of Nanjing University of Information Science and Technology for their support of this work.
References
References
- [1] A. Bzdak, S. Esumi, V. Koch, J. Liao, M. Stephanov, and N. Xu, Phys. Rept. 853, 1 (2020).
- [2] M. A. Stephanov, Phys. ReV. Lett 102, 032301 (2009).
- [3] M. Asakawa, S. Ejiri, and M. Kitazawa, Phys. ReV. Lett 103, 262301 (2009).
- [4] M. A. Stephanov, Phys. ReV. Lett 107, 052301 (2011).
- [5] A. Bazavov et al., (HotQCD Collaboration) Phys. Rev. D 96, 074510 (2017).
- [6] Xin An et al., Nucl. Phys. A 1017, 122343 (2022).
- [7] M. Cheng et al., Phys. Rev. D 79, 074505 (2009).
- [8] C. Schmidt, prog. Theor. Phys. Suppl. 186, 563 (2010).
- [9] A. Bazavov et al., (HotQCD Collaboration) Phys. Rev. D 95, 054504 (2017).
- [10] A. Bazavov et al., (HotQCD Collaboration) Phys. Rev. D 101, 074502 (2020).
- [11] Kenji Morita et al., Phys. Rev. C 88 034903, (2013).
- [12] V. Skokov, B. Friman and K. Redlich, Phys. Lett. B 708, 179 (2012).
- [13] B. Friman et al., Eur. Phys. J. C 71, 1694 (2011).
- [14] Wei-jie Fu et al., Phys. Rev. D 104, 094047 (2021).
- [15] Wei-jie Fu et al., arXiv:2308.15508 [hep-ph].
- [16] M. S. Abdallah et al., (STAR Collaboration), Phys. Rev. Lett 127, 262301 (2021).
- [17] B. E. Aboona et al., (STAR Collaboration), Phys. Rev. Lett 130, 082301 (2023).
- [18] V. Vovchenko et al., Phys. Lett. B 811, 135868 (2020).
- [19] V. Vovchenko, R. V. Poberezhnyuk and V. Koch, JHEP 10, 089 (2020).
- [20] V. Vovchenko, Phys. Rev. C 105, 014903 (2022).
- [21] V. Vovchenko, V. Koch and C. Shen, Phys. Rev. C 105, 014904 (2022).
- [22] L.-Z. Chen et al.., Chin. Phys. C 45, 104103 (2021).
- [23] Lizhu Chen et al.., Phys. Rev. C 109, 034911 (2024).
- [24] P. Garg et al., Phys. Lett. B 726, 691 (2013).
- [25] Adam Bzdak, Volker Koch and Vladimir Skokov, Phys. Rev. C 87, 014901 (2013).
- [26] Adam Bzdak, Romain Holzmann and Volker Koch, Phys. Rev. C 94, 064907 (2016).
- [27] M. Asakawa, M. Kitazawa, B. Müller, Phys. Rev. C 101, 034913 (2020).
- [28] Qian Chen and Guo-Liang Ma, Phys. Rev. C 106, 014907 (2022).
- [29] Qian Chen et al., arXiv: 2402. 12823 [nucl-th].
- [30] V. Skokov, B. Friman, K. Redlich, Phys. Rev. C 88, 034911 (2013).
- [31] A. Rustamov, J. Stroth, and R. Holzmann Nucl. Phys. A 1034 122641 (2023).
- [32] Romain Holzmann, Volker Koch, Anar Rustamov, Joachim Stroth, arXiv: 2403.03598 [nucl-th].
- [33] X. Luo (For the STAR Collaboration), J. Phys. : Conf. Ser. 316, 012003 (2011).
- [34] Xiaofeng Luo, Nu Xu. Nucl. Sci. Tech. 28, 112 (2017).
- [35] M. S. Abdallah et al., (STAR Collaboration), Phys. Rev. C 104, 024902 (2021).
- [36] L.-Z. Chen et al., Nucl. Phys. A 957 60 (2017).
- [37] Chen Li-Zhu et al., Chin. Phys. C 41, 104103 (2017).
- [38] X. Luo, N. Xu, Nucl. Tech. 28, 112 (2017).
- [39] Adam Bzdak, Volker Koch, Phys. Rev. C 100, 051902 (2019).
- [40] Skellam J G, Journal of the Royal Statistical Society,109, 296 (1946).
- [41] P. Braun-Munzinger et al., Phys. Rev. C 84, 064911 (2011).
- [42] Xue Pan et al., Phys. Rev. C 89, 014904 (2014).
- [43] S. A. Bass et al., Prog. Part. Nucl. Phys. 41, 255 (1998).
- [44] M. Bleicher et al., J. Phys. G25, 1859 (1999).
- [45] Ashish Pandav (for the STAR Collaboration), ”Precision measurement of net-proton number fluctuations in Au+Au collisions at RHIC”. Talked at CPOD2024, May 20-14, 2024.
- [46] B. Efron, Ann. Statist. 7, 1 (1979).
- [47] A. Pandav, D. Mallick and B. Mohanty, Nucl. Phys. A 991, 121608 (2019).
- [48] X. Luo, J. Phys. G 39, 025008 (2012).
- [49] J. Adam et al., (STAR Collaboration), Phys. Rev. Lett 126, 092301 (2021).
- [50] L. Adamczyk et al., (STAR Collaboration), Phys. Rev. Lett 113, 092301 (2014).
- [51] L. Adamczyk et al., (STAR Collaboration), Phys. Lett. B 785, 551 (2018).