Also at ]Ikerbasque, Basque Foundation for Science, Bilbao 48009, Spain
A mathematical model of CAR-T cell therapy in combination with chemotherapy for malignant gliomas
Abstract
We study the dynamics and interactions between combined chemotherapy and chimeric antigen receptor (CAR-T) cells therapy and malignant gliomas (MG). MG is one of the most common primary brain tumor, with high resistance to therapy and unfavorable prognosis. Here, we develop a mathematical model that describes the application of chemo- and CAR-T cell therapies and the dynamics of sensitive and resistant populations of tumor cells. This model is a five-dimensional dynamical system with impulsive inputs corresponding to clinical administration of chemo- and immunotherapy. We provide a proof of non-negativeness of solutions of the proposed model for non-negative initial data. We demonstrate that if we apply both therapies only once, the trajectories will be attracted to an invariant surface that corresponds to the tumor carrying capacity. On the other hand, if we apply both treatments constantly, we find regions of the parameter where the tumor is eradicated. Moreover, we study applications of different combinations of the above treatments in order to find an optimal combination at the population level. To this aim, we generate a population of virtual patients with the model parameters uniformly distributed in the medically relevant ranges and perform in silico trials with different combinations of treatments. We obtain optimal protocols for several different relations of tumor growth rates between sensitive and drug resistant cells. We demonstrate that the tumor growth rate, efficacy of chemotherapy, and tumor immunosuppression are the parameters that mostly impact survival time in in silico trials. We believe that our results provide new theoretical insights to guide the design of clinical trials for MG therapies.
Malignant gliomas (MG), the most common primary brain tumors, are characterized by high invasiveness and resistance to therapy, with a median survival of less than 15 months despite standard multimodal treatments like the Stupp protocol. Novel Chimeric Antigen Receptor (CAR)-T cell therapies have shown revolutionary potential in oncology but face significant challenges in solid tumors like MG, including antigen heterogeneity, immunosuppressive tumor microenvironment, and blood-brain barrier limitations. Recent advances, such as CARs targeting multiple antigens, aim to overcome these obstacles.
Chemotherapy, such as temozolomide (TMZ), has opposite effects on CAR-T cells: while it directly kills CAR-T cells, it can also enhance their efficacy. Chemotherapy can upregulate tumor antigen expression, improving CAR-T cell targeting, and lymphodepleting regimens can create a more favorable immune microenvironment to support CAR-T cell activity. Preclinical studies and ongoing clinical trials suggest that this combination may provide synergistic benefits in MG treatment. To explore this, we develop a mathematical model to analyze the dynamics of combined therapy and identify optimal treatment strategies using analytical and numerical methods.
Our mathematical framework, under constant treatment for both therapies, identifies feasible critical thresholds for TMZ and CAR-T cell doses that could lead to tumor eradication. For patient toxicological constraints, we then simulate several clinically feasible therapeutic protocols with periodic administrations. We first study TMZ and CAR-T cells applications as monotherapy. Our model highlights the critical role of tumor immunosuppression, which can limit the efficiency of CAR-T cells. In general, our results are in agreement with clinical data, demonstrating the robustness and predictive value of our model.
We also consider different combinations of TMZ and CAR-T cells treatments to find the best one. We compare the results and investigate the impact of the parameters on the survival of virtual patients. Our results show the key roles of tumor proliferation, TMZ killing efficacy, and tumor immunosuppression as survival prognosis biomarkers. We found that alternating between CAR-T cell treatment and TMZ achieves the best results in terms of in silico patient overall survival, with a median of nearly 650 days. Our results provide theoretical insights to guide the design of clinical trials for MG therapies.
I Introduction
Gliomas are the most common type of primary brain tumor, with glioblastomas (GBM) representing the most aggressive and therapeutically challenging subtype due to their highly infiltrative nature, which prevents complete eradication by current treatments Lerner et al. (2024). Patients with gliomas typically succumb to complications arising from tumor progression. The current standard of care for aggressive MG such as GBM, known as the Stupp protocol Stupp et al. (2005), combines surgical resection with chemoradiotherapy using temozolomide (TMZ) as chemotherapy. Despite this multimodal approach, the prognosis remains poor, with a median overall survival of less than 15 months Stupp et al. (2005).
To address the fatal prognosis associated with gliomas, novel therapies and combinations of innovative and traditional approaches are under investigation. Among these, Chimeric Antigen Receptor (CAR)-T cell therapy has emerged as one of the most promising and revolutionary cancer treatments in recent decades. For recent reviews on the applications of CAR-T therapy to gliomas, see Filley, Henriquez, and Dey (2018); Thomas et al. (2023); Montoya et al. (2024); Goutnik et al. (2024).
CAR-T cells are genetically modified T cells, derived either autologously (from the patient) or allogeneically (from a donor). Their extracellular domain is engineered to recognize specific tumor-associated antigens, while the intracellular domain contains signaling elements that trigger T-cell activation. Upon CAR engagement with the associated antigen, primary T-cell activation occurs, leading to cytokine release, cytolytic degranulation, target cell death, and T-cell proliferation Feins et al. (2019).
CAR-T cells targeting CD19+ cells have demonstrated remarkable success in treating B-cell malignancies, particularly in patients with acute lymphoblastic leukemia Maude et al. (2018); Miliotou and Papadopoulou (2018). Similarly, positive outcomes have been achieved in multiple myeloma D’Agostino and Raje (2020), diffuse large B-cell lymphoma Chavez, Bachmeier, and Kharfan-Dabaja (2019), and refractory acute myeloid leukemia using CD33-specific CAR-T cells Wang et al. (2014). These encouraging results have driven extensive research into the application of CAR-T therapies for solid tumors Martinez and Moon (2019), with ongoing clinical trials investigating their potential in glioblastomas, as well as gastrointestinal, genitourinary, breast, and lung cancers, among others Bagley and O’Rourke (2019). Despite this progress, CAR-T therapy for solid tumors faces significant hurdles. The primary challenge lies in identifying tumor-specific antigens that are exclusively expressed on cancer cells to minimize on-target off-tumor toxicity Castellarin et al. (2018); Kringel, Lamszus, and Mohme (2023). Another critical consideration is ensuring that the selected antigens for therapy are humanized to prevent the development of neutralizing antibodies against the CAR-T cells Hege et al. (2017). Beyond antigen targeting, several additional challenges remain, including the persistence and expansion of CAR-T cells, their ability to effectively infiltrate and traffic into tumors, and the impact of tumor-driven immune resistance mechanisms, all of which can significantly affect CAR-T cell efficacy Ma et al. (2019); Kringel, Lamszus, and Mohme (2023).
For these reasons, it is crucial to develop strategies to enhance and optimize the effectiveness of CAR-T cell therapy Hong, Clubb, and Chen (2020). It is a more challenging task since brain tumors are highly heterogeneous, with tumor cells often failing to uniformly express the same antigens Bodnar et al. (2023). This heterogeneity limits the efficacy of CAR-T therapies, as they may not target all tumor cells. In addressing this issue, novel dual-specific tandem CAR-T cells have shown promising in vitro efficacy in overcoming antigen specificity challenges Schmidts et al. (2023). These CAR-T cells are engineered to simultaneously target two well-characterized glioblastoma antigens, EGFRvIII and IL-13R2, which are frequently expressed in GBM cells but completely absent in normal brain tissue. Moreover, trivalent CAR-T cells capable of targeting three antigens simultaneously offer promising solutions to this issue, potentially covering a broader spectrum of GBM cells Bielamowicz et al. (2017).
A promising approach involves combining CAR-T therapy with chemotherapy. This strategy could leverage chemotherapy to eliminate tumor cells that do not express the antigens required for CAR-T cell recognition and attack. In fact, chemotherapy has been shown to enhance the expression of tumor antigens in solid tumors, thus amplifying the immune response. This effect has been demonstrated in GBM models using NKG2D CAR-T cells, where chemotherapy improved CAR-T cell efficacy by increasing target antigen availability Weiss et al. (2018). Subsequently, CAR-T cells could be administered to target residual antigen-expressing tumor cells, providing a more thorough and effective treatment approach. In addition, a issue with chemotherapy is drug resistance development, often leading to treatment failure. In this case, the combination of CAR-T cell therapy with chemotherapy could circumvent this problem. After chemotherapy treatment, CAR-T cells can target and destroy the resistant cells. Furthermore, gliomas present significant barriers to effective therapy, including immunosuppressive tumor microenvironments and the restrictive blood-brain barrier Kringel, Lamszus, and Mohme (2023). Lymphodepleting chemotherapy, which involves reducing the host’s immune cell population to create space for CAR-T cells and other therapeutic agents, is under investigation as a means to overcome these challenges Monje et al. (2024). By weakening immune suppression and facilitating the trafficking of CAR-T cells to the tumor site, this approach has the potential to improve therapeutic efficacy.
Although preclinical studies have shown the potential of such combination approaches in animal models Suryadevara et al. (2018); Lamb et al. (2021), the effectiveness in clinical practice is being investigated within an ongoing trial (NCT04165941) Lamb et al. (2023). At this point, mathematical models can help describe, understand, and predict the effects of this therapy combination on tumors. In silico trials use virtual simulations to model such experiments, offering a powerful tool in mathematical oncology (Gevertz and Wares, 2024; Wang et al., 2024). These computational approaches help support clinical trials by reducing their risk of failure through mechanistic and predictive simulations (Brown et al., 2022).
Mathematical models, which serve to describe, quantify, and predict complex behaviors, hold significant potential in optimizing administration protocols, deepening the understanding of therapeutic dynamics, and aiding in the design of clinical trials Altrock, Liu, and Michor (2015). These models can unravel intricate systems, such as those involving interactions between immune systems, tumor cells, healthy cells, and treatments, and have been widely used for this purpose in recent years. Recent mathematical modeling studies have investigated various aspects of CAR-T cell therapies Sahoo et al. (2020); Kimmel, Locke, and Altrock (2021); Barros, Rodrigues, and Almeida (2020); Mostolizadeh, Afsharnezhad, and Marciniak-Czochra (2018); León-Triana et al. (2021); Pérez-García et al. (2020); Serrano et al. (2024).
In this paper, we employ an ordinary differential equation mathematical model to study the response of MG to the combination of CAR-T therapy and chemotherapy. As chemotherapeutic agent, we take temozolamide (TMZ), which is the standard chemotherapeutic agent for this kind of tumors Friedman, Kerby, and Calvert (2000); Stupp et al. (2005). We make a theoretical study of the model, showing the existence of steady states, stability and positivity of solutions, and calculating invariant surfaces of the mathematical model. We consider two kinds of treatments, constant and periodic treatments, and we study the insights of these treatments from the mathematical and medical points of view, performing numerical simulations.
The paper is organized as follows. In Section II, we introduce the mathematical model under consideration, explaining the variables and parameters of the model. Next, in Section III, we study the dynamics and the stability of the model system using the qualitative theory of differential equations and analyze the asymptotic dynamics of our model. Section IV presents numerical results for the applications of TMZ monotherapy, of CAR-T cell monotherapy, and finally of combined treatment of CAR-T and TMZ. Lastly, in Section V, we discuss and summarize our conclusions.
II Model presentation
In this study, we model malignant glioma cells, categorizing them as either sensitive or resistant to CAR-T cell therapy. Specifically, sensitive cells express the antigen or antigens recognized by CAR-T cells, enabling targeted destruction, while resistant cells lack this expression, evading immune-mediated killing. Additionally, the model incorporates sensitivity and resistance to temozolomide (TMZ), the standard chemotherapeutic agent for gliomas. Over time, a subset of tumor cells may remain sensitive and responsive to treatment, while others acquire resistance, reflecting the complex and dynamic nature of tumor heterogeneity under dual therapy.
Finally, we consider the dynamics of the applied treatments. TMZ decays exponentially between consecutive administrations, while the CAR-T cells are in competition with the tumor cells. We assume that TMZ kills TMZ sensitive tumor cells and CAR-T cells, while CAR-T cells attack only the tumor population in which the tumor antigen is expressed.
Thus, according to what was previously mentioned, it follows that the variables involved in the model are:
-
•
is the number of sensitive tumor cells to the CAR-T and TMZ treatment;
-
•
is the number of tumor cells resistant to the CAR-T treatment (and sensitive to TMZ);
-
•
is the number of tumor cells resistant to TMZ (and sensitive to CAR-T);
-
•
is the number of CAR-T cells;
-
•
is the efficacy of the TMZ.
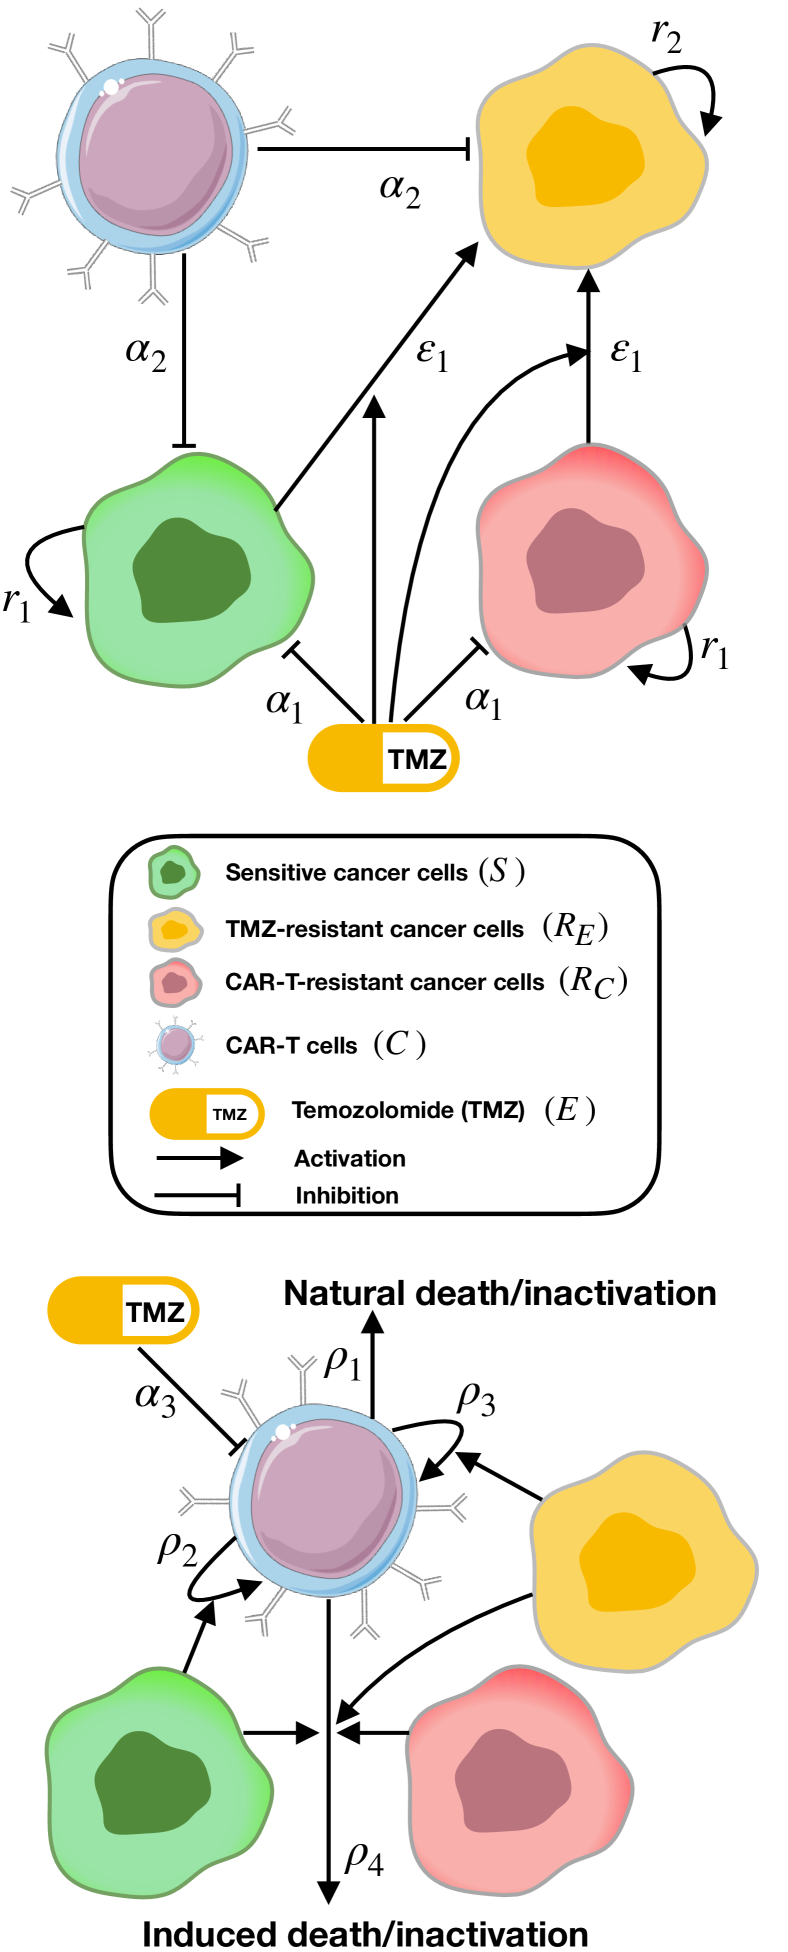
Figure 1 represents graphically the model, showing the variable interactions focusing on the cancer cells dynamics and how treatments affect them (top), and on the CAR-T cells dynamics (bottom).
Then, the model reads
| (1) | |||||
| (2) | |||||
| (3) | |||||
| (4) | |||||
| (5) |
Equation (1) describes the dynamics of the sensitive tumor cell population (). In the absence of treatments, these cells grow following a logistic model characterized by a proliferation rate and a carrying capacity . TMZ kills sensitive cells with a rate , while simultaneously inducing resistance with a rate . Additionally, CAR-T cells target and eliminate sensitive cells at a rate , further modulating the population dynamics.
| Parameter | Description | Reference value | Unit | References |
|---|---|---|---|---|
| mitotic stimulation of CAR-T cells by sensitive tumor cells | 0.2-0.9 | day-1 | [León-Triana et al., 2021] | |
| mitotic stimulation of CAR-T cells by resistant tumor cells | 0.2-0.9 | day-1 | [León-Triana et al., 2021] | |
| CAR-T concentration for half-maximal tumor inactivation | cell | [León-Triana et al., 2021] | ||
| tumor inactivation rate | 0.01-0.2 | day-1 | [Santurio and Barros, 2022] | |
| activated CAR-T cell mean lifetime in the tumor site | 1/7-1/30 | day-1 | [Ghorashian et al., 2019] | |
| sensitive tumor growth rate | 0.001-0.025 | day-1 | [León-Triana et al., 2021] | |
| TMZ-resistant tumor growth rate | 0.0005-0.05 | day-1 | assumed | |
| T cells concentration for half-maximal CAR-T cell proliferation | cell | [León-Triana et al., 2021] | ||
| Chemotherapy killing efficiency against tumor | 0.1-1 | day-1 | [Delobel et al., 2023] | |
| CAR-T cells killing efficiency against tumor | day-1cell-1 | [León-Triana et al., 2021] | ||
| Chemotherapy killing efficiency against CAR-T | 0.1-1 | day-1 | assumed | |
| transition rate from chemosensitive to chemoresistant cancer cells | day-1 | [Delobel et al., 2023] | ||
| tumor carrying capacity | cell | [Bodnar et al., 2024] | ||
| CAR-T cells dosage | cells | [Goff et al., 2019] | ||
| TMZ clearance rate | day-1 | [Delobel et al., 2023] | ||
| initial fraction of resistant to CAR-T cells | - | [O’Rourke et al., 2017] | ||
| initial fraction of resistant to TMZ cells | - | assumed |
Equation (2) models the dynamics of CAR-T resistant cells (), essentially the same as the previous equation (1), with the exception that these tumor cells do not express the antigen and, thus, are not affected by CAR-T cells (the term with is absent).
Equation (3) describes the dynamics of resistant tumor cells to the efficacy () of TMZ (). In the absence of treatments, these cells grow following a logistic growth, such as the sensitive cells (), characterized by the same carrying capacity and a proliferation rate , which may differ from that of the sensitive cells (). CAR-T cells target and eliminate also these cells at the rate , since the cells express the target antigen as the cells. The final term represents the conversion of TMZ-sensitive cells ( and ) into TMZ-resistant cells (), governed by the rate .
Equation (4) models the dynamics of CAR-T cells. The first term represents the natural death or inactivation of activated CAR-T cells, occurring at a rate . The second and third terms describe the proliferation of CAR-T cells upon encountering CAR-T sensitive tumor cells ( and ), with rate constants and and saturation levels and , respectively. The fourth term accounts for the inactivation of CAR-T cells by tumor cells and their microenviroment, with a rate per tumor cell and a saturation threshold of CAR-T cells. Finally, the last term captures the destruction of CAR-T cells by TMZ at a rate .
Lastly, equation (5) is a first-order kinetics describing the normalized concentration of the drug, i.e., the efficacy of the drug (), which exponentially decays with a constant rate .
During computations, we initially assume that there are tumor cells in total, . We also set the fractions of resistant cells and , which we denote and , respectively. Thus, initial conditions for tumor cells are given by
| (6) |
We also assume that the fatal tumor volume is , that is cells.
The administration of CAR-T cells and TMZ follows discrete treatment protocols, with specific dosing schedules that significantly influence the system dynamics. These treatments are modeled as instantaneous events due to the nature of CAR-T injections and the rapid pharmacokinetics of TMZ, where peak plasma concentrations are typically reached within 30–90 minutes post-administration Portnow et al. (2009), a timeframe much shorter than tumor growth dynamics. The application of treatments introduces discontinuities in the treatment state variables Delobel et al. (2023); Italia et al. (2023). Specifically, the time integration of the system is halted at the exact moment a treatment is administered, the affected variables (CAR-T cell concentration and drug efficacy ) are updated to reflect the treatment’s dosage, and the integration is resumed with the modified initial conditions. This approach captures the impulsive nature of therapeutic interventions within the continuous framework of the ordinary differential equation model.
Let be a period of administration of TMZ and be a period of administration of CAR-T cells. We also denote by the number of TMZ cycles and by the number of CAR-T injections. Then
| (7) |
where is the total amount of administered CAR-T cells and is the normalized amount of administered TMZ for each dosage ().
For the rest of the variables, we assume continuity at these points
| (8) | |||
We conduct a comprehensive review of the literature and experimental data to obtain biologically relevant values for the model parameters. Table 1 summarizes the parameters, detailing their biological meanings, assigned values, and corresponding sources.
When MG becomes resistant to TMZ, the cancer growth rate () can vary depending on multiple factors, including the underlying resistance mechanisms and the tumor microenvironment. In this study, we assume that TMZ resistance is achieved through energy-dependent mechanisms, leading to a reduced growth rate, as suggested by several studies (e.g. references Campos et al. (2014); Stepanenko et al. (2016); Yuan et al. (2018); Dai et al. (2018)). Specifically, we set for each virtual patient throughout the manuscript. However, previous reports have indicated that TMZ-resistant cells may exhibit growth rates similar to or higher than those of TMZ-sensitive cells Gupta et al. (2014); Stepanenko et al. (2016); Dai et al. (2018); Delobel et al. (2023). To address these scenarios, we relax this assumption and analyze the implications in Section IV.5, Fast-growing TMZ-resistant cells.
To the best of our knowledge, experiments directly testing TMZ’s cytotoxic efficacy against CAR-T cells in MG patients have not been conducted. However, since CAR-T cells share characteristics of actively proliferating cells with MG and TMZ kills actively proliferating cells, we assume that TMZ’s killing efficacy against CAR-T cells () is comparable to its efficacy against tumor cells (). For simplicity, we adopt for each virtual patient throughout the manuscript.
Different mechanisms are responsible for the intrinsic (inherent ability of MG to resist TMZ) and acquired (develops during or after treatment) TMZ-resistance in MG Tomar et al. (2021). The primary mechanism of intrinsic resistance is the expression of the O6-Methylguanine-DNA Methyltransferase (MGMT) gene, which encodes a DNA repair enzyme. In fact, high levels of MGMT expression are associated with poor response to TMZ Tomar et al. (2021). However, the initial fraction of TMZ-resistant cells in MG () has not been clearly characterized. Here, we assume in to always account for intrinsic resistance but maintaining at the same time a predominance of MG sensitive cells before treatment.
III Analysis of the model
In this section, we conduct a theoretical study of the mathematical model, initially considering treatment with a single dose of CAR-T and TMZ at the beginning of the therapy, and then considering a constant dose for both treatments.
Proposition 1.
System (1) has four invariant surfaces , , and .
Proof.
Let be a vector field associated to (1). Recall that an invariant surface of (1) is a smooth function that satisfies , where the function is called a cofactor. Then it is clear from the definition of an invariant surface that the functions , , and are invariant surfaces of (1) with the cofactors that are the corresponding components of the vector field. This completes the proof. ∎
Now we proceed with the proof of non-negativeness of solutions of (1).
Proposition 2.
If is non-negative, then solutions of (1) are non-negative for non-negative initial conditions.
Proof.
To proof this statement we use the results of works Bernstein and Bhat (1999); Haddad and Chellaboina (2005) (e.g. see Proposition 4.1 from Haddad and Chellaboina (2005)). First we demonstrate that the right-hand side of (1) is essentially non-negative, i.e. at one of the variables equal to zero and the others in . One can see that
| (9) | |||
Therefore, if the conditions of this proposition are satisfied the right-hand side of (1) is essentially non-negative and, hence, for any non-negative initial data solutions of (1) are non-negative. This completes the proof. ∎
Now we consider fixed points of the model (1). The following statement holds:
Proposition 3.
If , then all biologically relevant isolated fixed points of (1) are unstable.
Proof.
Notice that any fixed point of (1) will have zero last component, that is . If, in addition , then there is an invariant surface . Its stability will be considered below and here we do not consider points that belong to it.
The origin is unstable degenerated node since the corresponding eigenvalues of the Jacobi matrix are .
Suppose that and . Then, we obtain that and is a solution of a quadratic equation (recall that ). Thus, we have two fixed points of the form The Jacobi matrix at has a positive eigenvalue of all .
Assume that and . As a consequence, we find that and are solutions of a quadratic equation. If we evaluate the Jacobi matrix on , we find that one of the eigenvalues is positive if .
If and , we find a fixed point . One can see that and, hence, is not relevant in the context of cancer dynamics. One can show that is also unstable for positive values of the parameters. This completes the proof. ∎
Now we consider the stability of the invariant plane of (1) at .
Proposition 4.
If system (1) has an invariant surface , which is locally stable.
Proof.
If we compute the eigenvalues of the Jacobi matrix for (1) at we find that there are two zero and three negative eigenvalues for the values of the parameters from Table. 1. Therefore in the vicinity of any point from there are a stable and a central manifold.
Let us demonstrate that the invariant plane is stable. Computing the eigenvalues of the Jacobi matrix for the subsystem of (1) that consists of the last two equations at we obtain
| (11) |
Now we consider the dynamics in the subspace . Substituting into (1) we obtain a three-dimensional dynamical system
| (12) | |||
which is completely integrable since it has two first integrals
| (13) |
We can reduce (III) to
| (14) |
where , and , , .
Consequently, stability of a fixed point satisfying is reduced to studying stability of fixed point . Differentiating the right-hand side of (14) and substituting into the result, we obtain an expression that is always negative for and and . Therefore, the points that belong to the invariant plane are stable. This completes the proof. ∎
If there is an additional invariant line at , which is given by the following two relations:
| (15) | |||
| (16) |
If we evaluate the Jacobi matrix on this line, there will be always a positive eigenvalue and, hence, this invariant line is unstable.
Summarizing the results above, we see that in system (1) only the surface , which exists at , is attractive. Therefore, only with one initial dosage of both CAR-T cells and TMZ, the tumor cells will proliferate, eventually reaching their carrying capacity, i.e. trajectories of (1) will lie on the surface .
Let us theoretically demonstrate that if we apply both treatments continuously there is the possibility of reaching complete tumor eradication. The following statement holds:
Proposition 5.
Proof.
If we assume that we apply TMZ and CAR-T cells constantly, then system (1) will have the same form with the exceptions of the last two equation, which in this case are
| (17) | |||||
| (18) |
It is easy to demonstrate that system (1), (2), (3),(17) and (18) has a fixed point . The eigenvalues of the Jacobi matrix at this point are
| (19) | |||||
One can see that the first two eigenvalues are always negative for relevant values of the parameters. The last eigenvalue can be considered as a constrain on the dosage of CAR-T cells which is necessary to destroy the population that is resistant to TMZ. The condition on the is
| (20) |
In the worst case scenario with maximal values (according to Table 1) of the parameters in the numerator of (20) (notice that the parameters in the denominator are fixed) the critical value of is approximately .
From (III) it follows that if , then . Thus, the second condition for the stability of is
| (21) |
This can be considered as a constrain on the efficiency of the TMZ against the sensitive population. It follows from (21) that it is better to apply maximal possible dosage of chemotherapy, i.e. set . If , then the critical value of is approximately 0.21 for the maximal value of from Table 1. This completes the proof. ∎
One can see that Proposition 5 provides conditions on the dosage of CAR-T cells and efficiency and dosage of the TMZ that guarantee the stability of the equilibrium with zero amount of tumor cells. Therefore, applying both therapies in the impulsive way described above, we will be pushing a trajectory governed by (1) towards this equilibrium.
IV Numerical computations
In this Section, we discuss the applications of the model (1) for the descriptions of in silico trials. Therefore, we first studied the application of TMZ alone in Section IV.1, then studied the application of CAR-T cell therapy, also alone in Section IV.2, and finally, both therapies in combination in Section IV.3.
For all numerical calculations we use the following non-dimensional variables in system (1), (2),(3),(4), and (5)
| (22) |
This ensures that all variables in the system remain bounded within the interval , which simplifies numerical calculations.
We consider applications of different treatments by in silico trials with virtual cohorts of virtual patients. Note that each virtual patient is characterized by a specific combination of the model parameters, where all parameters in Table 1 that are not constant are drawn uniformly from their respective ranges for each virtual patient.
Throughout the remainder of the manuscript, we denote by the time required for a tumor to reach a critical fatal size of cells, thus representing the survival time. Although there is no exact number for the number of tumor cells in a glioma that leads to death, could correspond approximately to 100 grams or to a volume of , which has been reported as a fatal tumor volume (Delobel et al., 2023). Each treatment protocol is indicated by an upper index added to , specifying the type of treatment and the number of applications. For example, the survival time with no treatment is denoted ; survival time with 10 cycles of TMZ monotherapy is ; and the survival time with only two CAR-T injections is . For combined treatments, the notation reflects the combination of therapies. To denote median values, we use tilde (). For example, the median survival time for a protocol involving 5 cycles of TMZ, followed by 2 CAR-T injections, and an additional 5 cycles of TMZ is .
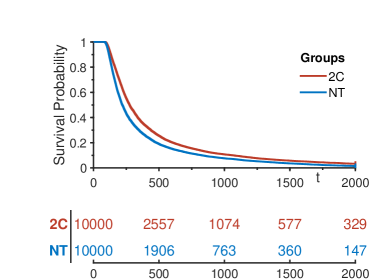
The results of the in silico trials are shown in different figures using Kaplan-Meier (KM) curves and risk tables produced with MathSurv in MatLab Creed, Gerke, and Berglund (2020). KM curves are a statistical tool that is used to estimate and visualize the survival function from data from time to event, commonly in medical research and clinical trials, showing the proportion of participants who survive over time. The curve is a step function that decreases at each time when a death event occurs. The method accounts for censored data, where the exact event time is unknown due to participants being lost to follow-up or the study ending before the event occurs. KM curves can compare survival between different groups, such as no treatment versus treatment or treatment 1 versus treatment 2, often tested using statistical tests such as the log-rank test.
Throughout the text, we use the term median virtual patient (MVP) to refer to a simulated individual whose characteristics–such as tumor parameters, treatment responses, or disease progression–represent the median point of the statistical distribution within a virtual population. Specifically, the MVP is defined by the parametrization using the median values of the distributions listed in Table 1. Notice that for the parameter we used the upper bound 0.1, because the median survival time drops sharply if we increase this boundary further (see Fig. 6).
IV.1 Applications of TMZ monotherapy
Here, we consider only applications of TMZ as monotherapy (so ). We apply cycles of TMZ in the same way they are applied to real patients in the adjuvant part of the Stupp protocol Stupp et al. (2005): each cycle ends for days, where TMZ is given the first five consecutive days, and then days of rest. We assume that we administer the maximum possible dose of TMZ, thus is set to impulsively equal 1 at the beginning of the administration days, specifically during the first days of each TMZ cycle.
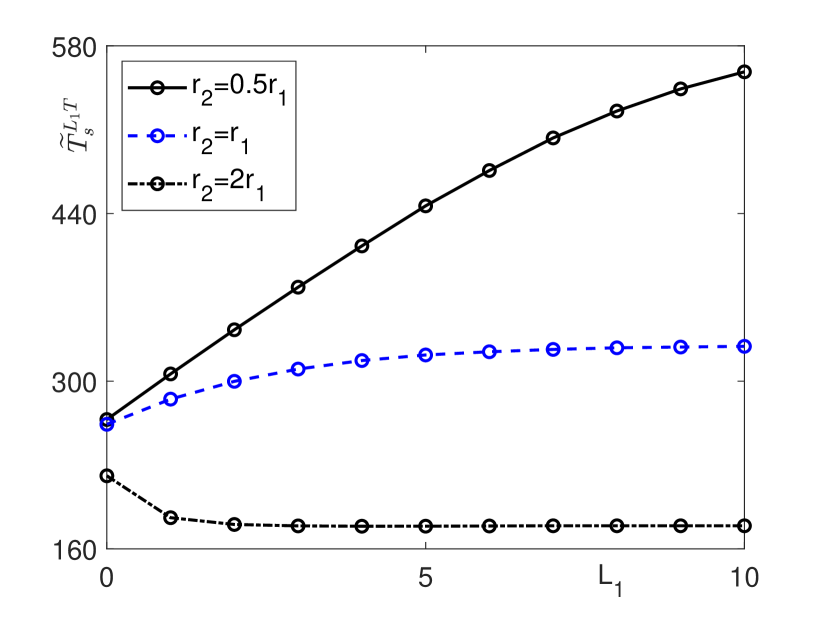
We first investigate the dependence of the median survival time, , on the number of TMZ cycles () in Fig. 2. When the growth rate of TMZ-resistant cells () is smaller or equal to that of sensitive cells (), applying multiple TMZ cycles improves survival outcomes. However, when TMZ-resistant cells grow faster than sensitive cells (), it is more beneficial to avoid TMZ treatment altogether. These findings align with clinical observations, where approximately 50% of glioblastoma patients do not respond to TMZ treatment Lee (2016). Notably, in the case where , the median survival time remains almost constant regardless of the number of TMZ cycles. Thus, combining TMZ with CAR-T cells could be synergistically beneficial for the case. Based on these results, we assume the maximum number of TMZ cycles () in subsequent analyses.
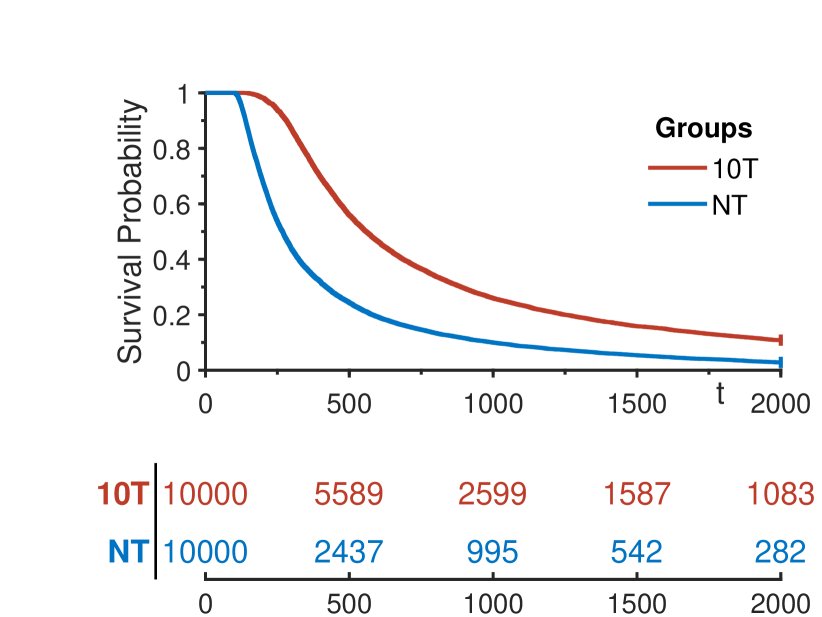
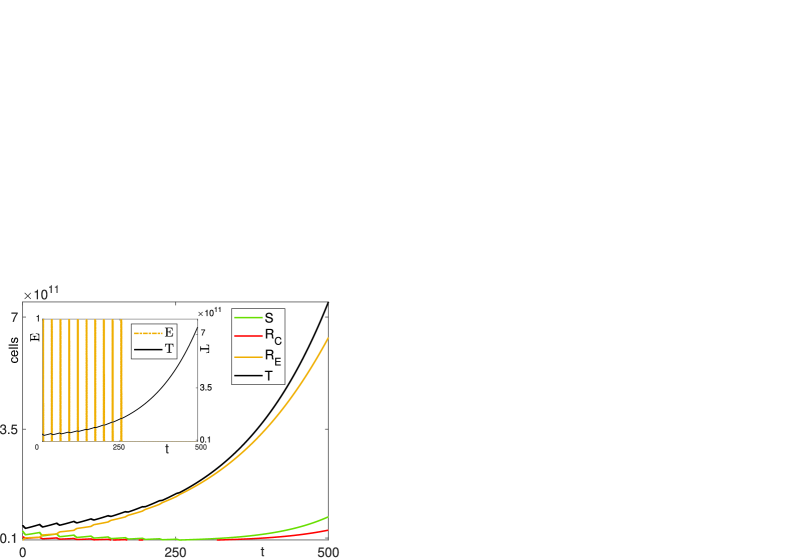
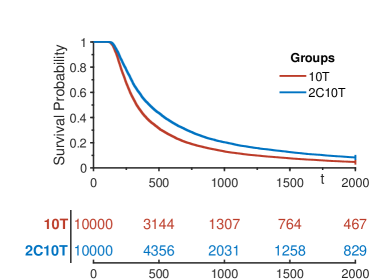
Focusing again in the case with , Fig. 3 shows the KM curves for an in silico trial with 10000 virtual patients, and Fig. 4 the dynamics of the MVP. The application of 10 TMZ has a considerable impact on the sensitive part of the tumor, while the TMZ-resistant part contributes mostly to tumor growth. The median survival time for the protocol with 10 TMZ applications is 558 days, which is considerably higher than that of no treatment (NT), achieving more than a doubled median survival, specifically a gain of 108.21%. Indeed, is 268 days.
| Parameter | r | p-value |
|---|---|---|
| -0.70 | 0.00 | |
| -0.13 | 0.00 | |
| 0.11 | 0.00 |
We also study correlations between the in silico survival and the model parameters, which are given in Table LABEL:t:t3, presenting only statistically significant parameters, i.e., with p-value less than . We apply this to the rest of the tables with correlation coefficients presented below. Notice also that in Table LABEL:t:t3 and in the tables below we present only parameters with correlation coefficient .
It can be observed that the most influential parameter is the tumor growth rate of the sensitive population. Meanwhile, the initial tumor size and the chemotherapy killing efficiency also contribute to the treatment outcomes. In contrast, the remaining parameters have a negligible effect on survival time.
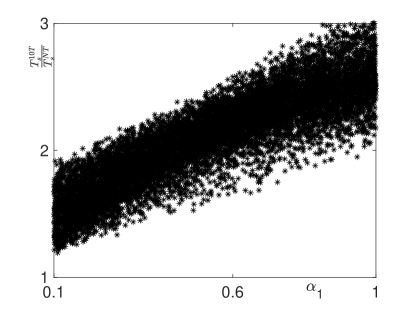
If we consider correlations between the improvement in survival times with 10 TMZ cycles in comparison with the untreated case (the ratio ) of the same virtual patients (same model parametrization in the 2 cases), and the model parameters, the results are different, as shown in Table LABEL:t:t4. We see that TMZ killing efficiency against TMZ-sensitive tumor cells is now the most correlated parameter for improvement in survival, and the fraction of the initially TMZ-resistant population also have a small influence here.
| Parameter | r | p-value |
|---|---|---|
| 0.88 | 0.00 | |
| -0.33 | 0.00 | |
| -0.18 | 0.00 |
The correlation between and is shown in Fig.5.
IV.2 Applications of CAR-T cell monotherapy
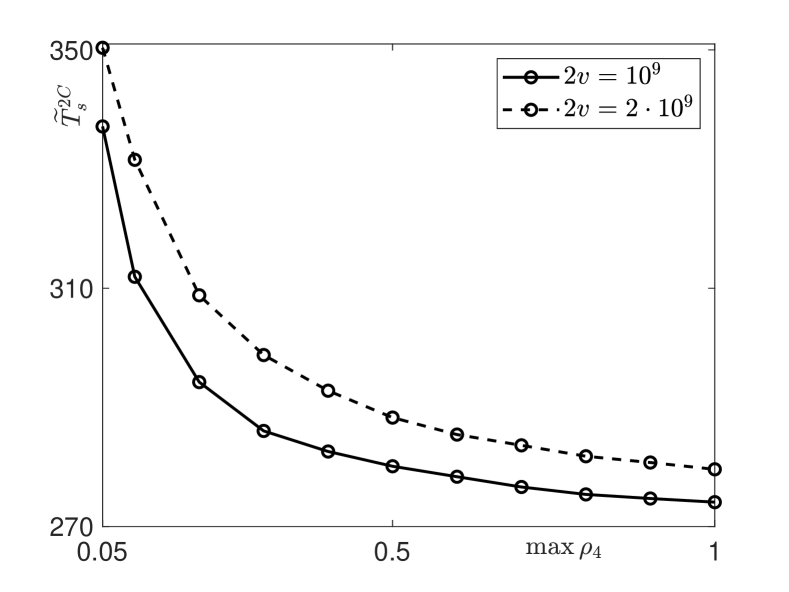
In this Section, we apply only CAR-T cell monotherapy to a set of patients described above, thus . Recall that one of the main challenges for effective CAR-T cell treatment is the immunosuppressive tumor microenvironment Kringel, Lamszus, and Mohme (2023). For the success of CAR-T therapy, the immune properties of the tumor, such as the inactivation rate , are important. Thus, first, we study how the immune suppression affects the median survival time. We consider the same distribution of virtual patients with different maximal values of from to . Notice that we theoretically increase the range of in order to better illustrate the sharp drop in the median survival time. The dependence of the median survival time on the upper bound of the range is demonstrated in Fig. 6. We see that the median survival time drops quite rapidly with the increase in the maximal value of , almost reaching the median survival time in the absence of treatment (268 days). Consequently, we see that for highly immunosuppressive tumors it does not make sense to apply the CAR-T cell therapy. Therefore, throughout the rest of the manuscript, we assume that the maximal value of is .
Now we investigate the dependence of the median survival on different CAR-T cell monotherapy, varying both the number of CAR-T cells injected () and the number of injections (). Figure 7 shows the result of the analysis.
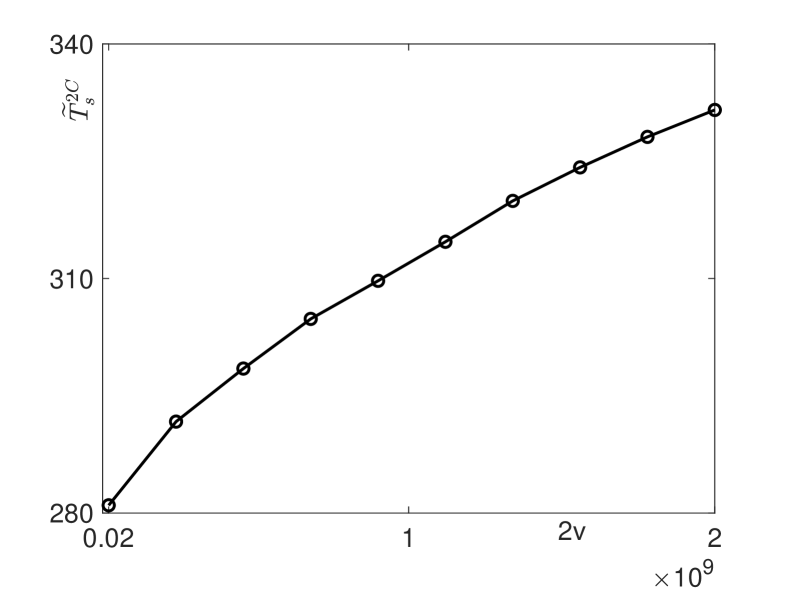
We study the dependence of median survival times for CAR-T treatments on the total dose of CAR-T cells (see the upper panel of Fig. 7). Here, we fix the number of injections of CAR-T cells to 2 (). We find that the more total CAR-T cells are given, the longer the median survival times.
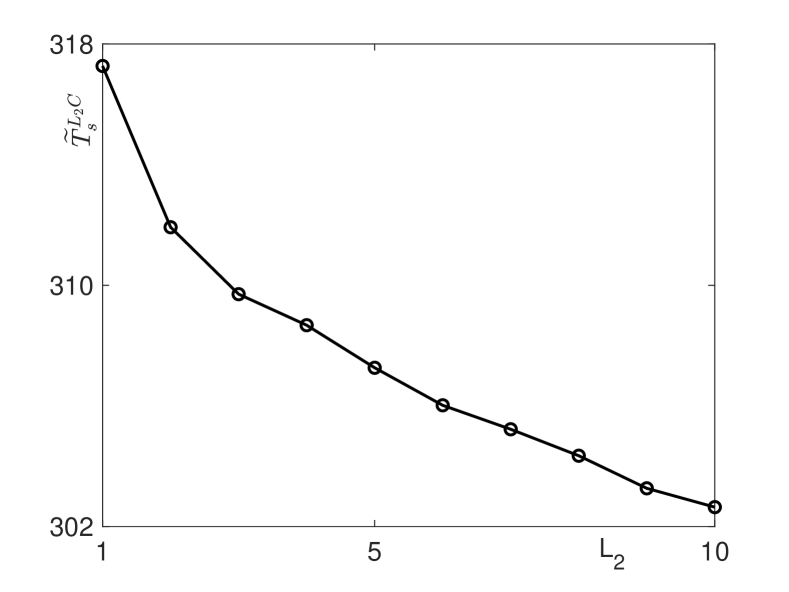
In the bottom panel of Fig. 7, we investigate the impact of the distribution of CAR-T cells as the total dose () across several applications (different ) on the median survival time. The results show that the number of CAR-T applications has a slight impact on the median survival , with the optimal approach being the administration of all CAR-T cells in a single large dose (). However, considering potential side effects and the minimal variation in the median survival time, we recommend dividing the available CAR-T cells into two applications ().
For patient toxicological and manufacturing constraints, we consider two different total dosages of CAR-T that we apply, and , and we distribute CAR-T cells over two applications, that is . Thus, in the first case, CAR-T cells are distributed in two equal doses of cells, while in the second case, CAR-T cells are distributed in two equal doses of cells.
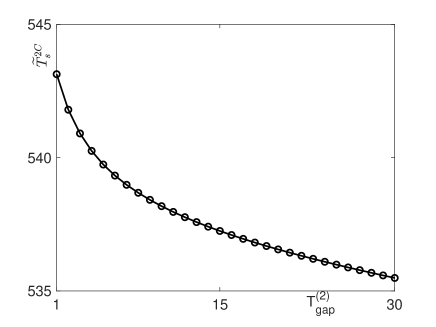
Fig. 8 presents the dependence of the median survival time on the time gap between two applications of CAR-T cells. The results indicate a slight negative impact of increasing the interval between CAR-T injections on survival outcomes. However, to mitigate potential side effects, it is preferable to introduce a gap between CAR-T cell administrations. Considering that the typical lifespan of CAR-T cells in the human body is approximately 7 days, we distribute the CAR-T cells in two injections with a 7-day interval between them.
By performing an in silico trial applying only CAR-T cell monotherapy to a virtual cohort ( virtual patients), there is a slight positive effect on survivals (see KM curves in Fig. 9). The median survival time for the same population with no treatment (NT) is 268 days, while with total CAR-T cells is 312 days and with CAR-T cells is 332 days, achieving a gain of 16.42 % and of 23.88 %, respectively.
In Fig. 10, we present the dynamics of the tumor components and CAR-T cells for the MVP. The results show that CAR-T cells do not proliferate and exert only a minimal impact on tumor dynamics for the MVP, characterized by median parameter values.
| Parameter | r | p-value |
|---|---|---|
| -0.68 | 0.00 | |
| -0.21 | 0.00 |
We find that survival time is strongly correlated with the growth rate of the sensitive population, and weakly correlated with the initial tumor size and the tumor inactivation rate (see Table LABEL:t:t1). If instead of we consider the correlation between the fraction of for CAR-T cell monotherapy over without treatment, we find that the four most important parameters for survival improvements are the tumor inactivation rate , the fraction of resistant cell to CAR-T , and the mitotic stimulation of CAR-T cells by sensitive () and resistant () tumor cells (see Table LABEL:t:t2). However, also mean life of activated CAR-T cells () and the sensitive cells growth rate () are statistically correlated, but with limited impact.
| Parameter | r | p-value |
|---|---|---|
| -0.66 | 0.00 | |
| -0.38 | 0.00 | |
| 0.2 | 0.00 | |
| 0.2 | 0.00 | |
| -0.15 | 0.00 |
This correlation between is also visualized in Fig. 11 for the parameter : the lower the tumor inactivation rate , the greater the improvement with CAR-T cell monotherapy compared to the absence of treatment.
IV.3 Application of combined treatments: TMZ and CAR-T cells
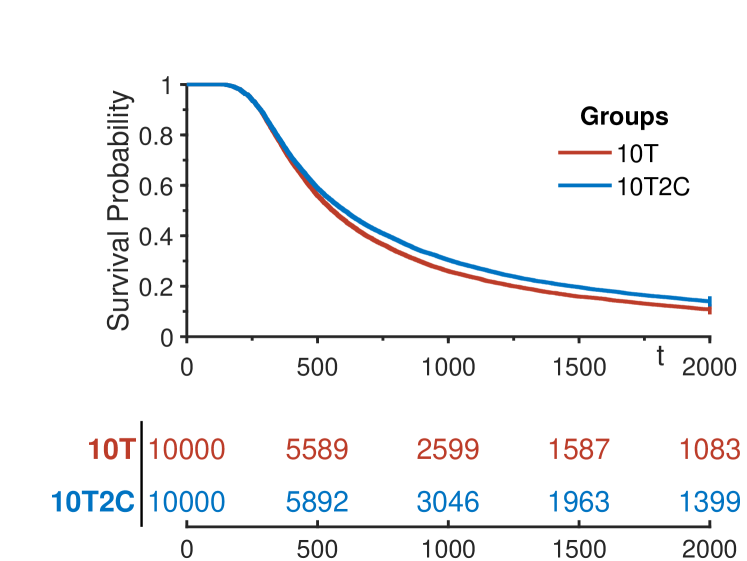
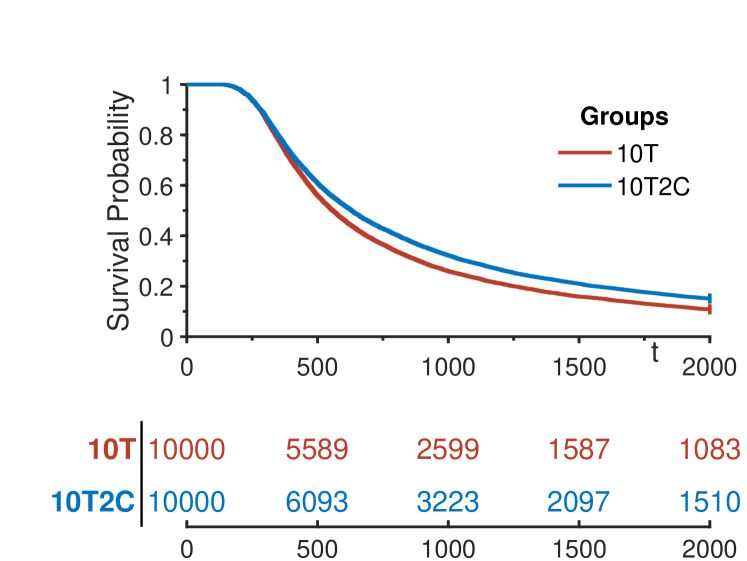
In this section, we explore several combined treatments. The goal is to understand how TMZ and CAR-T cells should be optimally combined. Thus, we investigate naive protocols where we administer 2 CAR-T cell injections () along 10 TMZ cycles: before, between, and at the end of the 10 TMZ cycles. We use two values for the total number of injected CAR-T cells: and . As a control treatment, we use the treatment with 10 TMZ cycles, since we want to improve it with combined treatments. The median survival times for 10 TMZ cycles for these two distributions are days.
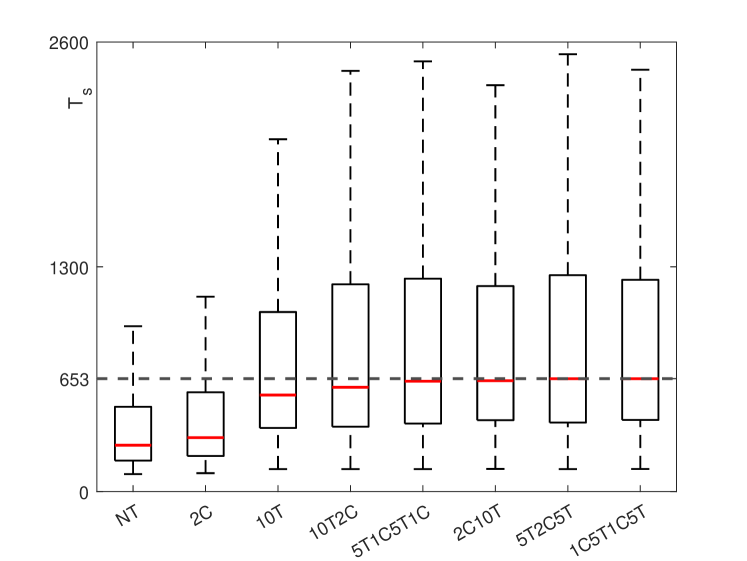
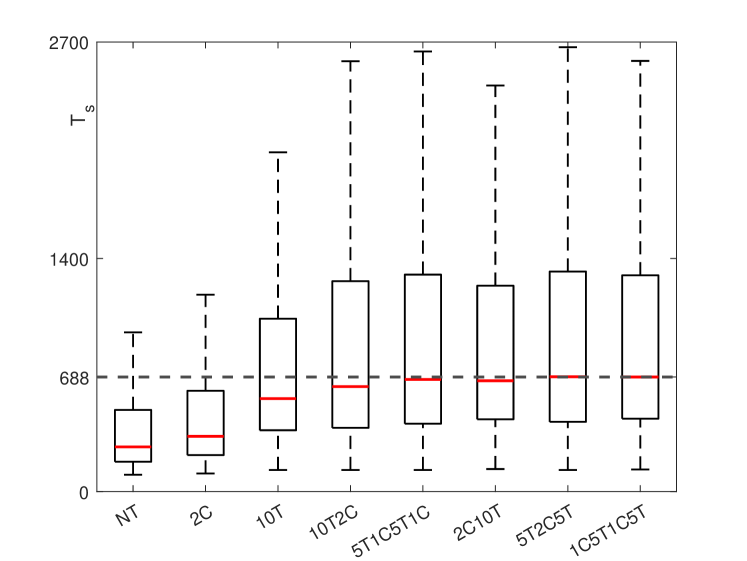
| Protocol | , days, | , days, |
|---|---|---|
| NT | 268 | 268 |
| 2C | 312 | 332 |
| 10T | 558 | 558 |
| 5T2C5T | 652 | 689 |
| 2C10T | 641 | 665 |
| 1C5T1C5T | 653 | 688 |
| 5T1C5T1C | 638 | 673 |
| 10T2C | 603 | 630 |
| 1C10T1C | 641 | 670 |

A summary of the results obtained, in terms of survival time, can be found in Table 6.
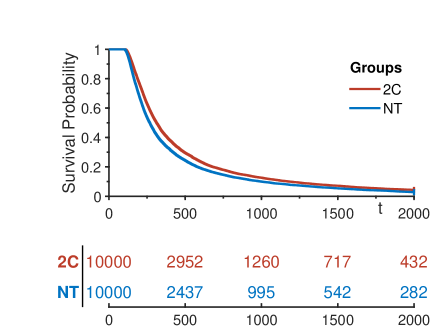
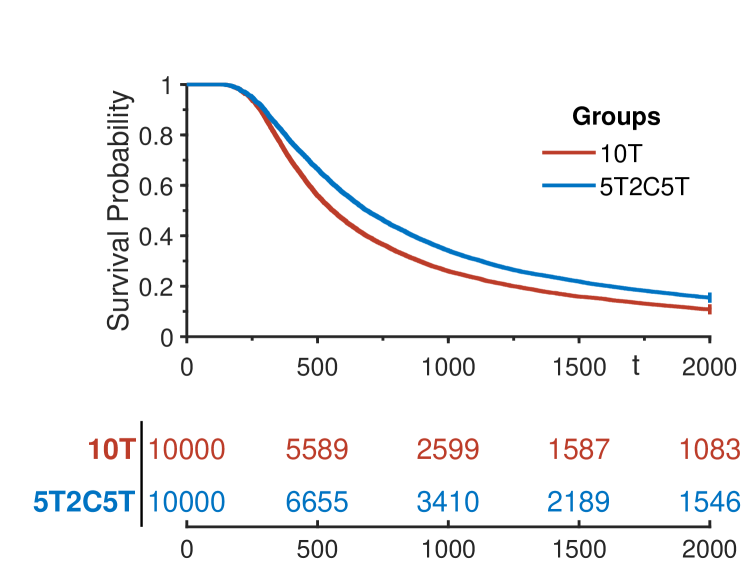
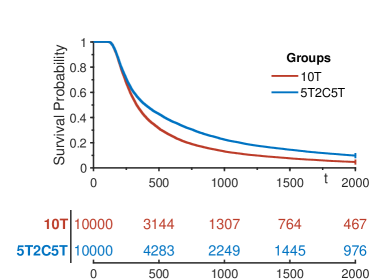
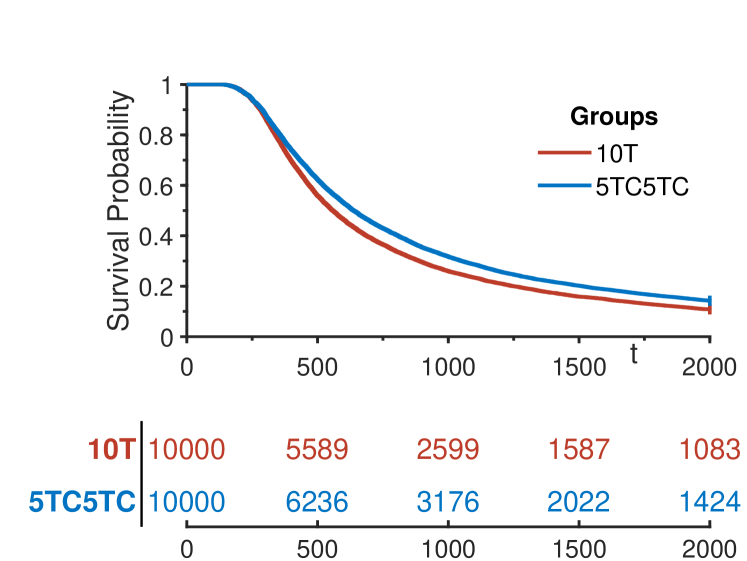
We begin by presenting the protocol with 5 TMZ+2 CAR-T+5 TMZ cycles. Its median survival time is 652 days for and 689 days for . Thus, we have considerable gains of (16.85%) and (23.48%) days (see KM curves in Fig. 12).
| Parameter | r | p-value |
|---|---|---|
| -0.69 | 0.00 | |
| 0.13 | 0.00 | |
| -0.12 | 0.00 |
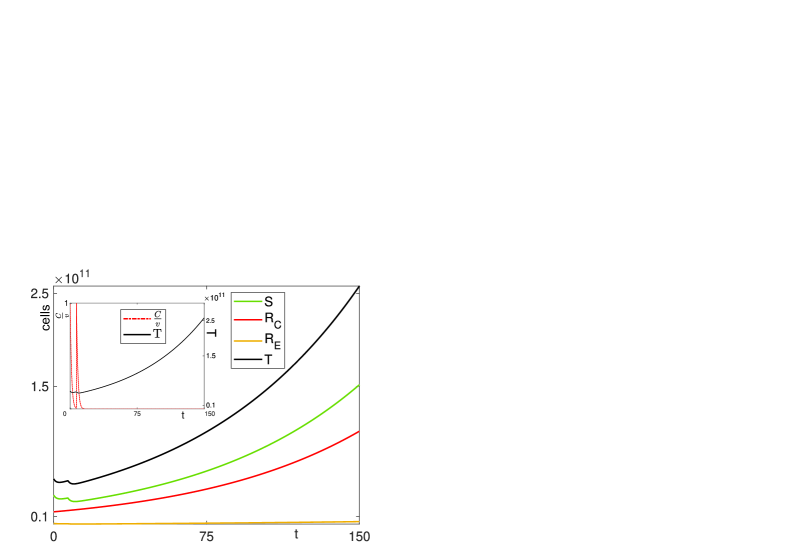
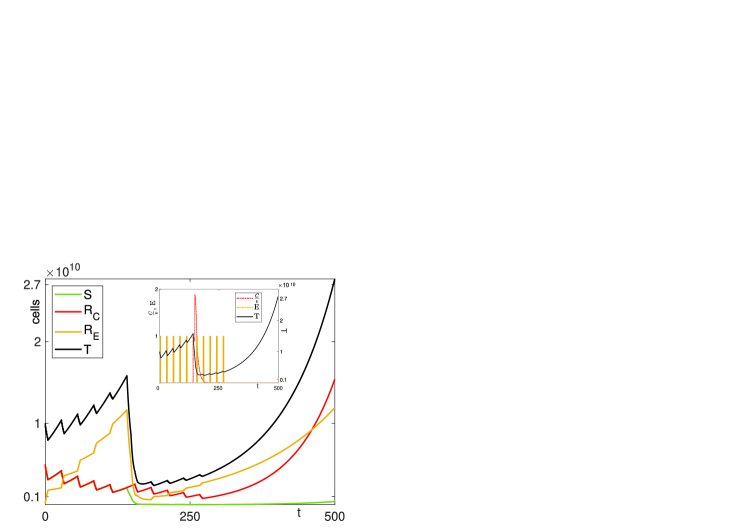
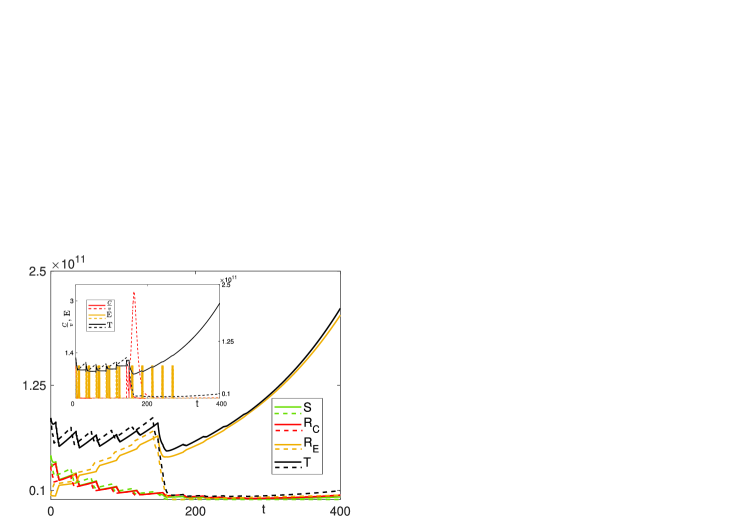
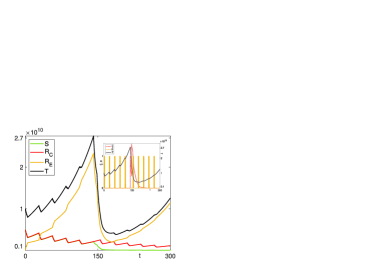
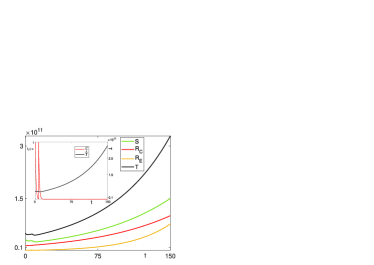
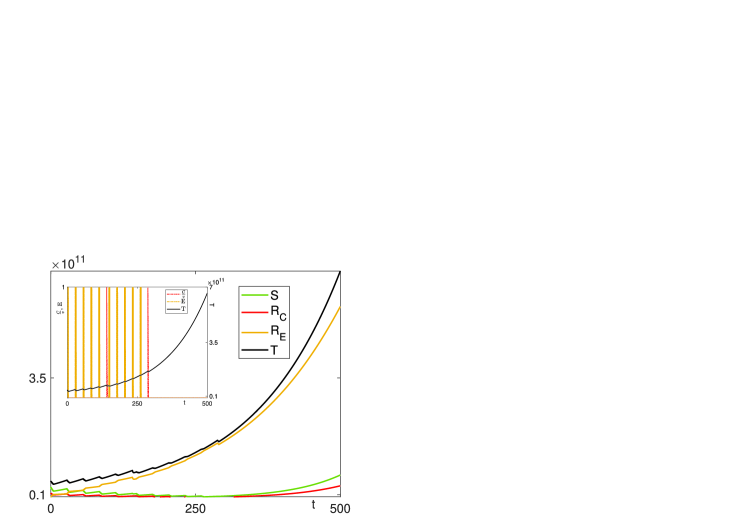
Figure 13 shows the dynamics of different compartments of tumor cells for the MVP under 5 TMZ+2 CAR-T+5 TMZ cycles at . Note how the CAR-T cells affect the TMZ-resistant populations, leading to a better tumor controllability than with TMZ monotherapy.
| Parameter | r | p-value |
|---|---|---|
| 0.69 | 0.00 | |
| -0.36 | 0.00 | |
| -0.29 | 0.00 | |
| -0.18 | 0.00 | |
| 0.17 | 0.00 | |
| 0.12 | 0.00 | |
| 0.12 | 0.00 | |
| -0.11 | 0.00 |
In Tables LABEL:t:t5a-LABEL:t:t6a, we demonstrate correlations between the survival time and its improvement in comparison to the absence of treatment for the 5 TMZ+2 CAR-T+5 TMZ protocol. One can see from the both tables that the most important parameters that affect the protocol performance are , , and . We also see that the most important parameter associated with the treatment efficacy for this protocol is the TMZ killing efficiency .


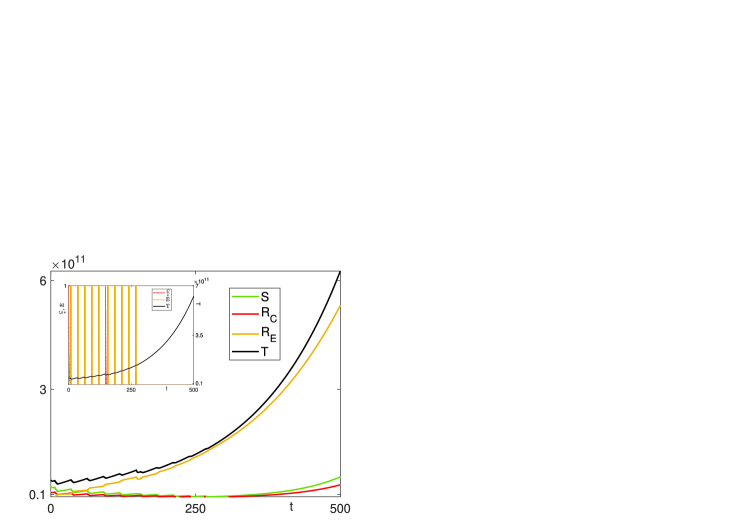
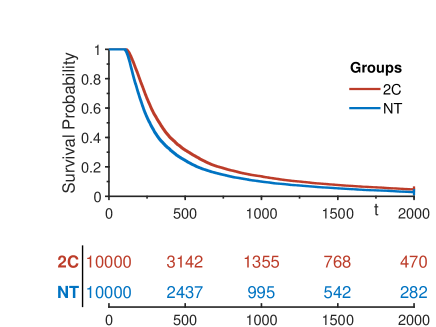
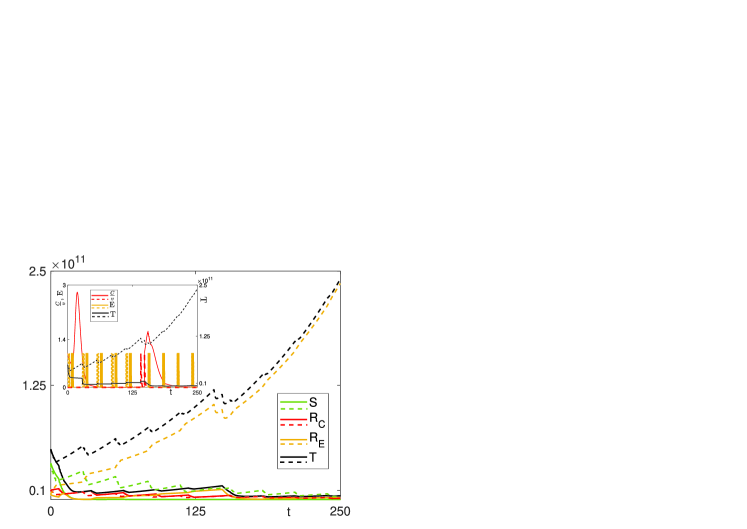
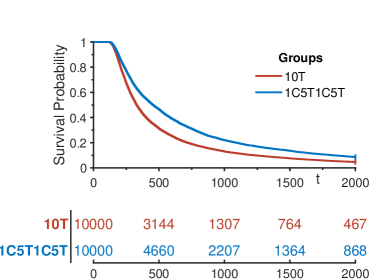
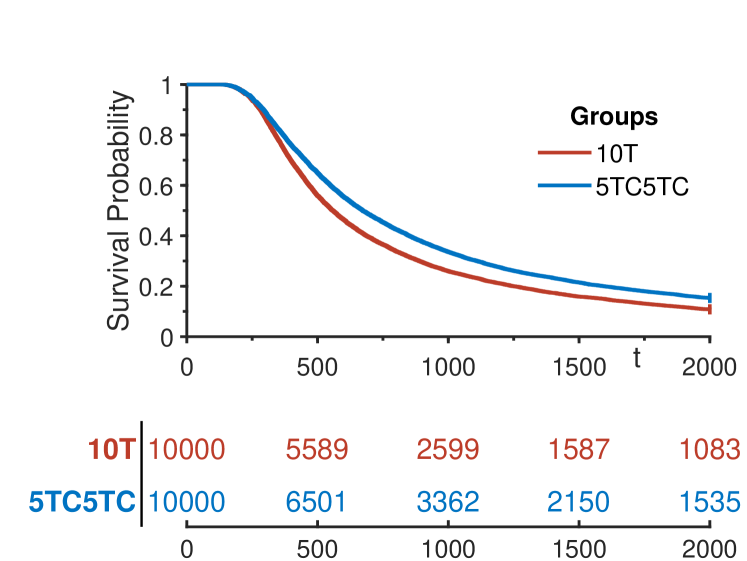
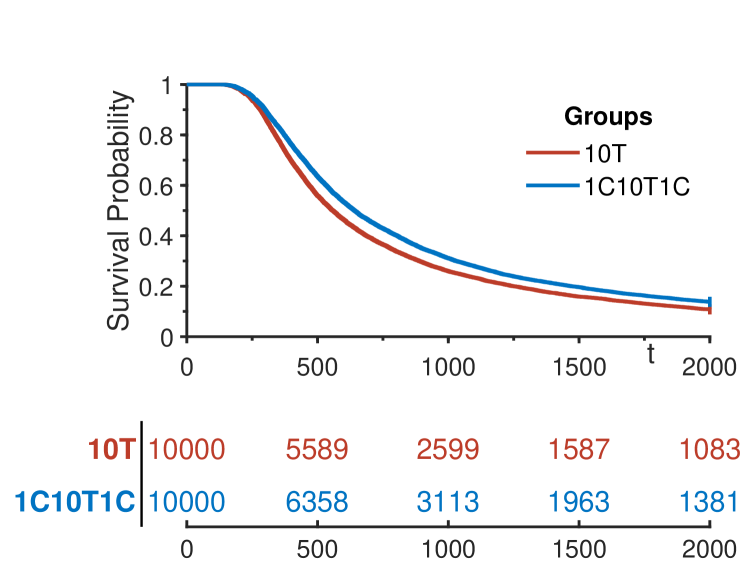
Now, we consider the protocol 1 CAR-T+5 TMZ+ 1 CAR-T+5 TMZ. Its median survival time is 653 days for and 688 days for (Fig. 14). Thus, we have gains of (17.03%) and (23.3%) days. We also show the dynamics of tumor cells for this protocol applied to the MVP in Fig. 15. We see that this protocol is less efficient in dealing with TMZ-resistant cells.
| Parameter | r | p-value |
|---|---|---|
| -0.69 | 0.00 | |
| -0.13 | 0.00 | |
| 0.12 | 0.00 |
| Parameter | r | p-value |
|---|---|---|
| 0.66 | 0.00 | |
| 0.42 | 0.00 | |
| -0.2 | 0.00 | |
| 0.19 | 0.00 | |
| -0.19 | 0.00 | |
| 0.14 | 0.00 | |
| 0.14 | 0.00 | |
| -0.14 | 0.00 |
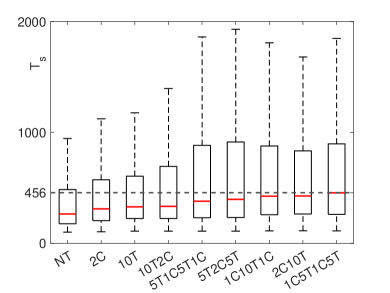
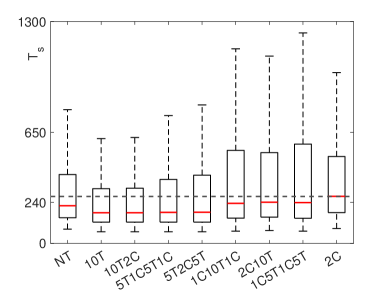
We also show the effectiveness of all combined protocols with and in Fig. 16, presenting the box plots of the survival times under each protocol. One can see that the best combined protocols are the presented 5T2C5T and 1C5T1C5T.
IV.4 Protocol comparison
Here, we compare the combined protocols described above. First, we calculate pairwise correlations between the survival times of all protocols and find that the correlation coefficients are consistently around 0.99, with p-values close to zero. This finding is further supported by the following analysis. For each patient, we assign a set of protocols. This set is constructed as follows: first, the protocol yielding the best survival outcome is assigned to the patient. Then, we include any protocol with a survival time that is no more than 5% or 10% shorter than the best protocol. This approach allows us to identify which virtual patients can be treated with multiple protocols and which require an individualized approach. When using a 5% margin for protocol equivalence, we find that 6098 patients–approximately 60% of the population–can be treated with any of the protocols. With a 10% margin, 7528 patients–approximately 75% of the population–are eligible for treatment with any protocol. These results indicate that more than half of the patients can be treated with any of the protocols with comparable outcomes.
| Parameter | Shift in median value, % |
|---|---|
| -32 | |
| 27 | |
| 16 | |
| -14 | |
| -8 | |
| 7 | |
| 7 | |
| -1 | |
| -0.6 |
On the other hand, it is evident that there are patients for whom the choice of protocol leads to substantial improvements in survival time. To identify the regions of the parameter space associated with these patients, we select those for whom 1, 2, or 3 protocols yield the same results within a 10% margin. This group includes approximately 1000 patients (approximately 75% of the population), for whom shifts in the median values of the parameters are presented in Table LABEL:t:t_shift. We observe that patients with lower immune suppression, lower immune resistance, and higher growth rates or mitotic stimulation may require an individualized approach.
Differences in protocol performance can be attributed in some cases to favorable conditions for CAR-T cell proliferation. For example, although two of the best-performing protocols at the population level, 5T2C5T and 1C5T1C5T, show overall effectiveness, there are still individual patients for whom one protocol performs better than the other. In Fig. 17, we illustrate the tumor and treatment dynamics for two patients, where one of these protocols significantly outperforms the other. Notably, CAR-T cell proliferation is observed for the better-performing protocol.
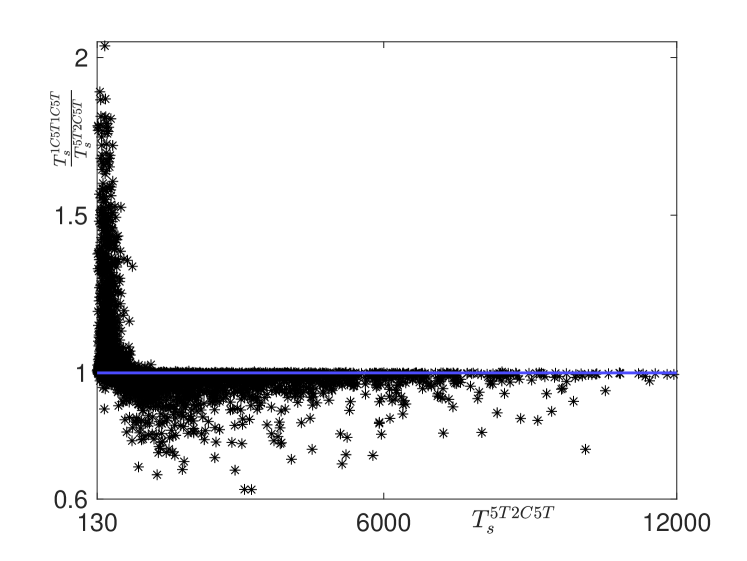
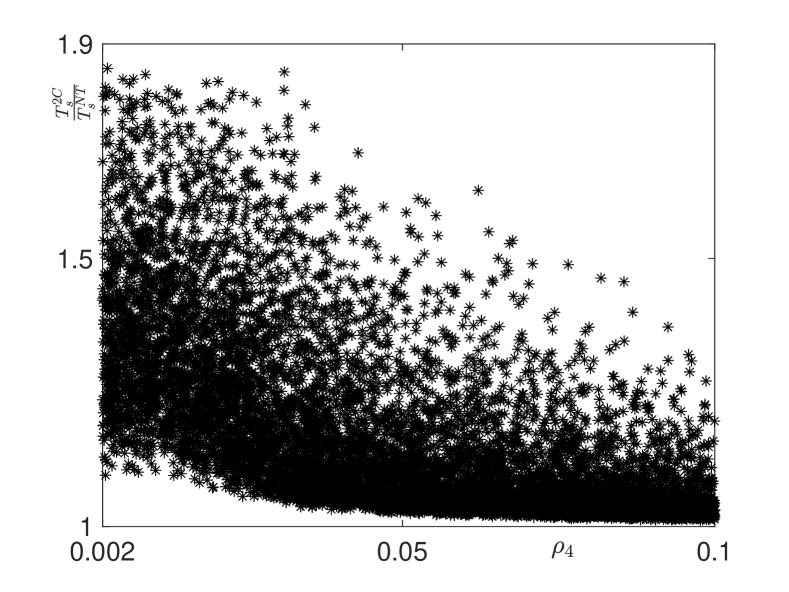
Here, we focus on comparing the two best-performing protocols: 5T2C5T and 1C5T1C5T. Fig. 18 shows the correlation between the difference and . Positive values of this difference indicate better performance of the 1C5T1C5T protocol, while negative values correspond to better performance of the 5T2C5T protocol.
From the Fig. 18, it is evident that the 1C5T1C5T protocol performs better for virtual patients with lower survival times, whereas the 5T2C5T protocol is more advantageous for those with longer survival times.
When comparing the performance of 5T2C5T and 1C5T1C5T in more detail, we find that survival times for both protocols are almost linearly correlated, with a correlation coefficient of 0.99 and a p-value of 0. This suggests that, on average, if a virtual patient responds well to one protocol, that patient is likely to respond similarly to the other.
However, as shown in Fig. 18, there are some differences in survival times for certain virtual patients. Notably, the group of patients where one protocol outperforms the other by more than 10 days consists of 3664 patients, approximately one-third of the virtual cohort. When the threshold for overperformance is increased to 30 days, the number of patients decreases to 1840, roughly 18% of the virtual cohort. Therefore, only a small fraction of virtual patients exhibit notably different results between the two protocols.
| Parameter | r | p-value |
|---|---|---|
| -0.32 | 0.00 | |
| 0.18 | 0.00 | |
| 0.17 | 0.00 | |
| -0.1 | 0.00 |
To understand the reasons behind the differences in performance, we investigate the correlations between the ratio and the model parameters. The results are presented in Table LABEL:t:ttt. Consistent with previous findings, the growth rate () emerges as the most important parameter. Specifically, we have shown that, in general, survival time is predominantly governed by the growth rate. Furthermore, the 1C5T1C5T protocol tends to perform better for virtual patients with shorter survival times, while the 5T2C5T protocol is more advantageous for those with longer survival times.
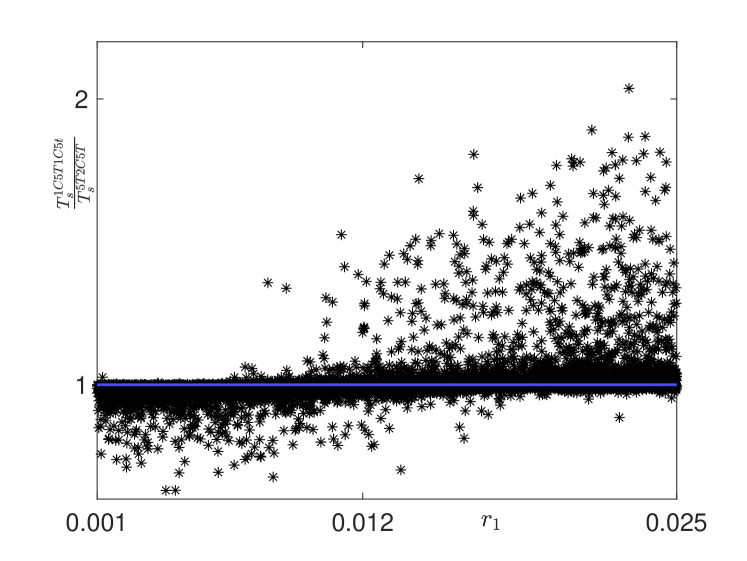
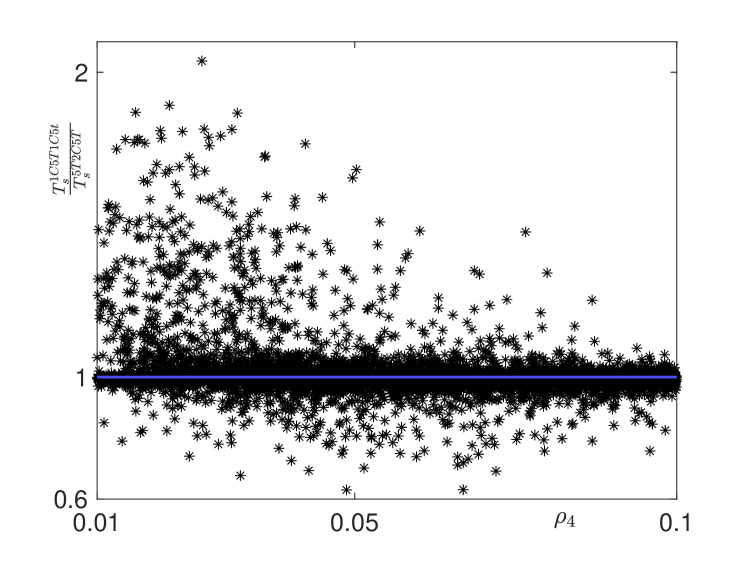
Fig. 19 presents the correlations between the ratio and the parameters and . From this figure, we observe that the 5T2C5T protocol performs better for tumors with lower , and there is no correlation between its performance and . In contrast, the 1C5T1C5T protocol is more effective for tumors with higher and lower . These findings highlight the potential for personalized treatment strategies, emphasizing the importance of tailoring therapies based on specific tumor characteristics, which justifies further research into personalized treatment protocols.
IV.5 Fast-growing TMZ-resistant cells
In the previous Sections, it was assumed that , meaning that TMZ-resistant cells proliferate at a slower rate than the other two populations Campos et al. (2014); Stepanenko et al. (2016); Yuan et al. (2018); Dai et al. (2018). However, in some cases, it has been observed that TMZ-resistant cells () grow similarly or faster than sensitive cells Gupta et al. (2014); Stepanenko et al. (2016); Dai et al. (2018); Delobel et al. (2023).
| Protocol | ||||
|---|---|---|---|---|
| NT | 264 | - | 221 | - |
| 2C | 310 | 330 | 275 | 302 |
| 10T | 329 | - | 179 | - |
| 5T2C5T | 397 | 455 | 182 | 185 |
| 2C10T | 427 | 448 | 240 | 254 |
| 1C5T1C5T | 456 | 507 | 239 | 260 |
| 5T1C5T1C | 380 | 421 | 181 | 183 |
| 10T2C | 334 | 339 | 179 | 179 |
| 1C10T1C | 425 | 447 | 234 | 244 |
In those cases, it is worth considering which treatment (or treatments) is (are) the optimal one(s) among those under consideration.
| Parameter | r | p-value |
|---|---|---|
| -0.66 | 0.00 | |
| -0.18 | 0.00 | |
| -0.15 | 0.00 |
| Parameter | r | p-value |
|---|---|---|
| -0.62 | 0.00 | |
| 0.31 | 0.00 | |
| 0.26 | 0.00 | |
| -0.1 | 0.00 | |
| -0.1 | 0.00 | |
| 0.1 | 0.00 |
We find that the best-performing protocol is the 1C5T1C5T protocol with , such as with . The second best protocol is 2C10T. Correlations between survival time and model parameters for the best-performing protocol, 1C5T1C5T, are presented in Tables LABEL:t:t5c and LABEL:t:t6c. From these tables, we observe that survival time is strongly correlated with the tumor growth rate () and weakly correlated with tumor immune suppression () and its initial size ().
On the other hand, when considering the improvement of a combined protocol relative to the absence of treatment, the most important parameter becomes tumor immune suppression (), with the efficiency of TMZ () and mitotic stimulations ( and ) also playing significant roles.
The correlations between the parameters of model 1, survival time, and its improvement for the 2C10T and 5T2C5T protocols are very similar to those for 1C5T1C5T, so we do not present them here. Figs. 21, 22, and 23 show the tumor dynamics for the MVP and Kaplan-Meier curves for 1C5T1C5T, 2C10T, and 5T2C5T protocols, respectively.
| Parameter | r | p-value |
|---|---|---|
| -0.67 | 0.00 | |
| -0.19 | 0.00 | |
| -0.13 | 0.00 |
| Parameter | r | p-value |
|---|---|---|
| -0.69 | 0.00 | |
| -0.26 | 0.00 | |
| 0.23 | 0.00 | |
| -0.21 | 0.00 | |
| -0.15 | 0.00 |
Interesting, for the case with , we do not find synergistic effects in none of the investigated combined protocols. Such as shown in the TMZ monotherapy Section in Fig. 2, in the combined protocols, it is better not to administer TMZ at all. In fact, the best protocol reported in Table 13 is the 2C protocol, where only 2 CAR-T injections are administered.
Correlations between survival time and model parameters for the best-performing protocol, 2C, are presented in Table LABEL:t:t5d. We observe that survival time is strongly correlated with the tumor growth rate () and weakly correlated with tumor immune suppression () and its initial size ().
On the other hand, when considering the improvement of 2C protocol relative to the absence of treatment reported in Table LABEL:t:t6d, the most important and highly correlated parameter becomes tumor immune suppression (), with the initial percentage of CAR-T resistant cells (), mitotic stimulations ( and ), the initial tumor size (), and the initial percentage of TMZ resistant cells (), also playing roles. Note that, even here with only CAR-T monotherapy, the initial percentage of TMZ resistant cells correlates with improvement is survival due to the high aggressiveness () of TMZ resistant population ().
Fig. 24 shows the tumor dynamics for the MVP and Kaplan-Meier curves for the 2C protocol.
V Discussion and conclusions
In this article, we build a mathematical model to investigate the potential improvements in glioma treatment by combining two therapies: temozolomide (TMZ) and CAR-T cell therapy. TMZ is a standard treatment for gliomas Friedman, Kerby, and Calvert (2000), often used in multimodal therapies such as the Stupp protocol Stupp et al. (2005). On the other hand, CAR-T cell therapy is a novel treatment, which has shown promising success in treating non-solid tumors like leukemias Maude et al. (2018); Miliotou and Papadopoulou (2018). Preclinical studies in animal models have demonstrated the potential of combining these therapies Suryadevara et al. (2018); Lamb et al. (2021), though their clinical effectiveness is still under investigation in an ongoing trial (NCT04165941) Lamb et al. (2023). Our goal is to contribute to and inform future clinical trials through the insights gained from this work.
While the primary focus is on gliomas, the model could be adapted and calibrated for other cancers with similar biological mechanisms, offering a basis for similar investigations into combined CAR-T cell therapy and chemotherapy for solid cancers, a new promising approach.
After building the model, a mathematical analysis was performed, initially considering a single dose of both treatments, followed by an analysis with continuous treatment of both therapies. Interestingly, with a single dose of both treatments, tumor eradication is not possible, which aligns with clinical observations and the challenges posed by these types of tumors Lerner et al. (2024). However, when constant treatment is applied, we identified a threshold for both TMZ and CAR-T cell dosages at which tumor eradication becomes achievable. Importantly, the values presented in Proposition 5 are feasible: the critical daily CAR-T dosage is approximately , and when the maximal TMZ dosage () is applied, the critical value for the sum of TMZ’s efficacy against the tumor and its transition rate from sensitive to TMZ-resistant cells () is approximately 0.21, based on the maximal sensitive growth rate from Table 1. Thus, we found conditions on the dosages of CAR-T cells and the efficiency and dosage of TMZ that ensure the stability of the equilibrium with zero tumor cells under constant treatment. However, constant treatment is not feasible due to patient toxicity constraints. Therefore, we propose an impulsive treatment strategy, where CAR-T cells and TMZ doses above the critical thresholds are administered in intervals, driving the system governed by (1) towards a tumor-free equilibrium.
Thus, we numerically explored different treatments: first when only TMZ is applied, then when only CAR-T cell therapy is applied, and finally, the combination of both as an innovative multimodal treatment.
Regarding TMZ monotherapy applications, our in silico trial simulations show that TMZ achieves a double median survival compared to no treatment, gaining almost 8 months (250 days) in median survival. There have been no randomized trials that compared standard chemoradiotherapy with temozolomide monotherapy for MG. However, TMZ has been administered alone in some elderly patients. Scott and colleagues conducted a retrospective review of 206 patients and found that patients receiving chemotherapy had a median survival gain of almost 8 months compared to patients not receiving chemotherapy Scott et al. (2011), as in our in silico results.
The relation between the growth rates of sensitive and TMZ-resistant cells is not well characterized Campos et al. (2014); Stepanenko et al. (2016); Yuan et al. (2018); Dai et al. (2018); Gupta et al. (2014); Stepanenko et al. (2016); Dai et al. (2018); Delobel et al. (2023). Importantly, this improvement persists even when TMZ-resistant cells proliferate at rates equal to those of sensitive cells. Administering 10 cycles of TMZ consistently outperforms shorter treatment durations, emphasizing the importance of sustained therapy, as in the Stupp protocol Stupp et al. (2005)–the standard protocol for high-grade gliomas since 2005–where, after 6 weeks of concomitant chemoradiotherapy, adjuvant TMZ cycles are administered until the patient tolerates the toxicity of TMZ. However, when TMZ-resistant cells proliferate at rates greater than those of sensitive cells, it is more effective to avoid administering TMZ, as virtual patients show no response. This aligns with clinical observations for highly aggressive gliomas, where approximately 50% of glioblastoma patients do not respond to TMZ treatment Lee (2016).
Focusing again on the case with and studying the correlation between each of the model parameters and the survival rate when 10 cycles of TMZ are applied, it was found that the parameter showing the highest correlation is the tumor proliferation rate , followed by the tumor size and the efficacy of TMZ against tumor . The importance of slow tumor growth as a good prognostic biomarker is well-known: the overexpression of Epidermal Growth Factor Receptor (EGFR) is an indicator of poor prognosis in overall survival Li et al. (2018). In addition, the Ki-67 level, a protein marker associated with cell proliferation, serves as a significant prognostic factor in gliomas Chen et al. (2015). Higher Ki-67 levels indicate increased tumor cell proliferation, correlating with more aggressive tumor behavior and poorer patient outcomes. If we now study the correlation of the parameters with the improvement in survival compared to the untreated cases (the ratio), the most important parameter is , aligning with Skaga et al. (2022), where the authors found a predictive value of TMZ sensitivity in individual glioblastoma stem cells cultures to patient survival.
We then study the impact of CAR-T cells as a monotherapy on survival in virtual glioma patients. We first study how tumor immunosuppression () affects the median survival time. Our findings reveal that only patients with low immunosuppression levels in the tumor microenvironment () benefit significantly from CAR-T cell therapy. This aligns with the well-documented challenges posed by the immunosuppressive nature of the solid tumor microenvironment Kringel, Lamszus, and Mohme (2023). Next, we show that the higher the number of CAR-T cells injected, the better the survival results, consistent with existing literature León-Triana et al. (2021); Bodnar et al. (2023, 2024). In an experimental study, the authors showed that a low dose of CAR-T cells suppressed GL261/EGFRvIII tumor growth, whereas a high dose of CAR-T cells completely eradicated the xenograft tumors Chen et al. (2019). We then studied the impact of dose distribution on survival, and found that it is best to administer a single dose at the start due to the rapid initial expansion of CAR-T cells. However, to account for potential adverse and toxicological effects, we adjusted the number of CAR-T doses to two ().
We perform an in silico trials to investigate the effect of CAR-T cell monotherapy on median survival, finding almost 7 months, in line with a recent review reporting median survival ranging from 5.5 to 11.1 months across all analyzed studies Agosti et al. (2024). Next, we study the impact of the model parameters on the survival of the patients, finding that the most correlated parameter is again the growth rate of the sensitive population. Interestingly, if we consider the correlation between the improvement in survival relative to the no treatment case, i.e., the fraction, and the model parameters, now the parameters that correlate most are those related to CAR-T cell treatment, i.e., , , and the one describing the percentage of tumor resistant to CAR-T cells . Also this results align with experimental and clinical results reporting as main challenges in the applications of CAR-T cells for MG the immunosuppressive tumor microenvironment, insufficient cell trafficking, fast expansion and tumor heterogeneity Kringel, Lamszus, and Mohme (2023).
Indeed, a CAR-T cell product that cannot be immunosuppressed by the tumor () and has a fast expansion towards tumor cells ( and ) can play a pivotal role in disease control, as already achieved for leukemia Maude et al. (2018); Miliotou and Papadopoulou (2018). The effectiveness of the treatment can be assessed based on the quality of the patient’s effector cells before genetic modification or the CAR-T cell generation utilized in the therapy.
This aligns closely with the well-established and critical role of CAR-T cell killing efficiency and rapid stimulation in shaping the therapeutic dynamics of this approach. Indeed, significant efforts have been made by the biomedical community to develop improved CAR-T cell products, characterized by faster expansion, reduced susceptibility to immunosuppression, and enhanced killing efficiency Sterner and Sterner (2021).
Moreover, our model underscores the critical role of tumor-induced immunosuppression, represented by the parameter , in influencing the behavior of the cell populations studied. The results indicate a clear trend: as the value of increases, the effectiveness of the therapy decreases. This finding highlights the potential of incorporating immune checkpoint inhibitors as a strategy to modulate immune responses and prevent tumor cells from deactivating CAR-T cells Xu et al. (2020). By mitigating the tumor-induced inactivation rate of CAR-T cells, this approach could enhance therapeutic outcomes and improve patient prognosis.
Furthermore, the strong agreement between simulation results for both TMZ and CAR-T cell monotherapies and real-world clinical findings validates the reliability of the proposed model. This alignment provides confidence in its predictive power and its potential utility in designing and optimizing future treatment protocols.
Finally, we studied the combination of TMZ and CAR-T cell therapies, exploring six different combination protocols to identify the optimal approach for improving survival time. These results were compared with the standard TMZ treatment to assess potential improvements in therapeutic outcomes.
The best results are obtained with the 5T2C5T and 1C5T1C5T protocols, placing us in the case where the proliferation rate of sensitive cells () is higher than that of resistant cells (). Our in silico trials predict median survival times of nearly 650 days, representing an improvement of approximately 400, 340, and 100 days compared to no treatment, CAR-T cell monotherapy, and TMZ monotherapy, respectively. There are no clinical trial results currently available to compare with our in silico trials. An experimental study has demonstrated that a combined treatment regimen of MGMT-modified T cells and TMZ chemotherapy is effective in improving survival for in vivo primary high-grade gliomas compared to both monotherapy treatments Lamb et al. (2021). Moreover, it is reported that concomitant treatments outperform sequential treatments in terms of survivals. In comparison, our in silico results also support the efficacy of combining TMZ with CAR-T cell therapy. In addition, the optimality of the 1C5T1C5T protocol, where the two treatments are alternated and concomitantly present in virtual patients, outcompetes the sequential protocols, as observed in vivo Lamb et al. (2021).
We investigate the correlations between the model parameters and survival, finding that, even with combined treatment, the biological process most strongly linked with survival, is tumor growth: overexpression of EGFR Li et al. (2018) and ki-67 level Chen et al. (2015) should remain biomarkers of prognosis for survival also for combined treatment applications. Interestingly, if we look at the improvement in survival relative to the untreated case, the most important parameters become the killing efficacy of TMZ, and thesecond one the tumor immunosuppression. This highlights the principal role occupied by TMZ in the combined protocols.
Because combined protocols achieve similar median survivals, we undertook a detailed comparison to identify any differences between them. Interestingly, we found that most patients could achieve similar survival outcome regardless of which of the combined protocols was used. If a virtual patient responds well to a protocol, that patient is likely to respond similarly to the others. However, it is important to note that this preliminary analysis does not account for toxicity, which could vary significantly between protocols and it could impact clinical decisions.
Next, we focus on the two best-performing protocols: 5T2C5T and 1C5T1C5T. While the median survival outcomes for these protocols were nearly identical, a subset of the virtual cohort exhibited significant differences (up to doubled survivals) in survival when treated with one protocol versus the other. Notably, the 1C5T1C5T protocol is more effective for patients with shorter survival times, while the 5T2C5T protocol shows greater advantages for those with longer survival times.
This observation is further supported by the correlations between the ratio and tumor growth rate . Specifically, the 5T2C5T protocol outperforms in tumors with lower , with no significant correlation observed with immunosuppression (). Conversely, the 1C5T1C5T protocol is more effective for tumors with higher and lower .
These findings underscore the potential and importance of personalized treatment strategies in oncology. By tailoring therapies to the specific characteristics of each patient’s tumor, it becomes possible to optimize treatment efficacy, thereby improving outcomes. This work reinforces the need for continued research into personalized medicine, highlighting its potential for more precise and effective cancer care.
Finally, because the relationship between TMZ-resistant and TMZ-sensitive growth in MG is not well defined Campos et al. (2014); Stepanenko et al. (2016); Yuan et al. (2018); Dai et al. (2018); Gupta et al. (2014); Stepanenko et al. (2016); Dai et al. (2018); Delobel et al. (2023), we investigate how the efficacy of combined protocols changes with varying levels of aggressiveness of resistant MG. Importantly, we found that the 1C5T1C5T protocol remains the most effective in the case with . This robust finding supports the recommendation of the 1C5T1C5T protocol, ad exception for highly aggressive TMZ-resistant cells (), for future clinical trials exploring combined therapies for MG. We also investigate the correlations between the model parameters and survival, finding that, even in moderately aggressive TMZ-resistant MG (), the biological process most strongly linked to survival, is tumor growth. However, when we examine the improvement in terms of survival relative to the untreated case, the most important parameters are tumor immunosuppression, followed by the killing efficacy of TMZ. This highlights the key role now played by CAR-T cell therapy in the combined protocols to take under control the highly aggressive TMZ-resistant population.
Instead, for highly aggressive TMZ-resistant cells (), we find no synergy in the combination of TMZ and CAR-T cell therapy. In fact, the best protocol in this scenario is 2C, consistent with findings from TMZ monotherapy. TMZ provides an advantage for the TMZ-resistant population, which can only be controlled through CAR-T cell therapy. This highlights the potential of CAR-T cells in combating TMZ-resistant aggressive gliomas, such as glioblastomas, where approximately 50% of patients do not respond to TMZ Lee (2016). We also investigate the correlations between the model parameters and survivals, finding that, in highly aggressive TMZ-resistant MG (), the biological process most strongly linked to survival, is tumor growth of CAR-T resistant population. However, when examining survival improvements relative to untreated cases, tumor immunosuppression emerges as the most impactful parameter. Other significant factors include the initial percentage of CAR-T-resistant cells, mitotic stimulation, initial tumor size, and the initial percentage of TMZ-resistant cells. Interestingly, even when only CAR-T cells are applied, the initial percentage of TMZ-resistant cells correlates with a survival improvement, given the high aggressiveness () of the TMZ-resistant population (). These findings highlight the pivotal role of CAR-T cell therapy in successfully managing highly aggressive, TMZ-resistant populations.
It is important to note that our results are more qualitative than quantitative. Therefore, what we propose is not the exact protocol itself but more the concept of alternating CAR-T injections and TMZ cycles as an optimal synergistic combined treatment strategy. Based on our findings, initiating treatment with a CAR-T injection followed by TMZ administration, and then alternating the two treatments, is suggested as the most promising approach. This strategy is known as the evolutionary double-bind Gatenby, Brown, and Vincent (2009), and it has already emerged as the optimal administration strategy in previous studies Orlando, Gatenby, and Brown (2012); Italia, Dercole, and Lucchetti (2022).
In terms of improvements and future work, it is essential to consider the role of spatial effects in CAR-T cell therapy, particularly for gliomas, which exhibit infiltrative behavior Owens, Rahman, and Bozic (2024). While our model provides valuable insights into the interactions between CAR-T cell therapy, TMZ, and MG cells, spatial dimension is a critical factor in influencing these interactions. To enhance the accuracy and applicability of our findings, future studies should incorporate spatial elements to better assess the efficacy of the proposed treatments in a more realistic setting.
Moreover, we aim to extend the mathematical model by incorporating experimental data from animal studies to more precisely calibrate the parameters, refining our understanding of the treatment dynamics and evaluating the significance of key model parameters. Calibrating and validating the model on real data would also confirm that all the essential biological mechanisms are described within the proposed mathematical model.
In conclusion, our research paves the way for exploring the synergy between TMZ and CAR-T cell therapy in treating gliomas, a currently incurable tumor. We hope that our findings will encourage further mathematical investigations in this area, contributing to the development of optimized, personalized treatment strategies that combine immunotherapy and chemotherapy for brain tumor patients. Through these efforts, we anticipate making significant strides in improving therapeutic outcomes and ultimately advancing the fight against gliomas.
Acknowledgments
This article is part of the research project SBPLY/23/180225/000041, funded by the EU through the ERDF and by the JCCM through INNOCAM, Ministerio de Ciencia e Innovación, Spain (doi:10.13039/501100011033) and University of Castilla-La Mancha grant 2022-GRIN-34405 (Applied Science Projects within the UCLM research programme). M.I and J.B.-B. were partially supported by European Regional Development Fund (ERDF A way of making Europe) under grant PID2022-142341OB-I00. D.S. is partially supported by H2020-MSCACOFUND-2020-101034228-WOLFRAM2.
Data Availability
Data sharing is not applicable to this article as no new data were created or analyzed in this study.
Appendix
In this appendix, we show the outcomes for the other combined protocols considered in the article.
The first protocol that we considered here is the following: 5 TMZ +1 CAR-T +5 TMZ +1 CAR-T. For this protocol, median survival time is 638 days for and 673 days for . Then, we have gains of and days.

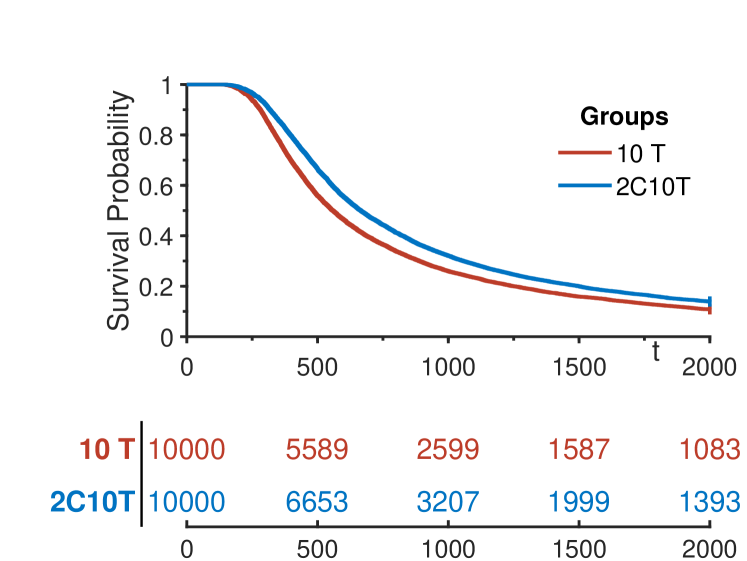

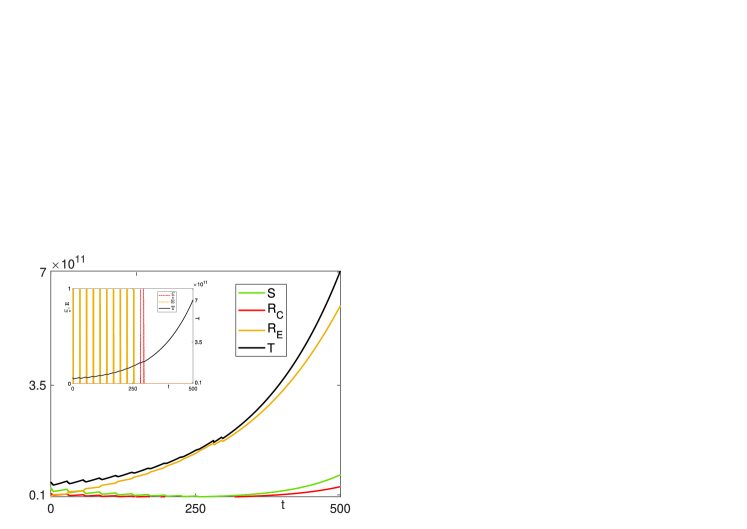
Next, we consider the protocol 2CAR-T+10TMZ. Its median survival time is 641 days for and 665 days for . Thus we have gains of 14.87% and 19.18%, i.e., and days, respectively (see KM curves in Fig. 27). We also present the dynamics of tumor cells for this protocol applied to the MVP 28: this protocol is less efficient in dealing with TMZ-resistant cells.
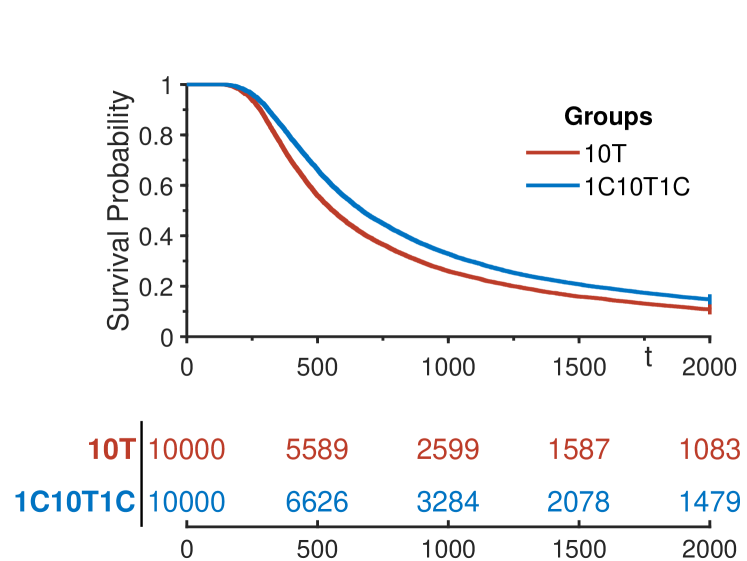
Another protocol that we consider is 1CAR+T + 10 TMZ+ 1 CAR-T is 641 days for and 665 days for and 670 days for for . Thus we have gains of 14.87% and 20.00%, i.e., and days, respectively (see KM curves in Fig. 29). We also present the dynamics of tumor cells for this protocol applied to the MVP 30: this protocol is less efficient in dealing with TMZ-resistant cells.
Finally we consider the protocol 10 TMZ +2 CAR-T. Median survival time for this protocol is 603 days for and 630 days for . Thus we have gains of and days.
References
- Lerner et al. (2024) A. Lerner, K. Palmer, T. Campion, T. Millner, E. Scott, C. Lorimer, D. Paraskevopoulos, G. McKenna, S. Marino, R. Lewis, and N. Plowman, “Gliomas in adults: Guidance on investigations, diagnosis, treatment & surveillance,” Clinical medicine (London, England) 24, 100240 (2024).
- Stupp et al. (2005) R. Stupp, W. P. Mason, M. J. Van Den Bent, M. Weller, B. Fisher, M. J. Taphoorn, K. Belanger, A. A. Brandes, C. Marosi, U. Bogdahn, et al., “Radiotherapy plus concomitant and adjuvant temozolomide for glioblastoma,” New England journal of medicine 352, 987–996 (2005).
- Filley, Henriquez, and Dey (2018) A. Filley, M. Henriquez, and M. Dey, “Cart immunotherapy: Development, success, and translation to malignant gliomas and other solid tumors,” Frontiers in Oncology 8 (2018), 10.3389/fonc.2018.00453.
- Thomas et al. (2023) B. C. Thomas, D. E. Staudt, A. M. Douglas, M. Monje, N. A. Vitanza, and M. D. Dun, “Car t cell therapies for diffuse midline glioma,” Trends in Cancer 9 (2023), 10.1016/j.trecan.2023.07.007.
- Montoya et al. (2024) M. Montoya, M. Gallus, S. Phyu, J. Haegelin, J. de Groot, and H. Okada, “A roadmap of car-t-cell therapy in glioblastoma: Challenges and future perspectives,” Cells 13, 726 (2024).
- Goutnik et al. (2024) M. Goutnik, A. Lakovidis, M. Still, R. Moor, K. Melnick, S. Yan, M. Abbas, and A. Ghiaseddin, “Advancements in car-t cell therapy for glioblastoma multiforme: Literature review and future directions,” Neuro-Oncology Advances 6 (2024), 10.1093/noajnl/vdae025.
- Feins et al. (2019) S. Feins, W. Kong, E. F. Williams, M. C. Milone, and J. A. Fraietta, “An introduction to chimeric antigen receptor (car) t-cell immunotherapy for human cancer,” American Journal of Hematology 94, S3–S9 (2019), https://onlinelibrary.wiley.com/doi/pdf/10.1002/ajh.25418 .
- Maude et al. (2018) S. L. Maude, T. W. Laetsch, J. Buechner, S. Rives, M. Boyer, H. Bittencourt, P. Bader, M. R. Verneris, H. E. Stefanski, G. D. Myers, M. Qayed, B. De Moerloose, H. Hiramatsu, K. Schlis, K. L. Davis, P. L. Martin, E. R. Nemecek, G. A. Yanik, C. Peters, A. Baruchel, N. Boissel, F. Mechinaud, A. Balduzzi, J. Krueger, C. H. June, B. L. Levine, P. Wood, T. Taran, M. Leung, K. T. Mueller, Y. Zhang, K. Sen, D. Lebwohl, M. A. Pulsipher, and S. A. Grupp, “Tisagenlecleucel in children and young adults with b-cell lymphoblastic leukemia,” New England Journal of Medicine 378, 439–448 (2018), pMID: 29385370, https://doi.org/10.1056/NEJMoa1709866 .
- Miliotou and Papadopoulou (2018) N. A. Miliotou and C. L. Papadopoulou, “Car t-cell therapy: A new era in cancer immunotherapy,” Current Pharmaceutical Biotechnology 19, 5–18 (2018).
- D’Agostino and Raje (2020) M. D’Agostino and N. Raje, “Anti-bcma car t-cell therapy in multiple myeloma: can we do better?” Leukemia 34, 21–34 (2020).
- Chavez, Bachmeier, and Kharfan-Dabaja (2019) J. C. Chavez, C. Bachmeier, and M. A. Kharfan-Dabaja, “Car t-cell therapy for b-cell lymphomas: clinical trial results of available products,” Therapeutic Advances in Hematology 10, 2040620719841581 (2019), pMID: 31019670, https://doi.org/10.1177/2040620719841581 .
- Wang et al. (2014) Q.-S. Wang, Y. Wang, H.-Y. Lv, Q.-W. Han, H. Fan, B. Guo, L.-L. Wang, and W.-D. Han, “Treatment of cd33-directed chimeric antigen receptor-modified t cells in one patient with relapsed and refractory acute myeloid leukemia,” Molecular therapy : the journal of the American Society of Gene Therapy 23 (2014), 10.1038/mt.2014.164.
- Martinez and Moon (2019) M. Martinez and E. K. Moon, “Car t cells for solid tumors: New strategies for finding, infiltrating, and surviving in the tumor microenvironment,” Frontiers in Immunology 10 (2019), 10.3389/fimmu.2019.00128.
- Bagley and O’Rourke (2019) S. Bagley and D. O’Rourke, “Clinical investigation of car t cells for solid tumors: Lessons learned and future directions,” Pharmacology & Therapeutics 205, 107419 (2019).
- Castellarin et al. (2018) M. Castellarin, K. Watanabe, C. June, C. Kloss, and A. Posey, “Driving cars to the clinic for solid tumors,” Gene Therapy 25 (2018), 10.1038/s41434-018-0007-x.
- Kringel, Lamszus, and Mohme (2023) R. Kringel, K. Lamszus, and M. Mohme, “Chimeric antigen receptor t cells in glioblastoma—current concepts and promising future,” Cells 12, 1770 (2023).
- Hege et al. (2017) K. M. Hege, E. K. Bergsland, G. A. Fisher, J. J. Nemunaitis, R. S. Warren, J. G. McArthur, A. A. Lin, J. Schlom, C. H. June, and S. A. Sherwin, “Safety, tumor trafficking and immunogenicity of chimeric antigen receptor (car)-t cells specific for tag-72 in colorectal cancer,” Journal for ImmunoTherapy of Cancer 5 (2017), 10.1186/s40425-017-0222-9, https://jitc.bmj.com/content/5/1/22.full.pdf .
- Ma et al. (2019) S. Ma, X. Li, X. Wang, L. Cheng, Z. Li, C. Zhang, Z. Ye, and Q. Qian, “Current progress in car-t cell therapy for solid tumors,” Int J Biol Sci 15, 2548–2560 (2019).
- Hong, Clubb, and Chen (2020) M. Hong, J. Clubb, and Y. Chen, “Engineering car-t cells for next-generation cancer therapy,” Cancer Cell 38 (2020), 10.1016/j.ccell.2020.07.005.
- Bodnar et al. (2023) M. Bodnar, U. Foryś, M. J. Piotrowska, M. Bodzioch, J. A. Romero-Rosales, and J. Belmonte-Beitia, “On the analysis of a mathematical model of car–t cell therapy for glioblastoma: Insights from a mathematical model,” International Journal of Applied Mathematics and Computer Science 33, 379–394 (2023).
- Schmidts et al. (2023) A. Schmidts, A. A. Srivastava, R. Ramapriyan, S. R. Bailey, A. A. Bouffard, D. P. Cahill, B. S. Carter, W. T. Curry, G. P. Dunn, M. J. Frigault, et al., “Tandem chimeric antigen receptor (car) t cells targeting egfrviii and il-13r2 are effective against heterogeneous glioblastoma,” Neuro-Oncology Advances 5, vdac185 (2023).
- Bielamowicz et al. (2017) K. Bielamowicz, K. Fousek, T. Byrd, H. Samaha, M. Mukherjee, N. Aware, M.-F. Wu, J. Orange, P. Sumazin, T.-K. Man, S. Joseph, M. Hegde, and N. Ahmed, “Trivalent car t-cells overcome interpatient antigenic variability in glioblastoma,” Neuro-Oncology 20 (2017), 10.1093/neuonc/nox182.
- Weiss et al. (2018) T. Weiss, H. Schneider, M. Silginer, A. Steinle, M. Pruschy, B. Polić, M. Weller, and P. Roth, “Nkg2d-dependent antitumor effects of chemotherapy and radiotherapy against glioblastoma,” Clinical Cancer Research 24, 882–895 (2018).
- Monje et al. (2024) M. Monje, J. Mahdi, R. Majzner, K. Yeom, L. Schultz, R. Richards, V. Barsan, K.-W. Song, J. Kamens, C. Baggott, M. Kunicki, S. Rietberg, A. Lim, A. Reschke, S. Mavroukakis, E. Egeler, J. Moon, S. Patel, H. Chinnasamy, and C. Mackall, “Intravenous and intracranial gd2-car t cells for h3k27m diffuse midline gliomas,” Nature , 1–8 (2024).
- Suryadevara et al. (2018) C. M. Suryadevara, R. Desai, M. L. Abel, K. A. Riccione, K. A. Batich, S. H. Shen, P. Chongsathidkiet, P. C. Gedeon, A. A. Elsamadicy, D. J. Snyder, et al., “Temozolomide lymphodepletion enhances car abundance and correlates with antitumor efficacy against established glioblastoma,” Oncoimmunology 7, e1434464 (2018).
- Lamb et al. (2021) L. Lamb, L. Pereboeva, S. Youngblood, G. Gillespie, L. Nabors, J. Markert, A. Dasgupta, C. Langford, and H. Spencer, “A combined treatment regimen of mgmt-modified t cells and temozolomide chemotherapy is effective against primary high grade gliomas,” Scientific Reports 11 (2021), 10.1038/s41598-021-00536-8.
- Lamb et al. (2023) L. Lamb, M. Lobbous, T. Goswami, K. Rochlin, J. Shepard, B. Weekley, C. Lucas, C. Langford, S. Youngblood, M. ter Haak, and L. Nabors, “637 inb-200: Phase i study of gene modified autologous gamma-delta () t cells in newly diagnosed glioblastoma (gbm) patients receiving maintenance temozolomide (tmz): immunobiologic correlative data,” Journal for ImmunoTherapy of Cancer 11, 729–729 (2023).
- Gevertz and Wares (2024) J. L. Gevertz and J. R. Wares, “Assessing the role of patient generation techniques in virtual clinical trial outcomes,” Bulletin of Mathematical Biology 86, 119 (2024).
- Wang et al. (2024) H. Wang, T. Arulraj, A. Ippolito, and A. S. Popel, “From virtual patients to digital twins in immuno-oncology: lessons learned from mechanistic quantitative systems pharmacology modeling,” NPJ Digital Medicine 7, 189 (2024).
- Brown et al. (2022) L. V. Brown, J. Wagg, R. Darley, A. van Hateren, T. Elliott, E. A. Gaffney, and M. C. Coles, “De-risking clinical trial failure through mechanistic simulation,” Immunotherapy Advances 2, ltac017 (2022).
- Altrock, Liu, and Michor (2015) P. Altrock, L. Liu, and F. Michor, “The mathematics of cancer: Integrating quantitative models,” Nature Reviews Cancer 15, 730–745 (2015).
- Sahoo et al. (2020) P. Sahoo, X. Yang, D. Abler, D. Maestrini, V. Adhikarla, D. Frankhouser, H. Cho, V. Machuca, D. Wang, M. Barish, M. Gutova, S. Branciamore, C. E. Brown, and R. C. Rockne, “Mathematical deconvolution of car t-cell proliferation and exhaustion from real-time killing assay data,” Journal of The Royal Society Interface 17, 20190734 (2020), https://royalsocietypublishing.org/doi/pdf/10.1098/rsif.2019.0734 .
- Kimmel, Locke, and Altrock (2021) G. J. Kimmel, F. L. Locke, and P. M. Altrock, “The roles of T cell competition and stochastic extinction events in chimeric antigen receptor T cell therapy,” Proceedings of the Royal Society B: Biological Sciences 288, 20210229 (2021).
- Barros, Rodrigues, and Almeida (2020) L. R. C. Barros, B. d. J. Rodrigues, and R. C. Almeida, “CAR-T cell Goes on a Mathematical Model,” Journal of Cellular Immunology 2, 31–37 (2020).
- Mostolizadeh, Afsharnezhad, and Marciniak-Czochra (2018) R. Mostolizadeh, Z. Afsharnezhad, and A. Marciniak-Czochra, “Mathematical model of chimeric anti-gene receptor (car) t cell therapy with presence of cytokine,” Numerical Algebra, Control and Optimization 8, 63–80 (2018).
- León-Triana et al. (2021) O. León-Triana, S. Soukaina, G. Calvo, J. Belmonte-Beitia, S. Chulián, A. Martínez-Rubio, M. Rosa, A. Pérez-Martínez, M. Ramirez-Orellana, and V. Pérez-García, “Car t cell therapy in b-cell acute lymphoblastic leukaemia: Insights from mathematical models,” Communications in Nonlinear Science and Numerical Simulation 94, 105570 (2021).
- Pérez-García et al. (2020) V. Pérez-García, G. Calvo, J. Bosque, O. León-Triana, J. Jiménez Sánchez, J. Pérez Beteta, J. Belmonte-Beitia, M. Valiente, L. Zhu, P. García Gómez, P. Sánchez-Gómez, E. Miguel, R. Hortiguela, Y. Azimzade, D. Molina-García, A. Martínez-Rubio, A. Rojas, A. Ortiz de Mendivil, F. Vallette, and A. Vicente, “Universal scaling laws rule explosive growth in human cancers,” Nature Physics 16, 1–6 (2020).
- Serrano et al. (2024) S. Serrano, R. Barrio, l. Martínez-Rubio, J. Belmonte-Beitia, and V. M. Pérez-García, “Understanding the role of B cells in CAR T-cell therapy in leukemia through a mathematical model,” Chaos: An Interdisciplinary Journal of Nonlinear Science 34, 083142 (2024), https://pubs.aip.org/aip/cha/article-pdf/doi/10.1063/5.0206341/20130579/083142_1_5.0206341.pdf .
- Friedman, Kerby, and Calvert (2000) H. S. Friedman, T. Kerby, and H. Calvert, “Temozolomide and treatment of malignant glioma,” Clinical cancer research 6, 2585–2597 (2000).
- León-Triana et al. (2021) O. León-Triana, A. Perez-Martinez, M. Ramirez-Orellana, and V. Perez-Garcia, “Dual-target car-ts with on- and off-tumour activity may override immune suppression in solid cancers: A mathematical proof of concept,” Cancers 13 (2021), 10.3390/cancers13040703.
- Santurio and Barros (2022) D. S. Santurio and L. R. C. Barros, “A mathematical model for on-target off-tumor effect of car-t cells on gliomas,” Frontiers in Systems Biology 2, 923085 (2022).
- Ghorashian et al. (2019) S. Ghorashian, A. Kramer, S. Onuoha, and et al, “Enhanced car t cell expansion and prolonged persistence in pediatric patients with all treated with a low-affinity cd19 car,” Nature Medicine 25, 1408–1414 (2019).
- Delobel et al. (2023) T. Delobel, L. E. Ayala-Hernández, J. Bosque, J. Pérez Beteta, S. Chulián, M. García-Ferrer, P. Piñero, P. Schucht, M. Murek, and V. Pérez-García, “Overcoming chemotherapy resistance in low-grade gliomas: A computational approach,” PLOS Computational Biology 19, e1011208 (2023).
- Bodnar et al. (2024) M. Bodnar, M. Piotrowska, M. Bodzioch, J. Belmonte-Beitia, and U. Foryś, “Dual car-t cell therapy for glioblastoma: strategies to cure tumour diseases based on a mathematical model,” Nonlinear Dynamics 113, 1637–1666 (2024).
- Goff et al. (2019) S. L. Goff, R. A. Morgan, J. C. Yang, R. M. Sherry, P. F. Robbins, N. P. Restifo, S. A. Feldman, Y.-C. Lu, L. Lu, Z. Zheng, et al., “Pilot trial of adoptive transfer of chimeric antigen receptor–transduced t cells targeting egfrviii in patients with glioblastoma,” Journal of immunotherapy 42, 126–135 (2019).
- O’Rourke et al. (2017) D. M. O’Rourke, M. P. Nasrallah, A. Desai, J. J. Melenhorst, K. Mansfield, J. J. Morrissette, M. Martinez-Lage, S. Brem, E. Maloney, A. Shen, et al., “A single dose of peripherally infused egfrviii-directed car t cells mediates antigen loss and induces adaptive resistance in patients with recurrent glioblastoma,” Science translational medicine 9, eaaa0984 (2017).
- Portnow et al. (2009) J. Portnow, B. Badie, M. Chen, A. Liu, S. Blanchard, and T. W. Synold, “The neuropharmacokinetics of temozolomide in patients with resectable brain tumors: potential implications for the current approach to chemoradiation,” Clinical Cancer Research 15, 7092–7098 (2009).
- Italia et al. (2023) M. Italia, K. Y. Wertheim, S. Taschner-Mandl, D. Walker, and F. Dercole, “Mathematical model of clonal evolution proposes a personalised multi-modal therapy for high-risk neuroblastoma,” Cancers 15, 1986 (2023).
- Campos et al. (2014) B. Campos, Z. Gal, A. Baader, T. Schneider, C. Sliwinski, K. Gassel, J. Bageritz, N. Grabe, A. Von Deimling, P. Beckhove, et al., “Aberrant self-renewal and quiescence contribute to the aggressiveness of glioblastoma,” The Journal of pathology 234, 23–33 (2014).
- Stepanenko et al. (2016) A. A. Stepanenko, S. V. Andreieva, K. V. Korets, D. O. Mykytenko, V. P. Baklaushev, N. L. Huleyuk, O. A. Kovalova, K. V. Kotsarenko, V. P. Chekhonin, Y. S. Vassetzky, et al., “Temozolomide promotes genomic and phenotypic changes in glioblastoma cells,” Cancer cell international 16, 1–16 (2016).
- Yuan et al. (2018) A. L. Yuan, C. B. Ricks, A. K. Bohm, X. Lun, L. Maxwell, S. Safdar, S. Bukhari, A. Gerber, W. Sayeed, E. A. Bering, et al., “Abt-888 restores sensitivity in temozolomide resistant glioma cells and xenografts,” PLoS One 13, e0202860 (2018).
- Dai et al. (2018) S. Dai, Y. Yan, Z. Xu, S. Zeng, L. Qian, L. Huo, X. Li, L. Sun, and Z. Gong, “Scd1 confers temozolomide resistance to human glioma cells via the akt/gsk3/-catenin signaling axis,” Frontiers in pharmacology 8, 960 (2018).
- Gupta et al. (2014) S. K. Gupta, A. C. Mladek, B. L. Carlson, F. Boakye-Agyeman, K. K. Bakken, S. H. Kizilbash, M. A. Schroeder, J. Reid, and J. N. Sarkaria, “Discordant in vitro and in vivo chemopotentiating effects of the parp inhibitor veliparib in temozolomide-sensitive versus-resistant glioblastoma multiforme xenografts,” Clinical Cancer Research 20, 3730–3741 (2014).
- Tomar et al. (2021) M. S. Tomar, A. Kumar, C. Srivastava, and A. Shrivastava, “Elucidating the mechanisms of temozolomide resistance in gliomas and the strategies to overcome the resistance.” Biochimica et Biophysica Acta (BBA)-Reviews on Cancer 1876, 188616 (2021).
- Bernstein and Bhat (1999) D. Bernstein and S. Bhat, “Nonnegativity, reducibility, and semistability of mass action kinetics,” Proceedings of the IEEE Conference on Decision and Control 3, 2206 – 2211 vol.3 (1999).
- Haddad and Chellaboina (2005) W. Haddad and V. Chellaboina, “Stability and dissipativity theory for nonnegative dynamical systems: A unified analysis framework for biological and physiological systems,” Nonlinear Analysis: Real World Applications 6, 35–65 (2005).
- Creed, Gerke, and Berglund (2020) J. H. Creed, T. A. Gerke, and A. E. Berglund, “Matsurv: Survival analysis and visualization in matlab,” Journal of Open Source Software 5, 1830 (2020).
- Lee (2016) S. Y. Lee, “Temozolomide resistance in glioblastoma multiforme,” Genes & diseases 3, 198–210 (2016).
- Scott et al. (2011) J. G. Scott, J. H. Suh, P. Elson, G. H. Barnett, M. A. Vogelbaum, D. M. Peereboom, G. H. Stevens, H. Elinzano, and S. T. Chao, “Aggressive treatment is appropriate for glioblastoma multiforme patients 70 years old or older: a retrospective review of 206 cases,” Neuro-oncology 13, 428–436 (2011).
- Li et al. (2018) J. Li, R. Liang, C. Song, Y. Xiang, and Y. Liu, “Prognostic significance of epidermal growth factor receptor expression in glioma patients,” OncoTargets and therapy , 731–742 (2018).
- Chen et al. (2015) W.-J. Chen, D.-S. He, R.-X. Tang, F.-H. Ren, and G. Chen, “Ki-67 is a valuable prognostic factor in gliomas: evidence from a systematic review and meta-analysis,” Asian Pacific Journal of Cancer Prevention 16, 411–420 (2015).
- Skaga et al. (2022) E. Skaga, E. Kulesskiy, S. Potdar, I. Panagopoulos, F. Micci, I. A. Langmoen, C. J. Sandberg, and E. O. Vik-Mo, “Functional temozolomide sensitivity testing of patient-specific glioblastoma stem cell cultures is predictive of clinical outcome,” Translational oncology 26, 101535 (2022).
- Chen et al. (2019) M. Chen, R. Sun, B. Shi, Y. Wang, S. Di, H. Luo, Y. Sun, Z. Li, M. Zhou, and H. Jiang, “Antitumor efficacy of chimeric antigen receptor t cells against egfrviii-expressing glioblastoma in c57bl/6 mice,” Biomedicine & Pharmacotherapy 113, 108734 (2019).
- Agosti et al. (2024) E. Agosti, A. Garaba, S. Antonietti, T. Ius, M. M. Fontanella, M. Zeppieri, and P. P. Panciani, “Car-t cells therapy in glioblastoma: a systematic review on molecular targets and treatment strategies,” International Journal of Molecular Sciences 25, 7174 (2024).
- Sterner and Sterner (2021) R. Sterner and R. Sterner, “Car-t cell therapy: current limitations and potential strategies,” Blood Cancer Journal 11, 69 (2021).
- Xu et al. (2020) S. Xu, L. Tang, X. Li, F. Fan, and Z. Liu, “Immunotherapy for glioma: current management and future application,” Cancer letters 476, 1–12 (2020).
- Gatenby, Brown, and Vincent (2009) R. A. Gatenby, J. Brown, and T. Vincent, “Lessons from applied ecology: cancer control using an evolutionary double bind,” Cancer research 69, 7499–7502 (2009).
- Orlando, Gatenby, and Brown (2012) P. A. Orlando, R. A. Gatenby, and J. S. Brown, “Cancer treatment as a game: integrating evolutionary game theory into the optimal control of chemotherapy,” Physical biology 9, 065007 (2012).
- Italia, Dercole, and Lucchetti (2022) M. Italia, F. Dercole, and R. Lucchetti, “Optimal chemotherapy counteracts cancer adaptive resistance in a cell-based, spatially-extended, evolutionary model,” Physical Biology 19, 026004 (2022).
- Owens, Rahman, and Bozic (2024) K. Owens, A. Rahman, and I. Bozic, “Spatiotemporal dynamics of tumor-car t-cell interaction following local administration in solid cancers,” bioRxiv (2024).