FinSphere: A Conversational Stock Analysis Agent Equipped with Quantitative Tools based on Real-Time Database
Abstract
Current financial Large Language Models (LLMs) struggle with two critical limitations: a lack of depth in stock analysis, which impedes their ability to generate professional-grade insights, and the absence of objective evaluation metrics to assess the quality of stock analysis reports. To address these challenges, this paper introduces FinSphere, a conversational stock analysis agent, along with three major contributions: (1) Stocksis, a dataset curated by industry experts to enhance LLMs’ stock analysis capabilities, (2) AnalyScore, a systematic evaluation framework for assessing stock analysis quality, and (3) FinSphere, an AI agent that can generate high-quality stock analysis reports in response to user queries. Experiments demonstrate that FinSphere achieves superior performance compared to both general and domain-specific LLMs, as well as existing agent-based systems, even when they are enhanced with real-time data access and few-shot guidance. The integrated framework, which combines real-time data feeds, quantitative tools, and an instruction-tuned LLM, yields substantial improvements in both analytical quality and practical applicability for real-world stock analysis.
FinSphere: A Conversational Stock Analysis Agent Equipped with Quantitative Tools based on Real-Time Database
Shijie Han11footnotemark: 11,2, Changhai Zhou††thanks: Equal contribution1,3, Yiqing Shen1,4, Tianning Sun1,5, Yuhua Zhou1,6, Xiaoxia Wang1, Zhixiao Yang1, Jingshu Zhang1, Hongguang Li††thanks: Corresponding author: harvey2@mail.ustc.edu.cn1 1JF SmartInvest Holdings Ltd, 2Columbia University, 3Fudan University, 4Johns Hopkins University, 5University of Nottingham-Ningbo, 6Zhejiang University
1 Introduction
Large Language Models (LLMs) have demonstrated remarkable capabilities in comprehending and processing natural language, extending their influence across various domains, including finance Li et al. (2023b). By leveraging their language comprehension capabilities, these models have exhibited exceptional performance in various financial applications, including sentiment analysis Liu et al. (2024); Zhang et al. (2023a) and information extraction from unstructured financial texts Li et al. (2024); Huang et al. (2023). The advent of finance-specific LLMs such as FinBERT Yang et al. (2020); Liu et al. (2021b), BloombergGPT Wu et al. (2023), and PIXIU Xie et al. (2023) has further enhanced the capacity to process financial data effectively. These advancements have laid the foundation for developing more sophisticated financial analysis tools and shifted how investors interact with market data Krause (2023); Nie et al. (2024). These AI-powered systems have democratized access to professional-grade financial insights, enabling retail investors to obtain sophisticated financial analysis once exclusive to institutional investors.
As LLM technology continues to evolve, there is an increasing expectation for these models to handle more complex financial tasks, particularly in stock analysis Yang et al. (2023b); Zhao et al. (2024). This progression has resulted in the emergence of tool-augmented agents that combine LLMs’ language capabilities with specialized financial tools, representing a significant leap in automated financial analysis Ding et al. (2024); Zhang et al. (2024). However, LLMs continue to encounter challenges in utilizing these tools’ outputs to generate high-quality analytical results. Two major challenges are the lack of specialized datasets for fine-tuning LLMs’ analytical capabilities, and the absence of systematic evaluation methods to quantify their performance in stock analysis. Furthermore, current research is constrained by LLMs’ reliance on historical data, such as GPT-4o’s dependence on its training data for generating responses Ni et al. (2024); Bhat and Jain (2024). This limitation in accessing real-time financial data and domain-specific information restricts them from fully capturing the dynamic nature of financial markets.
To address these limitations, we present three key contributions:
-
•
Stocksis, a specialized dataset curated by industry experts to enhance LLMs’ stock analysis capabilities.
-
•
AnalyScore, a comprehensive evaluation framework to quantify improvements in analysis quality.
-
•
FinSphere, an AI agent that can generate high-quality stock analysis reports in response to user queries.
Our experiments demonstrate that FinSphere, integrating real-time financial databases, specialized quantitative tools, and an instruction-tuned LLM, significantly outperforms both general and domain-specific LLMs, as well as existing agent-based systems. This superior performance persists even when baseline models are augmented with real-time background information and few-shot prompting, validating the effectiveness of our integrated approach to stock analysis.
2 Related Work
LLMs have emerged as powerful tools for stock analysis and trading Zhao et al. (2024); Li et al. (2023b). Research demonstrates their effectiveness in predicting stock prices and conducting market analysis Ni et al. (2024); Bhat and Jain (2024). Domain-specific models like InvestLM (Yang et al., 2023b) and GPT-InvestAR (Gupta, 2023) have been developed for investment analysis. Recent studies have also explored LLMs’ applications in financial anomaly detection Park (2024), portfolio evaluation Wu (2024), and financial statement analysis Kim et al. (2024), highlighting their potential to transform financial analysis.
Financial Datasets and Evaluation Metrics
Current financial datasets such as FinQA Chen et al. (2021), TAT-QA Zhu et al. (2021), and FLARE Xie et al. (2023) lack comprehensive stock analysis coverage, focusing instead on general financial tasks. Although BloombergGPT Wu et al. (2023) and FinRL Liu et al. (2021a) focus on trading strategies, and benchmarks like CFBenchmark Lei et al. (2023) cover broader financial tasks, a gap still exists in the availability of specialized stock analysis datasets. Additionally, financial text evaluation predominantly relies on general metrics such as BLEU Papineni et al. (2002) and ROUGE Rouge (2004), highlighting the necessity for domain-specific evaluation methods developed with financial expertise.
Instruction Tuning and Tool Integration
Financial LLMs have advanced through domain-specific instruction tuning, as demonstrated by InvestLM Yang et al. (2023b) and BloombergGPT Wu et al. (2023). Integration with specialized tools has also progressed, exemplified by FinGPT Yang et al. (2023a) with financial APIs, XBRL-Agent Han et al. (2024) with financial calculators, and the FinOps framework Li et al. (2023a). While these academic developments have improved financial applications Zhang et al. (2023b); Chen et al. (2023), they rely on historical data and fundamental tools. To address these limitations, we propose FinSphere Agent, leveraging our real-time database and advanced quantitative tools, as detailed in Section 4.
3 Stocksis and AnalyScore
Stock market analysis is becoming increasingly complex, necessitating the integration of diverse data sources and sophisticated analytical approaches. While LLMs demonstrate potential in transforming financial analysis, there are two critical gaps in the current landscape: the lack of high-quality training data for developing LLMs’ stock analysis capabilities, and the absence of standardized evaluation frameworks for assessing the quality of AI-generated stock analyses. This section introduces two significant contributions to address these gaps: Stocksis, a comprehensive dataset specifically designed to enhance LLMs’ stock analysis capabilities and AnalyScore, a systematic evaluation framework for assessing stock analysis reports.
| Prompt with Background Information (input) | Expert-Edited Analysis (label) |
| System Instruction. You are a proficient investment assistant, adept at stock analysis tasks. You demonstrate a robust aptitude for comprehending user-provided [Question] and meticulously organizing them into accurate and standardized analysis reports. You utilize the [Background Information] provided by the corresponding quantitative tools to respond to users in a systematic and standardized manner. Background Information (from quantitative tools). • Capital Flow Analysis: TF Securities is currently under moderate control by market leaders, indicating a positive institutional outlook. There is a strong willingness for margin financing inflow. Institutional quarterly shareholding has increased, suggesting institutions are optimistic about the company’s development, warranting attention to medium-term opportunities. • [Other specialized analysis from quantitative tools] Question. Please analyze TF Securities. | From a capital flow perspective, the 5-day cumulative DDX of -14.865 indicates significant selling pressure from major market participants and strong bearish sentiment. Despite moderate institutional control and determined margin financing inflows showing relatively active main capital, short-term capital flows warrant caution. [Key Summaries of supporting conclusions drawn from other Specialized Analysis] In conclusion, TF Securities shows recent unusual market activity, largely driven by heightened trading within the securities sector. Technical analysis reveals short-term opportunities with a bullish engulfing pattern, though weak fundamentals warrant caution for medium to long-term positions. Investors should monitor market trends and company developments, as the stock benefits from sector momentum despite underlying fundamental concerns. |
3.1 Stocksis: A High-Quality Dataset for Enhancing LLMs’ Stock Analysis Capabilities
Stocksis comprises 5,000 meticulously curated training pairs, with 50 pairs 111The 50 pairs from Stocksis have been anonymized and are available at https://anonymous.4open.science/r/Stocksis-BD25/ available in the open-source release for research and development purposes. An abbreviated example is shown in Table 1 and the complete content of the same sample is detailed in Table 6. Each training sample consists of two key components:
-
•
Prompt with Background Information (input): A complete analytical prompt that includes aggregated outputs from multiple quantitative analysis tools (averaging six distinct tools per sample) as background information. The background information covers volume-price analysis, technical indicators, and other market metrics. Each prompt is rigorously crafted to guide the model in performing specific analytical tasks while leveraging the provided background information. The average length is 4,000 words.
-
•
Expert-Edited Analysis (label): In-depth analytical reports responding to the prompt’s requirements while effectively utilizing the background information, averaging 3,000 words per report. These expert-crafted analyses provide both overall market assessments and detailed rationales demonstrating how to effectively interpret various quantitative indicators.
Dataset Collection and Quality Assurance.
The dataset is meticulously compiled through a structured process leveraging our company’s expertise in stock market analysis. The quantitative tools used for data collection are well-established products from our company, which specializes in providing stock analysis recommendations to individual investors. The data collection process involved two key phases:
-
1.
Prompt and Background Information Generation: Expert analysts carefully select appropriate analytical tools based on specific stock analysis queries, generating quantitative analyses as background information. These analysts subsequently craft targeted prompts that incorporate this background information to guide the analysis process.
-
2.
Comprehensive Analysis Creation: A panel of 10 seasoned stock analysts develops detailed analysis reports in response to these prompts. Each analyst contributes their expertise to synthesize the background information into coherent insights that directly address the prompt requirements. This thorough process spans approximately three months, ensuring rigorous review and quality control of all analyses.
The release of Stocksis addresses a critical gap in AI financial analysis. While LLMs exhibit general capabilities, they struggle to integrate multiple quantitative signals into coherent market analysis. Current datasets primarily focus on either price data or news sentiment, lacking examples that combine structured prompts and expert reasoning. By publishing this dataset, we aim to facilitate the development of AI models capable of providing sophisticated, tool-based stock analysis, making quality financial insights more accessible.
3.2 AnalyScore: A Comprehensive Evaluation Framework for Stock Analysis Reports
AnalyScore is an innovative evaluation framework designed to assess the quality of stock analysis reports, developed by industry experts combining traditional stock analysis evaluation principles with LLM-related knowledge. This framework implements a two-tier evaluation system to ensure both fundamental quality standards and detailed analytical excellence.
Framework Structure
The evaluation process consists of two main components:
-
1.
Priori Eligibility Check (shown in Table 4 in Appendix): A mandatory preliminary assessment comprising six essential criteria that must be met with 100% compliance prior to proceeding to detailed evaluation. These criteria ensure adherence to basic quality standards in (1) Conclusion Structure; (2) Logical Consistency; (3) Factual Support; (4) Data Timeliness; (5) Analytical Dimensions; (6) Neutral Language
-
2.
Detailed Evaluation (shown in Table 5 in Appendix): A comprehensive scoring system across four key dimensions, totaling 100 points:
-
•
Conclusion (20 points): Evaluate the clarity and personalization of investment recommendations
-
•
Content (45 points): Assess professional analysis quality and logical consistency
-
•
Expression (15 points): Examine structural organization and language clarity
-
•
Data (20 points): Measure the breadth and depth of data utilization
-
•
This structured approach ensures a thorough and systematic evaluation of stock analysis reports, combining both qualitative standards and quantitative metrics to provide a comprehensive assessment of report quality. Currently, AnalyScore is employed solely by human experts in stock analysis, but we plan to design detailed prompts that enable LLMs to replace human experts in evaluating analysis reports using AnalyScore in the future.
4 FinSphere Agent
This section details the architecture and operational mechanisms of FinSphere Agent, our advanced stock analysis agent.

4.1 Powerful Quantitative Tools based on Real-Time Databases
A core strength of FinSphere lies in its seamless integration with our company’s mature suite of quantitative analysis tools, which have been extensively deployed and validated in production environments. These tools access our comprehensive real-time financial database, which maintains extensive coverage of market stocks, including both structured data (price movements, trading volumes, financial metrics) and unstructured data (corporate announcements, analyst reports, market news).
When FinSphere identifies the necessity for specific quantitative analysis, it triggers the corresponding tool from our production suite. These tools then automatically query our real-time database to extract the most recent relevant data, perform sophisticated calculations, and generate specialized analyses such as technical indicators, fundamental valuations, or market sentiment assessments. Each tool is designed to provide contextual information specifically tailored to user queries, leveraging our continuously updated database to ensure that all analyses accurately reflect current market conditions. This architecture ensures that FinSphere’s responses are always grounded in the most recent market data while benefiting from our proven quantitative methodologies.
4.2 Instruction Tuning
We have conducted instruction fine-tuning on Qwen2-72B using our expert-curated Stocksis dataset to enhance the model’s financial analysis capabilities. The Stocksis dataset, as introduced in Section 3.1 comprises 5,000 high-quality training pairs, each consisting of structured prompts with comprehensive quantitative tool outputs and corresponding expert-authored analyses. The fine-tuning process employs the LoRA (Low-Rank Adaptation) Hu et al. (2021), which has enabled efficient parameter updates while maintaining the model’s general capabilities. Through this approach, we have trained the model to interpret outputs from multiple quantitative tools, integrate diverse analytical perspectives, and generate well-structured reports following professional analytical patterns.
4.3 Overall Workflow
FinSphere operates through a systematic, multi-stage process to generate comprehensive financial analyses. Upon receiving a user query, FinSphere first employs chain-of-thought (CoT) reasoning to decompose the analytical request into structured subtasks and identifies the appropriate quantitative tools required for each component.
Following task decomposition, the selected quantitative tools independently access our real-time financial database. Each tool retrieves the most current market data and information pertinent to its analytical domain, generating specialized analyses that reflect up-to-the-minute market conditions. These analyses range from technical indicators to fundamental metrics, providing a multi-dimensional view of the comprehensive analysis.
The final stage involves our Stocksis-tuned model, which serves as an expert analyst. The model receives all specialized analyses as input and synthesizes them into a cohesive, high-quality response. Through instruction fine-tuning on the Stocksis dataset, the model has developed sophisticated capabilities in interpreting quantitative outputs and generating professional-grade financial analyses. This integrated workflow ensures that FinSphere’s responses combine the precision of quantitative analysis with the nuanced understanding of expert financial reasoning, all while maintaining real-time relevance.
5 Evaluation
| Qualification | Conclusion | Content | Expression | Data | Total | |
| Rate | (Score: 20) | (Score: 45) | (Score: 15) | (Score: 20) | Score | |
| GPT-4o | 91% | 9.85 | 26.12 | 12.44 | 18.20 | 66.61 |
| GPT3.5 | 78% | 7.95 | 21.05 | 10.15 | 14.30 | 53.45 |
| Qwen2-72B | 81% | 8.15 | 22.55 | 10.55 | 14.95 | 56.20 |
| InvestLM | 75% | 8.40 | 23.10 | 11.25 | 15.75 | 58.50 |
| FinGPT | 62% | 6.80 | 18.55 | 8.95 | 10.75 | 40.05 |
| FinRobot | 81% | 9.10 | 24.05 | 11.55 | 16.35 | 61.05 |
| FinMem | 84% | 9.90 | 25.95 | 12.85 | 18.85 | 67.55 |
| FinSphere | 89% | 9.95 | 27.16 | 14.87 | 18.90 | 70.88 |
Given FinSphere’s integration with real-time financial databases and proprietary quantitative tools, it possesses analytical capabilities that extend beyond those of general-purpose LLMs. Traditional performance comparisons between FinSphere and general LLMs present inherent challenges, primarily due to the latter’s inability to access real-time financial data and domain-specific information. For example, GPT-4o typically acknowledges its limitations with responses like "As an AI language model with knowledge cut-off in October 2023, I don’t have access to real-time stock information." To demonstrate FinSphere’s enhanced capabilities while ensuring a fair comparison, we have implemented a comprehensive experimental design.
Baseline.
Our comparative analysis evaluates three categories of models: single LLM, Agent-based systems, and FinSphere. For LLM-based models, we test proprietary models (GPT-4o, GPT3.5), open-source model (Qwen2-72B), and domain-specific models (InvestLM Yang et al. (2023b), FinGPT Yang et al. (2023a)), all using chain-of-thought prompting with few-shot examples and relevant background information (detailed in Appendix D). For Agent-based systems, we evaluate FinMem Yu et al. (2024) and FinRobot Yang et al. (2024), employing simplified prompts with few-shot examples and background information, like the input of Stocksis. Finally, we evaluate FinSphere through direct user queries, leveraging its integrated real-time database and quantitative tools (detailed in Appendix I).
5.1 Generation Contrast
Comprehensive results in Table 2 evaluated by experts using the AnalyScore framework demonstrate FinSphere’s superior performance across all assessment dimensions, achieving an overall score of 70.88 out of 100. This performance notably surpasses both traditional LLM-based approaches and other agent-based systems, with FinMem and GPT-4o following at 67.55 and 66.61 respectively. The evaluation reveals a clear performance hierarchy. Generally, specialized agent-based systems consistently outperform standalone language models (except GPT-4o), while general-purpose LLMs show moderate performance and domain-specific LLMs like FinGPT (40.05) demonstrate relatively limited capabilities. The results validate the effectiveness of FinSphere’s integrated approach, which combines real-time data access, quantitative tools and the Stocksis-tuned LLM.
It is noteworthy that general LLMs require extensive exemplars in their prompts to generate appropriate stock analysis outputs. This requirement significantly increases the input token count, resulting in higher operational costs for GPT-4o and restrictions on small context-window LLM. In contrast, FinSphere’s architecture and instruction fine-tuning obviate the need for such verbose prompts, allowing it to achieve superior performance with substantially fewer input tokens. Furthermore, FinSphere is scheduled for public release with free access in December 2024, with detailed release information available in Appendix H.
5.2 Ablation Study
To investigate the impact of training data scale on FinSphere’s performance, we conduct an ablation study using different proportions of the Stocksis dataset. We fine-tune Qwen2-72B using 20%, 50%, 80%, and 100% of the 5,000 data pairs while maintaining FinSphere’s framework. The detailed evaluation results are provided in Appendix B.
The results demonstrate a clear positive correlation between training data scale and model performance, with overall scores increasing from 58.90 (20%) to 70.88 (100%). Notably, the performance improvement shows a non-linear pattern, with larger incremental gains observed at higher data volumes (3.78 points from 20% to 50%, 3.99 points from 50% to 80%, and 4.21 points from 80% to 100%). These findings underscore the importance of comprehensive training data in achieving optimal performance, while also demonstrating the robust scalability of our framework, as FinSphere maintains satisfactory performance levels even with reduced training data.
6 Conclusion
This paper introduces FinSphere, an innovative stock analysis agent that addresses critical gaps in the capabilities of LLMs for stock analysis. By integrating real-time financial databases, quantitative tools, and an instruction-tuned LLM, FinSphere demonstrates superior performance in generating comprehensive stock analyses. The development and release of Stocksis, a high-quality dataset for enhancing LLMs’ stock analysis capabilities, and AnalyScore, a systematic evaluation framework, provide valuable resources for advancing research in AI-powered financial analysis. Our experimental results indicate that FinSphere consistently outperforms general-purpose, domain-specific LLMs and Agent systems across multiple evaluation dimensions, highlighting the effectiveness of our integrated approach. This work represents a significant advancement toward democratizing access to professional-grade financial analysis tools while maintaining analytical rigor and practical utility.
References
- Bhat and Jain (2024) Rithesh Bhat and Bhanu Jain. 2024. Stock price trend prediction using emotion analysis of financial headlines with distilled llm model. In Proceedings of the 17th International Conference on PErvasive Technologies Related to Assistive Environments, pages 67–73.
- Chen et al. (2023) Qitong Chen, Xiao Wang, Cheng Jin, Zeyang Li, Zhiyuan Li, Hao Zhao, and Junzhou Huang. 2023. Integrating large language models with graphical models for decision making in finance. arXiv preprint arXiv:2310.05230.
- Chen et al. (2021) Zhiyu Chen, Wenhu Chen, Charese Smiley, Sameena Shah, Iana Borova, Dylan Langdon, Reema Moussa, Matt Beane, Ting-Hao Huang, Bryan R Routledge, et al. 2021. Finqa: A dataset of numerical reasoning over financial data. In Proceedings of the 2021 Conference on Empirical Methods in Natural Language Processing, pages 3697–3711.
- Ding et al. (2024) Han Ding, Yinheng Li, Junhao Wang, and Hang Chen. 2024. Large language model agent in financial trading: A survey. arXiv preprint arXiv:2408.06361.
- Gupta (2023) Udit Gupta. 2023. Gpt-investar: Enhancing stock investment strategies through annual report analysis with large language models. arXiv preprint arXiv:2309.03079.
- Han et al. (2024) Shijie Han, Haoqiang Kang, Bo Jin, Xiao-Yang Liu, and Steve Y Yang. 2024. Xbrl agent: Leveraging large language models for financial report analysis. In Proceedings of the 5th ACM International Conference on AI in Finance, pages 856–864.
- Hu et al. (2021) Edward J Hu, Phillip Wallis, Zeyuan Allen-Zhu, Yuanzhi Li, Shean Wang, Lu Wang, Weizhu Chen, et al. 2021. Lora: Low-rank adaptation of large language models. In International Conference on Learning Representations.
- Huang et al. (2023) Allen H Huang, Hui Wang, and Yi Yang. 2023. Finbert: A large language model for extracting information from financial text. Contemporary Accounting Research, 40(2):806–841.
- Kim et al. (2024) Alex Kim, Maximilian Muhn, and Valeri Nikolaev. 2024. Financial statement analysis with large language models. arXiv preprint arXiv:2407.17866.
- Krause (2023) David Krause. 2023. Large language models and generative ai in finance: an analysis of chatgpt, bard, and bing ai. Bard, and Bing AI (July 15, 2023).
- Lei et al. (2023) Yang Lei, Jiangtong Li, Ming Jiang, Junjie Hu, Dawei Cheng, Zhijun Ding, and Changjun Jiang. 2023. Cfbenchmark: Chinese financial assistant benchmark for large language model. arXiv preprint arXiv:2311.05812.
- Li et al. (2024) Huaxia Li, Haoyun Gao, Chengzhang Wu, and Miklos A Vasarhelyi. 2024. Extracting financial data from unstructured sources: Leveraging large language models. Journal of Information Systems, pages 1–22.
- Li et al. (2023a) Wentao Li, Yuan Zhang, Xiao Yang, Yuxin Liu, Yan Zhu, Yixuan Liu, and Wei Chen. 2023a. Finops: An open-source framework for llm-based financial agent. arXiv preprint arXiv:2311.18530.
- Li et al. (2023b) Yinheng Li, Shaofei Wang, Han Ding, and Hang Chen. 2023b. Large language models in finance: A survey. In Proceedings of the fourth ACM international conference on AI in finance, pages 374–382.
- Liu et al. (2024) Chenghao Liu, Arunkumar Arulappan, Ranesh Naha, Aniket Mahanti, Joarder Kamruzzaman, and In-Ho Ra. 2024. Large language models and sentiment analysis in financial markets: A review, datasets and case study. IEEE Access.
- Liu et al. (2021a) Xiao-Yang Liu, Jingyang Rui, Jiechao Gao, Liuqing Yang, Hongyang Yang, Zhaoran Wang, Christina Dan Wang, and Jian Guo. 2021a. Finrl-meta: A universe of near-real market environments for data-driven deep reinforcement learning in quantitative finance. arXiv preprint arXiv:2112.06753.
- Liu et al. (2021b) Zhuang Liu, Degen Huang, Kaiyu Huang, Zhuang Li, and Jun Zhao. 2021b. Finbert: A pre-trained financial language representation model for financial text mining. In Proceedings of the twenty-ninth international conference on international joint conferences on artificial intelligence, pages 4513–4519.
- Ni et al. (2024) Haowei Ni, Shuchen Meng, Xupeng Chen, Ziqing Zhao, Andi Chen, Panfeng Li, Shiyao Zhang, Qifu Yin, Yuanqing Wang, and Yuxi Chan. 2024. Harnessing earnings reports for stock predictions: A qlora-enhanced llm approach. arXiv preprint arXiv:2408.06634.
- Nie et al. (2024) Yuqi Nie, Yaxuan Kong, Xiaowen Dong, John M Mulvey, H Vincent Poor, Qingsong Wen, and Stefan Zohren. 2024. A survey of large language models for financial applications: Progress, prospects and challenges. arXiv preprint arXiv:2406.11903.
- Papineni et al. (2002) Kishore Papineni, Salim Roukos, Todd Ward, and Wei-Jing Zhu. 2002. Bleu: a method for automatic evaluation of machine translation. In Proceedings of the 40th annual meeting of the Association for Computational Linguistics, pages 311–318.
- Park (2024) Taejin Park. 2024. Enhancing anomaly detection in financial markets with an llm-based multi-agent framework. arXiv preprint arXiv:2403.19735.
- Rouge (2004) Lin CY Rouge. 2004. A package for automatic evaluation of summaries. In Proceedings of Workshop on Text Summarization of ACL, Spain, volume 5.
- Wu (2024) Ruoxu Wu. 2024. Portfolio performance based on llm news scores and related economical analysis. Available at SSRN 4709617.
- Wu et al. (2023) Shijie Wu, Ozan Irsoy, Steven Lu, Vadim Dabravolski, Mark Dredze, Sebastian Gehrmann, Prabhanjan Kambadur, David Rosenberg, and Gideon Mann. 2023. Bloomberggpt: A large language model for finance. arXiv preprint arXiv:2303.17564.
- Xie et al. (2023) Qianqian Xie, Weiguang Han, Xiao Zhang, Yanzhao Lai, Min Peng, Alejandro Lopez-Lira, and Jimin Huang. 2023. Pixiu: a large language model, instruction data and evaluation benchmark for finance. In Proceedings of the 37th International Conference on Neural Information Processing Systems, pages 33469–33484.
- Yang et al. (2023a) Hongyang Yang, Xiao-Yang Liu, and Christina Dan Wang. 2023a. Fingpt: Open-source financial large language models. FinLLM at IJCAI.
- Yang et al. (2024) Hongyang Yang, Boyu Zhang, Neng Wang, Cheng Guo, Xiaoli Zhang, Likun Lin, Junlin Wang, Tianyu Zhou, Mao Guan, Runjia Zhang, et al. 2024. Finrobot: An open-source ai agent platform for financial applications using large language models. arXiv preprint arXiv:2405.14767.
- Yang et al. (2023b) Yi Yang, Yixuan Tang, and Kar Yan Tam. 2023b. Investlm: A large language model for investment using financial domain instruction tuning. arXiv preprint arXiv:2309.13064.
- Yang et al. (2020) Yi Yang, Mark Christopher Siy Uy, and Allen Huang. 2020. Finbert: A pretrained language model for financial communications. arXiv preprint arXiv:2006.08097.
- Yu et al. (2024) Yangyang Yu, Haohang Li, Zhi Chen, Yuechen Jiang, Yang Li, Denghui Zhang, Rong Liu, Jordan W Suchow, and Khaldoun Khashanah. 2024. Finmem: A performance-enhanced llm trading agent with layered memory and character design. In Proceedings of the AAAI Symposium Series, volume 3, pages 595–597.
- Zhang et al. (2023a) Boyu Zhang, Hongyang Yang, and Xiao-Yang Liu. 2023a. Instruct-fingpt: Financial sentiment analysis by instruction tuning of general-purpose large language models. arXiv preprint arXiv:2306.12659.
- Zhang et al. (2024) Wentao Zhang, Lingxuan Zhao, Haochong Xia, Shuo Sun, Jiaze Sun, Molei Qin, Xinyi Li, Yuqing Zhao, Yilei Zhao, Xinyu Cai, et al. 2024. A multimodal foundation agent for financial trading: Tool-augmented, diversified, and generalist. In Proceedings of the 30th ACM SIGKDD Conference on Knowledge Discovery and Data Mining, pages 4314–4325.
- Zhang et al. (2023b) Yuan Zhang, Xiao Yang, Yan Zhu, Yixuan Liu, and Wei Chen. 2023b. Llm-empowered chatbots for more accessible financial services. arXiv preprint arXiv:2312.16476.
- Zhao et al. (2024) Huaqin Zhao, Zhengliang Liu, Zihao Wu, Yiwei Li, Tianze Yang, Peng Shu, Shaochen Xu, Haixing Dai, Lin Zhao, Gengchen Mai, et al. 2024. Revolutionizing finance with llms: An overview of applications and insights. arXiv preprint arXiv:2401.11641.
- Zhu et al. (2021) Fengbin Zhu, Wenqiang Lei, Youcheng Huang, Chao Wang, Shuo Zhang, Jiancheng Lv, Fuli Feng, and Tat-Seng Chua. 2021. Tat-qa: A question answering benchmark on a hybrid of tabular and textual content in finance. In Proceedings of the 59th Annual Meeting of the Association for Computational Linguistics and the 11th International Joint Conference on Natural Language Processing (Volume 1: Long Papers). Association for Computational Linguistics.
| Stocksis | Qualification | Conclusion | Content | Expression | Data | Total |
| Scale | Rate | (Score: 20) | (Score: 45) | (Score: 15) | (Score: 20) | Score |
| 20% | 82% | 8.50 | 23.85 | 11.05 | 15.50 | 58.90 |
| 50% | 86% | 8.95 | 25.13 | 12.45 | 16.15 | 62.68 |
| 80% | 87% | 9.50 | 26.21 | 13.66 | 17.30 | 66.67 |
| 100% | 89% | 9.95 | 27.16 | 14.87 | 18.90 | 70.88 |
Appendix A AnalyScore Details
Appendix B Ablation Results
We put the result table of the ablation experiment in the main text here, for details, please see Table 3.
Appendix C More Analysis and Visualization
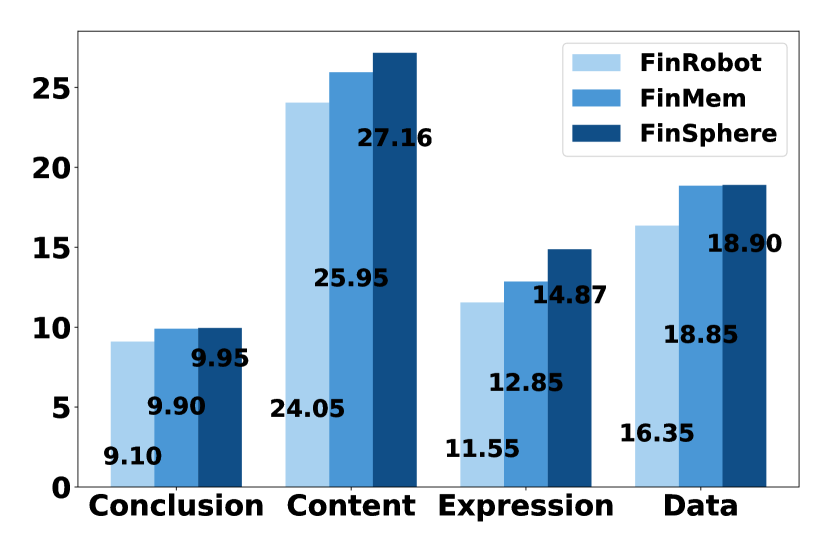
In our analysis in Section 5.1, we have demonstrated that agent-based systems generally outperform single LLM in stock analysis. To further examine the relative strengths of FinSphere, we have conducted a detailed dimensional comparison between FinSphere and two prominent agent-based systems (FinRobot and FinMem). The comparative visualization in Figure 2 reveals the nuanced performance differences across four key dimensions: Conclusion, Content, Expression, and Data capabilities.
From the visualization, we can observe FinSphere’s superior performance across all dimensions. In the Conclusion dimension, the three models show relatively close scores, with FinSphere slightly leading at 9.95, followed by FinMem at 9.90 and FinRobot at 9.10, indicating their reliable capability in deriving investment conclusions. The Content dimension reveals more significant differences, where FinSphere notably outperforms with 27.16 points compared to FinMem (25.95) and FinRobot (24.05), demonstrating FinSphere’s distinct advantage in analysis depth and content richness. The Expression dimension shows the most pronounced gap, with FinSphere scoring 14.87, significantly higher than FinMem (12.85) and FinRobot (11.55), highlighting FinSphere’s excellence in logical articulation and clarity of analysis. In the Data dimension, FinSphere and FinMem perform similarly (18.90 and 18.85 respectively), both substantially outperforming FinRobot (16.35), indicating superior data processing and utilization capabilities in the former two models.
Appendix D Testing Prompt
As a professional investment advisor, you will analyze stock based on the following:
[BACKGROUND INFORMATION - INSERT QUANTITATIVE TOOL RETURNS HERE]
[RESPONSE STANDARDS - SEE BELOW]
[WRITING GUIDELINES - SEE BELOW]
[FEW-SHOTS]
[SPECIFIC QUERY]
D.1 Response Standards
Step 1: Movement Summary
-
•
Clearly state whether stock shows unusual movement
-
•
Summarize the main reason from background information in under 20 words
Step 2: Conclusions
-
1.
Short-term Conclusion (based on technical analysis):
-
•
For bearish signals: suggest caution, observation, risk awareness, avoidance, position control
-
•
For bullish signals: suggest appropriate attention, tracking, validation
-
•
Note: State conclusion only, no explanation needed
-
•
-
2.
Medium/Long-term Conclusion (based on fundamental analysis):
-
•
For bearish signals: suggest caution, observation, risk awareness, avoidance, position control
-
•
For bullish signals: suggest appropriate attention, tracking, validation
-
•
Note: State conclusion only, no explanation needed
-
•
-
3.
Note: Technical analysis showing bullish keywords requires only direct bullish conclusions. Bullish keywords and bearish keywords are shown in the writing guidelines.
Step 3: Detailed Analysis
Provide an overview of the specific content in [background information] (such as volume and price situation, technical aspect, capital aspect, fundamental aspect, and news aspect) as a support for generating conclusions, and cannot change the financial data performance in the background information. The analysis mode that can be used for reference is as follows:
-
•
Volume and Price Analysis: Current price, price movement, industry comparison, index comparison, turnover rate, trading volume/value, market comparison. Include specific data and brief commentary.
-
•
Technical Analysis: Technical patterns, indicators with specific values. Note specialized indicators if present (e.g., "AI Top/Bottom", "Bull Institution signals").
-
•
Capital Flow Analysis: 5-day cumulative DDX and capital flow data analysis. Include specific DDX values.
-
•
Fundamental Analysis: Financial and fundamental data evaluation. Include specific values.
-
•
News Analysis: Latest news and movement causes, including specific numerical data.
Step 4: Final Summary
Restate short-term and medium/long-term conclusions with reasons.
D.2 Writing Guidelines
-
•
Provide direct conclusions and analysis, maintain concise response
-
•
Avoid phrases: "according to", "information shows", "recent performance", "current situation", "comprehensive analysis", "buy", "sell", "hold", "clear position", "build position", "reduce position", "increase position"
-
•
Minimize transition words: "but", "however", "then", "finally"
-
•
Maintain natural flow between paragraphs
-
•
Bullish keywords: bull point, golden cross, strong uptrend, strengthening, active holding, bullish combination, active attention
-
•
Bearish keywords: bear point, death cross, weakening, cautious observation, bearish combination, weak adjustment, weak decline.
| Conclusion Structure | Logical Consistency | Factual Support |
|---|---|---|
| Clear conclusions addressing: Time-based perspectives Multi-dimensional analysis | Consistency between: Conclusions and dimensions Dimensions and data | Analysis must include: Exact and quantifiable data Specific metrics or systems |
| Data Timeliness | Analytical Dimensions | Neutral Language |
| Requirements: Technical: Past month Capital flows: Past 15 days Financials: Past 3 years News: Past 15 days | At least include one of: Short-term analysis Medium/Long-term analysis Supporting data categories | Requirements: Avoid trading recommendations Focus on objective analysis Exclude trading keywords |
| Evaluation Dimensions | Subdimensions | Specific Standards | Scores | ||
|
Generates personalized conclusions based on investment preferences and risk profiles Provides explicit conclusions tailored to user personas Implements differentiated investment strategies Aligns with risk tolerance and investment horizons | 20 | |||
| Non-personalized but comprehensive analysis Covers diverse investment styles (conservative to aggressive) Enables user self-selection of strategies Shows broad analytical framework applicability | 10 | ||||
| Lacks personalization elements Single investment style analysis Limited analytical perspective Insufficient consideration of preferences | 5 | ||||
| No conclusive elements present | 0 | ||||
| Content (Total Score: 45) | Analysis Dimensions | Leverages interaction history for personalization Includes 2 non-personalized dimensional analyses Shows accuracy and forward-looking insights | 30 | ||
| Uses interaction history for personalization Provides accurate, targeted content Presents actionable recommendations | 25 | ||||
| Non-personalized analysis across 5 dimensions Demonstrates analytical accuracy and logical rigor | 20 | ||||
| Analysis across 4 core dimensions Includes real-time market analysis Maintains accuracy and timeliness | 18 | ||||
| Analysis across 4 core dimensions Maintains analytical accuracy | 15 | ||||
| Analysis across 3 core dimensions Demonstrates accuracy | 10 | ||||
| Analysis across 2 core dimensions Maintains basic accuracy | 5 | ||||
| Single-dimensional analysis Limited but accurate content | 0 | ||||
| Logical Consistency | Logical consistency across all components | 15 | |||
| Exhibits logical inconsistencies | 0 | ||||
| Expression (Total Score: 15) | Structure | Systematic organization | 5 | ||
| Lacks structure | 0 | ||||
| Language | Clear communication with hierarchical emphasis Logically rigorous with insightful perspectives In-depth analytical content | 10 | |||
| Clear content with essential coverage Basic logical flow Superficial analysis | 8 | ||||
| Comprehensible but unclear expression Discontinuous logic Surface-level analysis | 5 | ||||
| Unclear and difficult to comprehend Logical inconsistencies Lacks substantive content | 0 | ||||
|
Extensive data (>3 dimensions) | 20 | |||
| Substantial data (3 dimensions) | 15 | ||||
| Moderate data (2 dimensions) | 10 | ||||
| Limited data (1 dimension) | 5 | ||||
| No data utilization | 0 | ||||
Appendix E LLMs’ Response to users’ query
Here we show the responses of four LLMs (using different methods) to real user inquiries, as well as the scores and comments of experts after evaluation using AnalyScore.
E.1 FinSphere
Omat Advanced Materials shows unusual movement, mainly due to the company’s plan to build Mingyue Lake Industrial Park in Shaoguan High-tech Zone. In the short term, Omat’s stock price shows strong momentum, warranting active attention. In the medium to long term, given the company’s weak fundamentals, caution is advised.
Regarding price and volume, Omat’s latest stock price is 25.28 yuan, up 14.60%. It ranks 9th among semiconductor stocks, with the sector index up 5.91% and the Shanghai Composite Index up 0.09%, significantly outperforming both the sector and the broader market. Omat’s turnover rate is 54.01%, ranking 1st in the semiconductor industry, with total trading volume of 172,900 lots and total trading value of 407 million yuan, ranking 63rd in the industry. While Omat shows strong price performance today with high market participation, trading volume is relatively average.
Technical analysis shows Omat’s RSI formed a golden cross above 50 on November 5th, followed by a MACD golden cross above the zero axis on November 8th. The short-term RSI has reached 80.54, indicating overbought conditions, suggesting a possible strong adjustment in the near term.
Regarding capital flows, Omat’s 5-day cumulative DDX is 6.397, indicating strong recent institutional buying. The stock shows moderate institutional control, continued margin trading inflows, and increased quarterly institutional holdings, suggesting positive capital sentiment.
Financially, Omat’s Q3 2024 report shows significant declines in revenue and net profit attributable to shareholders. The company’s solvency is weak, with declining current and quick ratios and steadily rising debt-to-asset ratio, showing poor fundamentals compared to industry peers.
On the news front, Omat acknowledged at its performance briefing that due to economic conditions, the company’s performance is under pressure, with revenue down 22.63% and net profit down 77.38% in the first three quarters. The company’s plan to build Mingyue Lake Industrial Park in Shaoguan High-tech Zone to expand upstream high-purity materials and copper alloy new materials business demonstrates confidence in future development.
In conclusion, Omat shows positive short-term technical indicators with RSI and MACD golden crosses warranting attention. For the medium to long term, given weak fundamentals, poor performance, and weak solvency, caution is advised. Meanwhile, the Bull Force Index signals an entry opportunity, suggesting investors watch for potential trading opportunities.
Score and comments from experts using AnalyScore.
FinSphere’s analysis clearly identifies the causes of unusual price movements and investment recommendations with complete data citations, including sector comparisons. The conclusions match the data: based on strong technical indicators but weak fundamentals, it provides short-term focus and mid-term cautious recommendations. The analysis across different dimensions is logical with sufficient data support. Specific scores are as follows:
-
•
Conclusion (10/20):
-
–
Clear distinction between short-term and mid-to-long-term recommendations
-
–
Data-driven investment advice
-
–
Lacks personalized recommendations
-
–
-
•
Content (35/45):
-
–
Covers 5 core dimensions (volume/price, technical, capital flow, financial, news)
-
–
Professional and in-depth analysis across dimensions
-
–
Strong logical consistency
-
–
Lacks personalization
-
–
-
•
Expression (15/15):
-
–
Clear structure with hierarchical organization
-
–
Accurate use of professional terminology
-
–
Deep analysis with insights
-
–
-
•
Data (20/20):
-
–
Comprehensive data dimensions (>3 dimensions)
-
–
Accurate data citations with comparative analysis
-
–
-
•
Total: 80
E.2 GPT-4o with few-shot
Omat Advanced Materials shows unusual movement due to its planned Mingyue Lake Industrial Park project in Shaoguan High-tech Zone, which has boosted market expectations. The stock deserves moderate attention in both short and medium terms.
Regarding price and volume, Omat’s latest price is 25.28 yuan, up 14.60%, ranking 9th in the semiconductor industry. The semiconductor sector index stands at 2,740.03, up 5.91%. The Shanghai Composite Index is at 3,455.28, up 0.09%. Omat’s turnover rate of 54.01% ranks first in the industry, with total trading volume of 172,900 lots and trading value of 407 million yuan, ranking 63rd. The stock shows strong price gains and high market activity.
Technically, Omat formed an RSI golden cross above 50 on November 5th, followed by a MACD golden cross above the zero axis on November 8th, maintaining strong momentum. The current RSI of 80.54 indicates overbought conditions, suggesting potential near-term adjustment.
Capital flow analysis shows a 5-day cumulative DDX of 6.397, indicating strong institutional buying and moderate institutional control, with decisive margin trading inflows.
Fundamentally, Omat’s Q3 2024 report shows revenue of 297 million yuan for the first three quarters, down 22.63% year-over-year, and net profit of 9.8746 million yuan, down 77.38%. The company’s solvency is weak, with current ratio down 11.42%, quick ratio down 12.27%, and steadily rising debt-to-asset ratio.
Recent news indicates the company’s plan to build Mingyue Lake Industrial Park in Shaoguan High-tech Zone, expanding upstream operations, demonstrating confidence in future development. The market views positively the company’s multi-channel funding approach for steady project implementation.
In conclusion, Omat warrants moderate short-term attention given technical golden crosses and strong momentum. Medium-term moderate attention is advised, as despite expansion plans, fundamental data remains weak, requiring careful monitoring.
Score and comments from experts using AnalyScore.
GPT-4o with few-shot’s analysis begins with vague conclusions: "worth moderate attention in short term, should pay appropriate attention in medium to long term" lacks a clear stance; while data citations are complete, the analysis lacks depth; technical analysis is oversimplified and fails to fully interpret indicator meanings; the conclusion section lacks sufficient reasoning for investment recommendations. Specific scores are as follows:
-
•
Conclusion (10/20):
-
–
Ambiguous conclusions
-
–
Lack of specific investment recommendations
-
–
Insufficient reasoning
-
–
-
•
Content (25/45):
-
–
Relatively complete dimensional coverage
-
–
Insufficient depth of analysis
-
–
Simplified technical interpretation
-
–
-
•
Expression (15/15):
-
–
Basic clear structure
-
–
Plain expression
-
–
Lacks insights
-
–
-
•
Data (15/20):
-
–
Complete data citations
-
–
Insufficient data interpretation
-
–
-
•
Total: 65
E.3 QWen2-72B with few-shot
Fundamentally, Omat Advanced Materials reported revenue of 297 million yuan for the first three quarters of 2024, down 22.63% year-over-year, with net profit of 9.8746 million yuan, down 77.38%. Profitability metrics are weak, with ROE at 1.5%, net profit margin at 3.33%, and gross margin at 18.87%. Valuation metrics show P/E at 264.02 and P/B at 4.12, ranking at 46.5% and 64.56% in the industry respectively.
Technical analysis shows significant price volatility with 10-day amplitude and range at 48.21% and 19.54% respectively. The 5-day, 10-day, and 20-day moving averages are 21.72, 21.87, and 21.87 yuan respectively. While price is above these averages, their bearish alignment suggests potential near-term pressure.
Capital flow analysis shows volatile institutional flows over the past 10 days, with overall net outflows. Margin trading balance stands at 7.0404 million yuan, representing 0.44% of float, indicating low leverage participation.
As a STAR Market-listed company, Omat has raised funds for projects including high-end sputtering target production facilities. The company’s products serve various sectors including semiconductor displays, touch screens, architectural glass, decorative coating, IC packaging, solar photovoltaic, and power batteries.
In conclusion, Omat requires caution in the short term given bearish technical alignment and weak capital flows. Medium to long-term focus should be on performance improvement and industry development opportunities. Investors should closely monitor company performance, industry trends, and market capital flows.
Score and comments from experts using AnalyScore.
QWen2-72B with few-shot’s analysis lacks explanation of the causes behind unusual movements; technical analysis is disconnected from current trends and fails to reflect recent changes; capital flow descriptions are too general without specific data support; news analysis is superficial and fails to demonstrate deep analysis of company strategy; conclusions are overly conservative and don’t match some positive signals. Specific scores are as follows:
-
•
Conclusion (5/20):
-
–
Overly conservative conclusions
-
–
Mismatched with data support
-
–
Vague recommendations
-
–
-
•
Content (25/45):
-
–
Lacks analysis of abnormal movement causes
-
–
Disconnected technical analysis
-
–
Superficial multi-dimensional analysis
-
–
-
•
Expression (10/15):
-
–
Complete but weak hierarchical structure
-
–
Lacks professional expression
-
–
-
•
Data (15/20):
-
–
Basic complete data dimensions
-
–
Insufficient data support in some dimensions
-
–
-
•
Total: 55
Appendix F A complete example of Stocksis
Due to space limitations, we can only show part of the content of a sample of Stocksis in Table 1 in the main text. We show the complete content of the same sample in Table 6 here.
| Prompt with Background Information (input) | Expert-Edited Analysis (label) |
| System Instruction. You are a proficient investment assistant, adept at stock analysis tasks. You demonstrate a robust aptitude for comprehending user-provided [Question] and meticulously organizing them into accurate and standardized analysis reports. You utilize the [Background Information] provided by the corresponding quantitative tools to respond to users in a systematic and standardized manner. Background Information (get from quantitative tools). • Volume and Price Analysis: TF Securities is currently trading at 4.48, showing a 0.90% increase. The stock ranks 896th overall and 8th within the securities industry. The securities sector index stands at 1580.86 with a 0.09% increase, ranging between a high of 1623.79 and a low of 1553.31, with a total sector trading value of 75.187 billion yuan. While the Shanghai Composite Index is at 3189.89, down 0.36%, TF Securities demonstrates strong trading activity with a 17.65% turnover rate (ranking 102nd overall and 1st in the securities industry). On October 16th, the stock recorded an impressive trading volume of 152.947 million shares with a total trading value of 6.970 billion yuan, leading both the overall market and the securities industry in trading volume. • Technical Analysis: A bullish engulfing pattern emerged in TF Securities’ chart on September 13th, signaling potential short-term strength. The bullish outlook remains valid as long as the stock maintains support above the pattern’s key level of 2.68 yuan. • Capital Flow Analysis: Recent capital flow indicators show mixed signals for TF Securities. While the 5-day cumulative DDX of -14.865 indicates significant selling pressure from major players, the stock maintains medium-level control by market forces with an optimistic outlook. The strong inflow in margin trading and increased institutional holdings quarter-over-quarter suggest positive market sentiment and potential medium-term opportunities. • Financial Analysis: TF Securities released its 2024 semi-annual report on August 31st, which triggered a 23.75% stock price increase in the subsequent 10 trading days. The report revealed significant decreases in non-recurring net profit, revenue, and net profit attributable to the parent company. However, the Q2 2024 quarterly report showed substantial quarter-over-quarter improvements in these same metrics, indicating a potential turnaround in financial performance. • Fundamental Analysis: The company’s fundamental structure heavily relies on fee and commission income, which accounts for 131.22% of total revenue. When compared to industry peers, TF Securities shows below-average fundamental indicators. As a member of the securities industry according to SWSI classification, the company’s growth metrics raise concerns, with negative year-over-year growth rates in revenue, net profit, and earnings per share. • Market Movement Catalysts: Recent market movements have been influenced by several key events. The appointment of Pang Jiemin as the company’s Party Secretary has drawn attention, with the Hubei Hongtai Group’s Party Secretary and Chairman emphasizing the importance of political awareness and supporting the new leadership. The company subsequently held a cadre meeting to announce this appointment, highlighting commitments to party leadership and annual operational goals. Additionally, the broader market environment has been favorable, with Shanghai and Shenzhen markets’ trading volume exceeding 2 trillion yuan, contributing to TF Securities’ strong trading performance of 19.4 billion yuan, benefiting from the overall positive momentum in the securities sector. Question. Please analyze TF Securities. | TF Securities has shown unusual market movement due to active market trading, benefiting along with the broader securities sector. In the short term, there are bullish signals warranting attention. However, caution is advised for medium to long-term positions due to weak fundamentals. Regarding volume and price, TF Securities’ latest stock price is 4.48 yuan, up 0.90%. Today’s turnover rate is 17.65%, ranking first in the securities industry, with a trading volume of 152.947 million shares and a trading value of 6.970 billion yuan. The stock ranks 8th in its industry for price gains and is outperforming the Shanghai Composite Index, which is down 0.36%. The volume and price performance show active market participation and high overall engagement. On the technical front, TF Securities formed a bullish engulfing pattern on September 13th, indicating short-term strength. The bullish outlook remains valid as long as the price maintains above 2.68 yuan. Additionally, institutional analysis tools indicate strong institutional control, suggesting potential opportunities for investors. From a capital flow perspective, TF Securities’ 5-day cumulative DDX of -14.865 indicates significant selling pressure from major players and strong bearish sentiment. Despite medium-level institutional control and determined margin trading inflows suggesting relatively active capital participation, caution is needed regarding short-term capital flows. Fundamentally, TF Securities’ 2024 semi-annual report shows significant decreases in non-recurring net profit, revenue, and net profit attributable to the parent company, indicating poor overall growth. Moreover, the company’s heavy reliance on fee and commission income as its main revenue source places it at a disadvantage compared to industry peers. On the news front, TF Securities recently held a cadre meeting emphasizing strengthened party leadership and commitment to annual operational goals. Furthermore, the Shanghai and Shenzhen markets’ trading volume has consistently exceeded 2 trillion yuan, with TF Securities reaching 19.4 billion yuan in trading value, positively impacting the securities sector. In conclusion, TF Securities presents short-term opportunities due to the bullish engulfing pattern in technical analysis. However, investors should maintain caution in medium to long-term positions due to weak fundamentals. Investment decisions should be made with close attention to market trends and company developments. |
Appendix G Dataset Collection and Evaluation Costs
To further quantify the value of Stocksis and AnalyScore, we disclose the expert-curated Stocksis dataset containing 5,000 entries and the human evaluation costs for assessing model outputs using AnalyScore. Excluding the costs of quantitative tool calls, the expert compilation of comprehensive analyses costs approximately $75,000 (averaging $15 per entry). The expert evaluation of 100 outputs from each of the models using AnalyScore criteria cost approximately $11,000 (averaging $10 per evaluation). These figures do not include the additional costs associated with expert development of the AnalyScore evaluation framework.
In future work, we plan to design detailed prompts that enable LLMs to replace human experts in evaluating analysis reports using the AnalyScore criteria.
Appendix H Product Release Information
As FinSphere—a powerful stock analysis agent developed by a stock investment advisory company—we currently have a fully functional product demo and plan to make it freely available to the public in December 2024. Due to double-blind review requirements, we regrettably cannot showcase this promising product to the reviewers at this stage. However, we look forward to including access information for this free public tool in the final version of our paper.
Appendix I Detailed testing quiries
Here we disclose 100 queries used for testing and experts’ scores on FinSphere. For details, please check the Table 7, 8 and 9.
| Query | Qual | Conc | Cont | Expr | Data | Score |
|---|---|---|---|---|---|---|
| Can you analyze Fueneng Dongfang? | 1 | 10 | 35 | 15 | 15 | 75 |
| Please analyze the situation of Oulai New Materials stock. | 1 | 10 | 35 | 15 | 20 | 80 |
| Conduct a comprehensive analysis of Kangxi Communications. | 1 | 10 | 35 | 15 | 15 | 75 |
| Comprehensive analysis of Chuangyitong. | 0 | 10 | 35 | 15 | 20 | 80 |
| Can you provide a detailed interpretation of Lanhai Huanteng stock? | 1 | 10 | 20 | 15 | 20 | 65 |
| Please analyze the current status of Guixin Technology stock. | 1 | 10 | 33 | 15 | 15 | 73 |
| Is Zhejiang Hengwei worth investing in? Please analyze. | 1 | 10 | 35 | 15 | 20 | 80 |
| Conduct a comprehensive analysis of Anshuo Information. | 1 | 10 | 35 | 13 | 15 | 73 |
| I am interested in Chenyi Intelligence. Could you analyze it? | 0 | 10 | 10 | 15 | 15 | 50 |
| Diagnose Hailun Zhe. | 1 | 10 | 10 | 15 | 20 | 55 |
| Can you conduct an in-depth analysis of Fuguang Co., Ltd.? | 1 | 10 | 35 | 15 | 15 | 75 |
| Please analyze Haooubo. | 1 | 10 | 5 | 15 | 20 | 50 |
| How is Canxin Co., Ltd.? | 1 | 10 | 30 | 15 | 20 | 75 |
| Comprehensive analysis of Saiwei Intelligence. | 0 | 10 | 30 | 15 | 20 | 75 |
| Please provide a comprehensive evaluation of Cigu Technology. | 0 | 10 | 30 | 15 | 15 | 70 |
| Please comment on the overall performance of Sainuo Medical. | 0 | 10 | 10 | 15 | 15 | 50 |
| How is Longli Technology? | 1 | 10 | 30 | 15 | 15 | 70 |
| Can you provide a comprehensive analysis of Aofu Environmental Protection? | 1 | 10 | 30 | 15 | 15 | 70 |
| What is the comprehensive situation of Yubang New Materials? | 1 | 10 | 30 | 15 | 20 | 75 |
| Please conduct a comprehensive review of Zhuojin Co., Ltd. | 1 | 10 | 10 | 15 | 15 | 50 |
| How is the performance of Huaguang New Materials in all aspects? | 1 | 10 | 5 | 15 | 20 | 50 |
| Please conduct a comprehensive analysis of Jiankang. | 1 | 10 | 25 | 15 | 15 | 65 |
| Overall analysis of Taifu Pumps. | 1 | 10 | 30 | 15 | 15 | 70 |
| Comment on Zhongfu Information. | 1 | 10 | 25 | 15 | 20 | 70 |
| Please provide an analysis of Daoshi Technology. | 1 | 10 | 30 | 15 | 20 | 75 |
| Comprehensive analysis of Ruisong Technology. | 1 | 10 | 30 | 15 | 20 | 75 |
| Comprehensive analysis of Zhongyi Technology. | 0 | 10 | 30 | 15 | 20 | 75 |
| Can you provide a comprehensive evaluation and analysis of Aerospace Hongtu? | 1 | 10 | 30 | 15 | 10 | 65 |
| Please give specific analysis opinions on Tengjing Technology. | 1 | 10 | 30 | 10 | 20 | 70 |
| Comprehensive analysis of Zhenyou Technology. | 1 | 10 | 25 | 15 | 10 | 60 |
| How is the overall situation of Huahai Chengke? | 0 | 10 | 35 | 15 | 20 | 80 |
| Query | Qual | Conc | Cont | Expr | Data | Score |
|---|---|---|---|---|---|---|
| Can you conduct a comprehensive analysis of Xingqiu Graphite? | 1 | 10 | 35 | 15 | 20 | 80 |
| How is the comprehensive analysis of Shanghai Ailu? | 1 | 10 | 30 | 15 | 20 | 75 |
| I want to know the details of Taihe Technology. Can you analyze it for me? | 1 | 10 | 30 | 15 | 20 | 75 |
| Comprehensive analysis of Dagang Holdings. | 1 | 10 | 25 | 15 | 20 | 70 |
| Please analyze Aorui De and provide investment advice. | 1 | 10 | 25 | 15 | 20 | 70 |
| Can you analyze Sunshine Real Estate? | 1 | 10 | 25 | 15 | 20 | 70 |
| Can you conduct a comprehensive analysis of Hongbaoli? | 1 | 10 | 25 | 15 | 20 | 70 |
| Can you analyze Yangzi New Materials for me? | 1 | 10 | 25 | 15 | 20 | 70 |
| How has Chunxing Precision performed recently? Can you analyze it? | 1 | 10 | 35 | 15 | 20 | 80 |
| Can you provide professional analysis on Tuoshan Heavy Industry? | 1 | 10 | 25 | 15 | 20 | 70 |
| I am interested in the analysis of Yayi Technology. Can you share it? | 1 | 10 | 20 | 15 | 20 | 65 |
| What are the key points to watch in Bofei Electric? Can you analyze it? | 1 | 10 | 25 | 15 | 20 | 70 |
| Can you conduct a detailed analysis of Kangliyuan? | 1 | 10 | 25 | 15 | 20 | 70 |
| How comprehensive is the strength of Hope Co., Ltd.? | 1 | 10 | 25 | 15 | 20 | 70 |
| Please conduct a comprehensive analysis of Kuntai Co., Ltd. | 1 | 10 | 25 | 15 | 20 | 70 |
| Can you provide comprehensive feedback on Taimusi? | 1 | 10 | 25 | 15 | 20 | 70 |
| What do you think about Hongming Co., Ltd.? | 1 | 10 | 25 | 15 | 20 | 70 |
| Can you look at Wuzhou Medical for me? | 1 | 10 | 25 | 15 | 20 | 70 |
| How is Zhejiang Liming recently? | 1 | 10 | 25 | 15 | 20 | 70 |
| Please analyze Baolijia, is it good? | 1 | 10 | 25 | 13 | 15 | 63 |
| Can you analyze Lvlian Technology? | 1 | 10 | 25 | 13 | 15 | 63 |
| Is Shanghai Hejing worth buying? | 1 | 10 | 25 | 13 | 20 | 68 |
| What do you think of Qiaoyuan Co., Ltd.? | 1 | 10 | 25 | 15 | 20 | 70 |
| How about Zhongji Huanke? | 1 | 10 | 25 | 15 | 20 | 70 |
| Can you talk about Kangguan Technology stock? | 1 | 10 | 25 | 15 | 20 | 70 |
| Tell me about Guanghe Technology. | 1 | 10 | 25 | 15 | 20 | 70 |
| Is Xingchen Technology doing well recently? | 1 | 10 | 25 | 15 | 20 | 70 |
| Please interpret Chengdu Huawei stock. | 1 | 10 | 25 | 15 | 20 | 70 |
| How about Jinjiang Shipping? | 1 | 10 | 30 | 15 | 20 | 75 |
| What about Jinhui Co., Ltd.? | 1 | 10 | 25 | 15 | 20 | 70 |
| Can you provide an investment analysis of Dazhu CNC? | 1 | 10 | 25 | 15 | 20 | 70 |
| Is Laplace stock good? | 1 | 5 | 20 | 15 | 15 | 55 |
| What do you think of Shennong Group stock? | 1 | 10 | 30 | 15 | 20 | 75 |
| Query | Qual | Conc | Cont | Expr | Data | Score |
|---|---|---|---|---|---|---|
| Comprehensive analysis of Shichuang Energy. | 1 | 10 | 25 | 15 | 20 | 70 |
| Comprehensive analysis of Ningbo Ocean. | 1 | 10 | 25 | 15 | 20 | 70 |
| Comprehensive analysis of Longqi Technology. | 1 | 10 | 25 | 15 | 20 | 70 |
| Please evaluate Fuerjia Co., Ltd. as a whole. | 1 | 10 | 25 | 15 | 20 | 70 |
| Can you provide an overall evaluation of Yongxing Co., Ltd.? | 1 | 10 | 25 | 15 | 20 | 70 |
| Comprehensive analysis of Hekeda Co., Ltd. | 1 | 10 | 25 | 15 | 20 | 70 |
| Comprehensive analysis of Craftsman Home. | 1 | 10 | 25 | 15 | 20 | 70 |
| Comprehensive analysis of International Composite Materials. | 1 | 10 | 25 | 15 | 20 | 70 |
| Please diagnose and analyze Suzhou Tianmai. | 0 | 10 | 20 | 15 | 15 | 60 |
| Can you diagnose the stock status of Weidian Physiology? | 0 | 10 | 25 | 15 | 20 | 70 |
| Please diagnose Weidao Nano. | 1 | 10 | 25 | 15 | 20 | 70 |
| Can you diagnose stock 6912? | 0 | 10 | 20 | 15 | 15 | 60 |
| How is Hualan Vaccine stock? | 1 | 10 | 25 | 15 | 20 | 70 |
| Please diagnose Mousse Co., Ltd.’s stock comprehensively. | 1 | 10 | 25 | 15 | 20 | 70 |
| Can you conduct an in-depth analysis of Huabao New Energy stock? | 1 | 10 | 25 | 15 | 20 | 70 |
| Please diagnose Haikan Co., Ltd.’s stock. | 1 | 10 | 25 | 15 | 20 | 70 |
| Can you provide a professional analysis of Hongsheng Huayuan? | 1 | 10 | 25 | 15 | 20 | 70 |
| Please diagnose China Eastern Airlines. | 1 | 10 | 30 | 15 | 20 | 75 |
| Can you analyze the stock of Huali Group in detail? | 1 | 10 | 25 | 15 | 20 | 70 |
| Please analyze Postal Savings Bank. | 1 | 10 | 25 | 15 | 20 | 70 |
| How to analyze the market trend of ICBC? | 1 | 10 | 30 | 15 | 20 | 75 |
| How about Guizhou Moutai stock? | 1 | 10 | 30 | 15 | 20 | 75 |
| Please analyze Agricultural Bank of China stock. | 1 | 10 | 25 | 15 | 20 | 70 |
| Can you analyze China Construction Bank in detail? | 1 | 10 | 30 | 15 | 20 | 75 |
| China Petroleum, diagnose it. | 1 | 10 | 30 | 15 | 20 | 75 |
| Can you conduct a comprehensive analysis of China Mobile? | 0 | 10 | 25 | 15 | 20 | 70 |
| Is China Bank suitable for long-term holding? | 1 | 10 | 30 | 15 | 20 | 75 |
| Please analyze China Life Insurance stock. | 1 | 10 | 30 | 15 | 20 | 75 |
| Please research Ningde Times stock. | 1 | 10 | 30 | 15 | 20 | 75 |
| Please analyze Zhaosheng Micro stock. | 1 | 10 | 25 | 15 | 20 | 70 |
| Please analyze Xinda Securities stock. | 1 | 10 | 25 | 15 | 20 | 70 |
| Analyze BAIC Blue Valley. | 1 | 10 | 33 | 15 | 20 | 78 |
| How to view COSCO Energy stock? | 1 | 10 | 25 | 15 | 20 | 70 |
| Analyze Kelun Pharmaceutical stock. | 1 | 10 | 25 | 15 | 20 | 70 |
| Can you conduct a comprehensive diagnosis of New Industries stock? | 1 | 10 | 30 | 15 | 20 | 75 |
| Comprehensive analysis of Shengyi Technology. | 1 | 10 | 25 | 15 | 20 | 70 |