REBELS-IFU: Dust Build-up in Massive Galaxies at Redshift 7
Abstract
In recent years, observations with the JWST have started to map out the rapid metal enrichment of the early Universe, while (sub)millimeter observations have simultaneously begun to reveal the ubiquity of dust beyond . However, the pathways that led to the assembly of early dust reservoirs remain poorly quantified, and require pushing our understanding of key scaling relations between dust, gas and metals into the early Universe. We investigate the dust build-up in twelve galaxies drawn from the REBELS survey that benefit from (i) JWST/NIRSpec strong-line metallicity measurements, (ii) ALMA [C ii]-based redshifts and gas masses, and (iii) dust masses from single- or multi-band ALMA continuum observations. Combining these measurements, we investigate the dust-to-gas (DtG), dust-to-metal (DtM), and dust-to-stellar mass (DtS) ratios of our sample as a function of metallicity. While our analysis is limited by systematic uncertainties related to the [C ii]-to-H2 conversion factor and dust temperature, we explore a wide range of possible values, and carefully assess their impact on our results. Under a fiducial set of assumptions, we find an average , only slightly below that of local metal-rich galaxies. On the other hand, at fixed metallicity our average is significantly larger than that of low-redshift galaxies. Finally, through a comparison to various theoretical models of high-redshift dust production, we find that assembling the dust reservoirs in massive galaxies at likely requires the combination of rapid supernova enrichment and efficient ISM dust growth.
keywords:
galaxies: evolution – galaxies: high-redshift – submillimeter: galaxies1 Introduction
In recent years, the Atacama Large Millimeter/submillimeter Array (ALMA) has revealed the widespread presence of massive dust reservoirs in galaxies in the Epoch of Reionization (EoR; e.g., Riechers et al. 2013; Watson et al. 2015; Bowler et al. 2018, 2022, 2024; Marrone et al. 2018; Zavala et al. 2018; Hashimoto et al. 2019; Tamura et al. 2019, 2023; Harikane et al. 2020; Bakx et al. 2021, 2024; Fudamoto et al. 2021; Sugahara et al. 2021; Akins et al. 2022; Inami et al. 2022; Schouws et al. 2022; Witstok et al. 2022, 2023; Algera et al. 2023, 2024a, 2024b; Decarli et al. 2023; Hygate et al. 2023; Tripodi et al. 2023, 2024; Mitsuhashi et al. 2024; Valentino et al. 2024; van Leeuwen et al. 2024).111The exact timeline of reionization has not yet been fully mapped out, but the latest observational estimates place its endpoint at (e.g., Bosman et al. 2022; Spina et al. 2024). In this work, however, we simply refer to the EoR as , when reionization was mostly complete. In particular, ALMA has unambiguously revealed the presence of dust as early as , corresponding to just Gyr after the Big Bang (Tamura et al., 2019, 2023; Bakx et al., 2020). At even earlier cosmic epochs, the James Webb Space Telescope (JWST) has indirectly inferred the presence of dust through its effect on the observed photometry and spectra of distant galaxies, suggesting modest levels of dust attenuation in some UV-luminous galaxies even at (e.g., Cullen et al. 2023; Boyett et al. 2024; Carniani et al. 2024a; Ferrara et al. 2024).
These observations suggest early galaxies undergo rapid chemical enrichment, followed by a similarly swift build-up of dust. Several studies have attempted to quantify the dust masses () of high-redshift galaxies through multi-band ALMA observations, resulting in dust masses as high as by (Hashimoto et al., 2019; Bakx et al., 2021; Akins et al., 2022; Witstok et al., 2022, 2023; Algera et al., 2024a). For larger galaxy samples, dust masses have been estimated based on a single-band ALMA detection, which requires the assumption of an underlying dust spectral energy distribution – in particular the dust temperature (; e.g., Sommovigo et al. 2022a, b). While more uncertain, these single-band ALMA studies infer comparable dust masses to works benefiting from multi-band ALMA photometry (e.g., Ferrara et al. 2022; Schouws et al. 2022; Sommovigo et al. 2022a).
To quantify the dust enrichment of distant galaxies, inferred dust masses are generally compared to galaxy stellar masses, suggesting typical ratios of (Witstok et al., 2023; Algera et al., 2024a). Supernovae (SNe) have long been considered the main dust producers at high redshift (e.g, Todini & Ferrara 2001), owing to the short timescales on which they can begin to enrich the interstellar medium (ISM). As such, this dust-to-stellar mass ratio is often converted into an effective SN dust yield , under the assumption of some initial mass function (IMF; e.g., Michałowski 2015; Leśniewska & Michałowski 2019). Given a fiducial Chabrier (2003) IMF, a ratio of corresponds to a dust yield of approximately .
Observationally, SN yields have been estimated in the local Universe, suggesting a wide range of values (see e.g., Sarangi et al. 2018 and Schneider & Maiolino 2024 for reviews). However, these yields are plagued by the unknown level of dust destruction due to the SN reverse shock (e.g., Bianchi & Schneider 2007; Gall & Hjorth 2018; Micelotta et al. 2018; Kirchschlager et al. 2019), which could range anywhere from a few to nearly a hundred per cent (e.g., Nozawa et al. 2007; Martínez-González et al. 2019; Slavin et al. 2020; Kirchschlager et al. 2023). In an attempt to circumvent this uncertainty, Galliano et al. (2021) perform an extensive study of the combined dust, gas and metal contents of galaxies, and empirically determine the effective SN yield post-reverse-shock destruction, suggesting . If this low yield is also typical for high-redshift galaxies, SNe alone are likely insufficient to account for all the observed dust in the early Universe (e.g., Michałowski 2015; Leśniewska & Michałowski 2019; Algera et al. 2024b). However, utilizing a different local galaxy sample and modeling approach, De Looze et al. (2020) infer significantly higher SN yields, highlighting that such empirical approaches remain limited by degeneracies between the various dust production and destruction processes (see also Calura et al. 2023; Park et al. 2024).
If SNe are indeed not sufficient to produce all the observed early dust, additional mechanisms must be at play. In the low-redshift Universe, Asymptotic Giant Branch (AGB) stars are known to be important sources of dust (e.g., Valiante et al. 2009). The most massive AGB stars have lifetimes as short as Myr (e.g., Dell’Agli et al. 2019), which may be shorter than the average ages of massive galaxies at (Whitler et al., 2023). Regardless, given their long typical timescales, the contribution of AGB stars to global dust production is generally assumed to be subdominant at (Mancini et al., 2015; Leśniewska & Michałowski, 2019; Dayal et al., 2022). Similarly, other more ‘exotic’ methods of dust production, such as Wolf-Rayet stars or quasar winds, are too believed to be unimportant at these early times (Schneider & Maiolino, 2024).
Instead, dust growth through metal accretion in the ISM is a more likely production pathway competing with SNe as the dominant mechanism of dust build-up at high redshift. This process requires some prior dust and metal enrichment – likely from the aforementioned SNe – after which gas-phase metals can deplete onto existing dust grains thereby increasing the total dust mass (e.g., Hirashita 2012). ISM dust growth is known to be particularly efficient in dense media (e.g., Weingartner & Draine 1999; Asano et al. 2013; Roman-Duval et al. 2014; Zhukovska et al. 2016), and given that high-redshift galaxies appear significantly denser than local galaxies (e.g., Isobe et al. 2023; Ono et al. 2023), it could be an efficient dust production pathway in the early Universe. On the other hand, the strong radiation fields and turbulence at high redshift may also limit the effectiveness of dust growth in the ISM and enhance dust destruction processes (e.g., Hirashita & Yan 2009; Ferrara et al. 2016).
From a theoretical perspective, various (semi-)analytical models and hydrodynamical simulations of high-redshift galaxies are now equipped with a framework tracking the production and destruction of dust (e.g., McKinnon et al. 2016, 2017; Popping et al. 2017; Li et al. 2019; Vijayan et al. 2019; Graziani et al. 2020; Triani et al. 2020; Dayal et al. 2022; Esmerian & Gnedin 2022, 2024; Parente et al. 2022; Di Cesare et al. 2023; Lewis et al. 2023; Lower et al. 2023, 2024; Mauerhofer & Dayal 2023; Choban et al. 2024a; Garaldi et al. 2024; Matsumoto et al. 2024; Narayanan et al. 2024; Nikopoulos & Dayal 2024; Palla et al. 2024; Sawant et al. 2024). These models and simulations thus predict the dust enrichment of the Universe both across time, and as a function of galaxy parameters, such as metallicity and stellar mass. Nevertheless, some of the key parameters characterizing dust growth, such as the SN yield or ISM growth timescale, are essentially unconstrained and often highly degenerate parameters in these dust production frameworks, and various combinations that match the limited number of observations available at early cosmic epochs can be devised (e.g., Esmerian & Gnedin 2024; Palla et al. 2024). As such, testing their various predictions requires observations that target new regions of the parameter space, for example by extending observations to galaxies of lower dust and stellar masses (e.g., Valentino et al. 2024), and by tying in information of galaxy metallicities (e.g., Heintz et al. 2023b).
With the advent of the JWST it has now become possible to measure the gas-phase metallicities of large samples of distant galaxies (e.g., Heintz et al. 2023a; Nakajima et al. 2023; Chemerynska et al. 2024; Curti et al. 2024; Sanders et al. 2024; Shapley et al. 2024). At the same time, the number of galaxies in the Epoch of Reionization with ALMA-based dust mass measurements continues to increase (e.g., Bakx et al. 2021; Witstok et al. 2022; Algera et al. 2024a). Comparing the dust contents of galaxies at various metallicities is crucial to understand the overall production pathways of dust, given that different mechanisms have a different metallicity-dependence. For example, the dust-to-gas ratio depends roughly linearly on metallicity for SN dust production, but increases more rapidly in metal-rich galaxies when dust growth in the ISM is included (e.g., Asano et al. 2013; Rémy-Ruyer et al. 2014; Zhukovska 2014; Galliano et al. 2021).
By constraining scaling relations between dust, gas and metals at high redshift, we may therefore begin to disentangle the various dust production avenues in the early Universe. In the pre-JWST era, such studies have been carried out up to Cosmic Noon (; e.g., Shapley et al. 2020; Popping et al. 2023). While limited to small samples and high metallicities (), these works suggest the scaling relation between dust-to-gas ratio and metallicity to be consistent with the local relation. Moreover, studies of Damped Lyman- Absorbers (DLAs) are able to probe the dust-to-gas vs. metallicity relation out to (e.g., De Cia et al. 2016; Péroux & Howk 2020), and also find agreement with the local trends, at least at the high metallicity end. With the JWST, direct studies of the dust, gas and metal contents of galaxies are now possible all the way into the Epoch of Reionization (e.g., Heintz et al. 2023b; Fujimoto et al. 2024b; Valentino et al. 2024), and can begin to constrain these fundamental scaling relations at even earlier times, where dust has had significantly less time to assemble. To date, however, the number of reionization-era galaxies benefiting from both JWST/NIRSpec spectroscopy and ALMA observations of their dust and gas contents remains severely limited, which has thus far prevented any statistical insights into dust production pathways in the Universe.
To address this limitation, we investigate the joint dust and metal contents of 12 galaxies drawn from the ALMA Reionization Era Bright Emission Line Survey (REBELS; Bouwens et al. 2022) that benefit from new JWST/NIRSpec spectroscopy, in order to shed light on the dust build-up in massive galaxies in the EoR. In Section 2, we introduce the ALMA and JWST observations of our sample, and in Section 3 we discuss how their dust and metal contents are inferred. We present our results in Section 4, and subsequently discuss them in the context of high-redshift dust production in Section 5, before concluding in Section 6. Throughout this work, we assume a standard CDM cosmology, with , and . We further adopt a Chabrier (2003) IMF.
2 Data
| REBELS ID | |||||||||
|---|---|---|---|---|---|---|---|---|---|
| (1) | (2) | (3) | (4) | (5) | (6) | (7) | (8) | (9) | (10) |
| REBELS-05 | |||||||||
| REBELS-08 | |||||||||
| REBELS-12 | |||||||||
| REBELS-14 | |||||||||
| REBELS-15 | |||||||||
| REBELS-18 | |||||||||
| REBELS-25† | |||||||||
| REBELS-29 | |||||||||
| REBELS-32 | |||||||||
| REBELS-34 | |||||||||
| REBELS-38† | |||||||||
| REBELS-39 |
Notes: Col. (1): Galaxy identifier. Col. (2): [C ii] 158 -based spectroscopic redshifts from S. Schouws et al. (in prep). Col. (3): [C ii] luminosities from S. Schouws et al. (in prep). Col. (4): Metallicities, expressed as oxygen abundances, from L. Rowland et al. (in prep). Col. (5) Stellar masses from M. Stefanon et al. (in prep). Col. (6): Dust masses. Col. (7): [C ii]-based molecular gas masses, assuming the Zanella et al. (2018) conversion. Col. (8): dust-to-gas ratio. Col. (9): dust-to-metal ratio. Col. (10): dust-to-stellar mass ratio. Dust masses obtained from multi-band ALMA photometry (Algera et al., 2024a, b).
2.1 ALMA data
Our sample consists of 12 galaxies drawn from the Cycle 7 ALMA Large Program REBELS, described in detail in Bouwens et al. (2022). REBELS – following the approach of its successful pilot studies (Smit et al., 2018; Schouws et al., 2022, 2023) – carried out ALMA spectral scans targeting the [C ii] 158 line and underlying dust continuum emission in 36 UV-luminous galaxies with photometric redshifts .222An additional four galaxies were targeted in [O iii] 88 and underlying continuum emission, although none were detected in [O iii]; see Bouwens et al. (2022) and Van Leeuwen et al. (in preparation). In total, 25 galaxies were detected in [C ii] emission (Schouws et al. in preparation), of which 15 were also detected in dust continuum (Inami et al., 2022). For details on the calibration and imaging, we refer the reader to Bouwens et al. (2022) and Inami et al. (2022).
In this work, we focus on the 12 [C ii]-detected REBELS galaxies with follow-up JWST/NIRSpec Integral Field Unit (IFU) spectroscopy, hereafter referred to as the ‘REBELS-IFU’ sample (see below). These galaxies have spectroscopic redshifts in the range , and have [C ii] luminosities between (Table 1). Moreover, 10/12 galaxies are detected in ALMA Band 6 continuum emission, probing rest-frame (Inami et al., 2022). For the remaining two galaxies, we adopt upper limits on their continuum emission, where is the root-mean-square (rms) noise in the naturally-weighted Band 6 continuum image.333One of these two galaxies is REBELS-34, for which Bowler et al. (2022) obtain a continuum detection using more sensitive ALMA observations (REBELS-34 is known as ID 169850 in their work). However, we here focus on the continuum observations taken as part of REBELS, following e.g., Inami et al. (2022) and Bouwens et al. (2022); our upper limit is fully consistent with the faint continuum detection in Bowler et al. (2022).
2.2 JWST data
Twelve of the most [C ii]-luminous REBELS galaxies were followed up in a Cycle 1 JWST program (GO 1626 [PI Stefanon] targeted 11/12 galaxies, while REBELS-18 was observed as part of GO 2659 [PI Weaver]). These observations made use of low-resolution () JWST/NIRSpec IFU prism spectroscopy, covering a area on the sky across a wavelength range of . This setup ensures coverage of many of the key rest-frame UV and optical emission lines, such as Lyman-, the [OII]3727,29 doublet, H and the [OIII]4959,5007 lines. For the 8/12 sources at , we moreover cover the H line, while at higher redshift this line moves out of the NIRSpec wavelength range. Details on the NIRSpec data reduction, emission line extraction, and metallicity measurements are presented in papers accompanying this work (Stefanon et al. in preparation and Rowland et al. in preparation), while we provide a brief summary in Section 3.4.
3 Methods
3.1 Dust mass measurements
Among the ten dust continuum-detected galaxies in the REBELS-IFU sample, two have been detected in more than one ALMA band: REBELS-25 has been targeted in six unique bands, and as such has a well-constrained dust mass, temperature and emissivity index (; Algera et al. 2024b). REBELS-38 has been detected in ALMA Bands 6 and 8, enabling a dual-band dust mass measurement (Algera et al., 2024a). While REBELS-12 was also followed up in Band 8, it was not detected, and the data were of insufficient depth to facilitate a robust dust mass measurement (Algera et al., 2024a). This thus leaves eight dust-detected galaxies for which only a single-band dust mass measurement is available.
Dust masses for the continuum-detected REBELS galaxies have previously been determined by Sommovigo et al. (2022a, b), leveraging the [C ii]-based method introduced in Sommovigo et al. (2021). Briefly, this method adopts [C ii] as both a gas and a star formation rate (SFR) tracer, and assumes a priori that the dust-to-gas ratio depends linearly on metallicity. Combined with a single-band continuum detection, these assumptions enable an estimate of the dust mass.
Because of the implicit assumption on the metallicity-dependence of the dust-to-gas ratio, however, we opt not to use the Sommovigo et al. (2022a) dust masses in this work, as this is one of the scaling relations that we are interested in constraining directly. Instead, we assume a fixed dust temperature of K for the 10 galaxies where we have only a single-band ALMA detection, or no continuum detection at all (REBELS-15, REBELS-34). In the dust mass determination, we furthermore adopt a fixed emissivity index () and opacity coefficient ( at ), following e.g., Ferrara et al. (2022). Algera et al. (2024a, b) adopted the same dust model in their analysis of the two sources with multi-band ALMA continuum detections, REBELS-25 and REBELS-38, and we therefore adopt their measurements of the dust temperature and mass for these two galaxies directly.
Focusing on the 8 single-band dust-detected galaxies in common between the REBELS-IFU and Sommovigo et al. (2022a) samples, we find good agreement between our dust masses with a mean offset of , where the error represents the standard deviation. This is unsurprising, as the mean dust temperature of the 13 sources analyzed in Sommovigo et al. (2022a) is , very similar to the value adopted in this work. We discuss the effect of our assumed dust temperature in further detail in Section 3.5.
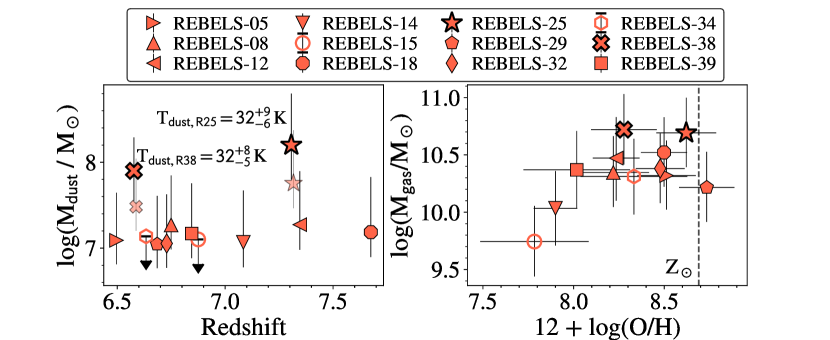
We show the range of dust masses spanned by our sample, , as a function of redshift in the left panel of Fig. 1. We note that, except for the two sources with multi-band ALMA detections, the dust masses of the continuum-detected sample span a relatively narrow range of . This is partially because the two sources with multi-band ALMA follow-up are the most luminous among the REBELS sample at rest-frame , suggesting a high dust content, but mostly because we infer a lower dust temperature for them compared to what we assume for the rest of the sample (see Section 3.5). Had we assumed the same for REBELS-25 and REBELS-38, their estimated dust masses would be lower by (semi-transparent symbols in Fig. 1), although still consistent with the multi-band measurements within the uncertainties.
3.2 Gas mass measurements
To investigate the pathways of early dust build-up, the dust-to-gas (DtG) and dust-to-metal (DtM) ratios are particularly important quantities. We note that these are related via , where is the total mass of gas-phase metals. Crucially, these quantities require knowledge of the total gas mass, . This, in turn, is a combination of molecular and atomic gas (). Atomic gas is notoriously difficult to measure in the early Universe, and we therefore neglect it in our analysis.444We note, however, that the JWST has enabled studies of Lyman- damping wing absorption beyond which provides information on atomic hydrogen along the line-of-sight (see e.g., Curtis-Lake et al. 2023; Heintz et al. 2024; Umeda et al. 2024). We justify this assumption in Section 3.5.
To infer molecular gas masses at lower redshifts, CO or [CI] are typically used as tracers (e.g., Hagimoto et al. 2023; Frias Castillo et al. 2024). However, these lines are too faint to be detected in all but the brightest galaxies and quasars in the Epoch of Reionization (e.g., Strandet et al. 2017; Ono et al. 2022; Decarli et al. 2022; Hashimoto et al. 2023; Kaasinen et al. 2024). Moreover, even if sufficiently bright, generally only the higher rotational transitions of CO are available. These higher-J lines typically do not trace the full, cold molecular gas reservoir, but instead a denser, warmer component (e.g., Vallini et al. 2018).
To homogeneously estimate the gas masses of our sample, we therefore adopt the [C ii] line as a tracer. In particular, we follow the work by Aravena et al. (2024), who previously investigated the molecular gas masses of REBELS galaxies, by adopting the conversion proposed by Zanella et al. (2018). Zanella et al. obtained a relation between [C ii] luminosity and molecular gas mass across a heterogeneous sample of local and intermediate-redshift () main-sequence galaxies and starbursts. We reproduce their relation here for reference:
| (1) |
Since this [C ii]-to-H2 relation is nearly linear, we follow Zanella et al. (2018) by expressing it as a mass-to-light ratio, evaluating the expression at the median luminosity of the REBELS-IFU sample, . This results in .
We propagate the uncertainty on the [C ii]-to-H2 conversion throughout our analysis, resulting in typical uncertainties on of (Table 1). We note that – despite being adopted in numerous high-redshift studies (e.g., Dessauges-Zavadsky et al. 2020; Béthermin et al. 2023; Aravena et al. 2024) – the [C ii]-to-H2 conversion factor is poorly constrained, and we discuss this further in Section 3.5 (see also Casavecchia et al. 2024 for a recent discussion).
We show the inferred molecular gas masses of our sample in Fig. 1 (right panel), as a function of their rest-frame optical metallicity (Section 3.4). Our targets span roughly in molecular gas mass, ranging from . However, most sources are clustered around , which is due to the parent REBELS sample essentially being [C ii]-selected (see also the discussion in Aravena et al. 2024).
3.3 Stellar mass measurements
Two separate studies derive stellar masses for the REBELS-IFU sample: Stefanon et al. (in preparation) and Fisher et al. (2025). We here adopt the former as fiducial, for consistency with the work on the mass-metallicity relation of REBELS-IFU galaxies by Rowland et al. (in preparation). While both Stefanon et al. and Fisher et al. (2025) adopt a similar approach – summarized below – the key difference is that the latter adopt a flexible dust law in their analysis, while the masses used here adopt a fixed Calzetti et al. (2000) dust attenuation curve. Regardless, Fisher et al. (2025) find that most of the REBELS-IFU sources are consistent with the Calzetti curve, and the two mass measurements are therefore in good overall agreement.
To estimate the stellar masses, Stefanon et al. (in preparation) run Bagpipes (Carnall et al., 2018, 2019) on the extracted IFU spectra using the 2016 version of the Bruzual & Charlot (2003) stellar population models.555Stefanon et al. (in preparation) adopt a Kroupa (2001) IMF, while we follow Michałowski (2015) by adopting a Chabrier (2003) IMF in our analysis of dust-to-stellar mass ratios in Section 5.1. However, stellar masses inferred using these two IMFs agree to within (e.g., Madau & Dickinson 2014), which is well within the observational uncertainties; as such, we do not correct for this. The redshifts of the sources are fixed to the [C ii]-based values, and for the metallicities a Gaussian prior is adopted using the measurement and corresponding uncertainty from Rowland et al. (in preparation) as the mean and standard deviation, respectively. Stefanon et al. provide fits with two distinct star formation histories (SFHs): either a constant SFH plus a single burst, or a non-parametric SFH. For consistency with Rowland et al. (in preparation), we adopt the non-parametric SFH as fiducial in our analysis. If we were to instead adopt the constant + burst SFH, the average stellar mass of our sample would slightly increase, by . However, this has no effect on our conclusions.
In modeling the non-parametric SFH, the formation time of the galaxy is set to , and the SFH is divided into four distinct time bins. The width of the first two bins is fixed, and is defined to capture recent star formation in the galaxy across the last and . The final two bins are equally divided in time back to the formation epoch. To link the different time bins, Stefanon et al. (in preparation) assume a continuity prior following, e.g., Leja et al. (2019) and Tacchella et al. (2022).
The stellar masses of the REBELS-IFU sample are presented in Table 1, and span a range of . We note that in some instances the masses have decreased with respect to the Topping et al. (2022) values that were previously adopted in several REBELS publications (e.g., Sommovigo et al. 2022b; Algera et al. 2023; Aravena et al. 2024). These differences are mainly due to the improved S/N and spectral sampling provided by the NIRSpec observations with respect to previous ground-based and Spitzer/IRAC data, as well as the improved spatial resolution reducing contamination from neighboring sources (see Stefanon et al. in preparation for details).
3.4 Metallicity measurements
Gas-phase metallicities have been measured for our 12 targets by Rowland et al. (in preparation), and we refer to their work for details while summarizing the procedure in the following.666We use metallicity, denoted by , interchangeably with Oxygen abundance [denoted ]. To convert between the two, we adopt solar abundance ratios (Asplund et al., 2009). Briefly, the metallicities are obtained from the , , or line ratios using the strong-line metallicity calibrations from Sanders et al. (2024). However, Rowland et al. show that consistent results are obtained when other calibrations are adopted, such as those from Nakajima et al. (2022).
To measure the gas-phase metallicities of the REBELS-IFU targets, we first extract the 1D spectra from the IFU cubes by summing all pixels showing significant emission (Fig. 1 in Rowland et al. in preparation). The stellar continuum is fitted with a third-order polynomial, and is subsequently subtracted. Following this, various emission lines are fitted, including but not limited to the doublet – unresolved, and therefore fitted with a single Gaussian – H, the doublet – resolved and fitted with two Gaussians – and H. The latter is deblended from the doublet by a triple-Gaussian fit.
For our targets at (8/12), we detect both the H and H lines, and use the resulting Balmer decrement to correct the emission line fluxes for dust attenuation. At higher redshifts, the H line moves out of the NIRSpec coverage, preventing robust dust corrections. While in theory the H/H ratio could be used to apply dust corrections, the H line is blended with both the and lines, and is moreover only detected at low significance (see the discussion in Rowland et al. in preparation). As a result, we do not apply dust corrections to the emission line fluxes for our four targets at . Accordingly, we use a metallicity indicator insensitive to dust attenuation to infer their level of metal enrichment, as detailed below.
To determine the metallicities of the REBELS-IFU sample, we use the calibration where possible, which is generally regarded as the most reliable strong-line indicator given its incorporation of two different ionization states of oxygen (Maiolino & Mannucci, 2019). However, given the significant difference in wavelength between the and doublets, the effects of dust extinction are potentially significant, and we therefore do not apply the diagnostic to sample. Moreover, the relation between and metallicity is double-valued, and shows a maximum around an oxygen abundance of (Sanders et al., 2024). We therefore use the diagnostic to decide whether to use the lower or upper branch of the -metallicity relation (and do the same for the double-valued diagnostic, see below).
We note that three of our sources – REBELS-15, REBELS-34 and REBELS-39 – have (and ) ratios in excess of the maximum value calibrated by Sanders et al. (2024), preventing a metallicity measurement using the diagnostic. This could point towards the presence of an active galactic nucleus (AGN), although Rowland et al. find that this can not be conclusively established based on the inspection of several relevant emission line diagnostics. We therefore adopt the single-valued calibration to infer the metallicities for these three sources. Finally, for the sample, we adopt the calibration, which makes use of two lines that are closely separated in wavelength and thus does not require a dust correction.
Overall, our fiducial metallicity measurements thus use () for 5 (3) galaxies at , and for galaxies at . However, in Appendix A we explore the effects of using only the diagnostic, which is single-valued and available for the full REBELS-IFU sample, albeit also without dust corrections for the sources. For these four galaxies, the diagnostic therefore yields a lower limit on their metallicity. For the five galaxies at for which we use the calibration as fiducial, adopting instead yields oxygen abundances that are, on average, lower. Nevertheless, we find that our overall findings remain consistent with the fiducial analysis, as we will discuss in further detail in the following sections.
We show the fiducial metallicities of our sample in the right panel of Fig. 1. The REBELS targets span a range of (corresponding to ), though all but two of the 12 galaxies have . For reference, the solar metallicity and oxygen abundance are taken to be and , respectively, following Asplund et al. (2009). The uncertainty on the metallicities, obtained from propagating the errors on the relevant emission line fluxes, ranges from dex (Table 1). We note that this uncertainty does not include any systematic errors in the calibrations themselves (e.g., Kewley & Ellison 2008). As such, the derived metallicity for any individual galaxy is likely to be more uncertain than suggested by the formal measurement errors. However, on average the REBELS-IFU galaxies are more metal-rich than the typical galaxy population, irrespective of which metallicity diagnostic is adopted (Section 4.2.1 in Rowland et al. in preparation).
3.5 Error budget
3.5.1 Dust temperatures
Prior to discussing the dust and gas properties of the REBELS-IFU sources in detail, it is worth re-iterating some of the key uncertainties in our analysis. First of all, the dust temperatures of 10/12 of our targets are unknown, and as detailed in Section 3.1, we therefore assume a fixed temperature of . This value is similar to the average dust temperature obtained by Witstok et al. (2023), who determined for a heterogeneous sample of galaxies and quasars with multi-band ALMA photometry. Moreover, our adopted value is similar to the average temperature of obtained by Mitsuhashi et al. (2024) for a sample of UV-luminous galaxies at drawn from the SERENADE survey. The assumed dust temperature of K is, however, slightly higher than what was directly measured for REBELS-25 and REBELS-38 using multi-band dust continuum data (K; Algera et al. 2024a, b).
To account for spread in the dust temperatures of our sample, we therefore assume a fixed error of K on the assumed , and propagate this into our dust mass measurements. We note that upcoming ALMA Band 8 observations of the 8 remaining single-band continuum-detected REBELS-IFU sources will provide more robust dust mass measurements in the future (2024.1.00406.S; PI Algera).
3.5.2 Molecular gas masses
Another systematic source of uncertainty is the conversion from [C ii] luminosity to molecular gas mass, for which we adopt as fiducial (Section 3.2) following Zanella et al. (2018). Different studies, however, have suggested a range of values for . For example, Madden et al. (2020) suggest for a sample of local dwarf galaxies (though see Ramambason et al. (2024), who revise their conversion factor downwards to ).777All quoted values of are interpolated/extrapolated to the mean [C ii] luminosity of the REBELS-IFU sample. Vizgan et al. (2022) investigated the [C ii]-to- conversion factor by post-processing low-mass galaxies drawn from the SIMBA simulations. For these simulated galaxies, which are comparatively faint in [C ii] (), they find an average . However, extrapolating their sub-linear relation to the mean [C ii] luminosity of our sample, we infer . Casavecchia et al. (2024) recently determined a relation between molecular gas mass and [C ii] luminosity for the ColdSIM simulations, for which a similar extrapolation yields at the median redshift and [C ii] luminosity of our sample.
We note that a dynamical measurement of for REBELS-25 by Rowland et al. (2024), based on high-resolution [C ii] imaging, is more or less consistent with all of the prescriptions in the literature. On the other hand, in a study of gravitationally lensed dusty star-forming galaxies at , Rizzo et al. (2021) infer a lower average . Similarly, in a study of quasar host galaxies, Kaasinen et al. (2024) recently found the Zanella et al. (2018) conversion to overestimate CO-based gas masses by a factor of , which thus implies a value of .
Summarizing, the scatter in literature values for the [C ii]-to- conversion factor is thus more than an order of magnitude. We here adopt the Zanella et al. (2018) conversion as fiducial not only for consistency with most previous works, but also because it is roughly the average among the aforementioned values when expressed in logarithmic units.
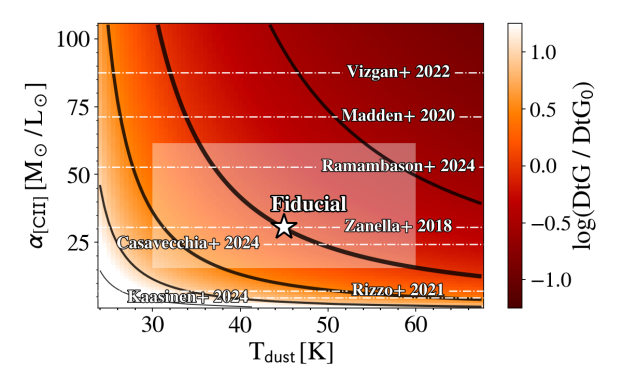
We parameterize the two key uncertainties – and – and their effect on the dust-to-gas ratio in Fig. 2. Compared to our fiducial parameter set of , the inferred DtG ratio increases by dex (decreases by dex) if the true dust temperature is K colder (warmer). Similarly, the inferred DtG ratio decreases by dex (increases by ) if we adopt the extrapolated from Vizgan et al. (2022) (dynamically inferred value by Rizzo et al. 2021), compared to our fiducial value. Based on these considerations, and because source-to-source scatter is expected in both the dust temperature and [C ii]-to-H2 conversion factor, we estimate a typical systematic uncertainty of at least dex on the dust-to-gas and dust-to-metal ratios quoted in the following sections.
3.5.3 Atomic gas
On top of the aforementioned uncertainties, the DtG ratio quoted in studies at generally includes the contribution from atomic (HI) gas. However, this is typically traced through -line observations, which are currently limited to individual unlensed galaxies out to (Fernández et al., 2016; Xi et al., 2024), or to when averaging across galaxy ensembles through stacking (e.g., Chowdhury et al. 2020). Absorption line spectroscopy against bright background sources, such as quasars or gamma-ray bursts, has further been employed to measure the HI contents of individual foreground galaxies out to (see Péroux & Howk 2020 for a review). While benefiting from a more or less unbiased selection, such observations typically probe a more extended HI reservoir not well-traced by [C ii] (Neeleman et al., 2019; Heintz et al., 2022).
Motivated by these difficulties in measuring the atomic gas contents of high-redshift galaxies, Heintz et al. (2021) have suggested [C ii] 158 can additionally be used as a tracer of the HI reservoir in galaxies in the Epoch of Reionization. Applying their metallicity-dependent calibration to our sample, we infer HI gas masses of , with a median value of . Taken at face value, this suggests that our dust-to-gas ratios could be overestimated by a typical dex, due to an underestimation of the total gas mass by an equivalent amount. However, in their chemical and dust evolution framework, Palla et al. (2024) suggest that the Heintz et al. (2021) calibration may be overestimated at the typically high metallicities of the REBELS sample. Moreover, in their analysis of a metal-poor galaxy at , Heintz et al. (2023b) find that the HI mass implied by the Heintz et al. (2021) calibration exceeds the dynamical mass of the system, as traced by [C ii], possibly because the HI reservoir extends to much larger radii. Finally, based on a comparison of [C ii]-based gas masses to the dynamical masses of main-sequence galaxies, Dessauges-Zavadsky et al. (2020) suggest that the gas mass inferred from the Zanella et al. (2018) conversion corresponds to the combined molecular and atomic gas masses, as opposed to just the molecular one.
Taken together, these studies thus suggest that the [C ii]-to-HI calibration may not be fully appropriate for (massive) galaxies in the Epoch of Reionization, and/or that the adopted [C ii]-to-H2 conversion may already trace the full gas reservoir. In light of these uncertainties, we do not directly account for atomic gas in the remainder of our analysis. We note that a minor contribution of HI gas is implicitly accounted for by our previously quoted systematic error of dex. In the future, high-resolution [C ii] observations of REBELS galaxies will enable dynamical constraints on their atomic and molecular gas masses (c.f., the existing dynamical constraints by Rowland et al. 2024 for REBELS-25; see also Phillips et al. in preparation).
4 Results
4.1 Gas fractions
We start by investigating the gas fractions [)] of our sample as a function of metallicity in Fig. 3. This comparison serves two purposes: first of all, galaxies are expected to trace out an evolutionary pathway in this parameter space, with the formal starting point being a gas fraction of unity and zero metallicity (e.g., Tinsley 1980; Finlator & Davé 2008). As they evolve, galaxies move along a path shaped by star formation – which reduces their gas fractions and increases their metallicities – as well as by (primordial) gas inflows and (metal-enriched) outflows. For a given metallicity, the gas fraction is maximized in a simple model without in- and outflows known as the closed box model. In addition to providing insight into the evolutionary pathways of our sample, the - metallicity diagram also provides a useful practical check on the accuracy of our gas mass and stellar mass measurements, as a combination of both a high and high metallicity is unphysical – this would suggest that the gas mass or metallicity is overestimated, the stellar mass is underestimated, or a combination of the above.
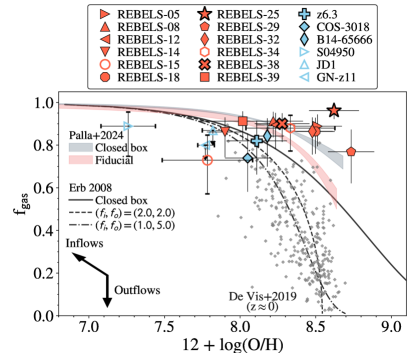
Figure 3 shows that the REBELS-IFU galaxies are characterized by high gas fractions of , with a mean value of where the error represents the standard deviation among the sample. These values are broadly consistent with the handful of galaxies with [C ii] and metallicity measurements in the literature (see Appendix B for details), although the REBELS-IFU sample is on average more metal-enriched.
We compare the gas fractions of the REBELS-IFU and literature galaxies to the chemical evolutionary tracks from Palla et al. (2024), who use the non-parametric SFHs derived for three REBELS galaxies (REBELS-15, REBELS-25 and REBELS-29) as an input to investigate their dust and metal build-up (labeled ‘fiducial’ in Figure 3).888Note that these SFHs, taken from Topping et al. (2022), predate the JWST observations of the REBELS sample. Updated SFHs of the full REBELS-IFU sample will be presented in Stefanon et al. (in preparation). Moreover, we include a re-run of the Palla et al. (2024) models without in- and outflows, i.e., a closed box model.
We furthermore compare to the Erb (2008) evolutionary tracks in Figure 3. Their simple analytical prescription adopts inflow and outflows rates that are proportional to the SFR by a factor and , respectively. Comparing the Palla et al. (2024) and Erb (2008) closed box models, the latter predict lower gas fractions at a fixed metallicity. This is primarily because of the different stellar yields adopted: while Erb (2008) adopt a fixed metal yield of per unit of formed stellar mass, Palla et al. (2024) use yields specific for low-intermediate mass stars and core-collapse SNe (see also Spitoni et al. 2017).
Regardless of the precise assumptions regarding stellar yields and outflows, the Erb (2008) and Palla et al. (2024) models predict similar global trends: unsurprisingly, as galaxies become more enriched, their gas fractions decrease. Interestingly, this prediction is not mirrored by the REBELS-IFU and literature samples. At low metallicities, both REBELS-15 and several literature galaxies such as COS-3018, JD1 and GN-z11 appear to have low gas fractions, while some of the most metal-rich sources seemingly have a high . In particular, some of the most metal-rich REBELS-IFU galaxies have gas fractions in excess of even the closed box model predictions, which should constitute a stringent upper limit. Barring some contrived scenario involving metal-rich inflows and/or metal-poor outflows, this suggests that the gas masses and/or metallicities of (some of) the REBELS-IFU sources may be overestimated, or that their stellar masses are underestimated. We discuss this in the following subsections.
4.1.1 Underestimated stellar masses?
One potential avenue of resolving the seemingly unphysical combination of high metallicities and gas fractions, is if the stellar masses of the REBELS-IFU sources are underestimated (i.e., their gas fractions are overestimated). However, for only one of our targets do we have evidence that this may be the case: the source with most strongly in excess of the closed box models is the well-studied galaxy REBELS-25 (Hygate et al. 2023; Algera et al. 2024b; Rowland et al. 2024). This source benefits from a dynamical mass measurement (Rowland et al. 2024), and the dynamically inferred suggests the gas mass is unlikely to be significantly overestimated using the Zanella et al. (2018) prescription, unless REBELS-25 is strongly dark-matter-dominated. Instead, several pieces of evidence suggest its stellar mass may be underestimated. First of all, REBELS-25 shows a peculiar morphology, with an IR-luminous, centrally-peaked dust distribution, surrounded by three UV-luminous clumps (Hygate et al. 2023; Rowland et al. 2024). This makes it plausible that its stellar mass is underestimated due to outshining by these UV-bright regions (c.f., Giménez-Arteaga et al. 2024). An underestimated stellar mass is independently supported by the high dust mass measured for REBELS-25 by Algera et al. (2024b), which suggests a dust-to-stellar mass ratio of , in strong tension with models of dust production (see the discussion in Algera et al. 2024b, and Section 5.2).
On the other hand, none of the other REBELS-IFU sources show such a striking offset between their UV and dust emission, suggesting that REBELS-25 may be unique in this regard (although high-resolution ALMA observations of the full sample are required to verify this). In addition, recent works at slightly lower redshift () have shown that the effects of outshining are limited at relatively high stellar masses [], based on a comparison of spatially-resolved and integrated SED modeling (Li et al., 2024; Lines et al., 2024). As these studies span a similar mass range as the galaxies in our work, this suggests outshining not to be a major issue for the REBELS-IFU sample as a whole.
While the above discussion indicates that our analysis is unlikely to be significantly affected by the fact that we rely on integrated rather than resolved photometry, the magnitude of outshining can also depend on the assumed star formation history (e.g., Leja et al. 2017, 2019). For example, Topping et al. (2022) compared the stellar masses obtained for the REBELS sample by fitting constant and non-parametric SFHs to their integrated (pre-JWST) photometry. They find that the non-parametric SFH yields consistently higher masses, by an average of . In our analysis, however, we already rely on non-parametric stellar masses in an attempt to circumvent this issue. This makes it unlikely that our stellar masses are currently significantly underestimated, although we note the possibility that deeper IFU observations could reveal a faint, older stellar population beyond the current surface brightness limits of our data.
In a future work, we will employ spatially-resolved SED-fitting on the REBELS-IFU sample to enable a detailed comparison between resolved and unresolved stellar mass measurements. In addition, future observations using JWST/MIRI would also enable a more accurate stellar mass determination for our targets (c.f., Wang et al. 2024). For now, however, we proceed with the fiducial stellar mass measurements from Stefanon et al. (in preparation), as presented in Table 1. We moreover emphasize that the core of our analysis focuses on the dust-to-gas and dust-to-metal ratios of the REBELS-IFU sample, and hence does not rely on stellar mass estimates.
4.1.2 Overestimated metallicities?
The high of the metal-rich REBELS-IFU sources could also be the result of their metallicities being overestimated. Indeed, Rowland et al. (in preparation) find that the average metallicity of the REBELS-IFU galaxies decreases slightly when the diagnostic is adopted for the full sample (see also Appendix A). Such lower metallicities would reduce the tension with the models somewhat, although would not resolve it completely. Moreover, it would not significantly affect the galaxies with low fiducial metallicity measurements; these would still appear gas-poor with respect to the Palla et al. (2024) models. Observations of auroral lines such as (e.g., Curti et al. 2023; Heintz et al. 2023b) would provide more robust metallicity estimates, and would enable investigating whether the current strong-line metallicities are indeed being overestimated.
4.1.3 Overestimated gas masses?
Finally, it is possible – and perhaps most likely – that the gas masses of the REBELS-IFU sample are overestimated. We extensively discussed the effect of on our analysis in Section 3.5, and recall that it shows over an order of magnitude of scatter in the literature. One way of reconciling the REBELS-IFU + literature sources with the expected -metallicity relation, is to suppose varies with metallicity. This would not be too far-fetched: studies of local dwarf galaxies find relatively large values of (e.g., Madden et al. 2020; Ramambason et al. 2024), although within their limited dynamic range they do not find any clear trends with metallicity. On the other hand, dynamical studies of dusty star-forming galaxies and high- quasars – likely metal-rich populations – find significantly lower values (e.g., Rizzo et al. 2021; Kaasinen et al. 2024). However, direct evidence for a metallicity-dependent is currently lacking, and we therefore proceed with our fiducial gas mass measurements assuming the Zanella et al. (2018) conversion for the entire sample. We emphasize that if the gas masses of our metal-rich sample are currently overestimated, our dust-to-gas and dust-to-metal ratios would instead be underestimated; higher DtG and DtM ratios would further reinforce our conclusions in Section 5 that dust build-up in the REBELS-IFU sample proceeds in a highly efficient manner.
With these caveats mind, we prefer not to over-interpret the possibly inverted trend between and metallicity with respect to the models. We therefore proceed with our fiducial stellar and gas masses and metallicities, and use these to investigate key scaling relations between dust, gas and metals in the next section.
4.2 Dust scaling relations
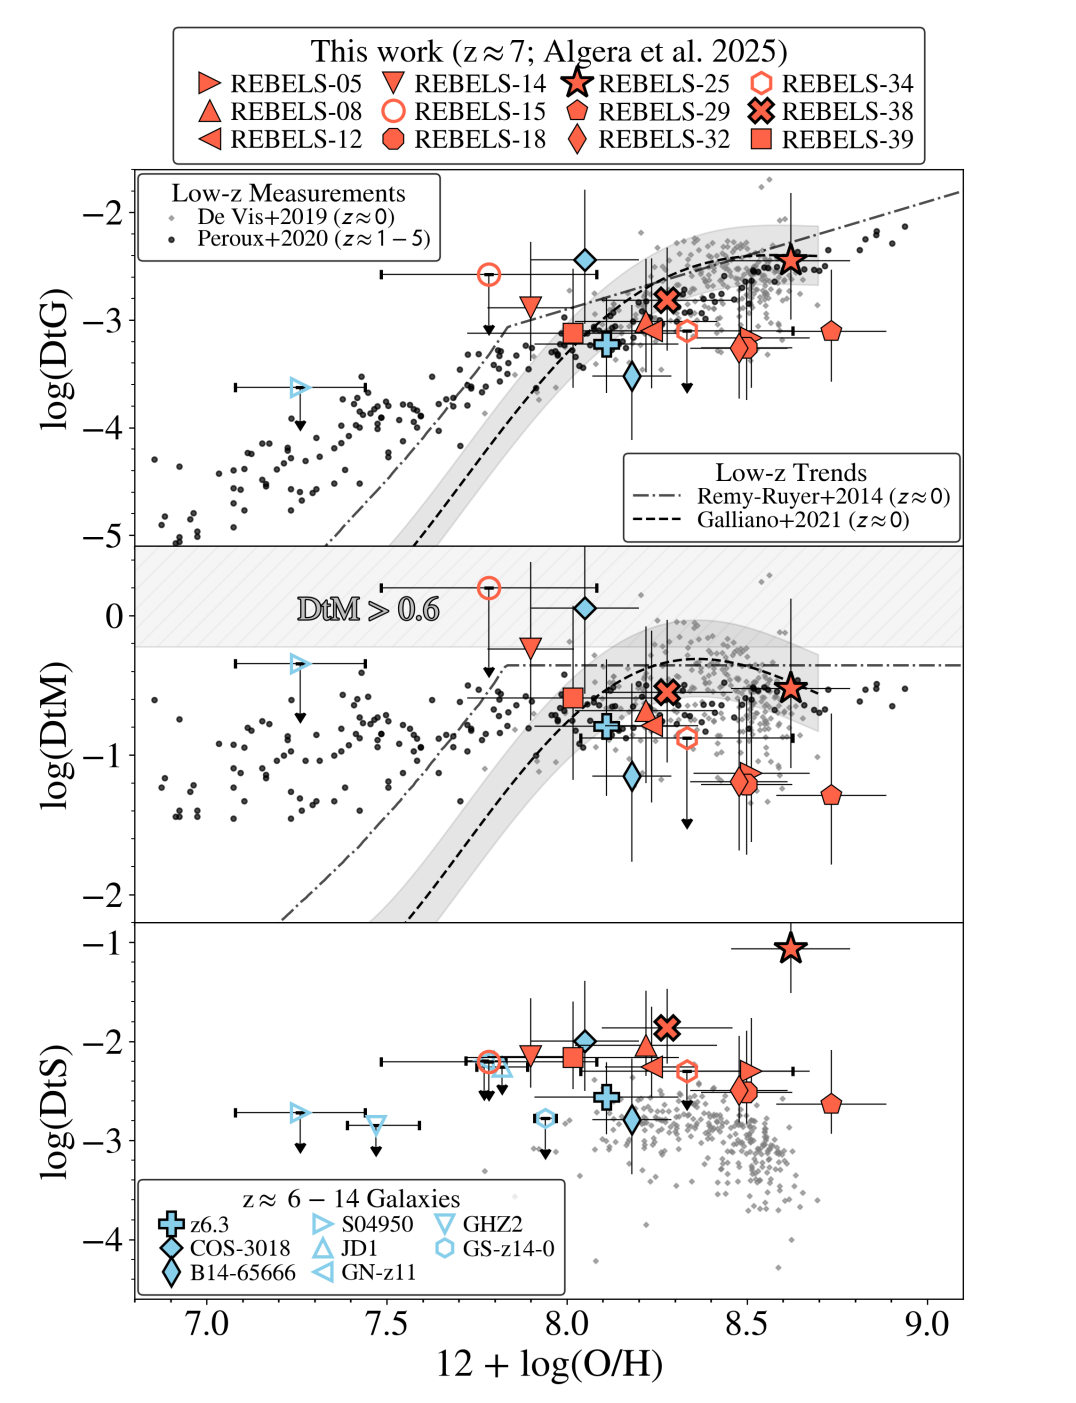
We consider three key scaling relations as a function of metallicity: the dust-to-gas, dust-to-metal and dust-to-stellar mass (DtS) ratios (Figures 4 and 5). Figure 4 includes a comparison of the REBELS-IFU sample to observations at low (), intermediate () and high () redshifts, while Figure 5 includes predictions from a set of theoretical models at . We discuss these comparisons to observations and simulations in detail in Section 5, while we first focus on some of the general properties of the REBELS-IFU sample.
The top panels of Figures 4 and 5 demonstrate that the REBELS-IFU sources span nearly dex in DtG ratio, ranging from . However, the dust-to-gas ratio does not appear to vary strongly with metallicity above , although for our lowest-metallicity target we can only provide an upper limit on its dust mass, and thus on the DtG ratio. The source with the largest DtG ratio is REBELS-25 at , which is simultaneously the galaxy with the highest dust mass among the REBELS sample (Algera et al., 2024b). Among the 10 dust-detected galaxies, we find a mean dust-to-gas ratio of , where the uncertainty represents the standard deviation among the sample and does not include any systematic errors on the dust and gas masses.
In the middle panels of Figures 4 and 5, we plot the dust-to-metal ratio against metallicity. Because of the flat trend in dust-to-gas ratio versus metallicity, the DtM ratio shows an apparent decrease with (we recall that ). We demarcate the line with the expected maximum possible dust-to-metal ratio of (Palla et al. 2024; see also Konstantopoulou et al. 2024). Encouragingly, our entire sample is consistent with this strict upper limit. Focusing once more on the 10 dust-detected galaxies, we calculate the total fraction of metals locked up in dust as . Our sample spans a range of , with an average value of . This highlights how a substantial fraction of metals can be locked up in dust, even in galaxies at .
Finally, the bottom panels of Figures 4 and 5 plot the ratio of dust-to-stellar mass against metallicity. With the exception of REBELS-25, whose stellar mass may be overestimated (Sec. 4.1), the REBELS-IFU sample spans a range of , in agreement with a previous investigation of this quantity by Dayal et al. (2022) (see also Sommovigo et al. 2022a). The DtS ratio does not show a clear trend with metallicity, at least for the relatively metal-rich REBELS-IFU sample with . We tabulate the DtG, DtM and DtS ratios of our targets in Table 1.
5 Discussion
5.1 A comparison to observations
In Figure 4, we compare the DtG, DtM and DtS ratios of the REBELS sample to a broad range of observations spanning to . We start by briefly introducing these comparison samples.
In the local Universe, we compare to observations from Rémy-Ruyer et al. (2014), De Vis et al. (2019) and Galliano et al. (2021). We note that their samples partially overlap, and are therefore not fully independent. Each of the local studies find an increase in the DtG ratio towards more metal-rich galaxies, with both Rémy-Ruyer et al. (2014) and Galliano et al. (2021) preferring a rapid increase with metallicity for , while above this turnover metallicity the increase in DtG ratio becomes approximately linear. As a result, in these studies the DtM ratio does not depend strongly on metallicity above the turnover.
Some of the first direct constraints on the DtG ratios of galaxies at higher redshift () were obtained by Shapley et al. (2020), who presented Keck/MOSFIRE follow-up of four ALMA-detected galaxies from the ASPECS program (Walter et al., 2016) to measure their rest-optical metallicities. Both their study and later work by Popping et al. (2023), who studied the dust and CO emission in 10 galaxies with rest-optical spectra drawn from the MOSDEF survey (Kriek et al. 2015; see also Shivaei et al. 2022), found good agreement with the local relation between DtG ratio and metallicity. This suggests the local scaling relation to already be in place at Cosmic Noon – at least at the high-metallicity end to which the aforementioned studies are limited [].
Also at intermediate redshifts (), Péroux & Howk (2020) have compiled DtG and DtM measurements for DLAs. These samples appear to show a linear trend between DtG and metallicity across the full parameter space, without clear evidence for a turnover at intermediate metallicities. While the reason for this difference with respect to galaxies is not fully clear, the discrepancy could be related to systematic differences between studies using absorption- and emission-line spectroscopy (Hamanowicz et al. 2020, 2024; Clark et al. 2023; Park et al. 2024).
At even earlier epochs, combined studies of dust and metals are scarce. We here compare to eight galaxies with dust and metal observations in the literature, six of which were moreover targeted in [C ii] emission enabling insight into their gas properties. Details of our literature sample are provided in Appendix B. Briefly, however, our sample consists of RXCJ0600-z6.3 at (a.k.a. the ‘Cosmic Grapes’; Fujimoto et al. 2024a; Giménez-Arteaga et al. 2024; Valentino et al. 2024); COS-3018 at (Smit et al., 2018; Witstok et al., 2022; Scholtz et al., 2024); B14-65666 at (Hashimoto et al., 2019; Sugahara et al., 2021; Jones et al., 2024); S04950 at (Heintz et al., 2023b; Fujimoto et al., 2024b); JD1 at (Hashimoto et al., 2018; Tokuoka et al., 2022; Marconcini et al., 2024; Morishita et al., 2024); GN-z11 at (Oesch et al., 2016; Bunker et al., 2023; Tacchella et al., 2023; Fudamoto et al., 2024); GHZ2 at (Castellano et al., 2022, 2024; Naidu et al., 2022; Bakx et al., 2023; Calabro et al., 2024; Zavala et al., 2024a, b); and GS-z14-0 at (Carniani et al., 2024a, b; Schouws et al., 2024). The sample are all detected in [C ii] and dust continuum, while S04950 is [C ii]- but not dust-detected. The [C ii] lines in JD1 and GN-z11 were targeted but not detected, and neither was their dust continuum; for those sources we can therefore not place any meaningful constraints on their DtG and DtM ratios. Finally, GHZ2 and GS-z14-0 have not been targeted in [C ii] emission, although for the latter ALMA Director’s Discretionary Time (DDT) was recently awarded to observe the line (2024.A.00007.S, PI Schouws).
5.1.1 Dust-to-Gas and Dust-to-Metal ratios
In the top and middle panels of Figure 4, we see that the DtG and DtM ratios of the REBELS-IFU sources are broadly consistent with those of local galaxies at similar gas-phase metallicities. While we do not see evidence for a linear trend between DtG and metallicity – unlike the local studies – this could simply be due to the fixed dust temperature and we adopt to obtain the dust and gas masses. This appears plausible when considering only the galaxies with multi-band dust mass and metallicity measurements (points with a thick black outline in Figure 4, which are in order of increasing redshift: z6.3, REBELS-38, COS-3018, B14-65666 and REBELS-25). Between just these five sources, there does appear to be an increasing trend of DtG with metallicity.
As described in Section 3.5, we adopt a fixed dust temperature of for the remainder of the REBELS-IFU sample to infer their dust masses. However, the theoretical model by Sommovigo et al. (2022a) suggests that dust temperatures may be lower for metal-rich galaxies, which would consequently increase their dust mass and DtG ratio compared to our fiducial values. Indeed, as discussed in Section 3.5, if the metal-rich sample has a lower dust temperature of , their DtG and DtM ratios increase by , bringing them into better agreement with the low-redshift relations. On the other hand, for local galaxies there does not appear to be a clear relation between dust temperature and gas-phase metallicity (e.g., Lamperti et al. 2019). Recently-approved ALMA Band 8 observations of the single-band continuum-detected REBELS-IFU galaxies will shed light on this by enabling dual-band dust temperature and mass measurements (2024.1.00406.S; PI Algera).
Consistent with the flat relation between DtG and metallicity, we see a slight decreasing trend between DtM and (middle panel of Fig. 4). This trend is not seen in lower redshift galaxies, and may again be the result of uncertain dust and gas mass measurements. However, if taken at face value, there are a few possible explanations for this low DtM at high metallicity. First of all, observations at low-redshift suggest that dust growth in the ISM should be especially efficient at high metallicities (e.g., Mattsson et al. 2014; Galliano et al. 2021; Konstantopoulou et al. 2024). However, the characteristic timescale of dust growth is poorly constrained, and likely depends on the physical conditions within the galaxy. If the timescale is sufficiently long, a galaxy following a recent starburst may have enriched its ISM with metals, without having yet locked these metals into significant amounts of dust. Galliano et al. (2021) attempt to empirically constrain the timescale for dust growth in local galaxies, finding it to be between . Even at the lower end of this range, this is comparable to the typical ages of high-redshift galaxies (e.g., Whitler et al. 2023).
On the other hand, given the higher characteristic ISM densities in the early Universe, it is plausible that dust growth timescales are significantly shorter in distant galaxies. Algera et al. (2024b) argued this is likely the case for the galaxy REBELS-25, which possesses a particularly high dust mass and moreover shows a steep dust emissivity index that could point towards a dense ISM where dust growth is particularly efficient (see also e.g., Stepnik et al. 2003; Köhler et al. 2015). Clearly, more detailed modeling of ISM grain growth physics in dense or otherwise extreme physical conditions is necessary to test this scenario.
Another possible explanation is that dust destruction becomes increasingly dominant in metal-rich galaxies at high redshift. Indeed, some models have suggested that SNe may be net dust destroyers when embedded in a dust-rich ISM (e.g., Bocchio et al. 2016; Kirchschlager et al. 2024). Assuming that each SN is capable of sweeping up a fixed ISM mass, the total swept up dust mass will be proportional to the dust-to-gas ratio (e.g., Asano et al. 2013; Dayal et al. 2022), which would imply SN dust destruction to become increasingly important in more dust-rich galaxies. Given that these SNe would simultaneously release metals previously locked up in dust grains back into the gas phase, a sudden increase in SN dust destruction could potentially produce a population of metal-rich yet dust-poor galaxies. In the local Universe, a slight decrease in galaxy dust masses and DtM ratios is indeed seen at the high metallicity end (e.g., De Vis et al. 2019; Galliano et al. 2021), which is due to older, quiescent galaxies where little dust is expected to be produced, and dust destruction becomes dominant (see also Calura et al. 2023; Donevski et al. 2023; Lee et al. 2024). However, the rest-optical spectra of the REBELS-IFU sources demonstrate these are all clearly star-forming galaxies, where this behavior is not expected. Indeed, none of the models shown in Figure 5 (and discussed in Section 5.2) predict a trend of this nature, despite otherwise being successful in reproducing a wide range of properties of the high-redshift galaxy population. As such, we disfavor this interpretation.
Instead of completely destroying the dust, it is also possible that dust is effectively ejected from the galaxy (e.g., Ferrara et al. 2023; Otsuki & Hirashita 2024). However, if dust and gas are well-mixed, outflows should leave the DtG and DtM ratios unchanged, and as such this interpretation requires the preferential ejection of dust. One possibility is that the dust is ejected due to strong radiation pressure (e.g., Ferrara et al. 2023; Ziparo et al. 2023). However, as shown by Ferrara (2024), this scenario requires highly compact galaxies with large specific star formation rates (sSFRs), whereas the REBELS-IFU galaxies are both spatially extended (Rowland et al. in preparation), and have lower sSFRs (Topping et al. 2022; Fisher et al. in preparation). Moreover, the outflow interpretation is disfavored by the high gas fractions inferred for the REBELS-IFU sample (Section 4.1). Similarly, while inflows of primordial gas could be invoked to explain a reduction in the DtG ratio, these cannot reduce the DtM ratio. This suggests that, if the lower DtM ratios at high metallicities are real, efficient dust destruction or inefficient ISM dust growth are more plausible explanations.
For now, however, we take this trend as rather tentative – the metal-rich galaxies showing low DtM ratios are the same ones showing gas fractions in excess of the closed box model (Section 4.1). As such, we deem it more likely that their gas masses are currently being overestimated, which would bring their DtG and DtM ratios in better agreement with the local relations.
5.1.2 Dust-to-Stellar mass ratio
The lower panel of Figure 4 reveals that the dust-to-stellar mass ratios of the REBELS-IFU sample span a range of , after excluding REBELS-25 with for which the stellar mass is likely underestimated (Section 4.1). These DtS ratios are in agreement with previous determinations for the REBELS sample adopting the [C ii]-based dust temperature estimated by Sommovigo et al. (2022a). Moreover, the inferred DtS ratios are similar to those observed in the typical galaxy population (Witstok et al., 2023), and are furthermore similar to the what is observed in dusty star-forming galaxies at cosmic noon (e.g., da Cunha et al. 2015; Donevski et al. 2020; Dudzevičiūtė et al. 2020; Liao et al. 2024). However, the DtS ratios measured for the REBELS-IFU galaxies are larger than those of the local sample from De Vis et al. (2019), which includes a mixture of dwarf, spiral and elliptical galaxies (see also Davies et al. 2017).
The fact that the DtS ratio does not appear to scale with metallicity within the REBELS-IFU sample could suggest that the dust is produced solely through Type II SNe (though see the discussion in the following Section). Following the framework by Michałowski (2015), we convert the measured DtS ratios of the REBELS-IFU sample to a Type-II SN yield assuming a Chabrier (2003) IMF. Focusing on the dust-detected galaxies and excluding REBELS-25 due to its likely underestimated stellar mass, we infer an average yield of . This is consistent with the values previously reported for the continuum-detected REBELS sample, which partially overlaps with the REBELS-IFU sample (Ferrara et al., 2022; Sommovigo et al., 2022a), as well as for literature samples at (e.g., Witstok et al. 2023).
However, we recall that the dust continuum detections among the REBELS-IFU sample are limited to relatively high metallicities [, corresponding to ]. Several studies have suggested that this exceeds a ‘critical metallicity’ threshold where dust growth in the ISM starts to become particularly efficient (e.g., Asano et al. 2013; Zhukovska 2014; Parente et al. 2022; Choban et al. 2024b). Indeed, at metallicities far below this expected threshold, the low DtS ratio of S04950 [] could point towards lower supernova yields. The DtS ratios of GHZ2 and GS-z14-0 are similarly low, and these galaxies are found at an epoch () where dust growth in the ISM is less likely to significantly contribute to overall dust build-up. Based on these three sources alone, the inferred SN yield is therefore significantly lower, given a Chabrier IMF.
We caution, however, that the dust masses of these sources are upper limits based on ALMA non-detections, which require assuming a dust temperature. As detailed in Section 3.5, this can significantly affect inferred dust masses. Moreover, the stellar masses of these high-redshift galaxies are similarly uncertain (e.g., Helton et al. 2024). In addition, converting the DtS ratio into a supernova yield implicitly assumes that all produced dust still resides within the galaxy, whereas for these ultra-high-redshift sources dust may be efficiently expelled (Ferrara et al., 2023, 2024). This would cause the observationally-inferred dust mass to underestimate the total amount of dust the galaxy has produced across its lifetime, and thus result in underestimated SN yields. As the above discussion suggests, and as we will see in the following Section, it is (unfortunately) not straightforward to distinguish between supernova and ISM dust production in the early Universe.
5.2 A comparison to models
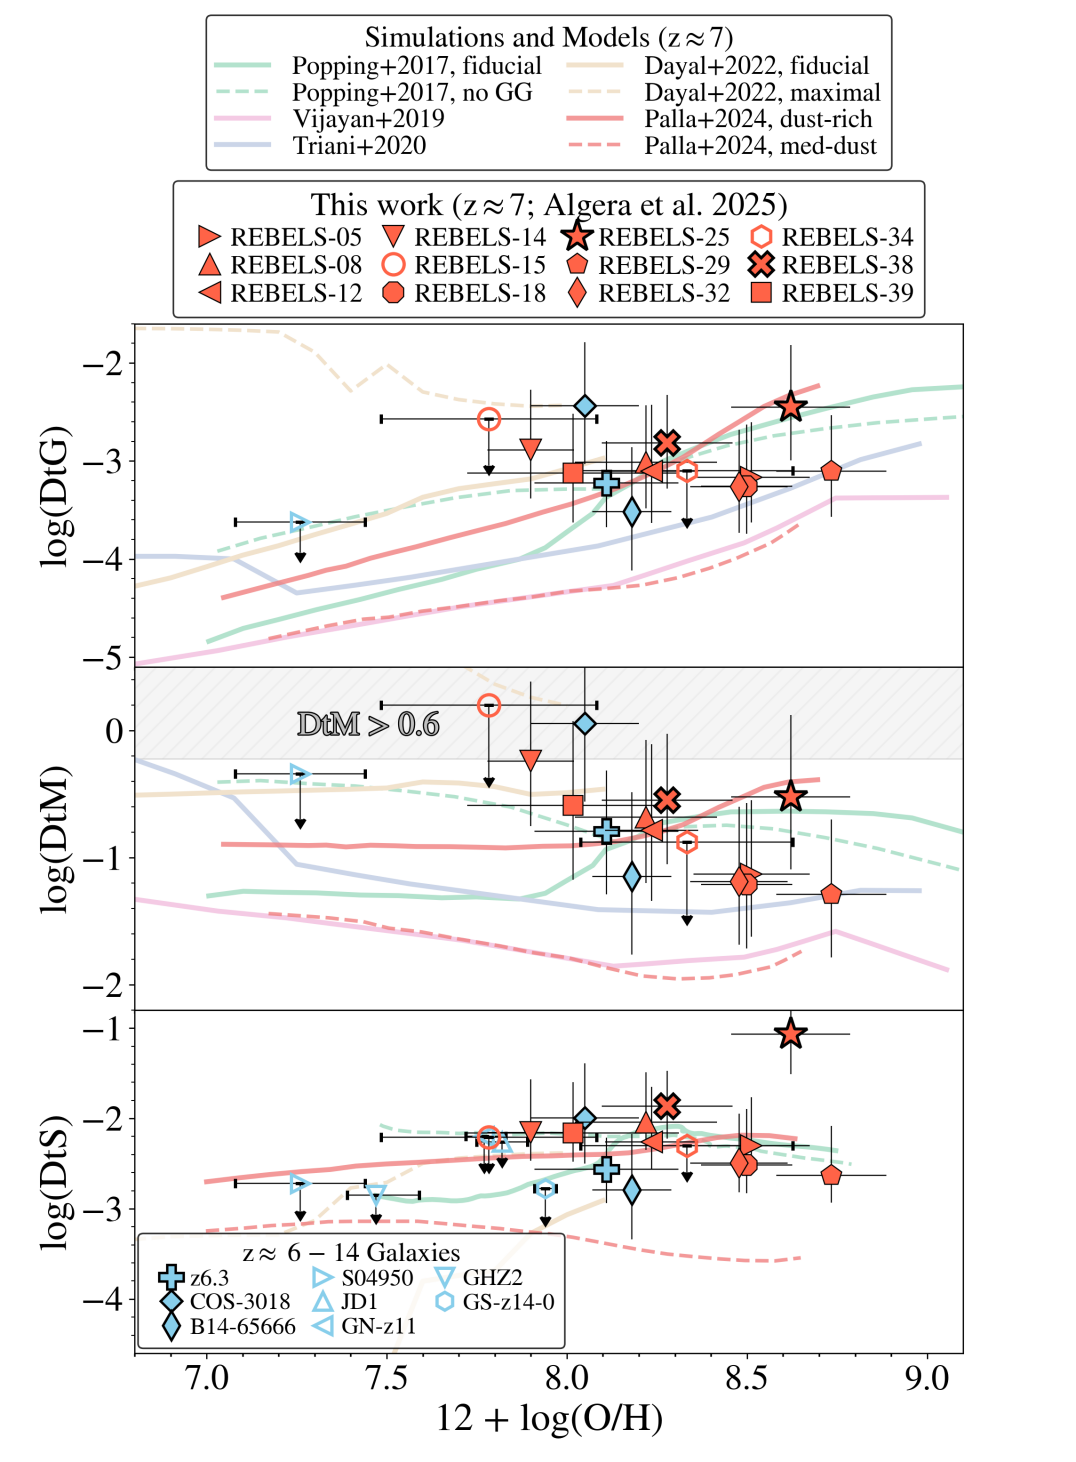
To gain further insight into the dust production and destruction pathways of the REBELS-IFU sample, we proceed by comparing to several models of early dust build-up (Fig. 5). Specifically, we compare to two different prescriptions by Popping et al. (2017), who include dust production and destruction on top of the semi-analytical Santa Cruz models: we focus on their fiducial model, and an alternative prescription that does not include ISM dust growth (labeled ‘no GG’ in Fig. 5). Moreover, we compare to the L-Galaxies semi-analytical models from Vijayan et al. (2019), the DustySAGE models introduced by Triani et al. (2020), and the DELPHI models by Dayal et al. (2022). The latter study considers two scenarios: a fiducial model whereby most dust is created by SNe, and a maximal model with rapid ISM dust growth and no dust destruction, which ensures that effectively all metals are found inside dust grains. Finally, we consider the models by Palla et al. (2024), which couple the observationally-constrained star formation histories of REBELS galaxies from Topping et al. (2022) to a chemical evolutionary framework. We consider both the metal-rich/dust-rich and metal-rich/intermediate-dust (labeled ‘med-dust’ in Fig. 5) scenarios described by Palla et al. (2024). For each of the models, we focus on the predictions made at . While not an exhaustive list of works investigating early dust build-up (see also, e.g., the recent studies by Di Cesare et al. 2023; Lewis et al. 2023; Choban et al. 2024a; Esmerian & Gnedin 2024; Narayanan et al. 2024), the selected comparison studies span a large range of predictions in terms of the DtG and DtM ratios, and thus provide insight into what may be the dominant processes governing the production and evolution of dust at . Where relevant, we moreover include a qualitative comparison to other works not shown in Fig. 5.
5.2.1 Dust-to-Gas and Dust-to-Metal ratios
In terms of the DtG and DtM ratios, the majority of the REBELS-IFU sample is in good agreement with the dust-rich scenario in Palla et al. (2024), or either of the two dust production scenarios from Popping et al. (2017). Both of these studies predict high dust-to-gas ratios [] at the metallicity range of the REBELS-IFU sample []. In the case of the fiducial model by Popping et al. (2017), the large DtG and DtM ratios are predominantly due to dust growth in the ISM, although their ‘no GG’ model suggests efficient supernovae can produce similarly high values. Constraints on the DtG and DtM ratios for galaxies at lower metallicities are essential to distinguish between these two scenarios; at metallicities below , the predictions from the two models differ by , while at higher metallicities they predict similar DtG ratios (c.f., the dashed and solid green lines in Figure 5). Observationally, however, this is an expensive task, given that low-mass, metal-poor galaxies in the EoR typically appear faint in [C ii] (e.g., Vallini et al. 2015; Glazer et al. 2024).
A few of the REBELS-IFU galaxies with show , which is in better agreement with the models from Triani et al. (2020). Their models predict dust build-up at proceeds mostly through SNe, and yield lower DtG and DtM ratios than the Palla et al. (2024) and Popping et al. (2017) models. On the other hand, our measurements appear inconsistent with the models from Vijayan et al. (2019), which yield DtG and DtM ratios that are lower than what we infer for the REBELS-IFU sample. While Vijayan et al. (2019) predict ISM dust growth to be dominant already at , their grain growth timescale may still be underestimated. Indeed, Vijayan et al. (2019) show in their Appendix that further reducing the characteristic grain growth timescale would better reproduce observed dust masses at high redshift () compared to their fiducial model, while retaining their agreement with dust mass measurements at Cosmic Noon and lower redshifts.
When comparing to the Dayal et al. (2022) models, we find that they do not produce large numbers of galaxies with metallicities similar to the REBELS-IFU sources at . This was previously noted by Ucci et al. (2023) regarding the related Astraeus simulations, who ascribe this to the relatively low star formation efficiency in the models, in combination with perfect coupling of dust and metals in outflows, and potentially underestimated metallicities of inflowing gas. Nevertheless, an extrapolation of the fiducial Dayal et al. (2022) model would seem to be in reasonable agreement with the high-DtG subset of our sample. Their ‘maximal’ model produces DtM ratios significantly larger than what is observed either in the REBELS-IFU or literature samples. While Dayal et al. (2022) originally introduced this model to reproduce the high dust masses observed in some of the REBELS galaxies with low stellar masses, they added a caveat that the underlying assumptions are rather unrealistic (e.g., no dust destruction). As a result, the mismatch with the ‘maximal’ models by Dayal et al. (2022) is not particularly surprising.
5.2.2 Dust-to-Stellar mass ratio
Not all of the models introduced above provide predictions for the DtS ratio as a function of metallicity. Therefore, we compare only to the models by Popping et al. (2017), Dayal et al. (2022) and Palla et al. (2024) in the bottom panel of Fig. 5. While at high metallicities the REBELS-IFU sample agrees with both the fiducial and ‘no GG’ model from Popping et al. (2017), the upper limit on the dust mass from REBELS-15 – the source with the lowest metallicity in our sample – is in better agreement with the fiducial scenario. Albeit at slightly higher redshift (), the upper limit on the dust mass of S04950 is also consistent with their fiducial model, while being in tension with the model without ISM dust growth. The deep upper limits on the DtS ratios for GHZ2 at and GS-z14-0 at also suggest DtS ratios to be lower for metal-poor galaxies, although the Popping et al. (2017) predictions are limited to , preventing a detailed comparison at such early epochs.
Interestingly, a recent study by Narayanan et al. (2024) paints an evolutionary link between the blue and apparently dust-poor galaxies observed at and the massive, dust-rich REBELS-IFU-like galaxies observed at later cosmic times. While Narayanan et al. (2024) do not provide a relation between the DtS ratio and metallicity in their work, their models are successful at reproducing the population of galaxies with by . They predict that the progenitors of these galaxies have a significantly lower at , while between to efficient ISM dust growth is responsible for rapidly building up their dust mass. This is in qualitative agreement with the high ratios observed for the REBELS-IFU galaxies, compared to the stringent upper limits on the ratios for the galaxy population, although more data especially for these very high-redshift sources is essential to confirm this prediction.
Returning to the models shown in Figure 5, we find that the REBELS-IFU data are also in good agreement with the dust-rich model from Palla et al. (2024), while their intermediate-dust model predicts DtS ratios that are lower than observed. However, neither model predicts strong variations in DtS with metallicity, which may be in slight tension with the aforementioned metal-poor galaxies in the literature at . Finally, the REBELS-IFU sample is more metal-rich than the bulk of the galaxies in the Dayal et al. (2022) models, and appear to agree better with (an extrapolation of) their ‘maximal model’ in terms of the predicted DtS ratios. However, as mentioned, this model predicts far higher DtM ratios than inferred for the REBELS-IFU sample, and is thus overall inconsistent with our measurements.
In summary, the REBELS-IFU data are in best agreement with models predicting swift dust build-up by through a combination of supernova dust and rapid ISM dust growth (i.e., the fiducial and dust-rich models by Popping et al. 2017 and Palla et al. 2024, respectively), or efficient supernovae alone (the ‘no grain growth’ model by Popping et al. 2017). Upon also including low-metallicity galaxies from the literature, we find that the fiducial model by Popping et al. (2017) can best reproduce the observations, although we caution that this metal-poor comparison sample lies at higher redshifts than the REBELS-IFU sources. Nevertheless, reproducing the full suite of high-redshift observations appears to require a combination of modest SN yields to reproduce the upper limits on the DtS ratios of metal-poor galaxies, and rapid ISM dust growth to match the high DtG, DtM and DtS ratios of the REBELS-IFU sources.
Our conclusions do not change significantly if we adopt -based metallicities for our entire sample, as discussed in Appendix A. In fact, since this diagnostic yields slightly lower metallicities on average while leaving the DtG and DtS ratios unchanged, it further reinforces our conclusions that the dust contents of the REBELS-IFU sample are best reproduced by models predicting rapid dust build-up by .
6 Conclusions
We performed a detailed study of the dust, gas and metal contents of 12 galaxies at observed as part of the REBELS-IFU survey. Our sample benefits from [C ii] and dust continuum observations from the ALMA REBELS program (Bouwens et al., 2022; Inami et al., 2022), as well as metallicity measurements from JWST/NIRSpec IFU observations (Stefanon et al. in preparation; Rowland et al. in preparation). We adopt dust masses for our targets obtained from multi-band ALMA observations (2 sources; Algera et al. 2024a, b), or from a single-band continuum datapoint assuming a fixed dust temperature of (10 sources, 2 of which are upper limits). Moreover, we infer molecular gas masses from the [C ii] luminosity following the calibration by Zanella et al. (2018). Our key results are as follows:
-
•
We find that the REBELS-IFU sources have high gas fractions, ranging from . A subset of the sample shows gas fractions while simultaneously possessing a high metallicity . This is in tension with closed box evolutionary models, which should yield the maximum possible for a given metallicity. The most likely interpretation for this is that their gas masses are overestimated; if indeed the case, our dust-to-gas and dust-to-metal ratios will be larger than the fiducial values quoted in the following, which further strengthens our conclusion that dust build-up is highly efficient in massive galaxies at (see below).
-
•
We measure a typical dust-to-gas ratio of for the dust-detected REBELS-IFU sample across a metallicity range of . This value does not show a strong dependence on metallicity, in contrast to observations at finding an approximately linear relation in this regime. This could plausibly be due to systematic uncertainties in our dust masses: considering only the five sources with accurate multi-band dust mass measurements (two from REBELS + three literature galaxies), we see evidence for an increasing trend between the DtG ratio and metallicity. If confirmed through multi-band ALMA observations of additional high-redshift galaxies, this would suggest the local scaling relation between dust-to-gas ratio and metallicity does not evolve significantly between .
-
•
We measure dust-to-metal ratios spanning for the REBELS-IFU galaxies, which implies that of all metals are locked up in dust grains in massive galaxies at .
-
•
We determine dust-to-stellar mass ratios of , in agreement with previous studies of galaxies. These values are consistent with those of dusty star-forming galaxies at cosmic noon, but are larger than those of local galaxies with similar metallicities as the REBELS-IFU sample. We do not find evidence for an increase in with metallicity, which could be taken as evidence for dust production through SNe alone, without the need for grain growth (though see the next bullet point). Assuming this to be the case, we infer an average supernova dust yield of .
-
•
Our DtG, DtM and DtS ratios are in best agreement with theoretical models predicting rapid dust production in the early Universe. Using the REBELS-IFU sample alone, we cannot distinguish between the two key processes most likely responsible for building up this dust; SNe or efficient ISM dust growth. However, stringent upper limits on the dust masses of three metal-poor galaxies at higher redshifts () may argue against very high SN yields, which suggests ISM dust growth to be important in building up the dust reservoirs of massive galaxies in the Epoch of Reionization.
Overall, our observations thus suggest that dust build-up is highly efficient in the early Universe. However, several open questions remain. While REBELS provides the first statistical insights into the dust contents of massive galaxies at , our study is limited by sizable systematic uncertainties in both dust and gas masses. Multi-band ALMA observations are needed to better constrain the former, while high-resolution studies of [C ii] can be used to dynamically infer the total gas budget in light of uncertainties in the [C ii]-to-H2 conversion factor. The REBELS sample is moreover relatively metal-enriched, and similar observations of lower-metallicity galaxies are essential to fully constrain the pathways of dust production and destruction at . Finally, comparatively little is known about dust in the Universe, and dedicated observing campaigns are needed to explore the gas and dust contents of galaxies at the earliest cosmic times.
Acknowledgements
This paper makes use of the following ALMA data:
ADS/JAO.ALMA#2017.1.01217.S, ADS/JAO.ALMA#2019.1.01634.L, ADS/JAO.ALMA#2021.1.00318.S, ADS/JAO.ALMA#2021.1.01495.S, ADS/JAO.ALMA#2022.1.01324.S, ADS/JAO.ALMA#2022.1.01384.S.
ALMA is a partnership of ESO (representing its member states), NSF (USA) and NINS (Japan), together with NRC (Canada), MOST and ASIAA (Taiwan), and KASI (Republic of Korea), in cooperation with the Republic of Chile. The Joint ALMA Observatory is operated by ESO, AUI/NRAO and NAOJ.
This work was supported by NAOJ ALMA Scientific Research Grant Code 2021-19A (HSBA and HI). MS acknowledges support from the European Research Commission Consolidator Grant 101088789 (SFEER), from the CIDEGENT/2021/059 grant by Generalitat Valenciana, and from project PID2023-149420NB-I00 funded by MICIU/AEI/10.13039/501100011033 and by ERDF/EU. MA acknowledges support from ANID Basal Project FB210003 and and ANID MILENIO NCN2024_112. RAAB acknowledges support from an STFC Ernest Rutherford Fellowship [grant number ST/T003596/1]. AF acknowledges support from the ERC Advanced Grant INTERSTELLAR H2020/740120. JH acknowledges support from the ERC Consolidator Grant 101088676 (“VOYAJ”).
Data Availability
The various quantities needed to reproduce the figures in this work are provided in Table 1. Any further data underlying this article will be made available upon reasonable request to the corresponding author.
References
- Akins et al. (2022) Akins H. B., et al., 2022, ApJ, 934, 64
- Algera et al. (2023) Algera H. S. B., et al., 2023, MNRAS, 518, 6142
- Algera et al. (2024a) Algera H. S. B., et al., 2024a, MNRAS, 527, 6867
- Algera et al. (2024b) Algera H. S. B., et al., 2024b, MNRAS, 533, 3098
- Aravena et al. (2024) Aravena M., et al., 2024, A&A, 682, A24
- Asano et al. (2013) Asano R. S., Takeuchi T. T., Hirashita H., Inoue A. K., 2013, Earth, Planets and Space, 65, 213
- Asplund et al. (2009) Asplund M., Grevesse N., Sauval A. J., Scott P., 2009, ARA&A, 47, 481
- Bakx et al. (2020) Bakx T. J. L. C., et al., 2020, MNRAS, 493, 4294
- Bakx et al. (2021) Bakx T. J. L. C., et al., 2021, MNRAS, 508, L58
- Bakx et al. (2023) Bakx T. J. L. C., et al., 2023, MNRAS, 519, 5076
- Bakx et al. (2024) Bakx T. J. L. C., et al., 2024, MNRAS, 532, 2270
- Béthermin et al. (2023) Béthermin M., et al., 2023, A&A, 680, L8
- Bianchi & Schneider (2007) Bianchi S., Schneider R., 2007, MNRAS, 378, 973
- Bocchio et al. (2016) Bocchio M., Marassi S., Schneider R., Bianchi S., Limongi M., Chieffi A., 2016, A&A, 587, A157
- Bosman et al. (2022) Bosman S. E. I., et al., 2022, MNRAS, 514, 55
- Bouwens et al. (2022) Bouwens R. J., et al., 2022, ApJ, 931, 160
- Bowler et al. (2014) Bowler R. A. A., et al., 2014, MNRAS, 440, 2810
- Bowler et al. (2018) Bowler R. A. A., Bourne N., Dunlop J. S., McLure R. J., McLeod D. J., 2018, MNRAS, 481, 1631
- Bowler et al. (2022) Bowler R. A. A., Cullen F., McLure R. J., Dunlop J. S., Avison A., 2022, MNRAS, 510, 5088
- Bowler et al. (2024) Bowler R. A. A., et al., 2024, MNRAS, 527, 5808
- Boyett et al. (2024) Boyett K., et al., 2024, Nature Astronomy, 8, 657
- Bruzual & Charlot (2003) Bruzual G., Charlot S., 2003, MNRAS, 344, 1000
- Bunker et al. (2023) Bunker A. J., et al., 2023, A&A, 677, A88
- Calabro et al. (2024) Calabro A., et al., 2024, arXiv e-prints, p. arXiv:2403.12683
- Calura et al. (2023) Calura F., et al., 2023, MNRAS, 523, 2351
- Calzetti et al. (2000) Calzetti D., Armus L., Bohlin R. C., Kinney A. L., Koornneef J., Storchi-Bergmann T., 2000, ApJ, 533, 682
- Carnall et al. (2018) Carnall A. C., McLure R. J., Dunlop J. S., Davé R., 2018, MNRAS, 480, 4379
- Carnall et al. (2019) Carnall A. C., et al., 2019, MNRAS, 490, 417
- Carniani et al. (2024a) Carniani S., et al., 2024a, arXiv e-prints, p. arXiv:2405.18485
- Carniani et al. (2024b) Carniani S., et al., 2024b, arXiv e-prints, p. arXiv:2409.20533
- Casavecchia et al. (2024) Casavecchia B., Maio U., Péroux C., Ciardi B., 2024, arXiv e-prints, p. arXiv:2410.14284
- Castellano et al. (2022) Castellano M., et al., 2022, arXiv e-prints, p. arXiv:2207.09436
- Castellano et al. (2024) Castellano M., et al., 2024, arXiv e-prints, p. arXiv:2403.10238
- Chabrier (2003) Chabrier G., 2003, PASP, 115, 763
- Chemerynska et al. (2024) Chemerynska I., et al., 2024, arXiv e-prints, p. arXiv:2407.17110
- Choban et al. (2024a) Choban C. R., Salim S., Kereš D., Hayward C. C., Sandstrom K. M., 2024a, arXiv e-prints, p. arXiv:2408.08962
- Choban et al. (2024b) Choban C. R., Kereš D., Sandstrom K. M., Hopkins P. F., Hayward C. C., Faucher-Giguère C.-A., 2024b, MNRAS, 529, 2356
- Chowdhury et al. (2020) Chowdhury A., Kanekar N., Chengalur J. N., Sethi S., Dwarakanath K. S., 2020, Nature, 586, 369
- Clark et al. (2023) Clark C. J. R., Roman-Duval J. C., Gordon K. D., Bot C., Smith M. W. L., Hagen L. M. Z., 2023, ApJ, 946, 42
- Cullen et al. (2023) Cullen F., et al., 2023, MNRAS, 520, 14
- Curti et al. (2023) Curti M., et al., 2023, MNRAS, 518, 425
- Curti et al. (2024) Curti M., et al., 2024, A&A, 684, A75
- Curtis-Lake et al. (2023) Curtis-Lake E., et al., 2023, Nature Astronomy, 7, 622
- Davies et al. (2017) Davies J. I., et al., 2017, PASP, 129, 044102
- Dayal et al. (2022) Dayal P., et al., 2022, MNRAS, 512, 989
- De Cia et al. (2016) De Cia A., Ledoux C., Mattsson L., Petitjean P., Srianand R., Gavignaud I., Jenkins E. B., 2016, A&A, 596, A97
- De Looze et al. (2020) De Looze I., et al., 2020, MNRAS, 496, 3668
- De Vis et al. (2019) De Vis P., et al., 2019, A&A, 623, A5
- Decarli et al. (2022) Decarli R., et al., 2022, A&A, 662, A60
- Decarli et al. (2023) Decarli R., et al., 2023, A&A, 673, A157
- Dell’Agli et al. (2019) Dell’Agli F., Valiante R., Kamath D., Ventura P., García-Hernández D. A., 2019, MNRAS, 486, 4738
- Dessauges-Zavadsky et al. (2020) Dessauges-Zavadsky M., et al., 2020, A&A, 643, A5
- Di Cesare et al. (2023) Di Cesare C., Graziani L., Schneider R., Ginolfi M., Venditti A., Santini P., Hunt L. K., 2023, MNRAS, 519, 4632
- Donevski et al. (2020) Donevski D., et al., 2020, A&A, 644, A144
- Donevski et al. (2023) Donevski D., et al., 2023, A&A, 678, A35
- Dudzevičiūtė et al. (2020) Dudzevičiūtė U., et al., 2020, MNRAS, 494, 3828
- Erb (2008) Erb D. K., 2008, ApJ, 674, 151
- Esmerian & Gnedin (2022) Esmerian C. J., Gnedin N. Y., 2022, ApJ, 940, 74
- Esmerian & Gnedin (2024) Esmerian C. J., Gnedin N. Y., 2024, ApJ, 968, 113
- Fernández et al. (2016) Fernández X., et al., 2016, ApJ, 824, L1
- Ferrara (2024) Ferrara A., 2024, A&A, 684, A207
- Ferrara et al. (2016) Ferrara A., Viti S., Ceccarelli C., 2016, MNRAS, 463, L112
- Ferrara et al. (2022) Ferrara A., et al., 2022, MNRAS, 512, 58
- Ferrara et al. (2023) Ferrara A., Pallottini A., Dayal P., 2023, MNRAS, 522, 3986
- Ferrara et al. (2024) Ferrara A., Pallottini A., Sommovigo L., 2024, arXiv e-prints, p. arXiv:2410.19042
- Finlator & Davé (2008) Finlator K., Davé R., 2008, MNRAS, 385, 2181
- Fisher et al. (2025) Fisher R., et al., 2025, MNRAS, submitted
- Frias Castillo et al. (2024) Frias Castillo M., et al., 2024, arXiv e-prints, p. arXiv:2404.05596
- Fudamoto et al. (2021) Fudamoto Y., et al., 2021, Nature, 597, 489
- Fudamoto et al. (2024) Fudamoto Y., et al., 2024, MNRAS, 530, 340
- Fujimoto et al. (2021) Fujimoto S., et al., 2021, ApJ, 911, 99
- Fujimoto et al. (2024a) Fujimoto S., et al., 2024a, arXiv e-prints, p. arXiv:2402.18543
- Fujimoto et al. (2024b) Fujimoto S., et al., 2024b, ApJ, 964, 146
- Gall & Hjorth (2018) Gall C., Hjorth J., 2018, ApJ, 868, 62
- Galliano et al. (2021) Galliano F., et al., 2021, A&A, 649, A18
- Garaldi et al. (2024) Garaldi E., et al., 2024, MNRAS, 530, 3765
- Giménez-Arteaga et al. (2023) Giménez-Arteaga C., et al., 2023, ApJ, 948, 126
- Giménez-Arteaga et al. (2024) Giménez-Arteaga C., et al., 2024, A&A, 686, A63
- Glazer et al. (2024) Glazer K., et al., 2024, MNRAS, 531, 945
- Graziani et al. (2020) Graziani L., Schneider R., Ginolfi M., Hunt L. K., Maio U., Glatzle M., Ciardi B., 2020, MNRAS, 494, 1071
- Hagimoto et al. (2023) Hagimoto M., et al., 2023, MNRAS, 521, 5508
- Hamanowicz et al. (2020) Hamanowicz A., et al., 2020, MNRAS, 492, 2347
- Hamanowicz et al. (2024) Hamanowicz A., et al., 2024, ApJ, 966, 80
- Harikane et al. (2020) Harikane Y., et al., 2020, ApJ, 896, 93
- Hashimoto et al. (2018) Hashimoto T., et al., 2018, Nature, 557, 392
- Hashimoto et al. (2019) Hashimoto T., et al., 2019, PASJ, 71, 71
- Hashimoto et al. (2023) Hashimoto T., et al., 2023, ApJ, 952, 48
- Heintz et al. (2021) Heintz K. E., Watson D., Oesch P. A., Narayanan D., Madden S. C., 2021, ApJ, 922, 147
- Heintz et al. (2022) Heintz K. E., et al., 2022, ApJ, 934, L27
- Heintz et al. (2023a) Heintz K. E., et al., 2023a, Nature Astronomy, 7, 1517
- Heintz et al. (2023b) Heintz K. E., et al., 2023b, ApJ, 944, L30
- Heintz et al. (2024) Heintz K. E., et al., 2024, Science, 384, 890
- Helton et al. (2024) Helton J. M., et al., 2024, arXiv e-prints, p. arXiv:2405.18462
- Hirashita (2012) Hirashita H., 2012, MNRAS, 422, 1263
- Hirashita & Yan (2009) Hirashita H., Yan H., 2009, MNRAS, 394, 1061
- Hygate et al. (2023) Hygate A. P. S., et al., 2023, MNRAS,
- Inami et al. (2022) Inami H., et al., 2022, MNRAS, 515, 3126
- Isobe et al. (2023) Isobe Y., Ouchi M., Nakajima K., Harikane Y., Ono Y., Xu Y., Zhang Y., Umeda H., 2023, ApJ, 956, 139
- Jones et al. (2024) Jones G. C., et al., 2024, arXiv e-prints, p. arXiv:2412.15027
- Kaasinen et al. (2024) Kaasinen M., et al., 2024, A&A, 684, A33
- Kewley & Ellison (2008) Kewley L. J., Ellison S. L., 2008, ApJ, 681, 1183
- Kirchschlager et al. (2019) Kirchschlager F., Schmidt F. D., Barlow M. J., Fogerty E. L., Bevan A., Priestley F. D., 2019, MNRAS, 489, 4465
- Kirchschlager et al. (2023) Kirchschlager F., Schmidt F. D., Barlow M. J., De Looze I., Sartorio N. S., 2023, MNRAS, 520, 5042
- Kirchschlager et al. (2024) Kirchschlager F., Mattsson L., Gent F. A., 2024, Nature Communications, 15, 1841
- Köhler et al. (2015) Köhler M., Ysard N., Jones A. P., 2015, A&A, 579, A15
- Konstantopoulou et al. (2024) Konstantopoulou C., et al., 2024, A&A, 681, A64
- Kriek et al. (2015) Kriek M., et al., 2015, ApJS, 218, 15
- Kroupa (2001) Kroupa P., 2001, MNRAS, 322, 231
- Lamperti et al. (2019) Lamperti I., et al., 2019, MNRAS, 489, 4389
- Laporte et al. (2019) Laporte N., et al., 2019, MNRAS, 487, L81
- Laporte et al. (2021) Laporte N., et al., 2021, MNRAS, 505, 4838
- Lee et al. (2024) Lee M. M., et al., 2024, MNRAS, 527, 9529
- Leja et al. (2017) Leja J., Johnson B. D., Conroy C., van Dokkum P. G., Byler N., 2017, ApJ, 837, 170
- Leja et al. (2019) Leja J., Carnall A. C., Johnson B. D., Conroy C., Speagle J. S., 2019, ApJ, 876, 3
- Leśniewska & Michałowski (2019) Leśniewska A., Michałowski M. J., 2019, A&A, 624, L13
- Lewis et al. (2023) Lewis J. S. W., Ocvirk P., Dubois Y., Aubert D., Chardin J., Gillet N., Thélie É., 2023, MNRAS, 519, 5987
- Li et al. (2019) Li Q., Narayanan D., Davé R., 2019, MNRAS, 490, 1425
- Li et al. (2024) Li J., et al., 2024, ApJ, 976, 70
- Liao et al. (2024) Liao C.-L., et al., 2024, ApJ, 961, 226
- Lines et al. (2024) Lines N. E. P., et al., 2024, arXiv e-prints, p. arXiv:2409.10963
- Lower et al. (2023) Lower S., Narayanan D., Li Q., Davé R., 2023, ApJ, 950, 94
- Lower et al. (2024) Lower S., Narayanan D., Hu C.-Y., Privon G. C., 2024, ApJ, 965, 123
- Madau & Dickinson (2014) Madau P., Dickinson M., 2014, ARA&A, 52, 415
- Madden et al. (2020) Madden S. C., et al., 2020, A&A, 643, A141
- Maiolino & Mannucci (2019) Maiolino R., Mannucci F., 2019, A&ARv, 27, 3
- Mancini et al. (2015) Mancini M., Schneider R., Graziani L., Valiante R., Dayal P., Maio U., Ciardi B., Hunt L. K., 2015, MNRAS, 451, L70
- Marconcini et al. (2024) Marconcini C., et al., 2024, arXiv e-prints, p. arXiv:2407.08616
- Marrone et al. (2018) Marrone D. P., et al., 2018, Nature, 553, 51
- Martínez-González et al. (2019) Martínez-González S., Wünsch R., Silich S., Tenorio-Tagle G., Palouš J., Ferrara A., 2019, ApJ, 887, 198
- Matsumoto et al. (2024) Matsumoto K., et al., 2024, A&A, 689, A79
- Mattsson et al. (2014) Mattsson L., et al., 2014, MNRAS, 444, 797
- Mauerhofer & Dayal (2023) Mauerhofer V., Dayal P., 2023, arXiv e-prints, p. arXiv:2305.01681
- McKinnon et al. (2016) McKinnon R., Torrey P., Vogelsberger M., 2016, MNRAS, 457, 3775
- McKinnon et al. (2017) McKinnon R., Torrey P., Vogelsberger M., Hayward C. C., Marinacci F., 2017, MNRAS, 468, 1505
- Micelotta et al. (2018) Micelotta E. R., Matsuura M., Sarangi A., 2018, Space Sci. Rev., 214, 53
- Michałowski (2015) Michałowski M. J., 2015, A&A, 577, A80
- Mitsuhashi et al. (2024) Mitsuhashi I., et al., 2024, ApJ, 971, 161
- Morishita et al. (2024) Morishita T., et al., 2024, ApJ, 971, 43
- Naidu et al. (2022) Naidu R. P., et al., 2022, arXiv e-prints, p. arXiv:2207.09434
- Nakajima et al. (2022) Nakajima K., et al., 2022, ApJS, 262, 3
- Nakajima et al. (2023) Nakajima K., Ouchi M., Isobe Y., Harikane Y., Zhang Y., Ono Y., Umeda H., Oguri M., 2023, arXiv e-prints, p. arXiv:2301.12825
- Narayanan et al. (2024) Narayanan D., et al., 2024, arXiv e-prints, p. arXiv:2408.13312
- Neeleman et al. (2019) Neeleman M., Kanekar N., Prochaska J. X., Rafelski M. A., Carilli C. L., 2019, ApJ, 870, L19
- Nikopoulos & Dayal (2024) Nikopoulos G., Dayal P., 2024, arXiv e-prints, p. arXiv:2409.10613
- Nozawa et al. (2007) Nozawa T., Kozasa T., Habe A., Dwek E., Umeda H., Tominaga N., Maeda K., Nomoto K., 2007, ApJ, 666, 955
- Oesch et al. (2016) Oesch P. A., et al., 2016, ApJ, 819, 129
- Ono et al. (2022) Ono Y., et al., 2022, ApJ, 941, 74
- Ono et al. (2023) Ono Y., et al., 2023, ApJ, 951, 72
- Otsuki & Hirashita (2024) Otsuki M., Hirashita H., 2024, MNRAS, 528, 5008
- Palla et al. (2024) Palla M., et al., 2024, MNRAS, 528, 2407
- Parente et al. (2022) Parente M., Ragone-Figueroa C., Granato G. L., Borgani S., Murante G., Valentini M., Bressan A., Lapi A., 2022, MNRAS, 515, 2053
- Park et al. (2024) Park H.-J., et al., 2024, MNRAS, 535, 729
- Péroux & Howk (2020) Péroux C., Howk J. C., 2020, ARA&A, 58, 363
- Popping et al. (2017) Popping G., Somerville R. S., Galametz M., 2017, MNRAS, 471, 3152
- Popping et al. (2023) Popping G., et al., 2023, A&A, 670, A138
- Ramambason et al. (2024) Ramambason L., et al., 2024, A&A, 681, A14
- Rémy-Ruyer et al. (2014) Rémy-Ruyer A., et al., 2014, A&A, 563, A31
- Riechers et al. (2013) Riechers D. A., et al., 2013, Nature, 496, 329
- Rizzo et al. (2021) Rizzo F., Vegetti S., Fraternali F., Stacey H. R., Powell D., 2021, MNRAS, 507, 3952
- Roman-Duval et al. (2014) Roman-Duval J., et al., 2014, ApJ, 797, 86
- Rowland et al. (2024) Rowland L. E., et al., 2024, arXiv e-prints, p. arXiv:2405.06025
- Sanders et al. (2024) Sanders R. L., Shapley A. E., Topping M. W., Reddy N. A., Brammer G. B., 2024, ApJ, 962, 24
- Sarangi et al. (2018) Sarangi A., Matsuura M., Micelotta E. R., 2018, Space Sci. Rev., 214, 63
- Sawant et al. (2024) Sawant P., et al., 2024, arXiv e-prints, p. arXiv:2412.02505
- Schneider & Maiolino (2024) Schneider R., Maiolino R., 2024, A&ARv, 32, 2
- Scholtz et al. (2024) Scholtz J., et al., 2024, arXiv e-prints, p. arXiv:2411.07695
- Schouws et al. (2022) Schouws S., et al., 2022, ApJ, 928, 31
- Schouws et al. (2023) Schouws S., et al., 2023, ApJ, 954, 103
- Schouws et al. (2024) Schouws S., et al., 2024, arXiv e-prints, p. arXiv:2409.20549
- Shapley et al. (2020) Shapley A. E., Cullen F., Dunlop J. S., McLure R. J., Kriek M., Reddy N. A., Sanders R. L., 2020, ApJ, 903, L16
- Shapley et al. (2024) Shapley A. E., et al., 2024, arXiv e-prints, p. arXiv:2410.00110
- Shivaei et al. (2022) Shivaei I., et al., 2022, ApJ, 928, 68
- Slavin et al. (2020) Slavin J. D., Dwek E., Mac Low M.-M., Hill A. S., 2020, ApJ, 902, 135
- Smit et al. (2014) Smit R., et al., 2014, ApJ, 784, 58
- Smit et al. (2018) Smit R., et al., 2018, Nature, 553, 178
- Sommovigo et al. (2021) Sommovigo L., Ferrara A., Carniani S., Zanella A., Pallottini A., Gallerani S., Vallini L., 2021, MNRAS, 503, 4878
- Sommovigo et al. (2022a) Sommovigo L., et al., 2022a, MNRAS, 513, 3122
- Sommovigo et al. (2022b) Sommovigo L., et al., 2022b, MNRAS, 517, 5930
- Spina et al. (2024) Spina B., Bosman S. E. I., Davies F. B., Gaikwad P., Zhu Y., 2024, arXiv e-prints, p. arXiv:2405.12273
- Spitoni et al. (2017) Spitoni E., Vincenzo F., Matteucci F., 2017, A&A, 599, A6
- Stepnik et al. (2003) Stepnik B., et al., 2003, A&A, 398, 551
- Strandet et al. (2017) Strandet M. L., et al., 2017, ApJ, 842, L15
- Sugahara et al. (2021) Sugahara Y., et al., 2021, ApJ, 923, 5
- Sugahara et al. (2024) Sugahara Y., et al., 2024, arXiv e-prints, p. arXiv:2403.17133
- Tacchella et al. (2022) Tacchella S., et al., 2022, ApJ, 927, 170
- Tacchella et al. (2023) Tacchella S., et al., 2023, ApJ, 952, 74
- Tamura et al. (2019) Tamura Y., et al., 2019, ApJ, 874, 27
- Tamura et al. (2023) Tamura Y., et al., 2023, ApJ, 952, 9
- Tinsley (1980) Tinsley B. M., 1980, Fundamentals Cosmic Phys., 5, 287
- Todini & Ferrara (2001) Todini P., Ferrara A., 2001, MNRAS, 325, 726
- Tokuoka et al. (2022) Tokuoka T., et al., 2022, ApJ, 933, L19
- Topping et al. (2022) Topping M. W., et al., 2022, MNRAS, 516, 975
- Triani et al. (2020) Triani D. P., Sinha M., Croton D. J., Pacifici C., Dwek E., 2020, MNRAS, 493, 2490
- Tripodi et al. (2023) Tripodi R., et al., 2023, ApJ, 946, L45
- Tripodi et al. (2024) Tripodi R., et al., 2024, arXiv e-prints, p. arXiv:2401.04211
- Ucci et al. (2023) Ucci G., et al., 2023, MNRAS, 518, 3557
- Umeda et al. (2024) Umeda H., Ouchi M., Nakajima K., Harikane Y., Ono Y., Xu Y., Isobe Y., Zhang Y., 2024, ApJ, 971, 124
- Valentino et al. (2024) Valentino F., et al., 2024, arXiv e-prints, p. arXiv:2402.17845
- Valiante et al. (2009) Valiante R., Schneider R., Bianchi S., Andersen A. C., 2009, MNRAS, 397, 1661
- Vallini et al. (2015) Vallini L., Gallerani S., Ferrara A., Pallottini A., Yue B., 2015, ApJ, 813, 36
- Vallini et al. (2018) Vallini L., Pallottini A., Ferrara A., Gallerani S., Sobacchi E., Behrens C., 2018, MNRAS, 473, 271
- Vijayan et al. (2019) Vijayan A. P., Clay S. J., Thomas P. A., Yates R. M., Wilkins S. M., Henriques B. M., 2019, MNRAS, 489, 4072
- Vizgan et al. (2022) Vizgan D., et al., 2022, ApJ, 929, 92
- Walter et al. (2016) Walter F., et al., 2016, ApJ, 833, 67
- Wang et al. (2024) Wang T., et al., 2024, arXiv e-prints, p. arXiv:2403.02399
- Watson et al. (2015) Watson D., Christensen L., Knudsen K. K., Richard J., Gallazzi A., Michałowski M. J., 2015, Nature, 519, 327
- Weingartner & Draine (1999) Weingartner J. C., Draine B. T., 1999, ApJ, 517, 292
- Whitler et al. (2023) Whitler L., Stark D. P., Endsley R., Leja J., Charlot S., Chevallard J., 2023, MNRAS, 519, 5859
- Witstok et al. (2022) Witstok J., et al., 2022, MNRAS, 515, 1751
- Witstok et al. (2023) Witstok J., et al., 2023, arXiv e-prints, p. arXiv:2302.05468
- Xi et al. (2024) Xi H., et al., 2024, ApJ, 966, L36
- Zanella et al. (2018) Zanella A., et al., 2018, MNRAS, 481, 1976
- Zavala et al. (2018) Zavala J. A., et al., 2018, Nature Astronomy, 2, 56
- Zavala et al. (2024a) Zavala J. A., et al., 2024a, arXiv e-prints, p. arXiv:2403.10491
- Zavala et al. (2024b) Zavala J. A., et al., 2024b, ApJ, 977, L9
- Zhukovska (2014) Zhukovska S., 2014, A&A, 562, A76
- Zhukovska et al. (2016) Zhukovska S., Dobbs C., Jenkins E. B., Klessen R. S., 2016, ApJ, 831, 147
- Ziparo et al. (2023) Ziparo F., Ferrara A., Sommovigo L., Kohandel M., 2023, MNRAS, 520, 2445
- da Cunha et al. (2015) da Cunha E., et al., 2015, ApJ, 806, 110
- van Leeuwen et al. (2024) van Leeuwen I. F., et al., 2024, MNRAS, 534, 2062
Appendix A The metallicity diagnostic
As discussed in Section 3.4, we use different metallicity indicators for our sample, depending on the availability of dust corrections, and whether the relevant line ratio falls within a previously calibrated range. While this ensures we use the ‘most robust’ metallicity diagnostic on a case-by-case basis, the various diagnostics each have their own systematic uncertainties (e.g., Kewley & Ellison 2008). To address this problem, we merge Figures 4 and 5 into one, and this time adopt a single, standardized metallicity indicator for the REBELS-IFU sample: (Fig. 6).
We note that for our four targets at , we cannot apply any dust corrections to the emission line fluxes as H has redshifted out of the NIRSpec coverage. As a result, metallicities inferred from are taken to be lower limits for these four galaxies, as [O ii]3727,29 will be more attenuated than [O iii]5007. Consequently, this results in upper limits on the dust-to-metal ratios for these sources.
As can be seen from Fig. 6, our conclusions remain unchanged by adopting the metallicity diagnostic: dust-to-gas and dust-to-stellar mass ratios are not affected, and in fact the lower average metallicities inferred using yield a higher DtG at fixed metallicity compared to our fiducial analysis. As before, we find a more or less flat relation between DtG and metallicity, and therefore a tentative decrease between DtM and , albeit now across a more limited dynamic range.
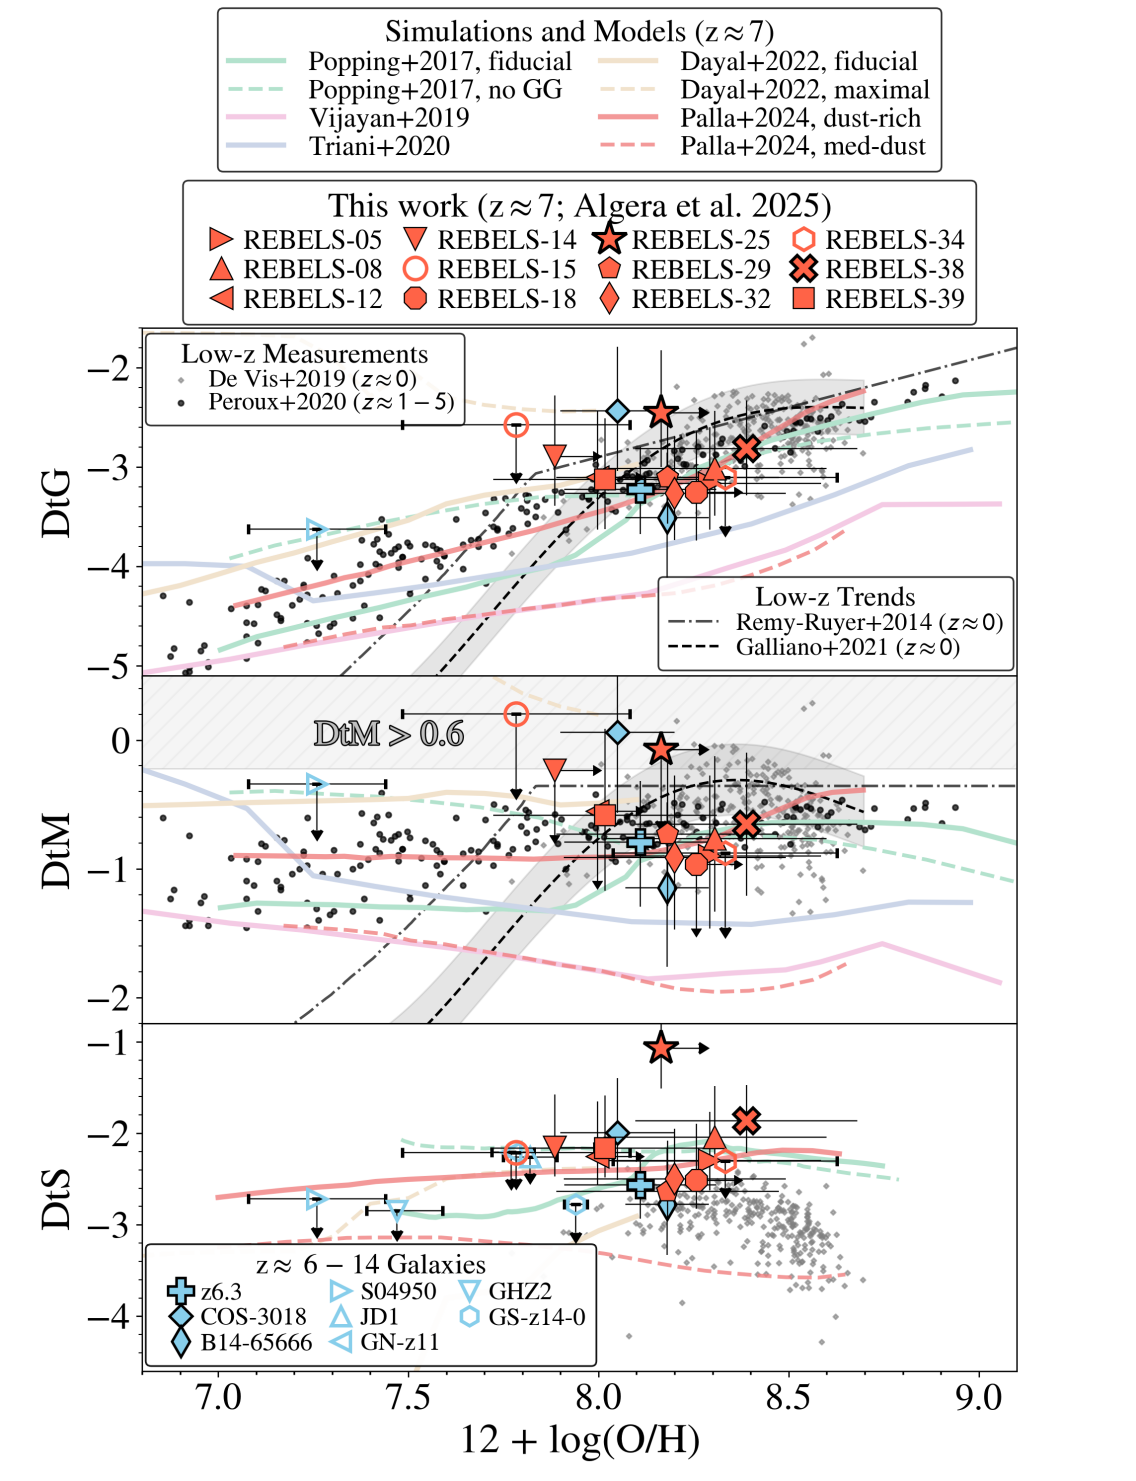
Appendix B Literature samples with Dust, Gas and Metal Observations at
While REBELS-IFU is the first homogeneously-selected sample with observations of cold gas (through [C ii]), dust (ALMA continuum) and metals (JWST/NIRSpec) at , a few individual galaxies at this epoch have amassed similarly detailed observations. We note that, even when such measurements all exist in the literature, in most cases they have not been analyzed in the context of scaling relations between dust and metals (the exceptions are presented in Heintz et al. 2023b and Valentino et al. 2024), and we thus present this analysis for the first time here.
We provide details on the literature sample below, in order of increasing redshift. For [C ii]-detected galaxies, we adopt to maintain consistency with the REBELS-IFU sample. We note that no galaxies beyond have currently been detected in [C ii] or dust emission (c.f., Tamura et al. 2019; Bakx et al. 2020; Fujimoto et al. 2024b), and for galaxies at these early cosmic times we thus have no detailed information on their gas contents, and are furthermore limited to upper limits on their dust-to-stellar mass ratios.
RXCJ0600-z6.3 (hereafter z6.3; also known as the ‘Cosmic Grapes’) is a gravitationally lensed galaxy at first identified through its bright [C ii] emission in the ALMA Lensing Cluster Survey (Fujimoto et al., 2021; Laporte et al., 2021). It was recently studied with JWST, leading to an accurate measurement of its stellar mass [, where is the magnification due to gravitational lensing] (Giménez-Arteaga et al., 2024) and metallicity [] (Fujimoto et al., 2024a).999As we are interested in ratios of various quantities, such as the dust-to-stellar mass ratio, any uncertainties due to lensing magnification cancel out. Moreover, Valentino et al. (2024) used multi-band ALMA observations to robustly constrain the dust mass of z6.3 to be .
COS-3018 is a Lyman-break galaxy at , first identified through its high [O iii]4959,5007 + H equivalent width by Smit et al. (2014). It was detected in [C ii] and underlying dust continuum emission by Smit et al. (2018), while Witstok et al. (2022) determined its dust mass leveraging a stringent non-detection of its continuum emission in ALMA Band 8. For consistency with the REBELS-IFU sample analyzed in this work, we adopt the dust mass from Algera et al. (2024a) who refitted the SED of COS-3018 to find . Recently, Scholtz et al. (2024) undertook a detailed study of COS-3018 using NIRSpec observations from the GA-NIFS program, finding the galaxy to consist of three separate components. Scholtz et al. (2024) measure the total stellar mass of the system to be , while its metallicity ranges from . Since we focus on the global properties of COS-3018 in this work, we adopt an average value of , with the uncertainty representing the observed spread between the components.
B14-65666, also known as the ‘Big Three Dragons’, is a UV-luminous merging galaxy system at first photometrically identified through ground-based imaging by Bowler et al. (2014), and subsequently studied in detail with both ALMA and later the JWST in various works (Bowler et al., 2018; Hashimoto et al., 2019; Sugahara et al., 2021, 2024; Jones et al., 2024). Relevant for our analysis is the [C ii] detection by Hashimoto et al. (2019), from which we obtain a gas mass estimate (see also Hashimoto et al. 2023). B14-65666 is moreover continuum-detected in three ALMA bands (Sugahara et al., 2021), which Algera et al. (2024a) re-fit to obtain a dust mass of . We adopt the stellar mass of B14-65666 from Sugahara et al. (2024), who measure . Finally, Jones et al. (2024) find that the global metallicity of B14-65666 ranges from , depending on which metallicity diagnostic is adopted. We simply adopt the average here with the uncertainty spanning the possible range, i.e., .
S04950 is a gravitationally lensed galaxy at studied by Heintz et al. (2023b) and Fujimoto et al. (2024b). It was initially spectroscopically confirmed by JWST/NIRSpec, which also yielded a metallicity measurement of (Fujimoto et al., 2024b). S04950 was thereafter targeted in both [C ii] and [O iii]88 emission with ALMA, yielding a tentative [C ii] detection and an upper limit on its dust mass of (Fujimoto et al., 2024b). We moreover adopt the (magnified) stellar mass from their work of (see also Giménez-Arteaga et al. 2023).
MACS1149-JD1, hereafter JD1, is a gravitationally lensed galaxy at first spectroscopically confirmed through its [O iii]88 emission by Hashimoto et al. (2018). Deeper observations of the [O iii] line were presented by Tokuoka et al. (2022), who also measured a sensitive upper limit on the dust continuum emission of JD1. They do not, however, provide an upper limit on the dust mass of JD1, and we therefore derive one assuming a temperature of as we did for the REBELS-IFU sample to obtain after accounting for gravitational magnification (, following Hashimoto et al. 2018). Given that dust temperatures may increase with redshift (e.g., Sommovigo et al. 2022a; Mitsuhashi et al. 2024), this is likely a conservative upper limit. [C ii] emission from JD1 was targeted but not detected by Laporte et al. (2019). We adopt the stellar mass measurement of JD1 by Marconcini et al. (2024) of , and use the metallicity measured by Morishita et al. (2024) of .
GN-z11 is a UV-luminous Lyman-break galaxy at (Oesch et al., 2016; Bunker et al., 2023). Its [C ii] and underlying dust continuum emission were recently targeted by Fudamoto et al. (2024) using the Northern Extended Millimeter Array (NOEMA), though neither was detected. As a result, Fudamoto et al. (2024) inferred an upper limit of on the dust mass of GN-z11. We adopt the stellar mass measured by Tacchella et al. (2023) [], while we use the metallicity from Bunker et al. (2023) of .
GHZ2 is another UV-luminous galaxy at , first spectroscopically confirmed by JWST using both its NIRSpec and MIRI instruments (Castellano et al., 2024; Zavala et al., 2024a). It was subsequently detected in [O iii]88 emission by Zavala et al. (2024b) using ALMA, while the dust continuum in GHZ2 remained undetected. These sensitive dust continuum observations will be the subject of Mitsuhashi et al. (in prep), and in our analysis we therefore use the less sensitive ALMA continuum observations of GHZ2 presented in Bakx et al. (2023). We furthermore adopt a stellar mass of from Castellano et al. (2024) and a metallicity of from Calabro et al. (2024).
JADES-GS-z14-0, hereafter GS-z14-0, is currently the most distant galaxy known at . Following its spectroscopic confirmation with NIRSpec (Carniani et al., 2024a), it was detected in [O iii]88 emission with ALMA (Carniani et al., 2024b; Schouws et al., 2024). These observations also yielded an upper limit on the dust mass of GS-z14-0 of . We adopt the stellar mass [] and metallicity [] of GS-z14-0 as measured by Carniani et al. (2024b) (see also Helton et al. 2024).