Nuclear level density of 128Te from scattering and complementary photonuclear data
Abstract
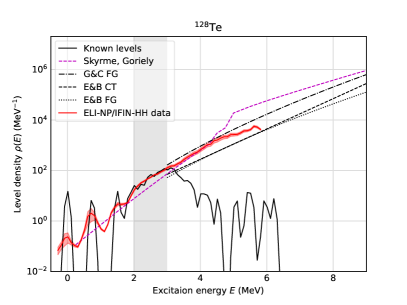
We have extracted the nuclear level density of 128Te from a scattering experiment using the large-volume LaBr3:Ce and CeBr3 detectors from ELI-NP at the 9 MV Tandem facilities at IFIN-HH. The decay data were normalised using photonuclear data, resulting in nuclear level densities without intrinsic model dependencies from the constant temperature or Fermi gas models. The measured nuclear level density follows closely between the expectations from these two models, but we observe a clear divergence from a microscopic model based on the Skyrme force.
-
February 5, 2025
1 Introduction
Statistical nuclear properties, like -ray strength functions and nuclear level densities, are important measurable observables determining reaction rates for applications like nuclear reactor technologies and criticality, processing of spent nuclear fuel, and nuclear astrophysics. These observables serve as input to the statistical model that describes the atomic nucleus at energies and temperatures where discrete states start to overlap due to their natural widths and can not be treated as separate energy states anymore. For a recent overview of the current experimental and theoretical status of NLDs and SF, see Reference [1]. Several different traditional methods exist for NLD measurements. These include the well-established Oslo method [2, 3, 4, 5], evaporation spectra of protons [6] or neutrons [7], or high-energy scattering with magnetic spectrometers [8].
Another interesting opportunity for experimental studies of NLDs and SFs is the projected -ray beams at the Extreme Light Infrastructure – Nuclear Physics (ELI-NP) [9, 10, 11, 12, 13]. While charged-particle probes populate an extensive range of states, electromagnetic probes consisting of narrow bandwidth rays for photoexcitation and decay studies have high selectivity in excitation energy, spin, and parity of the ensemble of excited states. This has been explored in depth in pioneering work at the High-Intensity -ray Source (HIS) facility at the Triangle Universities Nuclear Laboratory (TUNL), Duke University, North Carolina, using the technique [14], meaning inelastic scattering of incoming polarised photons, , with a two-step decay as and to extract SFs directly. Due to the properties of the -ray beams, the SFs could be explicitly selected from electric dipole states and, also, for well-defined excitation energies providing the potential for a sensitive test of the Brink-Axel hypothesis [15, 16], that the SFs are independent of the excitation energy in the statistical region and only depend on the energy difference between the initial and final states.
While the -ray beams at ELI-NP are under implementation, a complementary scientific program has been started at the charged particle accelerator facilities at the Horia Hulubei Institute for Physics and Nuclear Engineering (IFIN-HH), in particular at the 9 MV Tandem accelerator facilities. In this programme, we utilise the instrumentation from ELI-NP, especially the ELI Gamma Above Neutron Threshold (ELIGANT) instruments [17, 18] and other setups in the existing ELI-NP and IFIN-HH infrastructure. One of the primary campaigns has been utilising the ROmanian array for SPectroscopy in HEavy ion REactions (ROSPHERE) [19] infrastructure and detection system in combination with the large-volume LaBr3:Ce and CeBr3 detectors for a system dedicated to high-energy rays. This special version of ROSPHERE [20] has already succeeded in detailed studies of light nuclei and high-energy resonant states in medium-mass nuclei [21, 22, 23, 24, 25, 26, 27]. In addition to these experiments, an experiment dedicated to NLDs and SFs on 112,114Sn was performed in 2023 as a proof-of-concept for measurements of statistical properties with the Oslo method at IFIN-HH [28], and to follow up a recent systematic study of the statistical properties of the Sn chain [29, 30, 31, 32, 33]. In 2024, a follow-up of the 2023 experiment was performed at the IFIN-HH to verify the consistency between data obtained from charged particle beams and -ray beams for the nucleus 128Te for SFs within the context of the results from Reference [14]. While the details of this data set are still under analysis, interesting results were obtained when applying the methodology to NLDs, which will be reported here.
2 Experiment
The experiment was conducted at the IFIN-HH 9 MV Tandem facilities in Măgurele, Romania, in the spring of 2024. The experimental setup consisted of using a combination of the ELIGANT Gamma Neutron (ELIGANT-GN) large-volume LaBr3:Ce, and CeBr3 detectors [17, 18] mounted in the mechanical frame and inside the bismuth germanate (BGO) shields of the ROSPHERE [19], a configuration that has been previously reported in detail in Reference [20]. The total angular coverage of the scintillators in this configuration was 11.95% of the solid angle. In addition to the -ray detectors, a charged-particle detector array consisting of silicon-strip detectors of the type Micron S7 with thicknesses of 65 m and 1000 m, respectively, was placed in a configuration in the backward direction. These detectors were placed at a distance of 28 mm from the target for the thin detector and 44 mm from the target for the thick detector, providing an angular coverage of 122∘-136∘ in the overlap region relative to the target.
The -ray detection part of the setup consisted of 20 LaBr3:Ce and CeBr3 detectors from ELI-NP optimised for high-energy -rays and four high-purity germanium (HPGe) detectors for high-resolution spectroscopy of low-energy transitions to quantify background and verify the spin distributions of the excited states for different excitation energies. For calibration of the -ray detectors simple radioactive sources of 137Cs, 60Co, and 56Co were used for low energies and time alignments. In the high-energy region composite sources consisting of plutonium-beryllium (PuBe) [34] inside of a sphere filled with a nickel-paraffin mixture [35] were used, providing two energy calibration points at 4.44 MeV and 9 MeV. The silicon detectors were aligned using a standard three- source consisting of 239Pu, 241Am, and 244Cm, as well as from elastic scattering of the protons using the in-beam data.
The target was 1.7 mg/cm2 evaporated on a 30 g/cm2 backing of diamond-like carbon. The isotopic purity of the target was 98.2(2)% 128Te with the largest impurity contribution from 130Te (1.25%), 126Te (0.37%), and 125Te (0.11%) while other isotopes of Te contributed with % each. On this target, a proton beam with an energy of 14 MeV and a typical beam current of nA impinged, and the data were collected for 70 h. The limiting factor in these measurements was the count rate in the BGO detectors. Thus, they were disabled in the data acquisition (DAQ). The DAQ system was fully digital with the LaBr3:Ce and CeBr3 detectors read out using CAEN V1730 digitisers running Digital Pulse Processing for Charge Integration and Pulse Shape Discrimination (DPP-PSD) firmware, and the silicon detectors as well as the HPGe detectors read out by CAEN V1725 digitisers running Digital Pulse Processing for Pulse Height Analysis (DPP-PHA) firmware.
3 Analysis
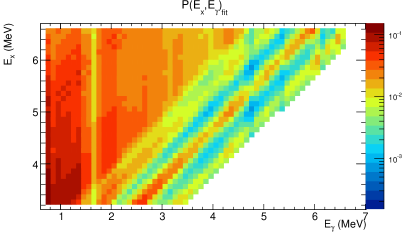
The LaBr3:Ce, CeBr3, and silicon detectors were calibrated in energy and time-aligned using the sources described in Section 2. After calibration, the telescopes selected events corresponding to scattered protons. The angle of each scattered proton, , was determined from the layer, and the energy of the proton, , was measured as the sum . Given , the excitation energy of the nucleus, , was calculated from the energy of an elastically scattered proton, , as . The -ray spectra from the LaBr3:Ce and CeBr3 detectors were then extracted for each value of and arranged in a two-dimensional matrix as shown in Figure 1.
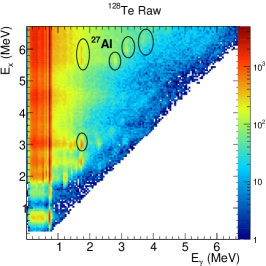
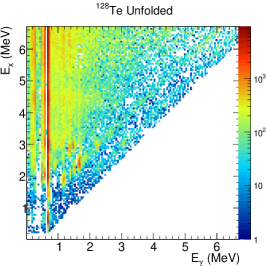
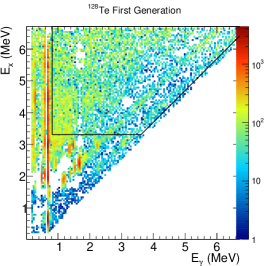
Some discrete peaks identified as background from 27Al have been highlighted and subtracted in the unfolding step, discussed later in this text. Note that these -ray spectra also contain the response function of the LaBr3:Ce and CeBr3 detectors and, as we are working in the quasi-continuum region, this response needs to be unfolded from the spectra. For this purpose, the iterative unfolding procedure [3, 36, 28] was applied using the simulated detector response from Geant4 [37] implemented in an in-house developed software, Geant4 and ROOT Object-Oriented Toolkit (GROOT) [38], as shown in Figure 1. As the decay probability of an excited state only depends on the NLD at the final energy, of the first transition and the value of the SF for the energy difference , all contributions from cascading transitions were subtracted using the first-generation methodology described in detail in References [2, 4, 5], providing the so-called first generation matrix shown in Figure 1.
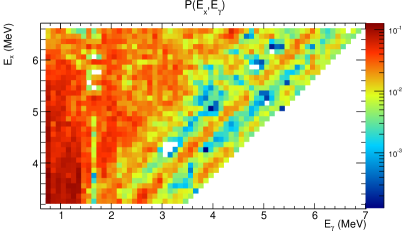
As we are interested in the quasi-continuum, a specific area of the matrix where the nucleus is expected to follow a statistical behaviour was selected for further analysis, shown in Figure 1 and Figure 2, and the -ray spectra were normalised such that each bin in the selected region would correspond to the decay probability , for a -ray energy of from an excited state with energy , as . Due to the carbon backing of the target, a significant background from the first excited state in 12C was present in the data. However, despite the excitation energy of this state at 4.44 MeV, due to the different reaction kinematics, the background appears at a reconstructed excitation energy of MeV. Thus, we have limited the high-energy range to below this background.
To extract the functional forms of the NLD and the SF, a fitting procedure was carried simultaneously over all excitation energies and -ray energies in the selected region [2, 3, 4, 5]
| (1) |
where is the NLD at the final state and are the transmission coefficients and they are related to the SF, , is via the relation,
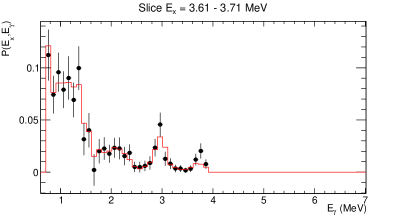
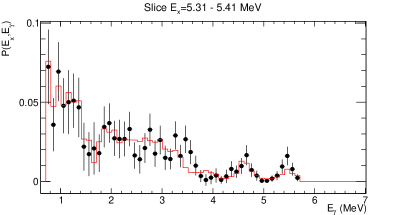
| (2) |
where is the multipolarity of the ray and we assume , corresponding to complete dipole domination, and correspond to either electric (E) or magnetic (M) transitions. The result of this fit is shown in Figure 2, together with two projections at selected energies to highlight the agreement between the fit and the experimental data. At this point, we evaluate the systematic uncertainties that can originate from the data processing as well as assumptions required for the method to work, from the reduced by taking the number of degrees of freedom (NDF) into account such that . The methodological systematic uncertainties could, for example, include the validity of the Brink-Axel hypothesis that the SFs are independent of and, thus, that a unique SF will fit all the data. Here, we include these uncertainties and the statistical uncertainties in the analysis. We note that around MeV, there is an oversubtraction originating from the first-generation procedure, likely originating from a small 27Al background. This over-subtraction will propagate into the SF evaluation as an artificial dip. However, as the NLD contains the sum over all possible energies, it will not introduce any artificial features.
It is well known that the Oslo method only gives the functional form of the NLDs and SFs, while there are an infinite number of possible and that can satisfy the fit in Equation (1). The relation between these possible and is given by three parameters, , , and , as [2, 3, 4, 5],
| (3) | |||
| (4) |
By extracting from the measured results, we have obtained one pair of solutions for and . By normalising the solution to the data [39], we can extract the parameters , corresponding to the absolute values, and , corresponding to the slope, from equation (4), shown in Figure 3. With the slope known, we can fix the absolute value of the nuclear level densities, parameter , from the complete spectroscopy of known states in the energy range 2-3 MeV, also shown in Figure 3 and listed in Table 1, under the assumption that the SF from the data, mainly populating a very sharp spin () and parity () distribution with , is close enough to the SF from higher spin states populated in inelastic scattering.
| Energy | NLD | Energy | NLD | Energy | NLD | Energy | NLD |
|---|---|---|---|---|---|---|---|
| (MeV) | (MeV-1) | (MeV) | ( MeV-1) | (MeV) | ( MeV-1) | (MeV) | ( MeV-1) |
| -0.2875 | 0.069(22) | 1.3125 | 0.204(24) | 2.9125 | 1.043(10) | 4.5125 | 1.61(28) |
| -0.1875 | 0.11(4) | 1.4125 | 0.336(4) | 3.0125 | 1.30(14) | 4.6125 | 1.91(34) |
| -0.0875 | 0.21(11) | 1.5125 | 0.471(7) | 3.1125 | 1.49(16) | 4.7125 | 2.16(4) |
| 0.0125 | 0.24(10) | 1.6125 | 0.454(5) | 3.2125 | 1.53(16) | 4.8125 | 2.17(31) |
| 0.1125 | 0.138(27) | 1.7125 | 0.471(4) | 3.3125 | 1.83(20) | 4.9125 | 2.62(4) |
| 0.2125 | 0.106(13) | 1.8125 | 0.535(4) | 3.4125 | 2.12(25) | 5.0125 | 2.64(34) |
| 0.3125 | 0.0941(8) | 1.9125 | 0.98(8) | 3.5125 | 2.74(4) | 5.1125 | 2.68(30) |
| 0.4125 | 0.18(20) | 2.0125 | 1.72(15) | 3.6125 | 3.33(5) | 5.2125 | 3.07(33) |
| 0.5125 | 0.43(9) | 2.1125 | 2.42(19) | 3.7125 | 3.99(6) | 5.3125 | 3.69(4) |
| 0.6125 | 1.52(8) | 2.2125 | 3.22(22) | 3.8125 | 4.75(8) | 5.4125 | 3.75(35) |
| 0.7125 | 2.0(11) | 2.3125 | 3.80(25) | 3.9125 | 5.36(8) | 5.5125 | 4.15(4) |
| 0.8125 | 1.63(6) | 2.4125 | 4.65(25) | 4.0125 | 6.7(11) | 5.6125 | 5.62(5) |
| 0.9125 | 0.84(13) | 2.5125 | 5.45(29) | 4.1125 | 8.3(14) | 5.7125 | 5.22(5) |
| 1.0125 | 0.48(4) | 2.6125 | 6.63(4) | 4.2125 | 10.4(19) | 5.8125 | 4.21(29) |
| 1.1125 | 0.381(20) | 2.7125 | 7.31(6) | 4.3125 | 10.9(18) | ||
| 1.2125 | 0.713(5) | 2.8125 | 8.85(7) | 4.4125 | 15.1(30) |
4 Discussion
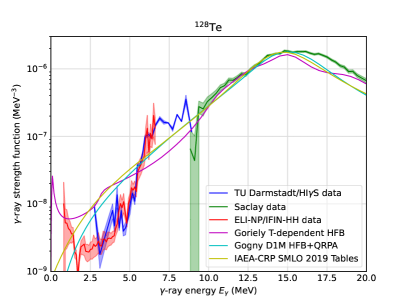
The overall agreement between the shape of the SF from the data [39] is shown in Figure 3. Note that since the data were used for normalisation of the absolute magnitude and the total slope of the SF, only the relative shapes can be used to evaluate the consistency. For comparison, we also include the following microscopic calculations and parametrisations of the SFs as implemented in the TALYS [41, 42] code: the temperature-dependent Hartree-Fock-Bogolyubov (HFB) by Goriely [43], the HFB and Quasiparticle Random Phase Approximation (QRPA) calculations with the Gogny D1M interaction [44], and the simplified version of the modified Lorentzian (SMLO) function from the recommendations of the International Atomic Energy Agency (IAEA) Coordinated Research Project (CRP) on SFs [45, 46].
On the NLD side, the procedure described in Section 3 should provide us with the NLD directly from experimental data, without the need to invoke model-dependent extrapolations to the neutron separation energy, typically via the constant temperature or the Fermi gas model. Thus, comparing the experimental data presented here to these two common extrapolations would be interesting. The two models are simple phenomenological two-parameter models that are based on the observation of empirical nuclear properties. Here, we will use the formulation of these models presented in Reference [47].
The constant temperature model [48] is based on the observation that the number of nuclear levels typically increases with a simple exponential behaviour with increasing excitation energy, implying the nucleus stays at a constant temperature, , in the applicable energy range. This description is justified by the increased breaking of Cooper pairs with increasing excitation energy, keeping the mean energy per nucleon constant. Thus, the NLD as a function of and , in the constant temperature approximation, , can be expressed as
| (5) |
In addition to , a back-shift parameter, , has been introduced to adjust for the finite energy where the statistical properties dominate.
The Fermi gas NLD [47], , on the other hand, is justified considering the nucleus as a gas of non-interacting fermions within the nuclear volume and calculated the number of possibilities to distribute the excitation energy on these [49], considering single-particle states,
| (6) |
This expression also consists of two main parameters, the level density parameter and the Fermi back-shift parameter . In addition, the spin cut-off parameter, , is included explicitly in the expression (6). In fact, in both equations (5) and (6), the spin distribution has been considered independent from and separated into the function ,
| (7) |
Note that this energy independence of is an approximation, and in an actual nucleus, there indeed is a likely energy dependence of and, therefore, also on .
To compare the experimental data with the phenomenological descriptions in equations (5-7), we employed a selection of typical parametrisations of the data from Gilbert and Cameron [48], and von Egidy and Bucurescu [50]. The extraction of parameters for equations (5-7) was performed using the ROBIN code version 1.92 [51]. The obtained parameters are listed in Table 2 and the corresponding NLDs are shown in Figure 3.
| Model | |||||||
|---|---|---|---|---|---|---|---|
| MeV-1 | MeV | MeV | MeV | MeV | MeV-1 | ||
| G&C (FG) [48] | 0.78723 | 4.818 | |||||
| E&B (CT) [50] | 0.724 | 4.002 | |||||
| E&B (FG) [50] | 0.82556 | 4.414 |
In addition to the phenomenological models, the calculated results from the Reference Input Parameter Library (RIPL) calculated from the Skyrme force, as implemented in TALYS 1.95, are also shown [52].
5 Conclusion and outlook
We have extracted the nuclear level density of 128Te from a scattering experiment using the large-volume LaBr3:Ce and CeBr3 detectors from ELI-NP at the 9 MV tandem facilities at IFIN-HH. The decay data were normalised using photonuclear data, which provides nuclear level densities without intrinsic model dependencies from the constant temperature or Fermi gas models. The nuclear level density follows closely between the expectations from these two models, but we observe a clear divergence from the microscopic model based on the Skyrme force. Further work will include the in-depth study of the -ray strength functions from this data, in particular, to investigate how assumptions like the validity of the Brink-Axel hypothesis and the contribution from the spin distribution affect -ray strength-function results in both photonuclear data and charged particle data.
Acknowledgements
PAS, AK, RB, MB, CCo, NMF, AGa, RL, CMi, AS, DAT, AT, GVT, and SU were supported by the ELI-RO program funded by the Institute of Atomic Physics, Măgurele, Romania, contract number ELI-RO/RDI/2024-002 (CIPHERS) and SA, DLB, SRB, RC, and TP ELI-RO/RDI/2024-007 (ELITE). The remaining authors from ELI-NP acknowledge the support of the Romanian Ministry of Research and Innovation under research contract PN 23 21 01 06. This project has received funding from the European Union’s Horizon Europe Research and Innovation programme under Grant Agreement No 101057511 (EURO-LABS).
References
References
- [1] Wiedeking M and Goriely S 2024 Phil. Trans. R. Soc. A 382 20230125
- [2] Guttormsen M, Ramsøy T and Rekstad J 1987 Nucl. Instrum. Methods Phys. Res. A 255 518
- [3] Guttormsen M, Tveter T S, Bergholt L, Ingebretsen F and Rekstad J 1996 Nucl. Instrum. Methods Phys. Res. A 374 371
- [4] Schiller A, Bergholt L, Guttormsen M, Melby E, Rekstad J and Siem S 2000 Nucl. Instrum. Methods Phys. Res. A 447 498
- [5] Larsen A C et al 2011 Phys. Rev. C 83 034315
- [6] Voinov A V et al 2019 Phys. Rev. C 99 054609
- [7] Roy P et al 2021 Eur. Phys. J. A 57 48
- [8] Usman I et al 2011 Phys. Rev. C 84 054322
- [9] Filipescu D et al 2015 Eur. Phys. J. A51 185
- [10] Gales S, Balabanski D L, Negoita F, Tesileanu O, Ur C A, Ursescu D and Zamfir N V 2016 Phys. Scr. 91 093004
- [11] Gales S et al 2018 Rep. Prog. Phys. 81 094301
- [12] Tanaka K A et al 2020 Matter Radiat. Extremes 5 024402
- [13] Constantin P, Matei C and Ur C A 2024 Phys. Rev. Accel. Beams 27 021601
- [14] Isaak J et al 2019 Phys. Lett. B 788 225
- [15] Brink D M 1955 Some aspects of the interaction of fields with matter Ph.D. thesis University of Oxford Oxford, United Kingdom
- [16] Axel P 1962 Phys. Rev. 126 671
- [17] Camera F et al 2016 Rom. Rep. Phys. 68 S539
- [18] Söderström P A et al 2022 Nucl. Instrum. Methods Phys. Res. A 1027 166171
- [19] Bucurescu D et al 2016 Nucl. Instrum. Methods Phys. Res. A 837 1
- [20] Aogaki S et al 2023 Nucl. Instrum. Methods Phys. Res. A 1056 168628
- [21] Kuşoğlu A et al 2024 Nuovo Cimento C 47 47
- [22] Kuşoğlu A et al 2024 Phys. Rev. Lett. 133(7) 072502
- [23] Kuşoğlu A et al 2024 EPJ Web Conf. 311 00020
- [24] Kuşoğlu A 2024 Sci. Bull. 69 3303
- [25] Wieland O et al 2024 Nuovo Cimento C 47 24
- [26] Söderström P A et al 2024 Nuovo Cimento C 47 58
- [27] Sakanashi K et al 2024 EPJ Web Conf 306 01047
- [28] Söderström P A et al 2024 Statistical properties and photon strength functions of the 112,114Sn isotopes below the neutron separation threshold In manuscript. arXiv:2410.06907
- [29] Markova M et al 2021 Phys. Rev. Lett. 127 182501
- [30] Markova M et al 2022 Phys. Rev. C 106 034322
- [31] Markova M et al 2023 Phys. Rev. C 108 014315
- [32] Markova M et al 2024 Phys. Rev. C 109 054311
- [33] Markova M, von Neumann-Cosel P and Litvinova E 2025 Phys. Lett. B 860 139216
- [34] Söderström P A, Matei C, Capponi L, Açıksöz E, Balabanski D L and Mitu I O 2021 Appl. Radiat. Isot. 167 109441
- [35] Söderström P A et al 2023 Appl. Radiat. Isot. 191 110559
- [36] Söderström P A et al 2019 J. Instrum. 14 T11007
- [37] Agostinelli S et al 2003 Nucl. Instrum. Methods Phys. Res. A 506 250
- [38] Lattuada D et al 2017 EPJ Web Conf. 165 01034
- [39] Isaak J et al 2021 Phys. Rev. C 103 044317
- [40] Leprêtre A, Beil H, Bergére R, Carlos P, Fagot J, Miniac A D, Veyssiére A and Miyase H 1976 Nucl. Phys. A 258 350
- [41] Koning A J, Hilaire S and Duijvestijn M C 2008 TALYS-1.0 Proceedings of the International Conference on Nuclear Data for Science and Technology vol 211 ed Bersillon O, Gunsing F, Bauge E, Jacqmin R and Leray S (EDP Sciences) p 058
- [42] Koning A J and Rochman D 2012 Nucl. Data Sheets 113 2841
- [43] Hilaire S, Girod M, Goriely S and Koning A J 2012 Phys. Rev. C 86 064317
- [44] Goriely S, Hilaire S, Péru S and Sieja K 2018 Phys. Rev. C 98 014327
- [45] Kawano T et al 2020 Nucl. Data Sheets 163 109
- [46] Goriely S et al 2019 Eur. Phys. J. A 55 172
- [47] von Egidy T, Schmidt H H and Behkami A N 1988 Nucl. Phys. A 481 189
- [48] Gilbert A and Cameron A G W 1965 Can. J. Phys. 43 1446
- [49] Bethe H A 1936 Phys. Rev. 50 332
- [50] von Egidy T and Bucurescu D 2009 Phys. Rev. C 80 054310
- [51] Guttormsen M 2022 ROBIN, in OsloSoftware https://github.com/oslocyclotronlab/oslo-method-software, DOI: 10.5281/zenodo.6024876
- [52] Goriely S, Tondeur F and Pearson J M 2001 Atom. Data Nucl. Data Tables 77 311