At low temperatures, glass-forming liquids relax in a simple way
Abstract
Glass-forming liquids have only a modest tendency to crystallize and hence their dynamics can be studied even below the melting temperature. The relaxation dynamics of most of these liquids shows at a temperature , somewhat above the glass-transition temperature , a crossover, which indicates the conjunction of two different dynamical regimes. For temperatures slightly above , experiments and computer simulations have extensively probed this dynamics on the particle level and identified several universal scaling laws that are often compatible with theoretical predictions. Using large scale computer simulations we extend these studies to temperatures below and find that the relaxation mechanism is qualitatively different from the one found at higher temperatures. We identify new scaling laws that allow to give a simple description of the relaxation dynamics at very low s. Specifically we reveal that the cage-escape process is related to rare but large particle displacements that give rise to a distinctive sub-diffusive power-law in the time correlation functions. This insight helps to advance our understanding on the relaxation dynamics of glass-forming systems at temperatures that are close to the experimental glass transition.
In the last decade impressive advancement in our understanding of glassy systems has been made, progress that was triggered by novel theoretical tools like machine learning, advanced simulation techniques, as well as experimental methods that have allowed to probe the static and dynamic properties of supercooled liquids and glasses in unprecedented details [1, 2, 3, 4]. These studies have permitted to reach, on the particle level, a satisfying understanding of the relaxation dynamics of glassy systems for temperatures that are around or above the critical temperature of Mode-Coupling Theory (MCT) [5]. Much less is known, however, about the dynamics below , since at these temperatures the relaxation times are usually by many orders of magnitude larger than the vibrational ones, making it very challenging to examine the details of the -relaxation. (Although network glass-formers can be simulated also below [6], their relaxation dynamics is very different from the one of fragile glass-formers [7, 8, 9].) Also from the theoretical side the sub- regime is not studied well, since it is difficult to make analytical predictions that go beyond the ones made by the simplest version of MCT [10, 11, 12]. Although there is consensus that close to and below the divergence of the relaxation time as predicted by MCT must be cut off, the details of the process governing the -relaxation, often called “hopping process” [13, 14, 15], have not been elucidated so far. The goal of the present work is thus to investigate the relaxation dynamics in this temperature regime on the level of the particles. We find that around and below this dynamics displays universal aspects that make it surprisingly simple, a result that will allow to advance our theoretical understanding of deeply supercooled liquids.
System
Our system is a binary Lennard-Jones mixture that has been often used in the past to study the relaxation dynamics of simple glass-formers [16]. We use a slight modification of the interaction parameters which suppresses crystallization [17], but does not affect the (above ) relaxation dynamics, thus the critical temperature remains around [16]. The number of particles is 32.400 and the simulations were done at constant volume, with being the lowest investigated temperature. At the lowest s, the length of the runs was time-steps, and we averaged over 4 independent samples.
More details on the simulations are given in the SI. In the following we discuss the dynamics of the larger particles since they are in the majority (80%).
Results
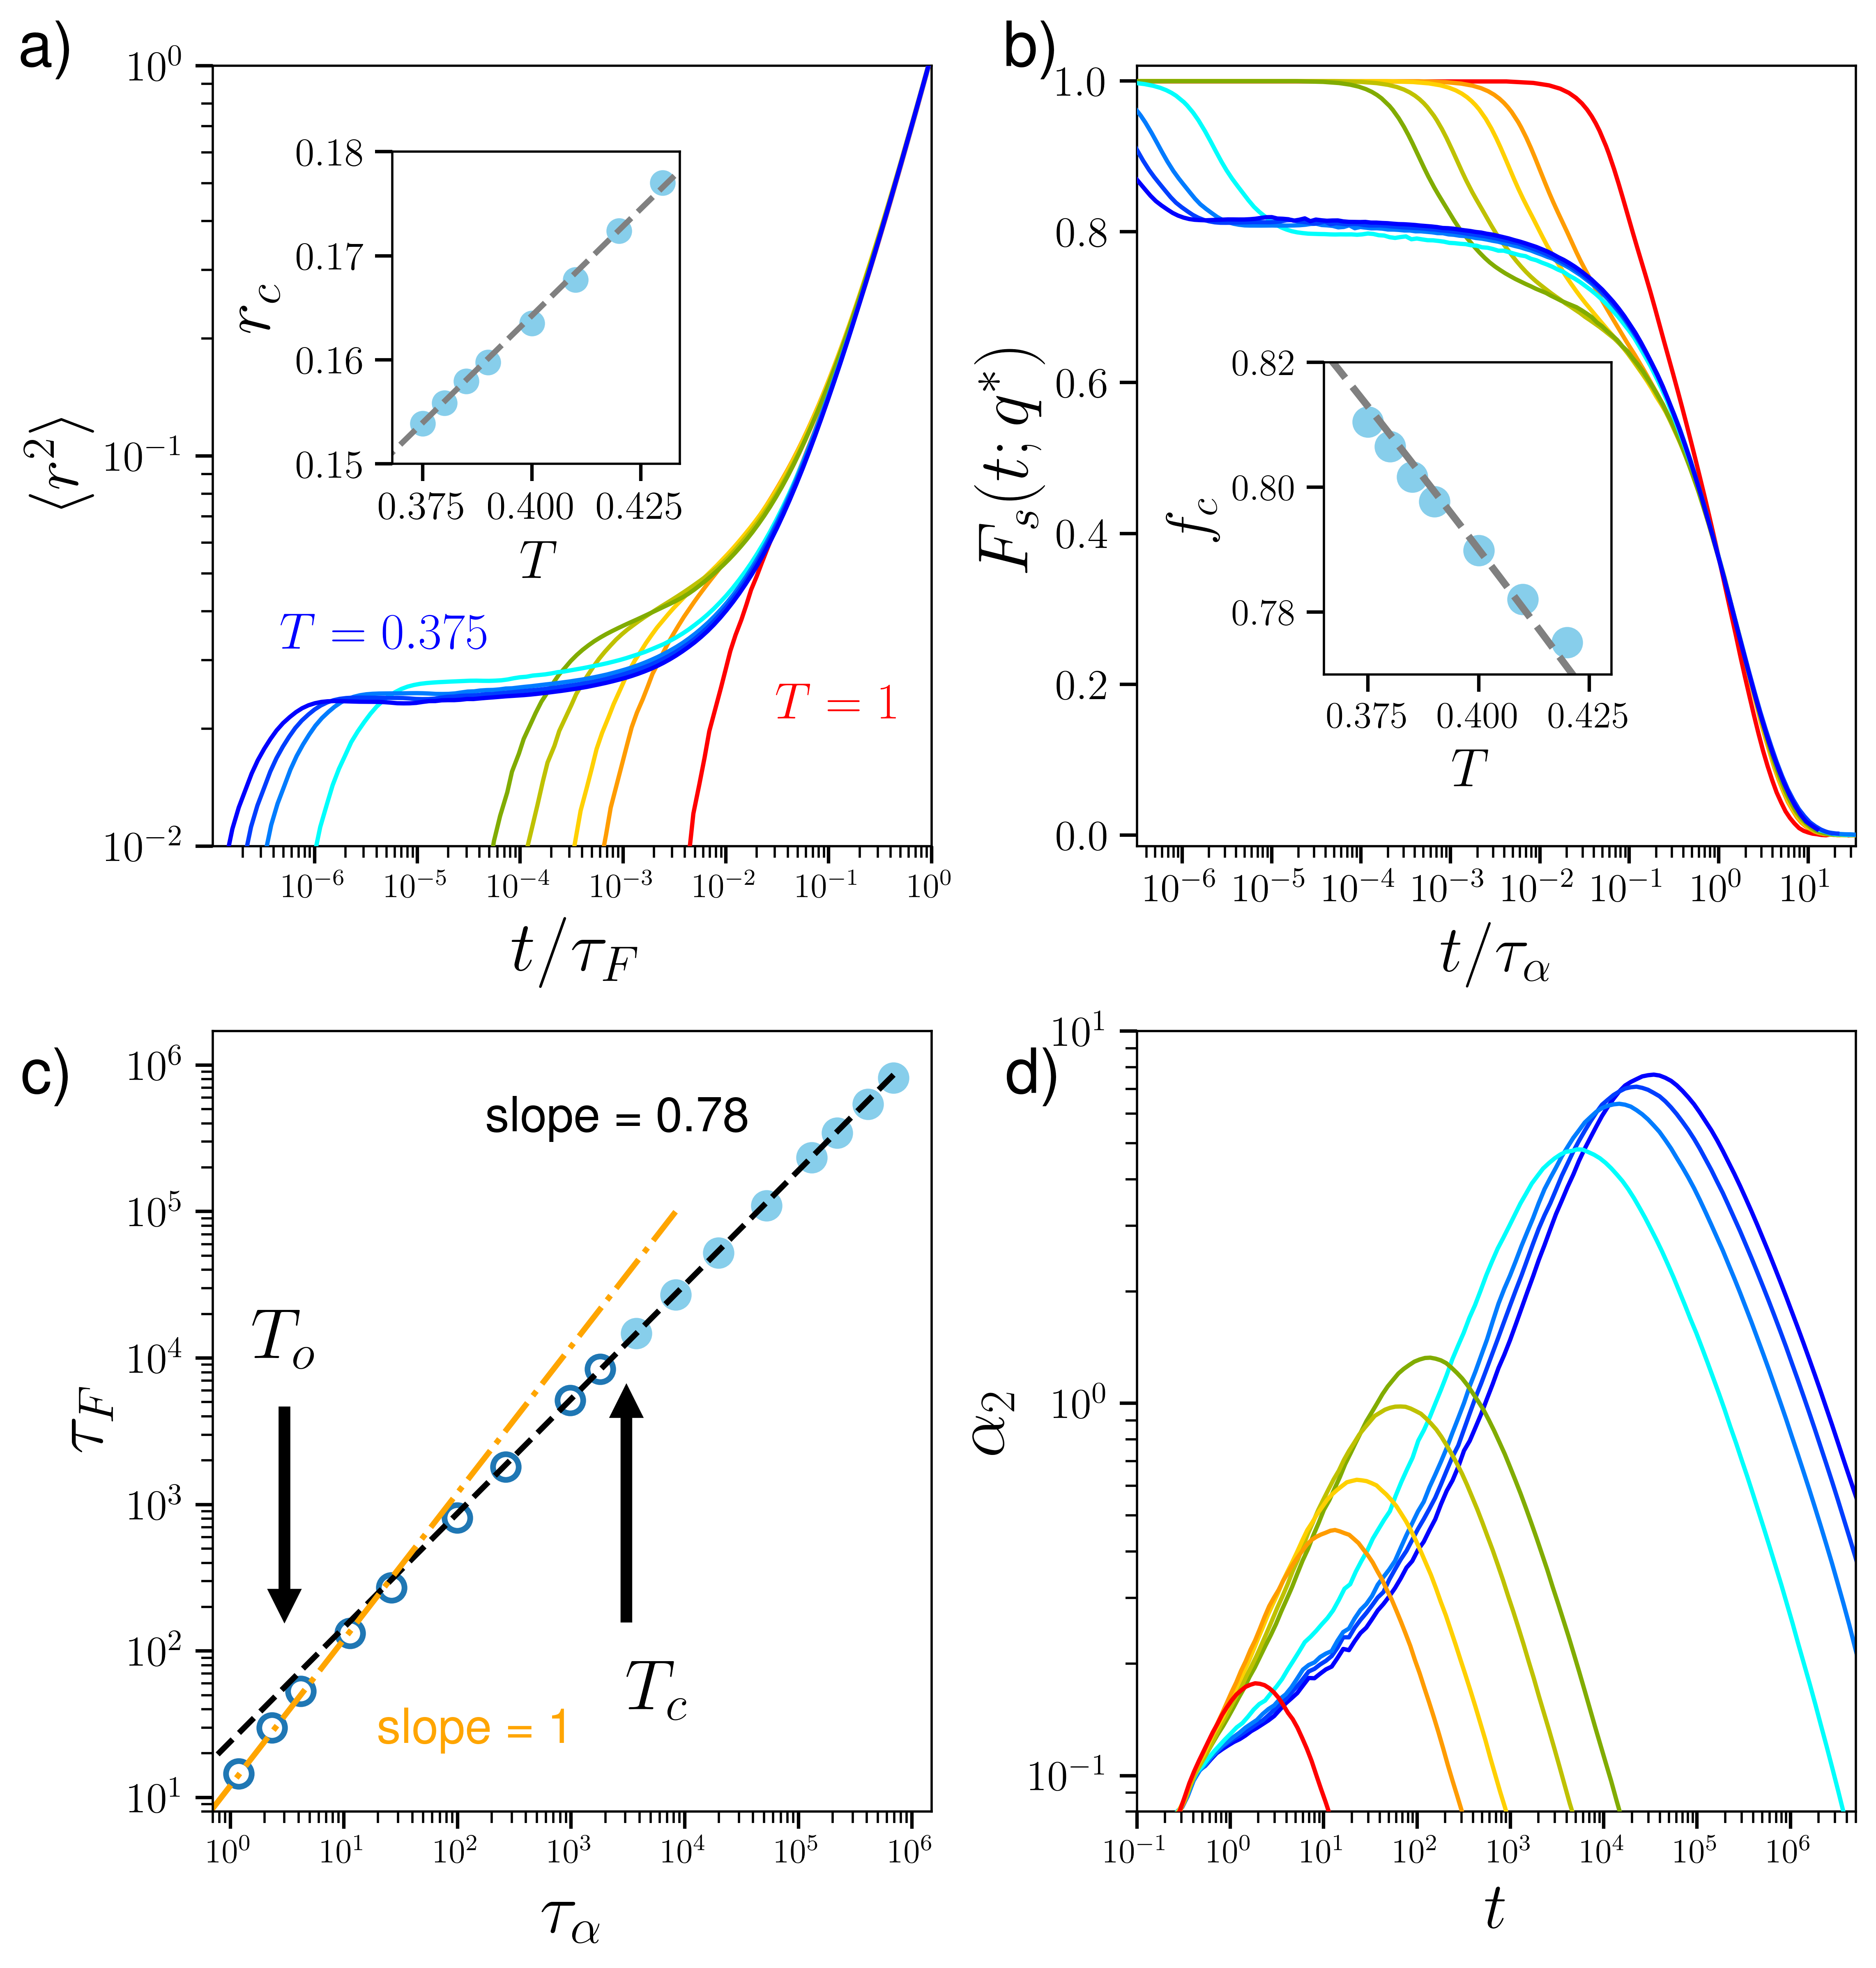
Figure 1a presents , the Mean Squared Displacement (MSD) of a particle, as a function of the rescaled time , where the Fickian time scale [20] is defined as , with the diffusion constant obtained from the MSD at long times.
By construction, this rescaling makes that in the diffusive regime all MSD’s fall on a master curve. For ’s slightly above , data follow a master curve also in the time range in which the particles start to leave the plateau, i.e., at the end of the caging regime. This behavior is compatible with MCT which predicts a -dependence of the form , with cage size and exponent , both independent from .
Previous fitting results [21] indicated and , fully compatible with the present results.
Interestingly, one finds that for temperatures below the MSD’s no longer fall onto a master curve, indicating that the escape of the particles from the cage is related to a microscopic mechanism that differs from the one at higher ’s. The height of the plateau, i.e., the size of the cage, now depends on , see Inset of panel (a). This dependence is linear in , at variance with the -dependence expected for a harmonic system. Hence one concludes that, despite the fact that the particles are trapped for a significant amount of time, the cage has a significant anharmonic shape [15], in agreement with previous studies on the configurational entropy [22] and with the result that corresponds to a transition in the dynamic exploration of the potential energy landscape [23, 24].
Panel (b) shows that also the Self-Intermediate Scattering Function (SISF) plotted versus the -relaxation time , displays the same qualitative scenario emerging from panel (a). In agreement with MCT, the curves at intermediate s fall onto a master curve with a decay from a plateau that is well described
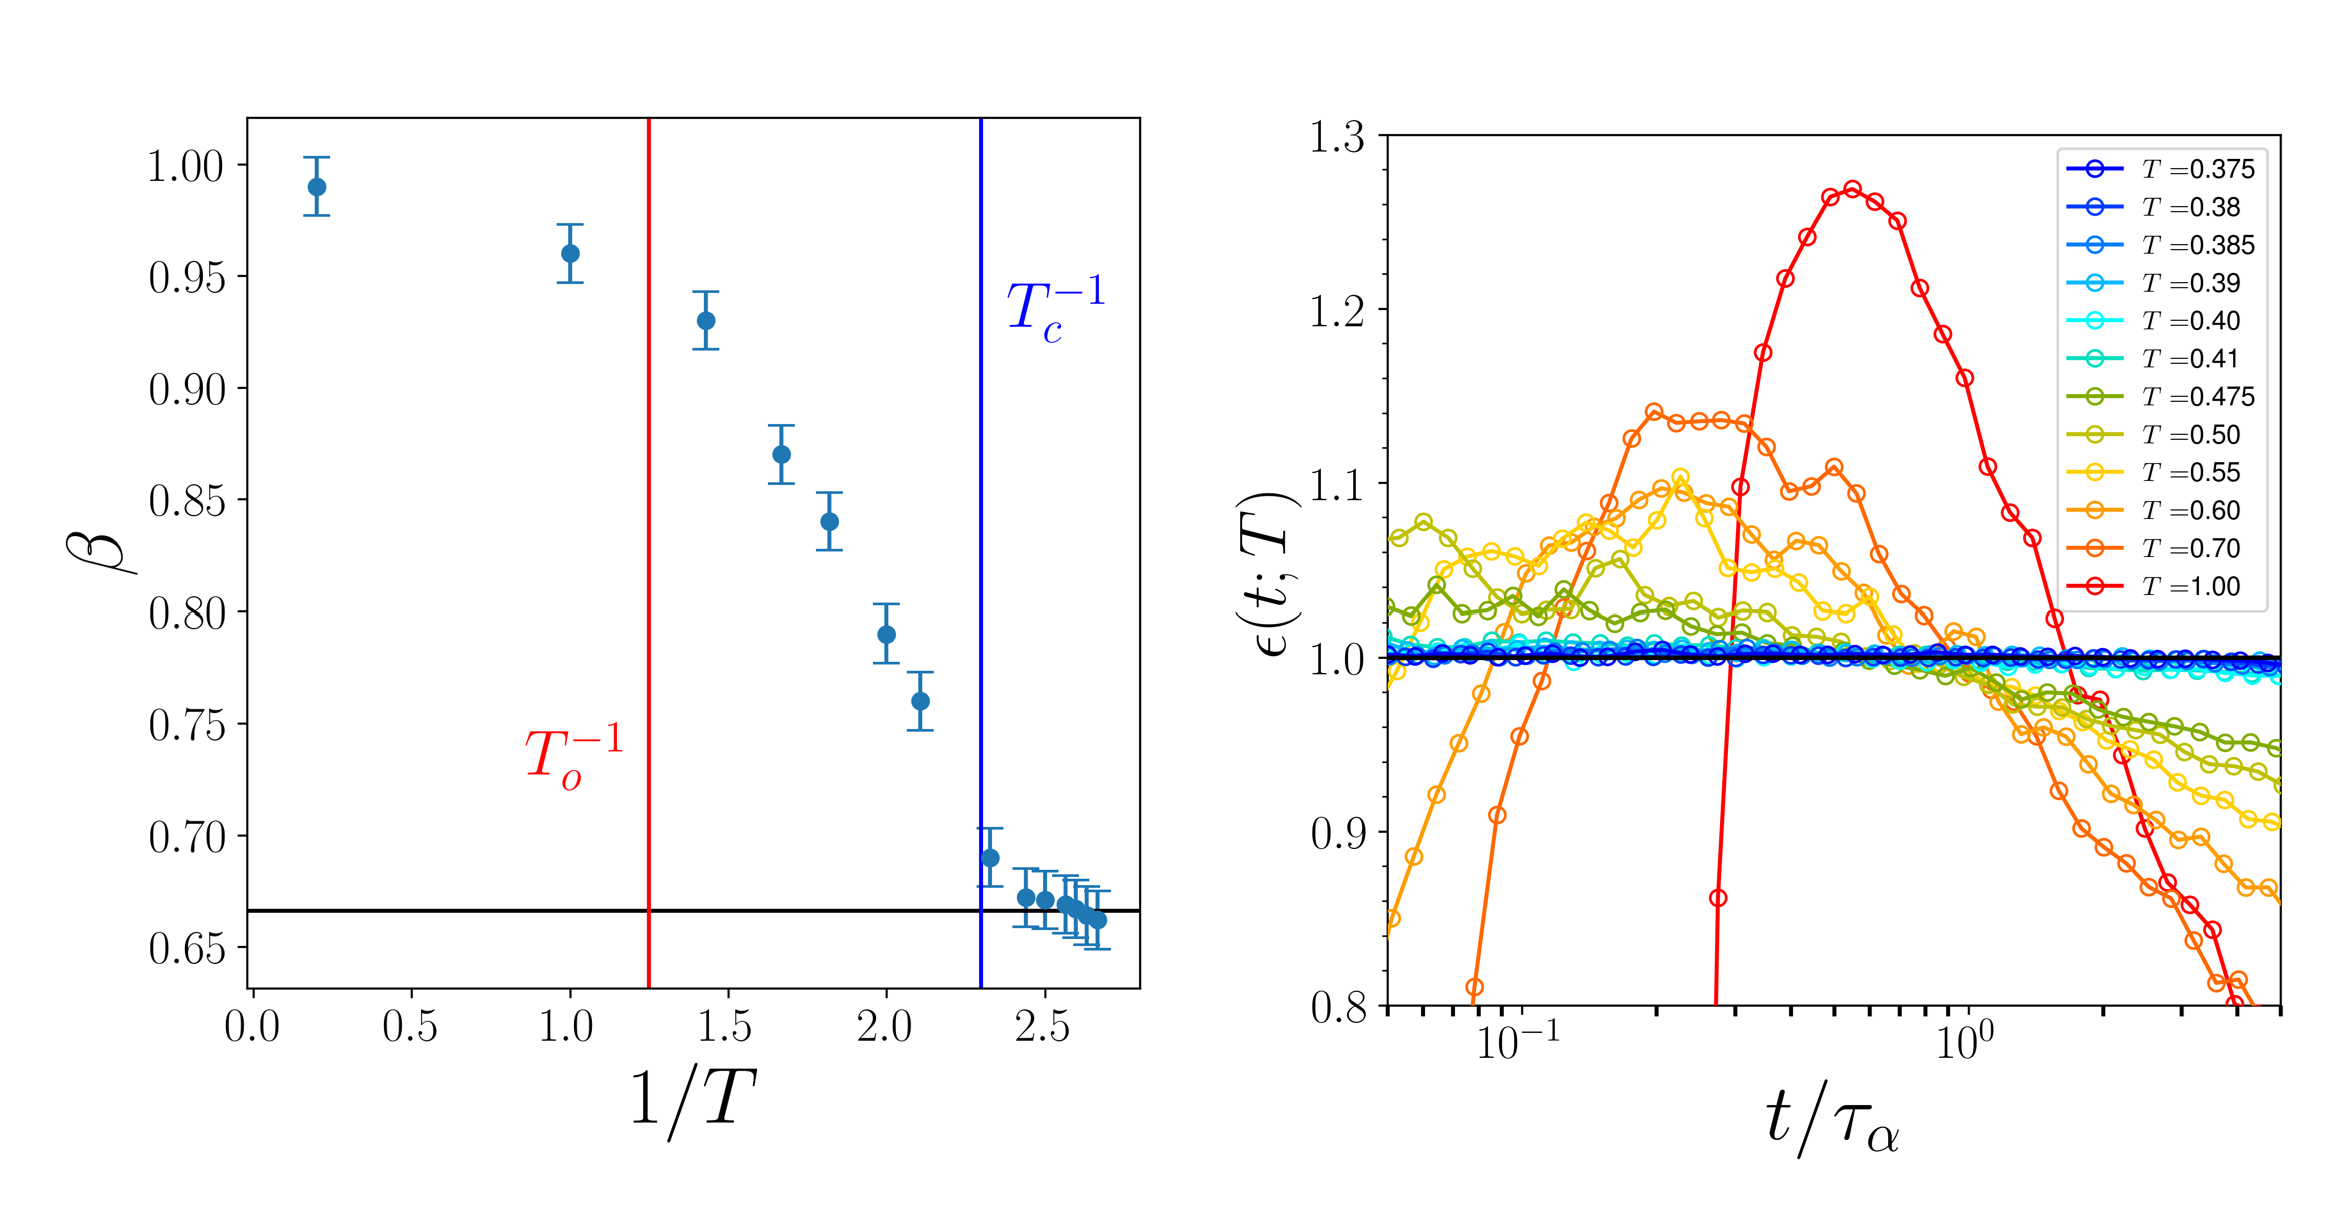
by a power-law , with the non-ergodicity parameter and the von Schweidler exponent , both independent of . For low s, the curves no longer fall on a master curve with increasing with decreasing , see Inset of panel
(b). Thus we find again qualitative differences in the dynamics at intermediate and deeply supercooled conditions (approximately above and below ).
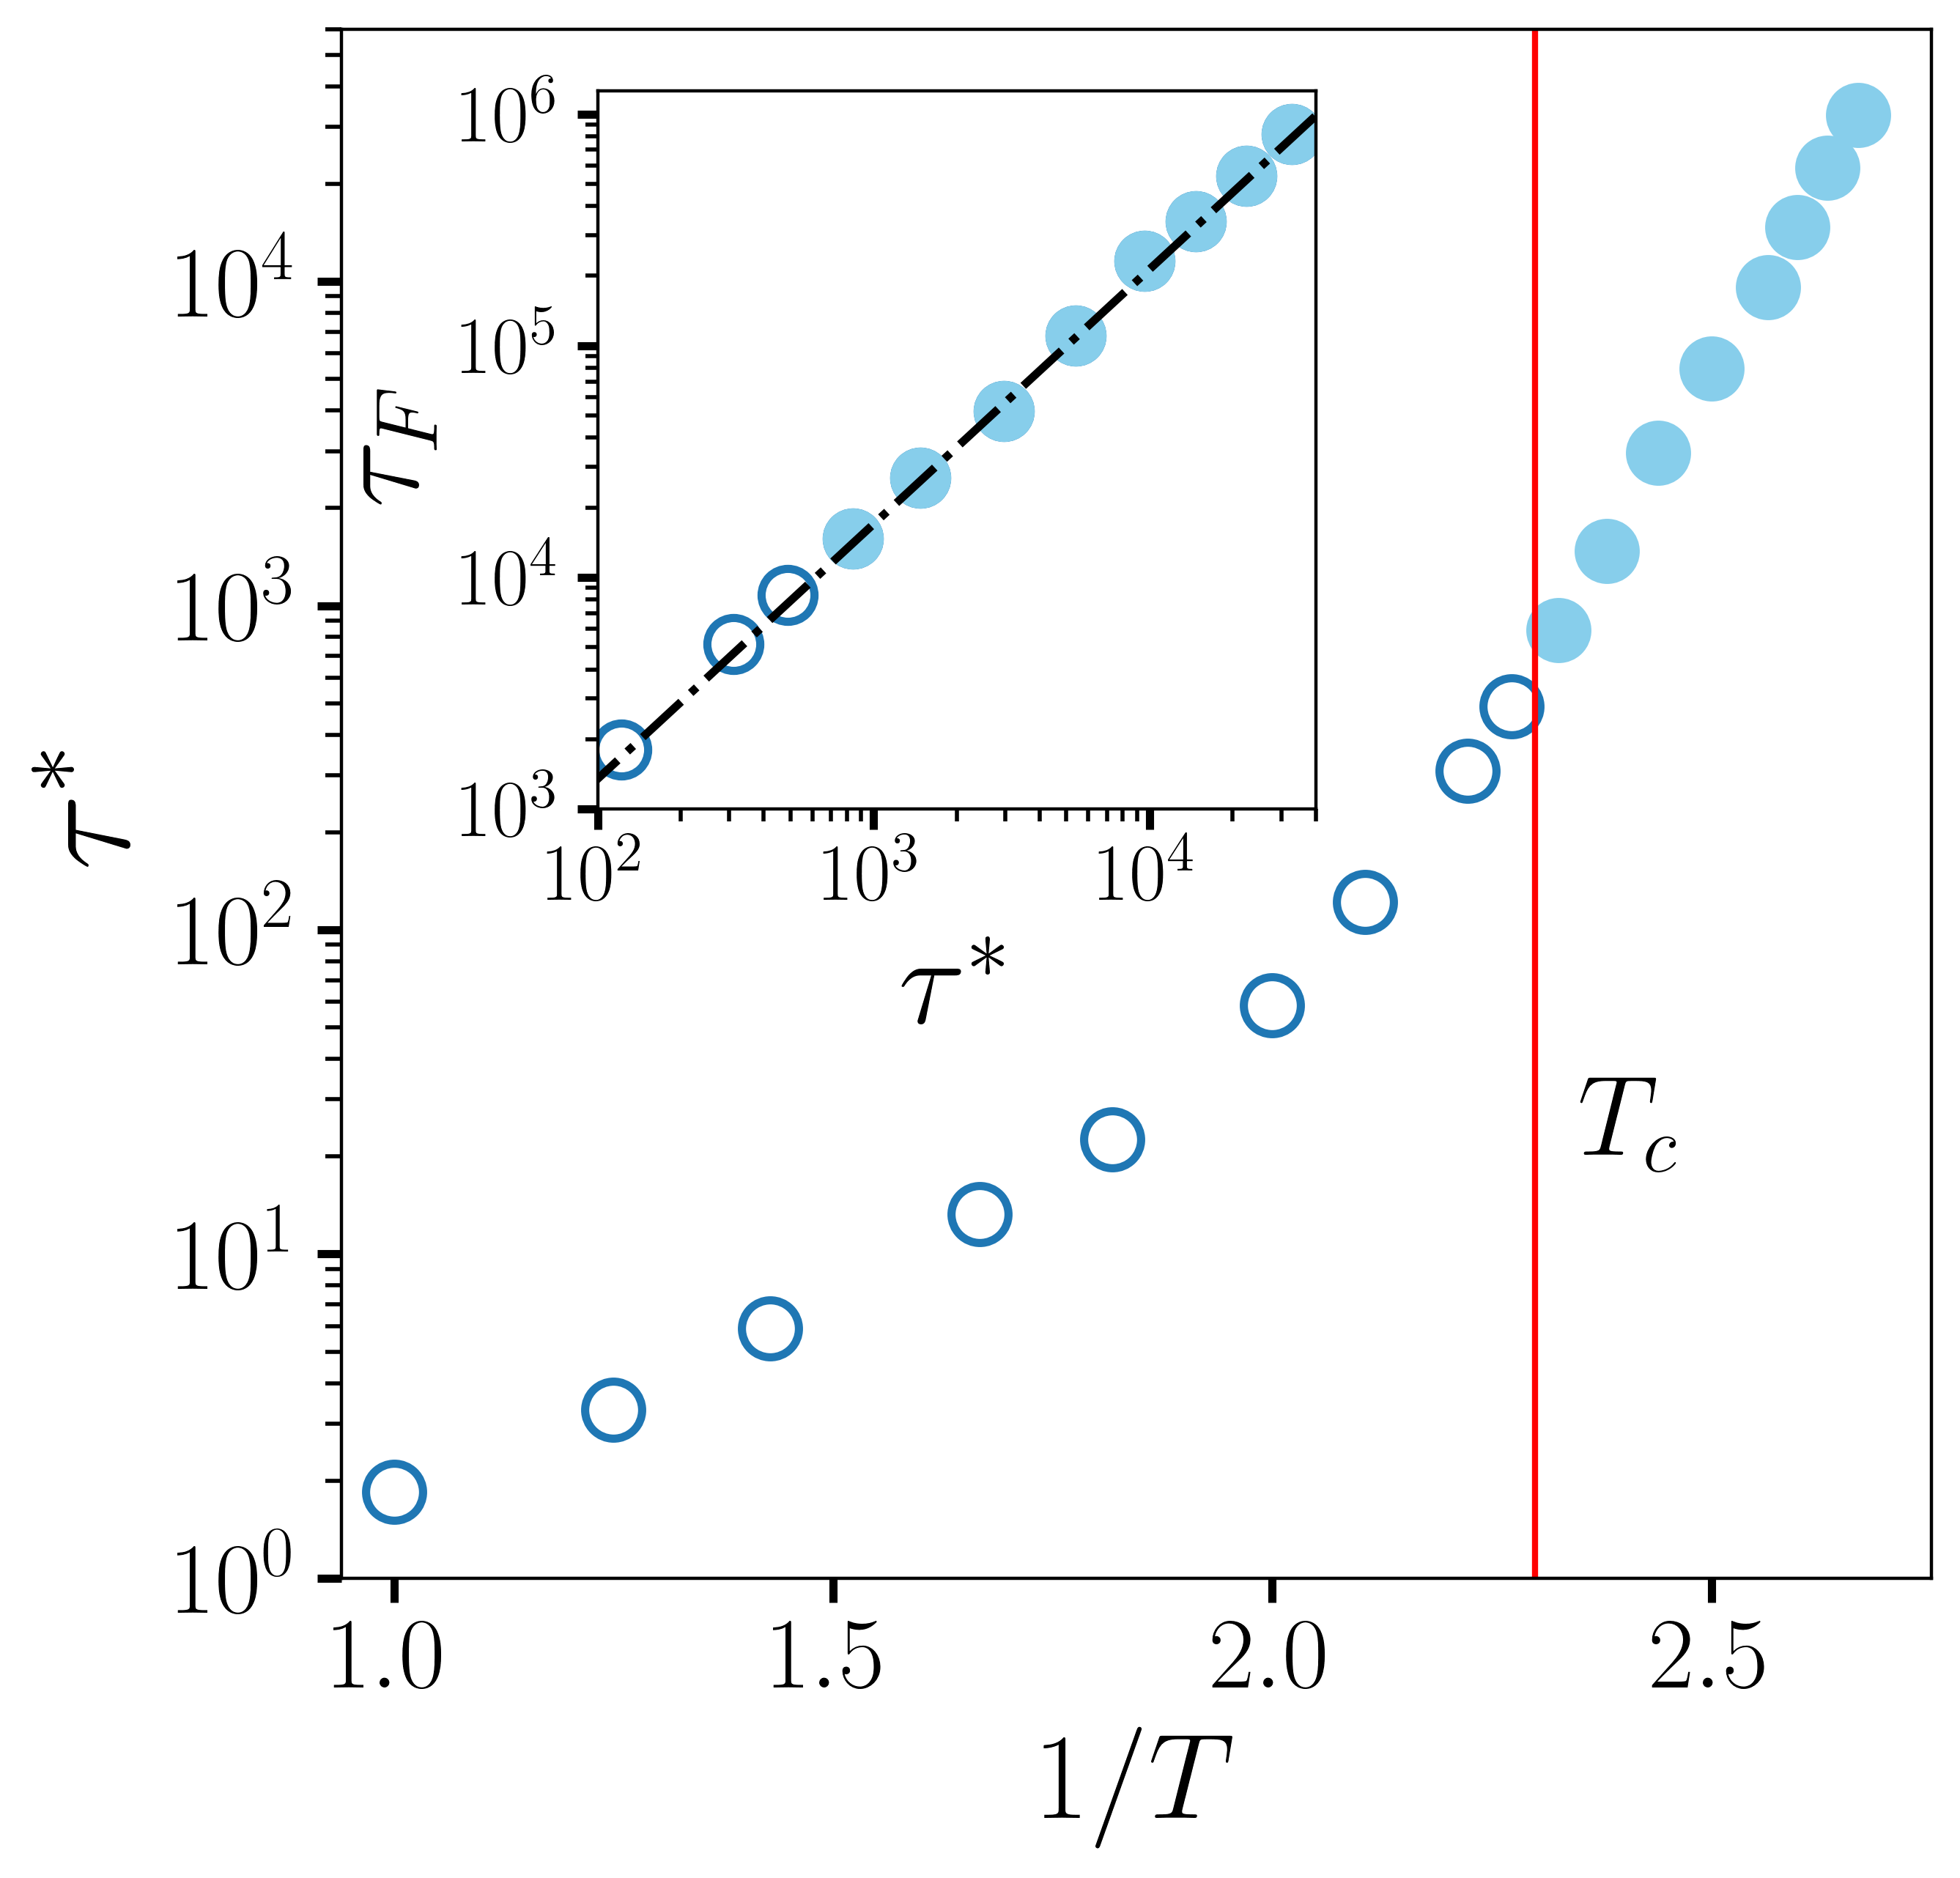
Panel (c) shows the relation between the two timescales and . For high and intermediate temperatures one finds the expected Stokes-Einstein relation, i.e., . About 10% above (), this dependence is replaced by a fractional Stokes-Einstein relation [25, 26], with an exponent around 0.78, indication of strong dynamical heterogeneities (DH) in the sample [27, 28].
One indicator for the strength of these DH is the non-Gaussian parameter , the -dependence of which is presented in panel (d). One recognizes that at high and intermediate temperatures the rise of is essentially independent of and is well described by a power-law, in agreement with earlier studies [19]. For temperatures below , this is no longer the case, showing that there is a change in the nature of the -dependence of the DH. The -dependence of , the time at which reaches its maximum, is presented in Fig. S2.
Overall, Figure 1 demonstrates that, upon changing , there are two different dynamic regimes. We do not claim, however, that is the exact boundary between these two different dynamical behaviors. Rather, this temperature should be regarded as indicative of a point at which where the nature of the dynamics changes, and we emphasize that we reach this conclusion from the analysis of the raw data only, without making any fit inspired by MCT.
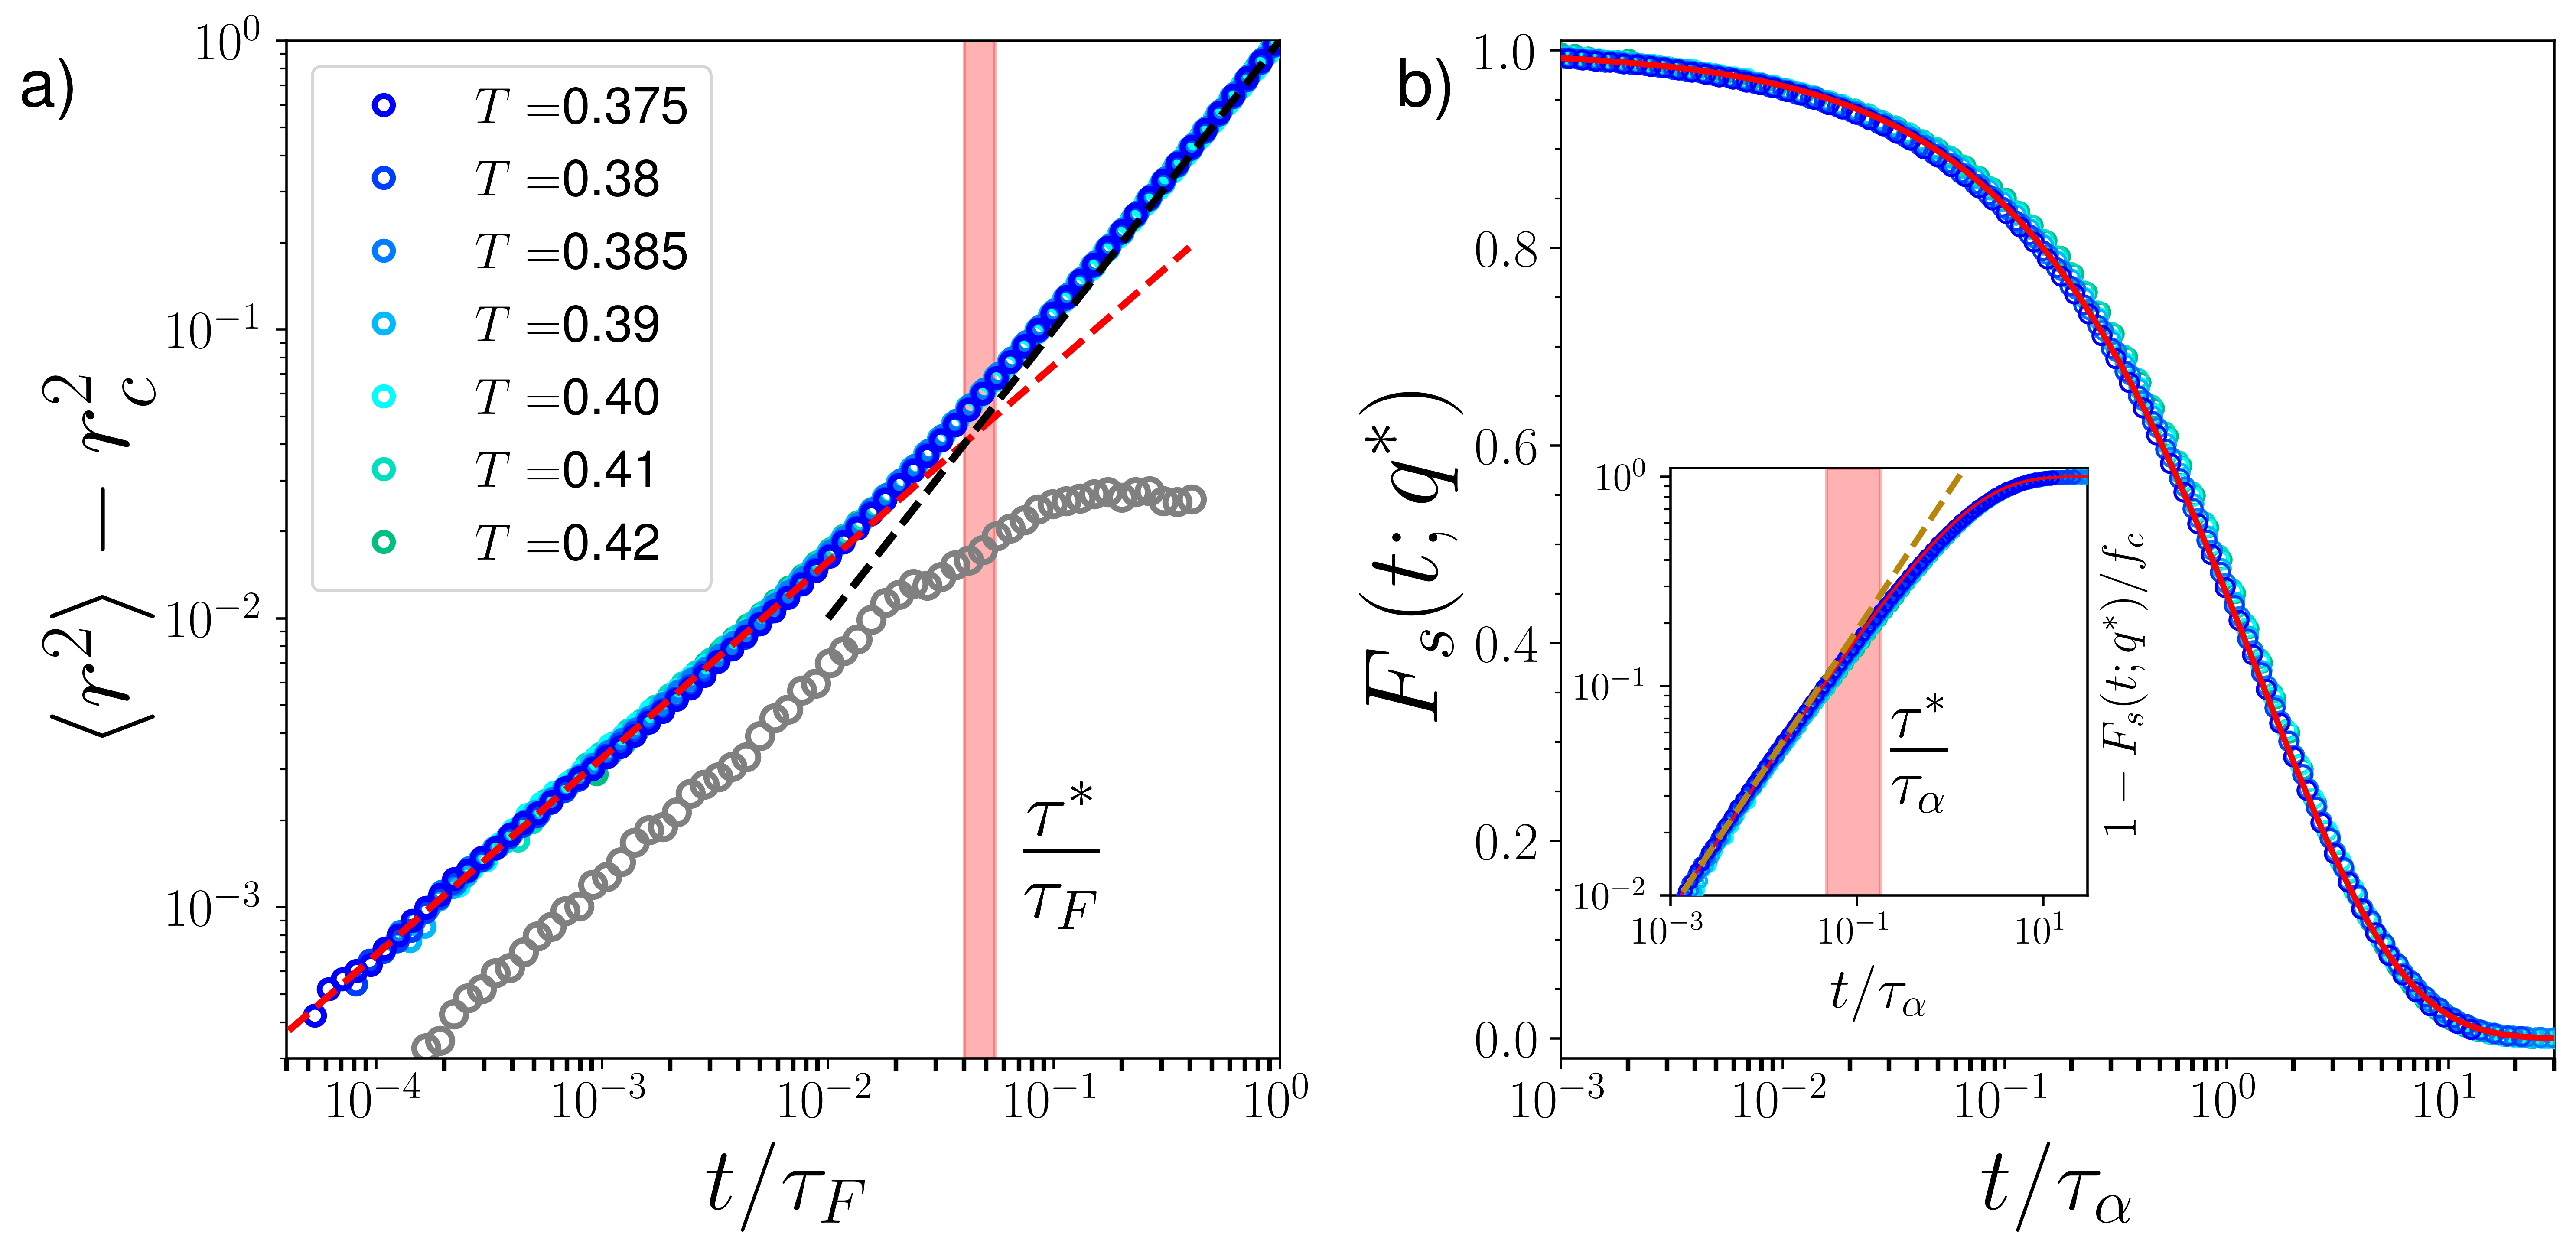
In the following we focus on the dynamics at low s and demonstrate that it shows system-universal features that permit to describe it in a simple manner. Figure 2(a) presents as a function of . One recognizes that the time-dependence of this difference is independent of over several decades in time, i.e., the escape from the cage is independent of . For times shorter than (vertical bar) the increase of is a power-law with exponent ; for times larger than , the curve starts to bend upwards to enter the Fickian regime around [20, 29]. To the best of our knowledge, the presence of such a unique sub-diffusive behavior after the caging regime, at temperatures significantly below , has never been observed in earlier studies of supercooled liquids. The emergence of a low- dynamics that, up to a scaling factor, is independent of can be observed also in . In Fig. 2(b) we present the time dependence of and one recognizes that all curves below fall indeed on a master curve when plotted as a function of . Note that this master curve is observed in the whole -regime as well as in the late -regime (see Inset), i.e., throughout a time-range that is much larger than the one found for temperatures above [30]. The master curve is very well described by a stretched exponential, , with , i.e., the exponent is the same as the one we found for the MSD in panel (a). To the best of our knowledge, the identification of such well defined sub-diffusive post-caging scalings, with , has never been reported before for glass-forming liquids. This demonstrates that at low temperatures the -and -processes for the MSD and are strongly related to each other, in contrast to the case at higher temperatures for which the von Schweidler exponent (independent of ) and the stretching exponent (often varying with [31, 26, 15]) are different [16]. For the sake of completeness we show in Fig. S1(a) the temperature-dependence of as obtained from our data, throughout a range of temperatures, . It is indeed evident that at high and intermediate s a significant dependence of exists, but it saturates at very low , indicating that the asymptotic regime has been reached.
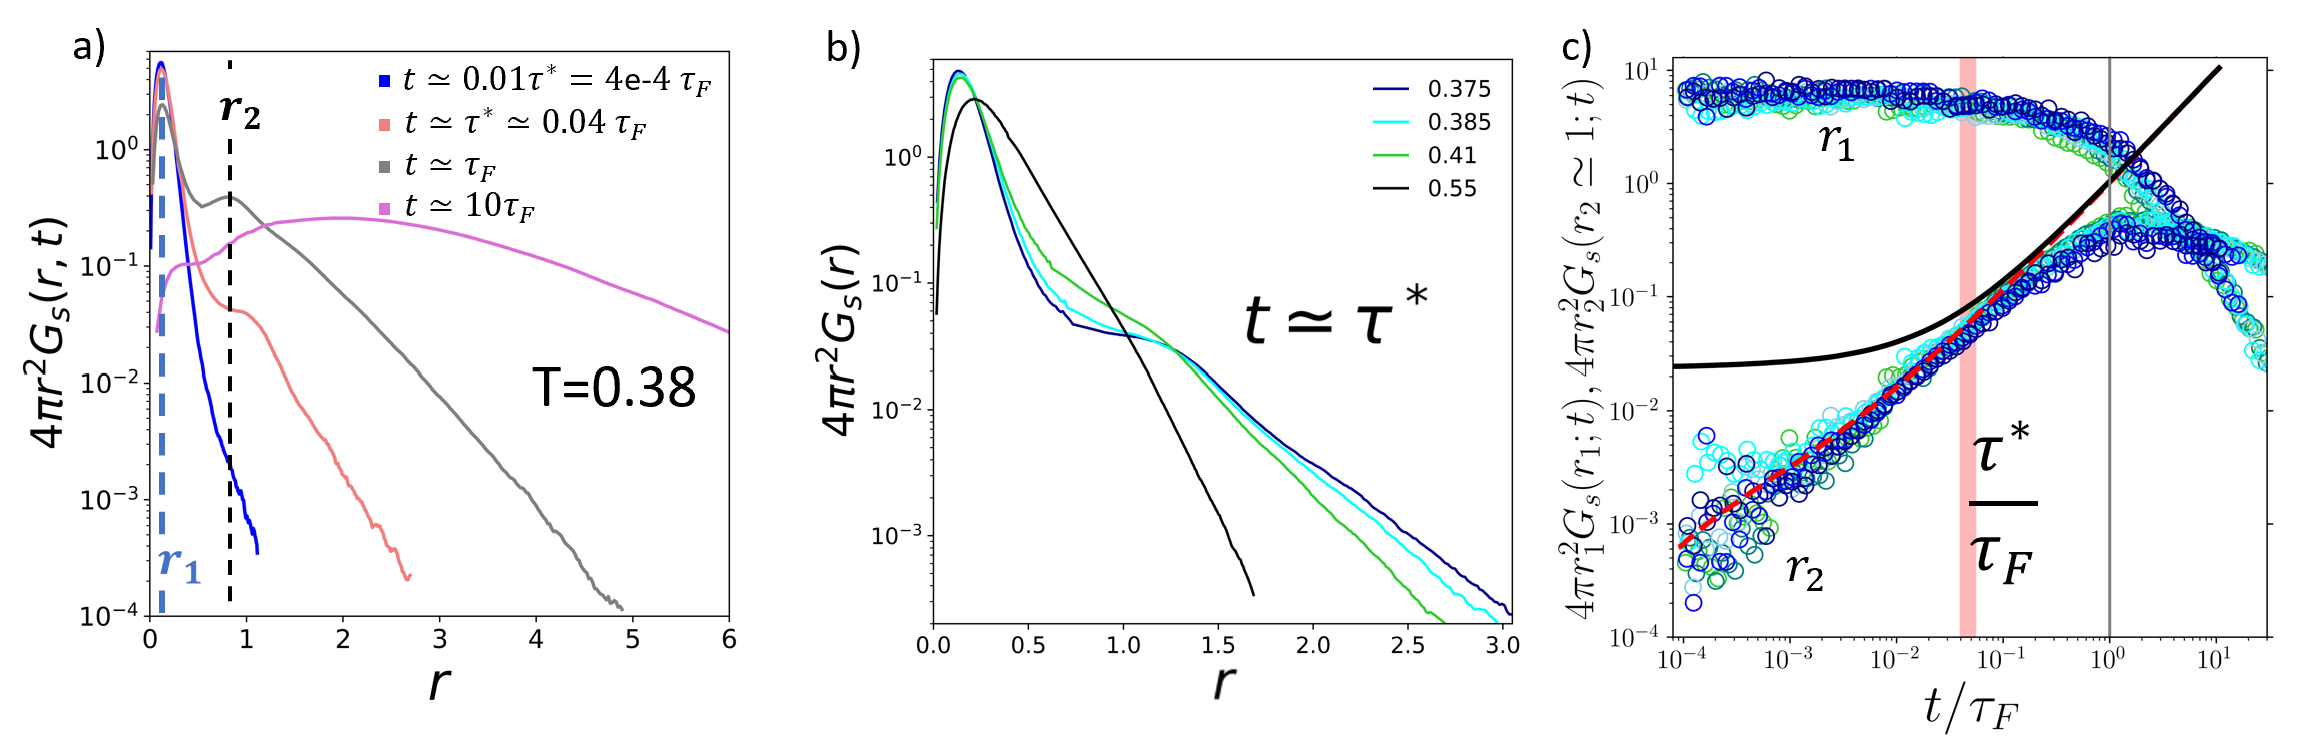
Deeper insight into the nature of the observed low- dynamics after the caging regime is obtained by probing the self Van Hove function , i.e., the probability that a particle has moved in time by a distance . Figure 3a shows that peaks at a distance at short times, i.e., it shows a Gaussian core due to the particles that rattle inside the cage they were in at ; the peak position remains almost fixed at for a long time (up to around , see below). For times around the distribution shows a shoulder which evolves into a second peak at a distance , i.e., close to the position of the main peak in the radial distribution function. This second peak is due to the particles that have left their original cage and have effectively hopped to the location that corresponds to the first neighbor distance [15]. This second maximum becomes predominant at long times () and subsequently starts to move to larger distances, while the first peak decreases and eventually fades away, indicating that the dynamics has become diffusive. Remarkably, for all times the distribution displays an exponential-like tail, present even at very short times (), i.e., the original cages start to “leak” very early, and this leads to the MSD detaching from the plateau. This exponential-like tail persists even at very long times (, where Fickian non-Gaussian Diffusion [20, 32, 33] is at play ( has not yet decayed to zero). For temperatures above , Chauduri et al. have found that exponential tails are present in a variety of glass-formers [34], and thus our finding generalizes these results to the -range below . The observation that around the exponential tail starts at a distance , indicates that at low temperatures the effective hopping distance is given by the nearest neighbor distance, in contrast to the finding of Ref. [34], for which a roughly three times smaller distance was found for , a value that is compatible with the conclusions reached by the direct analysis of the cage-jumps within single particle trajectories [35]. Thus, this is further evidence that the dynamics above differs qualitatively from the one below . Figure 3b illustrates the qualitative differences in the shape of for temperatures above/below at fixed . At intermediate temperatures, , the distribution shows a single maximum and no sign of a shoulder is visible, i.e., the caging core is broad and connects smoothly to the exponential tail. As temperature is lowered significantly below , the width of this core shrinks, and a pronounced shoulder is present before the exponential tails. We note that at low at seems to converge to a -independent master-curve, hinting that the beginning of the -relaxation process tends to become independent from (if measured on a rescaled time scale) and hence “simple”, coherent with the findings of Figs. 1 and 2.
Figures 3a and b also demonstrate that below the dynamics is much more heterogeneous than above in that, at the lowest temperatures and up to a time of order , we have markedly separate populations of particles: Those that are still caged and those that have escaped far from their original cages. This is in contrast to the case of higher temperatures for which this difference is significantly less pronounced. For intermediate s, the escape far from the cage is due to a sequence of rare (short) jumps of length around 0.3 [34]. Instead, at very low temperatures, we observe a few rare events in which particles hop by a distance of , before vibrating again in a new cage at . (For the lowest one indeed sees in Fig. 3b a further weak peak at .) In both cases, exponential tails are the result of successions of rare events. The relative importance of the two peaks is quantified in Fig. 3c where we plot the -dependence of their height for the lowest temperatures. The peak at is the only one present at really short times, and its magnitude remains basically constant for , i.e. in the time-window in which one observes the 2/3 power-law growth in the MSD discussed above. In this time-range, no secondary maximum exists, but we still can read off the value of at , and one finds that it grows with a 2/3 power-law (see red dashed line). For larger times, , the shoulder at becomes a real peak and reaches its maximum height, before decreasing at very long times. Only for times well beyond the Fickian onset this secondary peak becomes the highest one, which demonstrates that Fickian diffusion does not imply that all particles have left their original cage. In conclusion, the sub-diffusive growth of the MSD is due to particles that have hopped once (secondary maximum) and those anomalously far from their original cages (exponential tails). The fact that in this low- regime this simple short-time dynamics depends only on is highly non-trivial, indicating a distinctive uncaging process of the particles.
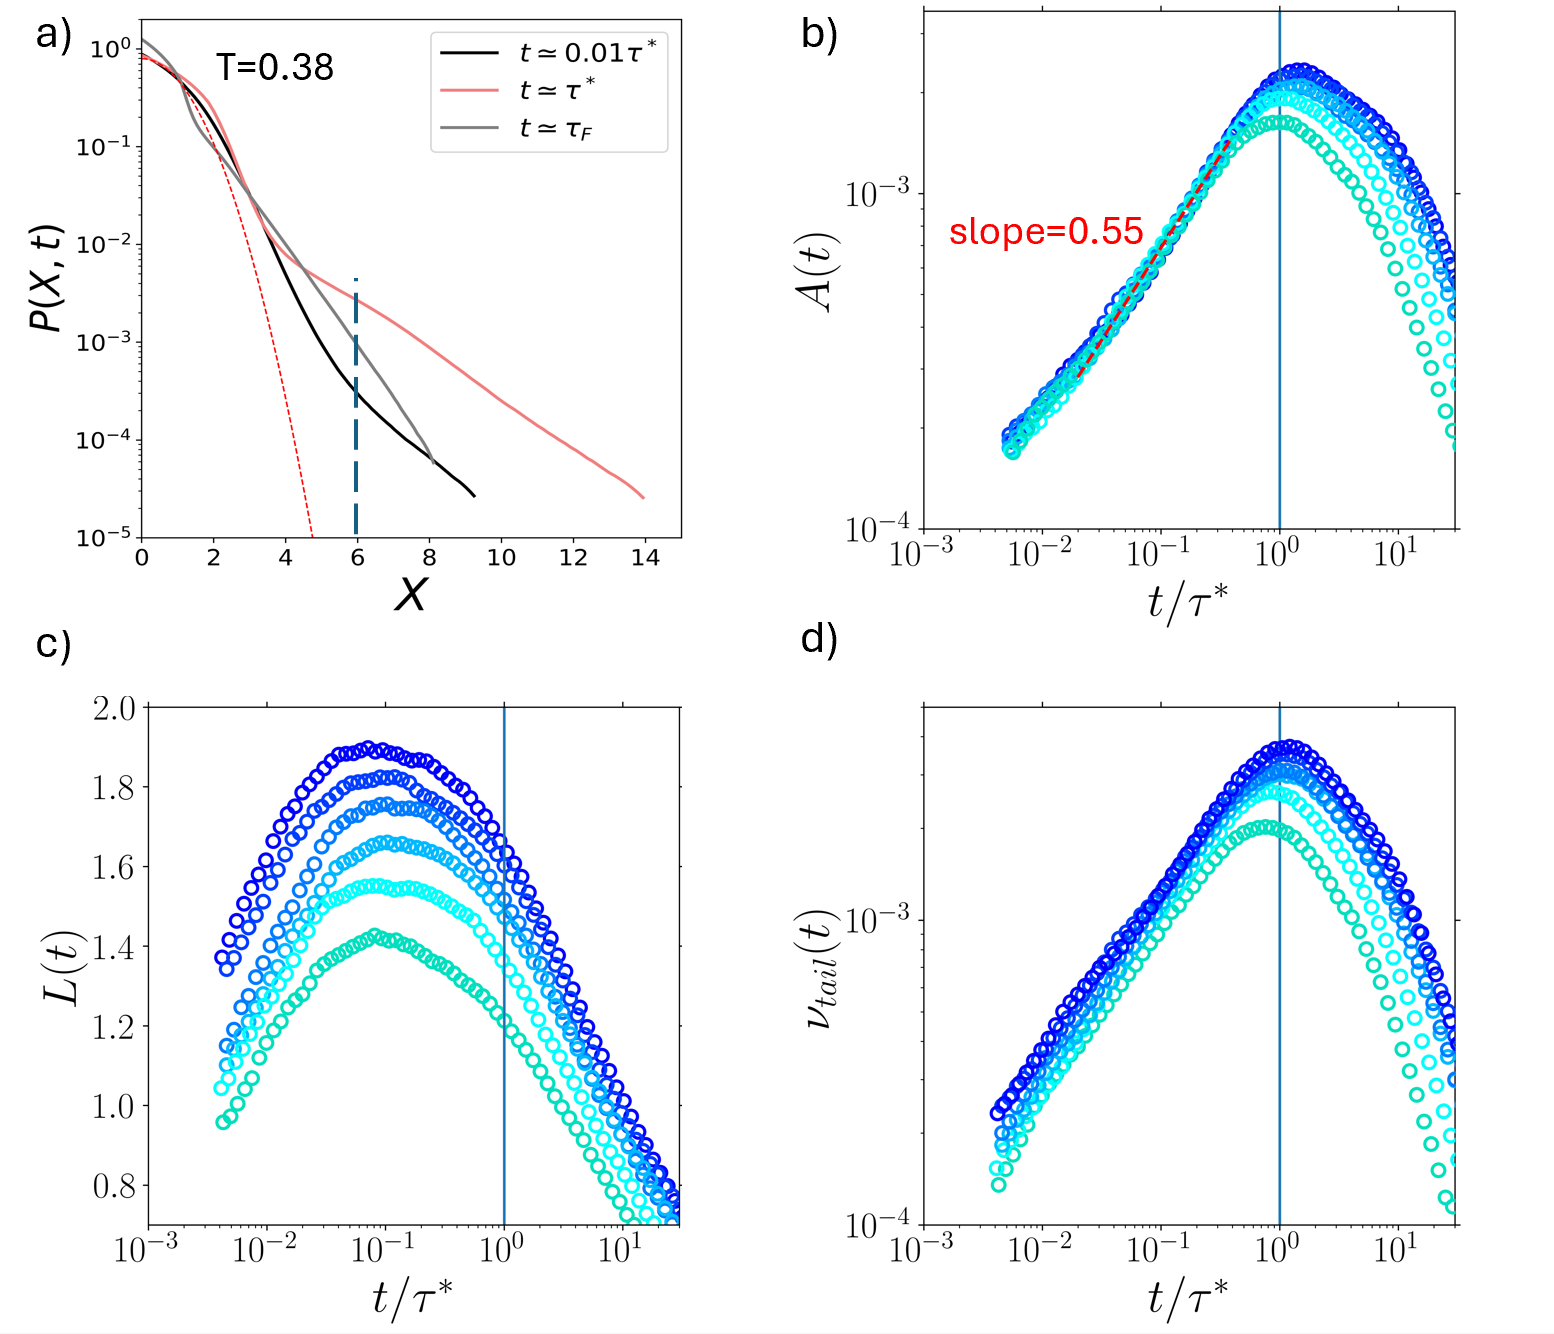
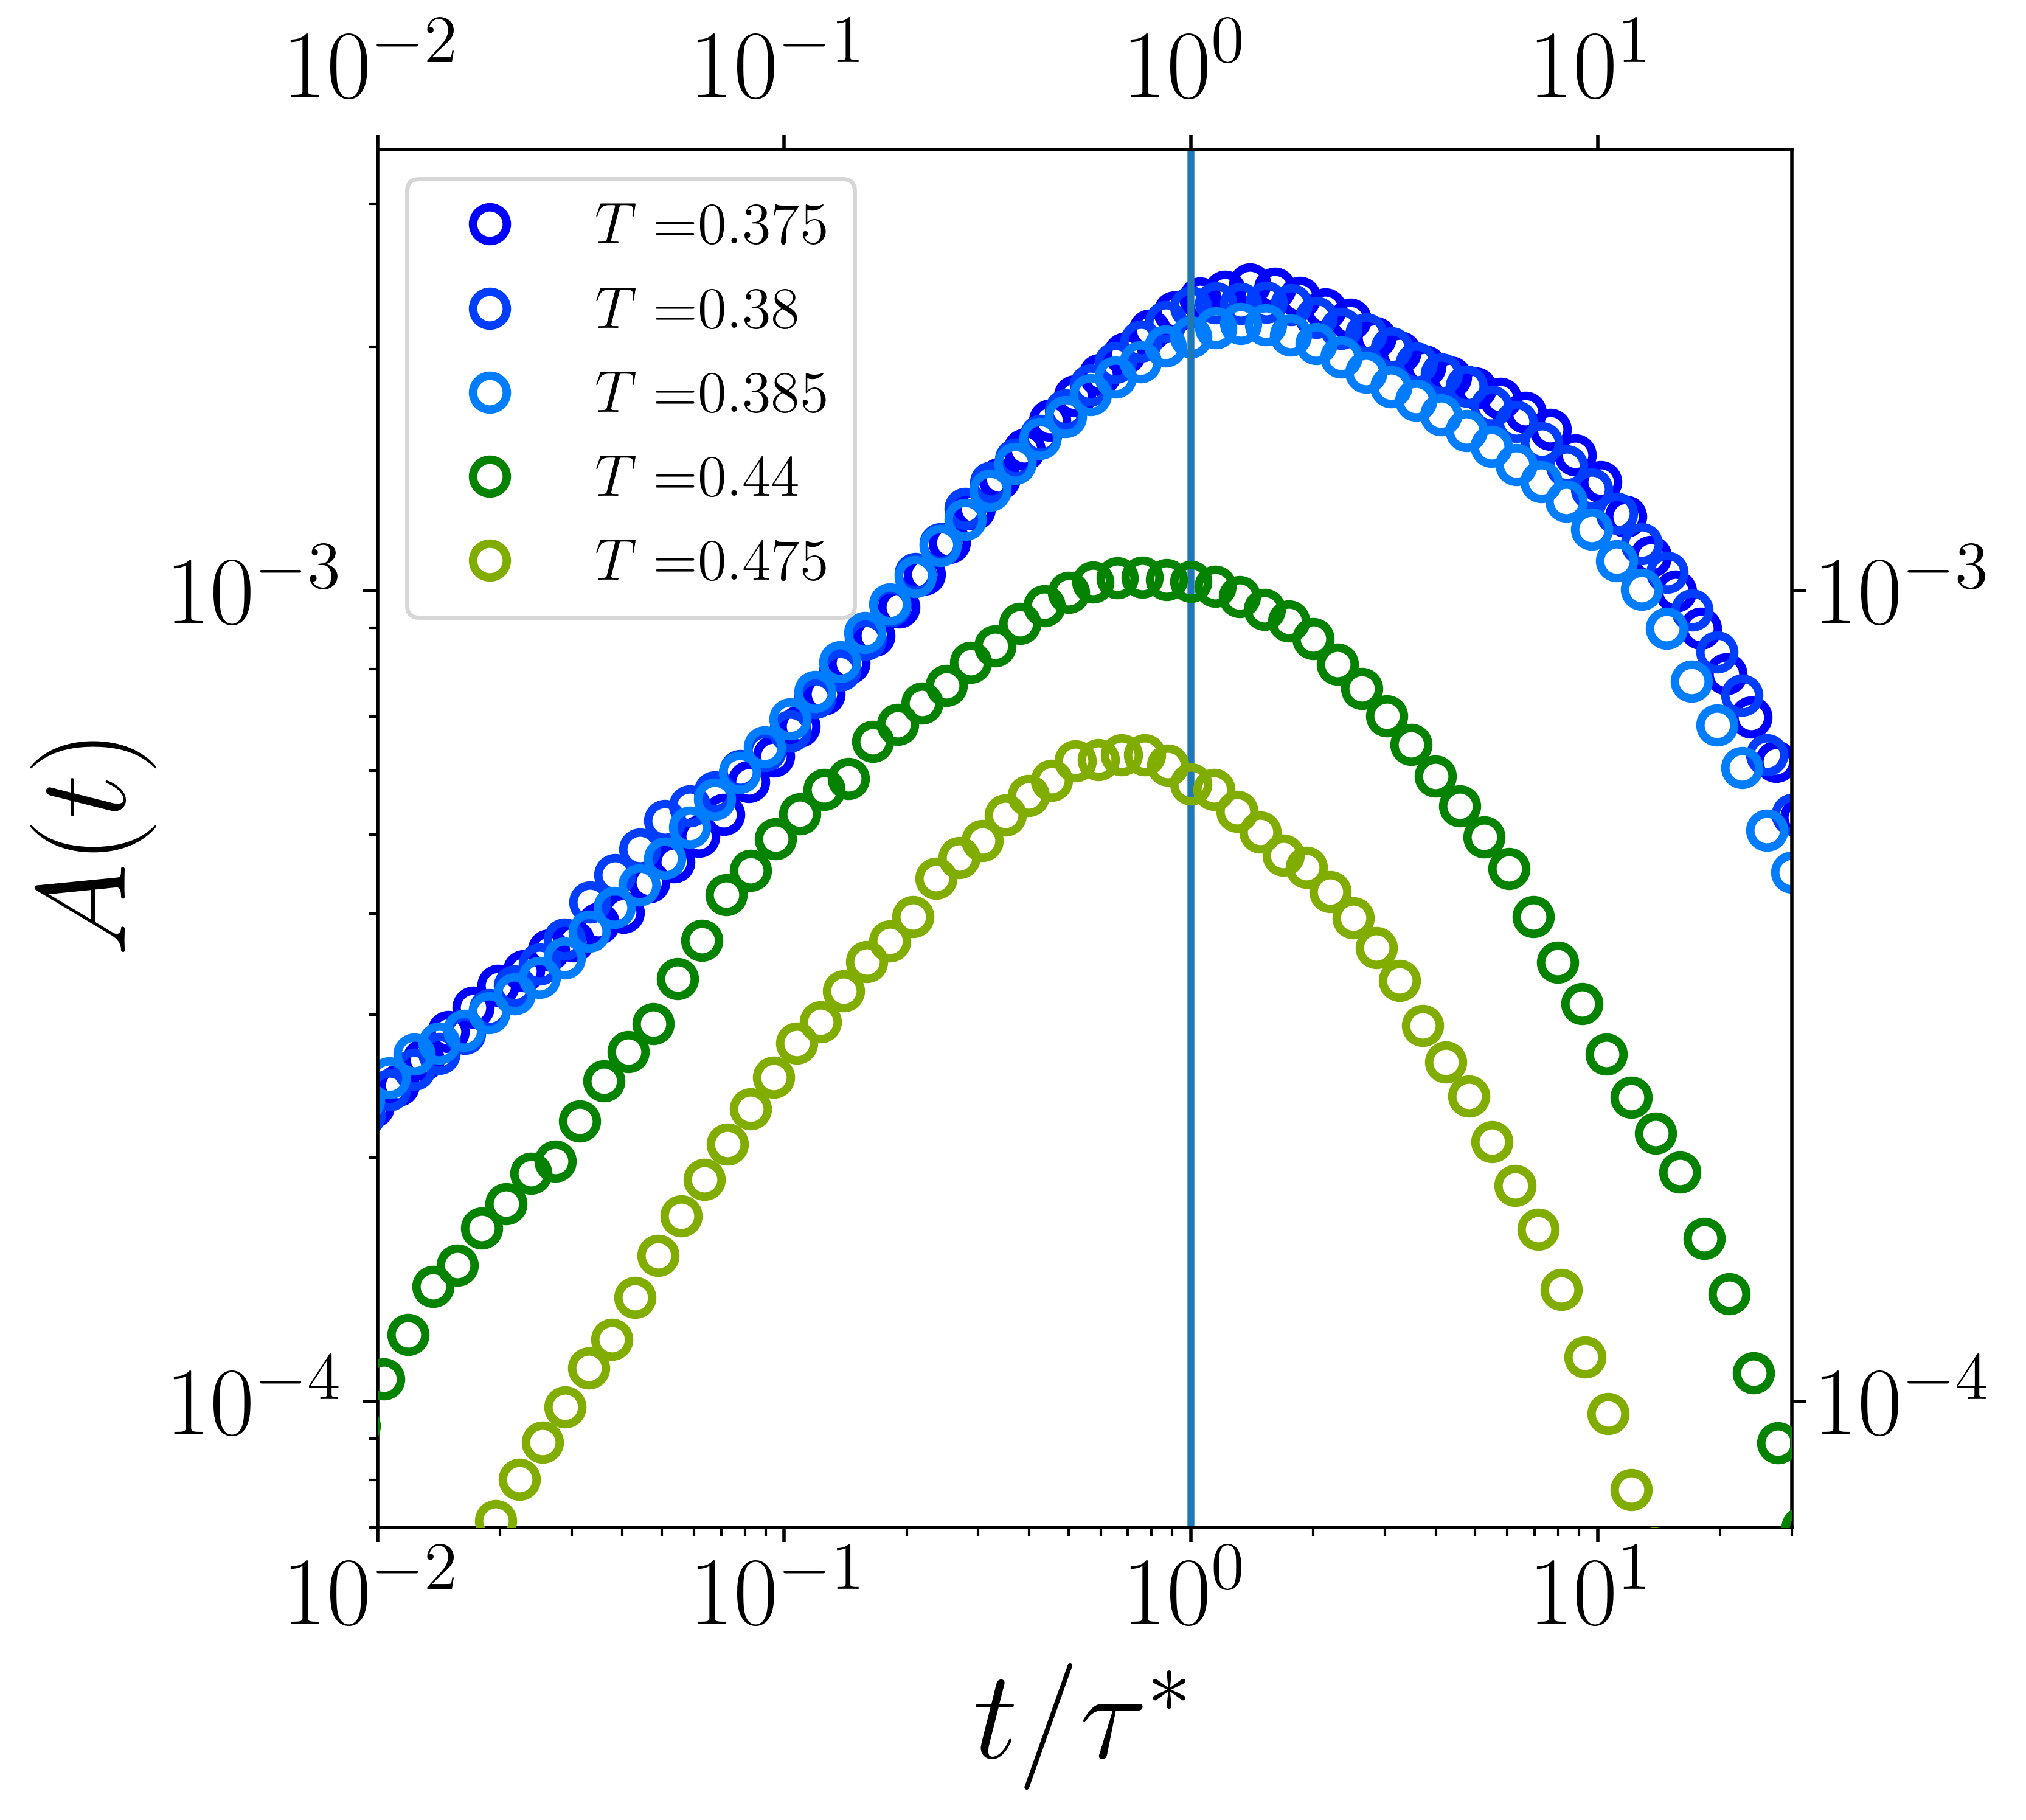
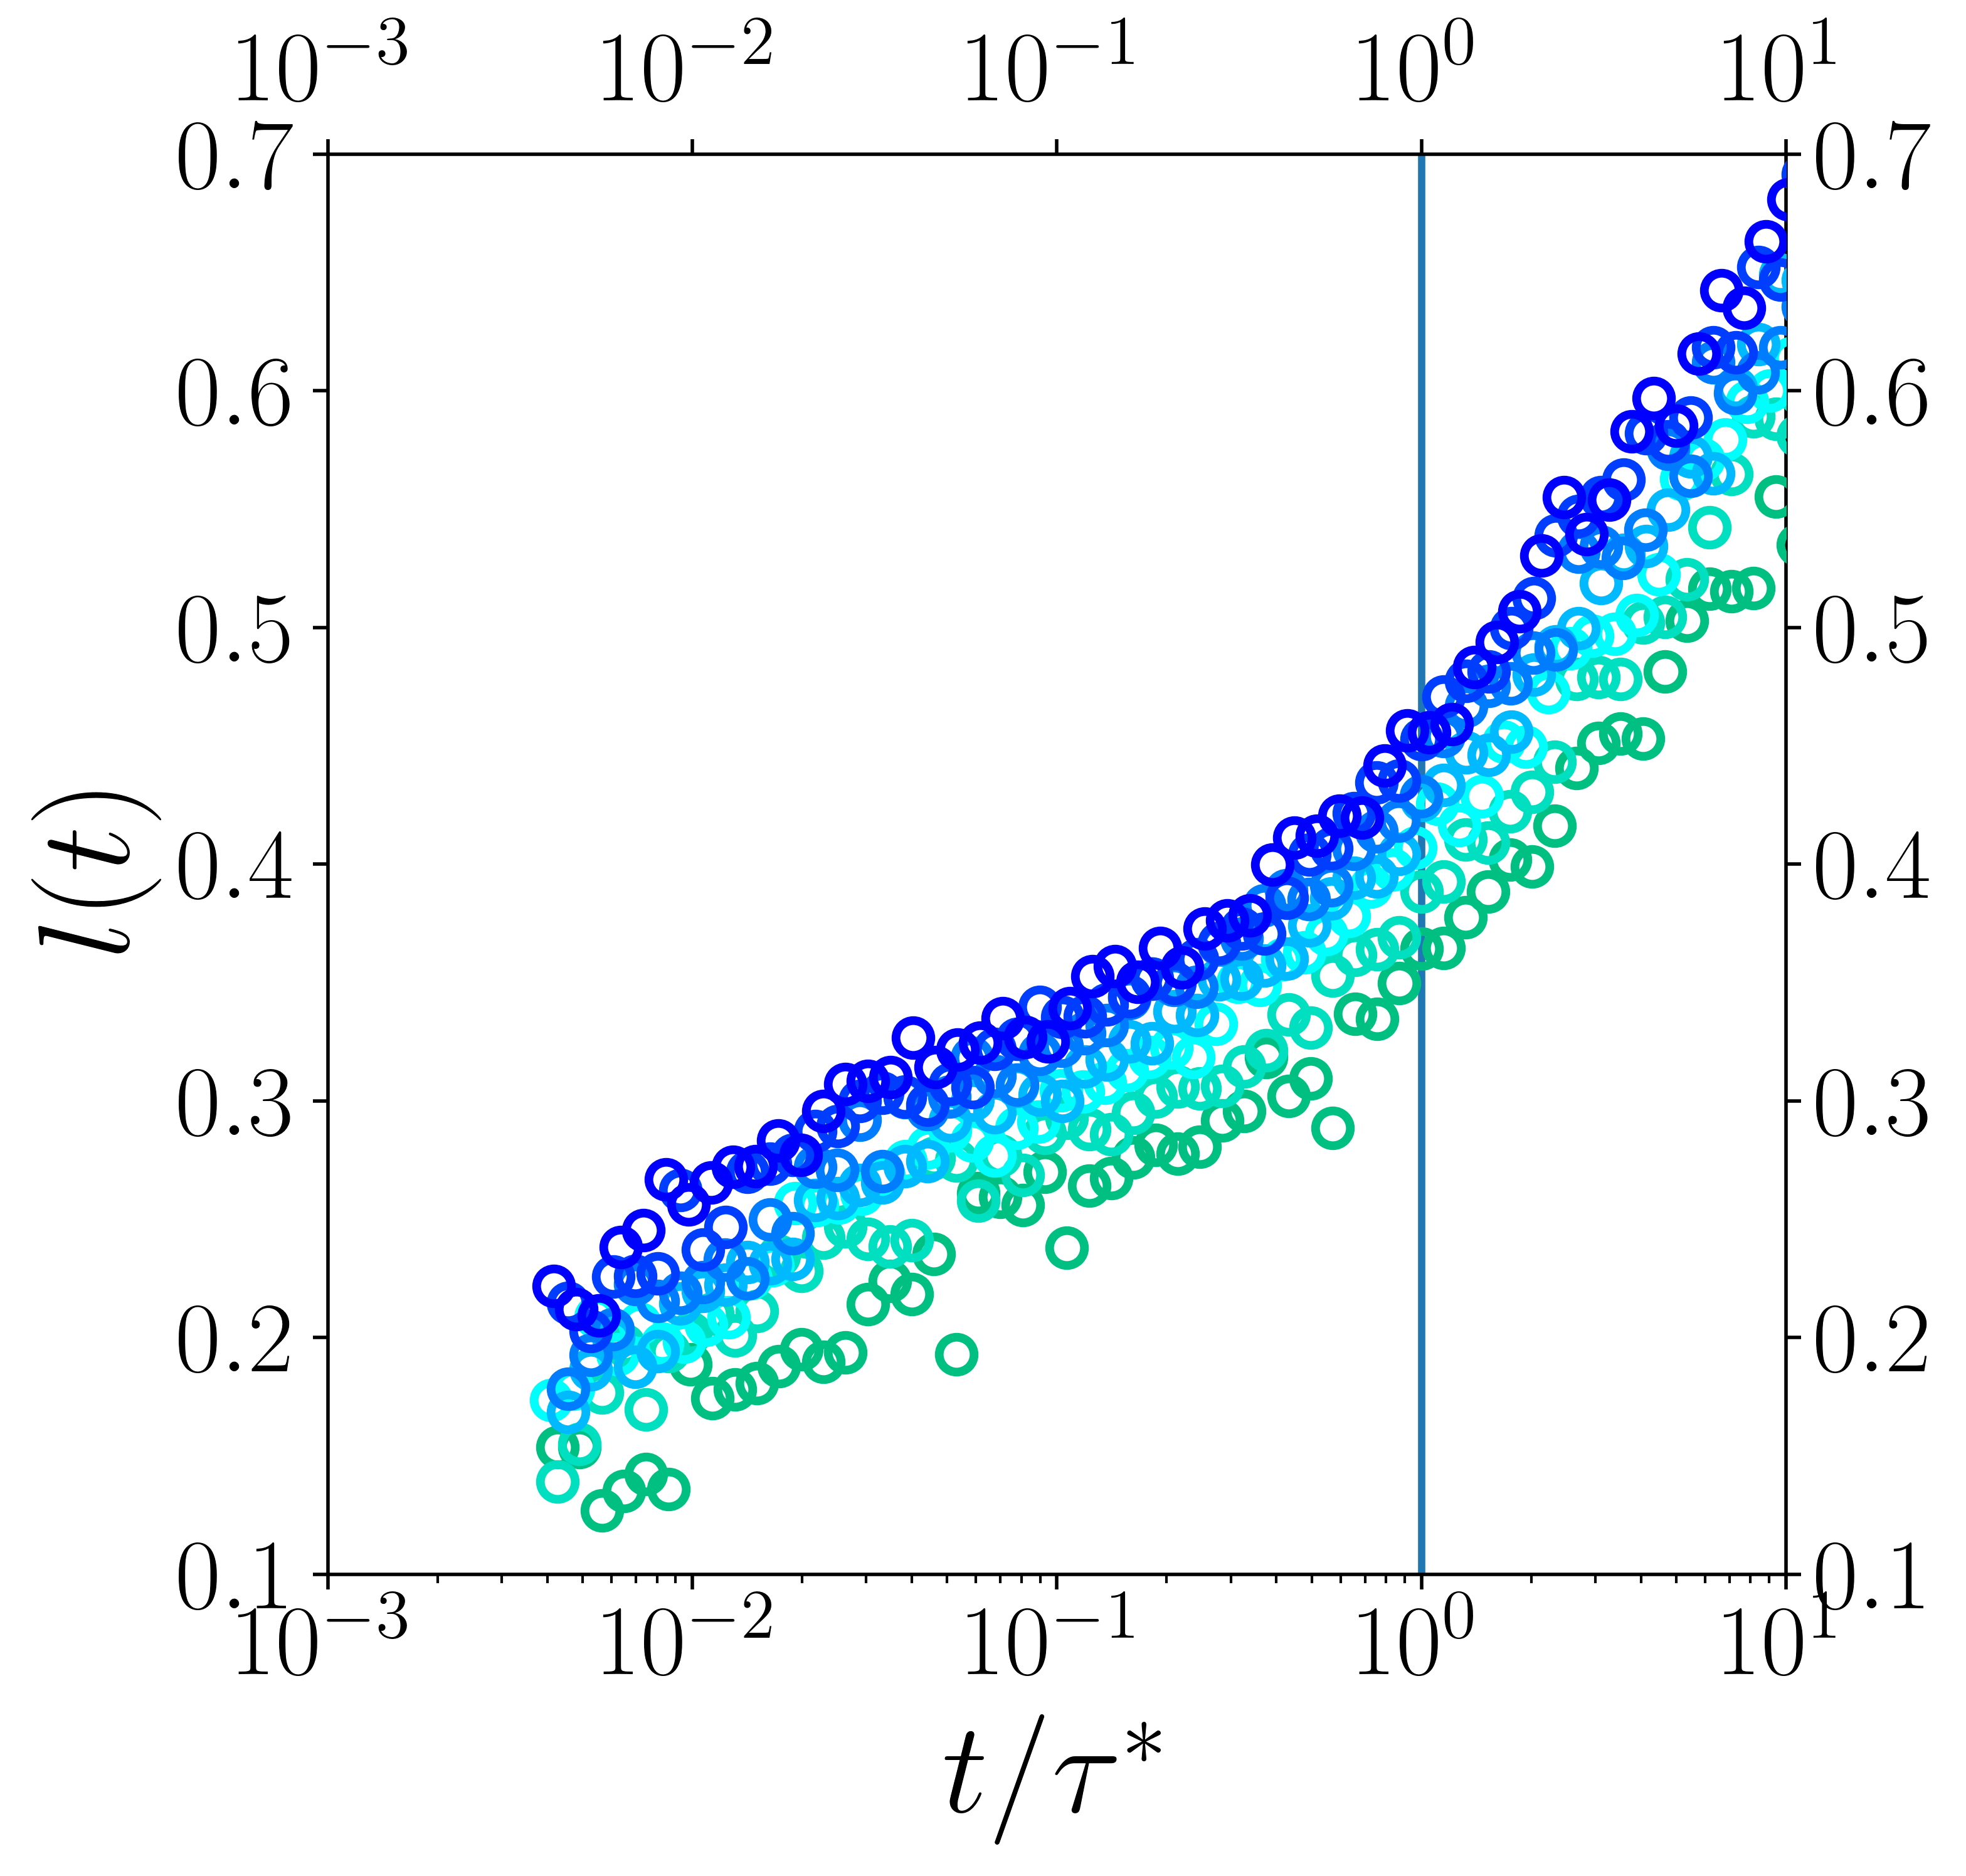
To clarify further the link between the power-law dependence documented in Fig. 2 and the exponential tails in , we present in Fig. 4a the one-dimensional Van Hove function at the lowest s. To compare the distribution at different times, we plot this probability as a function of the reduced variable . For a Gaussian process, this rescaling results thus in a universal time-independent master-curve: , included in the figure as well. For large all distributions shown in panel (a) display an excess probability with respect to . We note that in this representation, the double-peak seen in Fig. 3(a) is not visible anymore, but is replaced by a marked shoulder for times around , where deviations from are most pronounced. For large displacements, i.e., , which is beyond the shoulder at , tails at all times are well described by an exponential . [Note that, at , the condition , corresponds in the D real-space to the condition , since .] One sees immediately that the decay length of the tail, , does not change much as a function of time, while the amplitude does. Panels (b) and (c) present, respectively, the time evolution of the amplitude and of the length scale . increases significantly (by more than one order of magnitude) for and peaks at . Remarkably, the curves for the different ’s fall onto the same master curve before , showing a power-law with an exponent . We note that for temperatures above no such master curve is observed (see Fig. S3). Also two other features of for , namely their similar -decay and the presence of a shoulder (at around ) are not found at higher temperatures (see Fig. S3). These observations show that we are here probing a regime in which the dynamics is qualitatively different from the one at/above , and becomes independent of , if time is appropriately rescaled. Also shows non monotonic behavior, panel (c), with a dependence that is similar for all temperatures, with a maximum approximately at . Throughout the examined -range, however, at fixed varies at most by of its maximum value. Thus one concludes that it is the amplitude of the tails, rather than their extent, which is the key ingredient for the DH. (In Fig. S4 we report the time-evolution of the dimensional decay length and one sees that the variation with time is not very pronounced.) In Fig. 4d we present , the fraction of particles that have made an -displacements larger than (computed as the total area under the tail of the distribution function). We recognize that up to times this fraction shows a nice power-law behavior, with an exponent and prefactor that is independent of . Hence, this is further evidence that at these low temperatures the relaxation mechanism is simple, i.e., independent of temperature.
Finally we make a quantitative comparison between the MSD given by the particles in the tail of the distribution and the total one.
In the Supporting Information we give an analytic formula for the ratio , where is the just mentioned contribution to the MSD. It is readily shown that, in leading order, this ratio is ).
The complete time-dependence of is included in Fig. 2a as well (for the sake of clarity only for ).
The figure shows that and have the same time-dependence at short times (below , and are in fact close to each other. The same holds for the other temperatures below . Hence we conclude that the scaling at the beginning of the -relaxation can be understood quantitatively from the exponential tail in the Van Hove function, i.e., rare escaping events account for the sub-diffusive -departure from the plateau in the post-caging regime.
Discussion and Outlook:
Our exploration of the relaxation dynamics at temperatures well below reveals that this dynamics shows unexpected features, some of which render the description of the dynamics more complex, while others simplify it.
The fact that the size of the cage decreases linearly with , i.e., that the cage is strongly anharmonic [15], is surprising since the MSD shows that particles are trapped in their cage for times spanning several decades of their oscillation period, indicating that the cage is very stable. The linear -dependence of indicates that, at s somewhat below , the shape of the cage is not harmonic but has significant higher order components, a result that is important for quantities like the specific heat [36, 37]. The marked presence of these anharmonic effects also implies that the prediction of MCT that at the size of the plateau shows a square-root singularity [5] is not correct for the present system, and we deem that this discrepancy may not be a particularity of the glass-former we studied, but is instead a quite general result.
The main result of this work is the finding that around the relaxation dynamics changes qualitatively, an insight that has been expected on general arguments [13, 14, 15, 38, 39], but never been probed and documented in detail. While previous studies have shown that the dynamics above is described well by MCT [16, 21, 30], we show here that the one below this temperature shows features that are absent at intermediate and high s. In particular, we find that at low the process that allows the particles to leave their cages is independent of temperature, if time is measured in terms of the Fickian time . The Van Hove function shows that this process is closely related to rare events in which the particles hop by a distance that is close to the nearest neighbor distance, in contrast with the case of higher s, for which the jump length is significantly smaller. In conclusion, rare cage-escaping events give rise to a power-law dependence of the MSD below , i.e., short (rescaled) times, with an exponent that is identical to the stretching exponent found in the -relaxation process, thus at long times. This equality shows that at low s the -process is linked to the -process in a way that is much more direct than at s above . This implies that the rich and complex relaxation dynamics predicted by MCT above is replaced by a significantly simpler escape problem.
The fact that, at low , one can clearly identify a hopping length that is given by the nearest neighbor distance, indicates that the relaxation process is directly related to simple structural length scale of the liquid. This makes one to expect that the results presented here are generic, i.e., do not depend on the details of the glass-former considered. Indeed, one can expect that, once the temperature is significantly below , the relaxation dynamics will distinctly involve a simple activated process [40] with an activation energy that depends on the strength of the local bonding, i.e., a short-range property of the system. This conclusion is supported by the experimental observation that the temperature-dependence of the -relaxation time is independent of the glass-former for temperatures below , once the fragility of the glass-former has been scaled out [41, 42, 43]. On the other hand, close to , the complex non-linear dynamics as described by MCT makes the -dependence of the relaxation time to depend on many details of the interactions, thus determining the fragility of the glass-former.
The above conclusions are based on the analysis of typical liquid state observables, like . It is, however, also interesting to characterize the relaxation dynamics below by probing directly the properties of the particle trajectories and identifying the jump processes via a temporal filtering of these trajectories [44, 35, 45, 46]. Such an analysis will allow to study the presence of memory effects in the dynamics and hence to establish a connection with the visco-elastic behavior of the system at low .
Furthermore we note that the quantities presented here are all one-particle observables. As a complementary perspective, it is therefore of interest and important to probe how collective quantities, such as the intermediate scattering function and correlation functions allowing to monitor dynamic heterogeneity, depend on temperature, i.e., whether also they show a simple dependence below . From the experimental results mentioned above, Refs [41, 42], one expects that this is indeed true, but a broader verification on the level of the particles is certainly necessary. Also, it is important to study to what extent the results presented here are generic, i.e., whether the here presented simple relaxation dynamics at temperatures below is a common feature of glass-forming liquids. Present day computer simulations do allow to investigate this question, and hence such studies should be done since they will allow to verify whether the relaxation dynamics of deeply supercooled glass-formers is actually simpler than the one close to . If this is indeed the case, this will be a major step forward in our understanding of glassy dynamics.
Acknowledgments: We acknowledge financial support from the projects MUR-PRIN 2022ETXBEY, “Fickian non-Gaussian diffusion in static and dynamic environments” and MUR-PRIN 2022 PNRR P2022KA5ZZ, funded by the European Union – Next Generation EU. W.K. is a senior member of the Insitut Universitaire de France.
Methods and Materials
Details on the simulations: We consider a binary Lennard-Jones mixture with particles that we denote by (80%) and (20%). The interaction between particles of type and is given by
| (1) |
where the interaction parameters are and are given in Ref. [16]. Schrøder and Dyre showed that if the and forces from this potential are shifted and cut-off at 1.5, while the one for the interaction is at 2.5, the system is not prone to crystallization [17]. In the present work we use and , as units of length and energy, setting the Boltzmann constant equal to 1.0.
We have simulated this system using particles at a constant density of 1.200, corresponding to a box size of 30. The time step was 0.005 and the simulations were carried out at constant energy. In order to improve the statistics of the results we have done simulations that were significantly longer than the -relaxation time (for the runs extended over time steps). In addition, we have carried out 4 independent simulations of the system at the various s.
A comparison of the static and dynamical properties of the original model with those of the modified one shows, as long as crystallization is avoided, no significant difference of the two systems.
Analysis of single-particle trajectories: The MSD for particles , referred in the text as , is computed as follows:
| (2) |
where is the position of particle at time and indicates the average over all time origins . In addition, results were averaged over the four independent simulated samples.
The plateau height of the MSD, , is defined as the square-root of the MSD evaluated at the time at which the logarithmic derivative of the MSD has increased by 5% after reaching its minimum value in the caging regime.
The Self-Intermediate Scattering Function (SISF) for particles , referred in the text as , is computed as follows:
| (3) |
where is the wavevector corresponding to the location of the main peak in the static structure factor , with . The structural relaxation time is defined as the time at which the SISF reaches the value .
The height of the plateau of the SISF, , is computed as the value of the SISF at which the MSD reaches the value of .
To estimate the -dependence of the stretching exponent of the SISF we measured the quantity , which is independent on the height of the plateau . Since at long times we expect the SISF to be compatible with a stretched-exponential behavior, we fitted in the range with the expression to estimate . In Fig. S1a we show the -dependence of as obtained from this fitting procedure.
In Fig. S1b we plot the ratio , with being the best fit with the expression to the -dataset, if is kept constant.
This representation documents the approach, as temperature is decreased towards the lowest ’s, to the master-curve behavior with of the SISF’s described in the main text.
Analytical approximation for the contribution of the tails to the total MSD:
The contribution mentioned in the main text is defined as:
| (4) |
where and . Note that in the definition of the 1-D displacement function the density distribution is normalized such that (as already done in the main text). Making the change , and using the fact that for the distribution in is given by an exponential, see Fig. 4a, we obtain:
| (5) | |||||
| (6) | |||||
| (7) |
Recalling that, by definition, the fraction of particles in the tail of the distribution is , we find
| (8) |
Here, the function is small since is appreciable larger than , see Fig. 4. Neglecting and replacing by its short time value we then obtain, to leading order, for , as reported in the main text.
References
- Schoenholz et al. [2016] S. S. Schoenholz, E. D. Cubuk, D. M. Sussman, E. Kaxiras, and A. J. Liu, A structural approach to relaxation in glassy liquids, Nature Physics 12, 469 (2016).
- Grigera and Parisi [2001] T. S. Grigera and G. Parisi, Fast monte carlo algorithm for supercooled soft spheres, Phys. Rev. E 63, 045102 (2001).
- Ninarello et al. [2017] A. Ninarello, L. Berthier, and D. Coslovich, Models and algorithms for the next generation of glass transition studies, Phys. Rev. X 7, 021039 (2017).
- Kou et al. [2017] B. Kou, Y. Cao, J. Li, C. Xia, Z. Li, H. Dong, A. Zhang, J. Zhang, W. Kob, and Y. Wang, Granular materials flow like complex fluids, Nature 551, 360 (2017).
- Götze [2008] W. Götze, Complex dynamics of glass-forming liquids: A mode-coupling theory, Vol. 143 (OUP Oxford, 2008).
- Horbach and Kob [2001] J. Horbach and W. Kob, Relaxation dynamics of a viscous silica melt: The intermediate scattering functions, Phys. Rev. E 64, 041503 (2001).
- Garrahan and Chandler [2003] J. P. Garrahan and D. Chandler, Coarse-grained microscopic model of glass formers, Proceedings of the National Academy of Sciences 100, 9710 (2003).
- Vogel and Glotzer [2004] M. Vogel and S. C. Glotzer, Temperature dependence of spatially heterogeneous dynamics in a model of viscous silica, Phys. Rev. E—Statistical, Nonlinear, and Soft Matter Physics 70, 061504 (2004).
- Coslovich and Pastore [2009] D. Coslovich and G. Pastore, Dynamics and energy landscape in a tetrahedral network glass-former: Direct comparison with models of fragile liquids, Journal of Physics: Condensed Matter 21, 285107 (2009).
- Cummins et al. [1993] H. Z. Cummins, W. M. Du, M. Fuchs, W. Götze, S. Hildebrand, A. Latz, G. Li, and N. J. Tao, Light-scattering spectroscopy of the liquid-glass transition in and in the molecular glass salol: Extended-mode-coupling-theory analysis, Phys. Rev. E 47, 4223 (1993).
- Szamel [2013] G. Szamel, Mode-coupling theory and beyond: A diagrammatic approach, Progress of Theoretical and Experimental Physics 2013, 012J01 (2013).
- Janssen [2018] L. M. Janssen, Mode-coupling theory of the glass transition: A primer, Frontiers in Physics 6, 97 (2018).
- Charbonneau et al. [2014] P. Charbonneau, Y. Jin, G. Parisi, and F. Zamponi, Hopping and the Stokes–Einstein relation breakdown in simple glass formers, Proceedings of the National Academy of Sciences 111, 15025 (2014).
- Schweizer and Saltzman [2003] K. S. Schweizer and E. J. Saltzman, Entropic barriers, activated hopping, and the glass transition in colloidal suspensions, The Journal of Chemical Physics 119, 1181 (2003).
- Sastry et al. [1998] S. Sastry, P. G. Debenedetti, and F. H. Stillinger, Signatures of distinct dynamical regimes in the energy landscape of a glass-forming liquid, Nature 393, 554 (1998).
- Kob and Andersen [1994] W. Kob and H. C. Andersen, Scaling behavior in the -relaxation regime of a supercooled Lennard-Jones mixture, Phys. Rev. Lett. 73, 1376 (1994).
- Schrøder and Dyre [2020] T. B. Schrøder and J. C. Dyre, Solid-like mean-square displacement in glass-forming liquids, The Journal of Chemical Physics 152, 141101 (2020).
- Coslovich et al. [2018] D. Coslovich, M. Ozawa, and W. Kob, Dynamic and thermodynamic crossover scenarios in the Kob-Andersen mixture: Insights from multi-cpu and multi-gpu simulations, The European Physical Journal E 41, 1 (2018).
- Nandi et al. [2021] U. K. Nandi, W. Kob, and S. Maitra Bhattacharyya, Connecting real glasses to mean-field models, The Journal of Chemical Physics 154 (2021).
- Rusciano et al. [2022] F. Rusciano, R. Pastore, and F. Greco, Fickian non-Gaussian diffusion in glass-forming liquids, Phys. Rev. Lett. 128, 168001 (2022).
- Kob and Andersen [1995a] W. Kob and H. C. Andersen, Testing mode-coupling theory for a supercooled binary Lennard-Jones mixture I: The van Hove correlation function, Phys. Rev. E 51, 4626 (1995a).
- Ozawa et al. [2015] M. Ozawa, W. Kob, A. Ikeda, and K. Miyazaki, Equilibrium phase diagram of a randomly pinned glass-former, Proceedings of the National Academy of Sciences 112, 6914 (2015), https://www.pnas.org/doi/pdf/10.1073/pnas.1500730112 .
- Angelani et al. [2000] L. Angelani, R. Di Leonardo, G. Ruocco, A. Scala, and F. Sciortino, Saddles in the energy landscape probed by supercooled liquids, Phys. Rev. Lett. 85, 5356 (2000).
- Broderix et al. [2000] K. Broderix, K. K. Bhattacharya, A. Cavagna, A. Zippelius, and I. Giardina, Energy Landscape of a Lennard-Jones Liquid: Statistics of Stationary Points, Phys. Rev. Lett. 85, 5360 (2000).
- Sengupta et al. [2013] S. Sengupta, S. Karmakar, C. Dasgupta, and S. Sastry, Breakdown of the Stokes-Einstein relation in two, three, and four dimensions, The Journal of Chemical Physics 138 (2013).
- Das and Sastry [2022] P. Das and S. Sastry, Crossover in dynamics in the Kob-Andersen binary mixture glass-forming liquid, Journal of Non-Crystalline Solids: X 14, 100098 (2022).
- Ediger [2000] M. D. Ediger, Spatially heterogeneous dynamics in supercooled liquids, Annual review of physical chemistry 51, 99 (2000).
- Richert [2002] R. Richert, Heterogeneous dynamics in liquids: Fluctuations in space and time, Journal of Physics: Condensed Matter 14, R703 (2002).
- Rusciano et al. [2023a] F. Rusciano, R. Pastore, and F. Greco, Rusciano et al. Reply, Phys. Rev. Lett. 131, 119802 (2023a).
- Kob and Andersen [1995b] W. Kob and H. C. Andersen, Testing mode-coupling theory for a supercooled binary Lennard-Jones mixture. II. Intermediate scattering function and dynamic susceptibility, Phys. Rev. E 52, 4134 (1995b).
- Sen and Lovi [2024] S. Sen and J. Lovi, Trends in the temperature dependence of dynamical heterogeneity in strong and fragile supercooled liquids, Journal of Non-Crystalline Solids 638, 123060 (2024).
- Rusciano et al. [2023b] F. Rusciano, R. Pastore, and F. Greco, Universal evolution of Fickian non-Gaussian diffusion in two-and three-dimensional glass-forming liquids, International Journal of Molecular Sciences 24, 7871 (2023b).
- Miotto et al. [2021] J. M. Miotto, S. Pigolotti, A. V. Chechkin, and S. Roldán-Vargas, Length scales in Brownian yet non-Gaussian dynamics, Phys. Rev. X 11, 031002 (2021).
- Chaudhuri et al. [2007] P. Chaudhuri, L. Berthier, and W. Kob, Universal nature of particle displacements close to glass and jamming transitions, Phys. Rev. Lett. 99, 060604 (2007).
- Pastore et al. [2015] R. Pastore, A. Coniglio, and M. Picca-Ciamarra, Dynamic phase coexistence in glass–forming liquids, Scientific reports 5, 11770 (2015).
- Horbach et al. [1999] J. Horbach, W. Kob, and K. Binder, Specific heat of amorphous silica within the harmonic approximation, The Journal of Physical Chemistry B 103, 4104 (1999).
- Ozawa et al. [2018] M. Ozawa, A. Ikeda, K. Miyazaki, and W. Kob, Ideal glass states are not purely vibrational: Insight from randomly pinned glasses, Phys. Rev. Lett. 121, 205501 (2018).
- Bouchaud et al. [1987] J. Bouchaud, A. Comtet, A. Georges, and P. Le Doussal, Anomalous diffusion in random media of any dimensionality, Journal de Physique 48, 1445 (1987).
- Porpora et al. [2022] G. Porpora, F. Rusciano, R. Pastore, and F. Greco, Comparing microscopic and macroscopic dynamics in a paradigmatic model of glass-forming molecular liquid, International Journal of Molecular Sciences 23, 3556 (2022).
- De Marzio et al. [2017] M. De Marzio, G. Camisasca, M. Rovere, and P. Gallo, Microscopic origin of the fragile to strong crossover in supercooled water: The role of activated processes, The Journal of Chemical Physics 146 (2017).
- Hess et al. [1996] K.-U. Hess, D. Dingwell, and E. Rössler, Parametrization of viscosity-temperature relations of aluminosilicate melts, Chemical Geology 128, 155 (1996).
- Rössler et al. [1998] E. Rössler, K.-U. Hess, and V. Novikov, Universal representation of viscosity in glass forming liquids, Journal of Non-Crystalline Solids 223, 207 (1998).
- Rössler and Sokolov [1996] E. Rössler and A. Sokolov, The dynamics of strong and fragile glass formers, Chemical Geology 128, 143 (1996).
- Pastore et al. [2014] R. Pastore, A. Coniglio, and M. Picca-Ciamarra, From cage-jump motion to macroscopic diffusion in supercooled liquids, Soft Matter 10, 5724 (2014).
- Jiang et al. [2020] A. Jiang, J. Shang, X. Liu, Y. Tang, H. K. Kwan, and Y. Zhu, Efficient CSP algorithm with spatio-temporal filtering for motor imagery classification, IEEE Transactions on Neural Systems and Rehabilitation Engineering 28, 1006 (2020).
- Helfferich et al. [2014] J. Helfferich, F. Ziebert, S. Frey, H. Meyer, J. Farago, A. Blumen, and J. Baschnagel, Continuous-time random-walk approach to supercooled liquids. I. Different definitions of particle jumps and their consequences, Phys. Rev. E 89, 042603 (2014).
Supporting Information for
At low temperatures, glass-forming liquids relax in a simple way
Francesco Rusciano, Raffaele Pastore, Francesco Greco, and Walter Kob