ODIN: Star Formation Histories Reveal Formative Starbursts Experienced
by Lyman Alpha Emitting Galaxies at Cosmic Noon
Abstract
In this work, we test the conventional assumption that Lyman Alpha Emitting galaxies (LAEs) are experiencing their first major burst of star formation at the time of observation. To this end, we identify 74 LAEs from the ODIN Survey with rest-UV-through-NIR photometry from UVCANDELS. For each LAE, we perform non-parametric star formation history (SFH) reconstruction using the Dense Basis Gaussian process-based method of spectral energy distribution fitting. We find that a strong majority (67%) of our LAE SFHs align with the conventional archetype of a first major star formation burst, with at most modest star formation rates (SFRs) in the past. However, the rest of our LAE SFHs have significant amounts of star formation in the past, with 28% exhibiting earlier bursts of star formation with the ongoing burst having the highest SFR (dominant bursts), and the final 5% having experienced their highest SFR in the past (non-dominant bursts). Combining the SFHs indicating first and dominant bursts, ∼95% of LAEs are experiencing their largest burst yet– a formative burst. This suggests that LAEs have more complicated stellar mass assembly than expected. We also find that the fraction of total stellar mass created in the last 200 Myr is 1.33 times higher in LAEs than in control Lyman Break Galaxy (LBG) samples, and that a majority of LBGs are experiencing dominant bursts, reaffirming that LAEs differ from other star forming galaxies. Overall, our results suggest that multiple evolutionary paths can produce galaxies with strong observed Ly emission.
1 Introduction
Lyman Alpha Emitting (LAE) galaxies are widely used to study both galaxy formation and cosmology because they provide the most readily accessible observational probe of low-mass, high-redshift galaxies. LAEs are conventionally understood as young, low-mass, low-dust galaxies experiencing their first major burst of star formation at the time of observation (Partridge & Peebles, 1967). The resulting strong Ly emission at a rest-frame wavelength of 121.6 nm allows LAEs to serve as highly identifiable probes of the high-redshift universe. In both blind spectroscopic surveys and narrowband imaging surveys, the primary criterion for classifying an object as an LAE is that its observed rest-frame Ly equivalent width (EW) must reach a certain threshold (typically taken to be 20 Å (Ouchi et al., 2020)). This carries an implication of active star formation from hot young O-type and B-type stars (e.g., Kunth et al., 1998; Hui & Gnedin, 1997) compared to the ultraviolet continuum emission from O-type, B-type, and A-type stars (in cases where Ly emission is not driven by active galactic nuclei). However, Ly EW does not reveal any information about the level of star formation in the context of a galaxy’s lifetime or the underlying radiative transfer scenarios that may generate such a high observed equivalent width. The question of whether or not all LAEs assemble stellar mass in a congruent and unique way remains open. For example, are all LAEs young galaxies in their first burst of star formation at the time of observation, as the Partridge & Peebles (1967) conventional model of LAEs implies? Can an LAE only be an LAE once or can a galaxy become an LAE several times throughout its lifetime? Answers to these questions will provide insight into the complex evolutionary paths and intergalactic conditions that make LAEs such profound beacons of the high- universe. In order to begin to answer these questions, we turn to spectral energy distributions (SEDs).
With the advent of wide-field multi-wavelength imaging surveys, we have been able to create SEDs of high redshift galaxies that span rest-frame wavelengths ranging from the ultraviolet (UV) to near-infrared (NIR) (e.g., Papovich et al., 2001; Shapley, 2011). This has allowed us to fit these SEDs to spectral templates with well-understood features to constrain the physical properties of galaxies. Gawiser et al. (2007) used this technique to conclude that a typical LAE at = 3.1 has an average stellar age of 20 Myr, a low stellar mass of , a moderate star formation rate (SFR) of 2 yr-1, and negligible dust extinction of . Guaita et al. (2011) conducted a similar analysis at = 2.4 and also found that LAEs are typically low-mass galaxies with moderate dust content of = 0.22. Their results suggested that = 2.4 LAEs are dominated by young stars with a median stellar age of 10 Myr, implying that LAEs are undergoing an intense burst of star formation at the time of observation. Further, Vargas et al. (2014) used flux stacked SEDs from CANDELS to determine that LAEs at = 2.1 have a median stellar mass of , a median age of 100 Myr, and a typical extinction of of 0.12. Comparably, Acquaviva et al. (2012) used stacked SEDs of = 2.1 and = 3.1 LAEs to investigate the typical physical properties of LAEs at each of these redshifts. They found that it is unlikely for = 3.1 LAEs to evolve into = 2.1 LAEs, suggesting that there is a discrepancy between the expected evolutionary path of LAEs from clustering analysis and SED results. Kusakabe et al. (2018) measured stacked LAE properties over four different fields using SED fitting and found a mean stellar mass of , a mean age of Myr, and a mean SFR of 3.4 yr-1. While these studies affirm the characterization of LAEs as generally young, low-mass, low-dust galaxies, there are notable discrepancies in their stacked measurements of stellar age, stellar mass and dust content. These discrepancies suggest that LAEs might have more complex, non-uniform evolutionary pathways, but stacked analyses can be challenging to interpret. Without understanding of the shape of individual LAE star formation histories, it is difficult to understand the diversity in stellar mass assembly scenarios that can produce LAEs with these properties.
Following those studies, several groups made efforts to infer information about the shape of LAE SFHs. Rosani et al. (2020) compared the instantaneous and average star formation rates of LAEs to show that some LAEs may be experiencing a “rejuvenation event” in which star formation recently restarted after the majority of their stellar mass was created. However, these studies were unable to quantify the time, duration, amplitude, or frequency of the past star formation episode(s). The most recent studies of LAE star formation histories built on these analyses by testing SFHs of several predetermined functional forms, but distinguishing between different SFH models proved challenging (Iani et al., 2024; Ceban, 2024). Due to the inevitable limitations of parametric SFH reconstruction techniques, these previous works have not been able to make definitive conclusions about the temporal processes and diversity of LAE stellar mass assembly.
All of these results have brought us closer to understanding the full picture of the physical nature of LAEs, however, it is not until now that we can use SEDs to uncover the detailed non-parametric histories of star formation and quenching throughout the lifetime of individual LAEs (and LBGs) without introducing significant bias. The Dense Basis approach (Iyer & Gawiser, 2017; Iyer et al., 2019) is a non-parametric Gaussian processes-based method for SED fitting and star formation history reconstruction (see also Heavens et al., 2000; Reichardt et al., 2001; Tojeiro et al., 2007; Leja et al., 2017; Johnson et al., 2021). Due to Dense Basis’s non-parametric nature, it is able to encode a maximum amount of information within a (flexible) minimum amount of parameters. The Gaussian process element of Dense Basis allows us to reconstruct smooth star formation histories with non-specific functional forms. This minimizes bias in SFH parameterization at all lookback times and allows for star formation histories with several peaks. Together, these improvements enable the reconstruction of realistic star formation histories with higher time resolution and allow us to better constrain key parameters such as stellar mass. This makes Dense Basis ideally suited for measuring the frequency and amplitude of star formation episodes in LAEs and LBGs in order to better understand if LAEs are uniquely experiencing their first major burst of star formation at the time in which we observe them.
The One-hundred-deg2 DECam Imaging in Narrowbands (ODIN) is a NOIRLab survey program designed to discover large samples of LAEs at Cosmic Noon using narrowband imaging over extremely wide fields (Lee et al., 2024). In order to create these LAE samples, ODIN utilizes three custom-made narrowband filters built for the Dark Energy Camera (DECam) on the Víctor M. Blanco 4m telescope at the Cerro Tololo Inter-American Observatory (CTIO) in Chile. These narrowband filters, N419, N501, and N673, correspond to LAE redshifts 2.4, 3.1, and 4.5 . Using these samples, we are able to identify protoclusters, trace cosmic filaments, and follow the evolution of large scale structure during Cosmic Noon (e.g., Ramakrishnan et al., 2023, 2024a, 2024b; Im et al., 2024). With ODIN’s final dataset, we anticipate a sample of 100,000 LAEs covering an area of 100 deg2. Due to the vast photometric coverage in COSMOS from surveys like UVCANDELS (Grogin et al., 2011; Koekemoer et al., 2011; Wang et al., 2024), ODIN’s LAE sample opens up many opportunities for synergistic research.
In this work, we cross-match ODIN’s LAE samples with the UVCANDELS photometric catalog in COSMOS to create sub-samples of LAEs with rest-UV-through-NIR photometry. With these data, we implement the Dense Basis approach to SED fitting and star formation history reconstruction and present the first analysis that can accurately characterize the diversity of LAE stellar mass assembly. In Section 2 we introduce ODIN’s LAE samples and the UVCANDELS photometric catalog. In Section 3.1 we discuss the Dense Basis methodology and introduce the SED fitting parameters and priors used in this analysis. In Section 3.2 we discuss the generation of LAE samples and control LBG samples, and in Section 3.3 we discuss star formation history analysis techniques. In Section 4 we introduce three sub-classes of LAE star formation histories, discuss the implications for LAE stellar mass assembly scenarios and progenitor histories, compare results to the control LBG samples, and re-evaluate the conventional assumptions about star formation in LAEs. The main conclusions of this work are summarized in Section 5. Throughout this work, we assume CDM cosmology with = 0.7 and = 0.27.
2 Data
2.1 ODIN LAE Samples
Firestone et al. (2024) introduced an improved technique for estimating Ly emission line strength, the hybrid-weighted double-broadband continuum estimation technique, as well as an innovative method for low redshift emission line galaxy interloper rejection. In short, LAEs were selected by looking for significant narrowband excess compared to the continuum estimated by two nearby broadband filters. When this narrowband excess corresponded to an estimated rest-frame Ly EW of 20 Å or higher, that object was classified as an LAE. Utilizing a combination of narrowband excess and galaxy colors, several objects consistent with low- interlopers such as [O II] emitters and Green Pea galaxies were eliminated from the LAE sample. With this new methodology, Firestone et al. (2024) introduced ODIN’s inaugural sample of 6032, 5691, and 4066 LAEs at = 2.4, 3.1, and 4.5 , respectively, in the extended COSMOS field (9 deg2). These constitute some of the largest redshift-specific samples of narrowband-selected LAEs to date (comparable to those introduced by Kikuta et al. (2023)). With ODIN’s samples, Firestone et al. (2024) presented scaled median stacked SEDs, revealing the overall success of ODIN’s selection methods. Due to the vast array of rest-ultraviolet-through-near-infrared photometry available in the COSMOS field, we can search for photometric counterparts of ODIN’s LAEs and use multi-wavelength photometry to fit model SEDs to our data.
2.2 (UV)CANDELS Photometric Catalog
CANDELS (Grogin et al., 2011; Koekemoer et al., 2011) is a photometric imaging survey aimed at probing the galaxy population during Cosmic Noon (and Dawn) using the Hubble Space Telescope’s near-infrared Wide Field Camera 3 (WFC3) and optical Advanced Camera for Surveys (ACS). Complementary to CANDELS, the UVCANDELS Survey111UVCANDELS data is available on the Mikulski Archive for Space Telescopes at https://archive.stsci.edu/hlsp/uvcandels (Wang et al., 2024) introduced UV coverage to four of the CANDELS fields with the WFC3/ (with a depth of AB = 27) and ACS/ (with a depth of AB 28.0) filters. Together with photometric data from CFHT (Gwyn, 2012), Subaru (Taniguchi et al., 2007, 2015), UltraVISTA (McCracken et al., 2012), IRAC (Ashby et al., 2013; Sanders et al., 2007), and NEWFIRM (Whitaker et al., 2011), we have access to measurements from 46 filters (plus ODIN’s three narrowbands). With these data, UVCANDELS has made photometric redshift measurements for each of their sources (see Mehta et al. (2024) for details on photo- measurement techniques).
3 Methodology
3.1 Star Formation History Reconstruction
A spectral energy distribution is a powerful tool for uncovering the history of star formation and quenching throughout the lifetime of a galaxy. In this work, we implement the Dense Basis non-parametric Gaussian process-based SFH reconstruction method of Iyer & Gawiser (2017) and Iyer et al. (2019). Parametric star formation histories typically allow for only a single peak of SFR, and for an actively star-forming galaxy like an LAE, this starburst is then highly likely to occur at the time of observation. For this reason, parametric models introduce significant biases in their solutions (see Simha et al., 2014; Carnall et al., 2019; Leja et al., 2019). In contrast, Dense Basis allows us to study star formation histories in much greater detail and with higher accuracy, including the possibility of multiple episodes of star formation. The Dense Basis method has been shown to yield non-parametric star formation history predictions that are robust enough to produce results consistent with the true properties of simulated galaxies, even in the presence of photometric noise (see Figure 6 in Iyer et al. (2019)).
In order to generically go from an SED to a star formation history, we first fit SED datapoints to Flexible Stellar Population Synthesis (FSPS; Conroy et al., 2009; Conroy & Gunn, 2010) templates with well-understood properties. We then assume a stellar metallicity, a stellar initial mass function, a dust attenuation model, and an absorption law for the effects of the intergalactic medium. Each of these assumptions helps turn a generic stellar population into a realistic galaxy model. We then compare the resultant model SED to observations and use spectral template features such as Ly for recent star formation, emission lines like H and [O III] for ISM conditions, long wavelengths for past star formation, and IR wavelengths for dust re-emission. These features allow us to infer the rate of star formation vs. time. SFHs enable us to uncover the physical nature of galaxies and better understand their life-stories and global properties. For a more detailed description of the Dense Basis SED fitting and SFH reconstruction methodology, please refer to Section 2 of Iyer et al. (2019).
For our SFH reconstruction via SED fitting, we adopt the fiducial priors from the observed properties of LAEs (e.g., Gawiser et al., 2007; Guaita et al., 2011; Vargas et al., 2014; Acquaviva et al., 2012) as follows. We assume the log stellar mass in units of solar masses is uniform from 7 to 12, the log of the instantaneous star formation rate is uniform from 1.0 to 2.0, log(metallicity/) is uniform from 1.5 to 0.2, and the prior for the lookback times is Dirichlet with alpha = 3.0 (Leja et al., 2017, 2019). We also assume Chabrier IMF (Chabrier, 2003) and a Calzetti dust model (Calzetti et al., 2000) with a flat dust extinction prior from 0.0 to 2.0. Lastly, we assume a flat redshift distribution, confined by the full-width half-max (FWHM) of ODIN’s narrowband filter transmission curves (Lee et al., 2024). We note that these FWHM measurements are in good agreement with the redshift distributions of the DESI-confirmed ODIN - and -selected LAEs (see Figure 3 of White et al. (2024)). We find that these priors do not result in posterior distributions that push up against the prior bounds, indicating that our priors are not unreasonable and do not introduce significant bias into our measurements. Further, we find that changing the number of parameters used in the priors would not produce any notable difference in the conclusions of this work.
To carry out our SED fitting, we begin with all CANDELS and ODIN filters outlined in Table 1. We chose to exclude IRAC channels 3 and 4 since their large PSF and photometric errors often result in strong disagreement with other photometric bands, artificially driving up SED-fit reduced values. We also remove any narrow- and intermediate band filters that contain the Ly emission line for a given object. This may initially seem counter-intuitive, however, we should not fully trust the Ly produced by stellar population synthesis models since it does not capture the complexity of Ly radiative transfer. Therefore, in addition to the relevant ODIN narrowband, for the = 2.4, 3.1, and 4.5 samples we eliminate the , , and intermediate band filters, respectively. Finally, we introduce observed photometric error floors, which have been found to successfully represent a combination of systematic errors in photometric calibration and SED template incompleteness (Iyer, 2019).
| (1) |
where is the measured flux error for a particular filter, is a fractional zeropoint uncertainty, is the measured flux for a particular filter, and is the new observed error used in the SED fitting. For space-based observations we use = 0.03 and for ground-based observations and IRAC data we use = 0.10, as adapted from (Iyer, 2019). This allows us to give more weight to space-based photometry, for which we have less variation in observing conditions and greater confidence.
3.2 LAE & Control LBG Samples
In order to ensure that our samples are as pure as possible, we create LAE and control LBG samples utilizing SED-fit reduced values and, in the case of the LBGs, UVCANDELS photo- data.
For our LAE sample, we begin by taking each ODIN LAE in COSMOS that has UVCANDELS photometry. We then only retain objects with Dense Basis SED reduced values 2.6. We determined this cutoff by matching the maximum SED-fit reduced for an object with spec- confirmation. We find that this corresponds well to the transition between objects with and without strong UVCANDELS photo- agreement. We note that the majority of the discarded objects are likely still LAEs since our narrowband photometry, which can be crucial for constraining redshift, is not included in the SED fitting or photo-z calculation. However, we choose to leave them out of our sample to ensure sample purity, thereby reducing the risk of misleading conclusions from outliers. This reduced cut also limits any potential contamination from active galactic nuclei, which tend to have very poor SED fits. In order to make sure this method does not introduce any strong systematic biases into our data, we examine the magnitude distributions in and narrowband filters for the LAEs with compared to those with . We find no indications of systematic bias. We also examine the EW distribution of the -limited sample and find that the majority of the eliminated objects are on the lower EW end of the samples, though many low EW LAEs still remain. This indicates that we are protected against the most likely low- interlopers, which often have lower EWs. We find that there are 31, 21, and 22 LAEs in the final samples for = 2.4, 3.1, and 4.5, respectively.
Companion to our LAE samples, we create control samples of generic star forming galaxies with comparable redshift by selecting galaxies primarily based on their Lyman Break, i.e. Lyman Break Galaxies (LBGs). To create the control LBG samples, we follow a more stringent procedure compared to that of the LAE samples since ODIN’s LAE samples have already undergone a rigorous selection process utilizing ODIN narrowband photometry (see Firestone et al., 2024). To accomplish this, we utilize UVCANDELS photo- measurements (Mehta et al., 2024). In general, the enhanced UV coverage helps to better constrain photo- measurements and increase confidence in our sample purity, especially for the = 2.4 sample for which is particularly helpful for picking up the Lyman break (310 nm).
For each object in COSMOS that has UVCANDELS photometry, we first integrate the UVCANDELS redshift probability density function (PDF) over a redshift range twice as broad as the FWHM of each of ODIN’s filter transmission curves with the same median redshift. We chose this range since it is much more difficult to constrain LBG redshifts without narrowband imaging. This also helps us to retain a reasonable sample size for comparison without sacrificing sample purity. We then divide the integral over this range by the total integrated PDF to get the probability that a given object falls into that redshift range. From this sample, we select all objects that have a 68% probability of falling into this range. These steps ensure that the LBG sample has a comparable redshift range to ODIN’s LAE sample. We retain objects with SED reduced values 2.6 (for uniformity with the LAEs) and remove a small fraction of objects that are already classified as LAEs (roughly 3%). Lastly, we set a maximum stellar mass limit such that the median stellar mass of each control LBG sample matches the corresponding LAE sample. Although LAEs are typically younger and lower-mass than LBGs, we chose to apply a mass limit to the LBG sample in order to best compare fundamental galaxy properties and limit any biases introduced by differences in either stellar mass or the resulting total SED signal to noise ratio for otherwise similar galaxies. After these steps, we find 27, 160, and 74 LBGs in the control samples for = 2.4, 3.1, and 4.5, respectively. We also retain the higher-mass LBG sample at each redshift to be used for assessing overall LBG sample characteristics (see Figure 5).
3.3 Measuring The Largest Burst(s) of Star Formation
In order to determine the time of a galaxy’s most prominent period of star formation, we search for the SFH peak corresponding to the galaxy’s maximum star formation rate. If this peak coincides with the time of observation (with a resolution of 200 Myr due to the near-UV SFR timescale found by Broussard et al. 2019), then we conclude that a galaxy is currently experiencing its most significant burst of star formation thus far. To validate this method, we also determine the largest cumulative stellar mass generated within 100 Myr of an SFR peak. We find that this would make no significant difference in results except in discriminating against bursts that have not ramped down by the time of observation in cases where there is significant stellar mass assembly in the past.
We also determine the fraction of cumulative stellar mass created at the time of observation, with a resolution of 200 Myr. We accomplish this by integrating the star formation rate as a function of time to compute a cumulative stellar mass formed (not accounting for stellar death) over the last 200 Myr, and then divide that by the total stellar mass accumulated over the lifetime of each galaxy.
4 Results
As a quick reality check, we compare the median values for yr, , and for each sample at each redshift. For yr, we find median values of 0.72, 0.77, and 1.2 for = 2.4, 3.1, and 4.5, respectively. For , we find median values of 8.6, 8.8, and 9.3, respectively. For , we find median values of 0.50.2, 0.5, and 0.5, respectively.
4.1 LAE Star Formation Histories
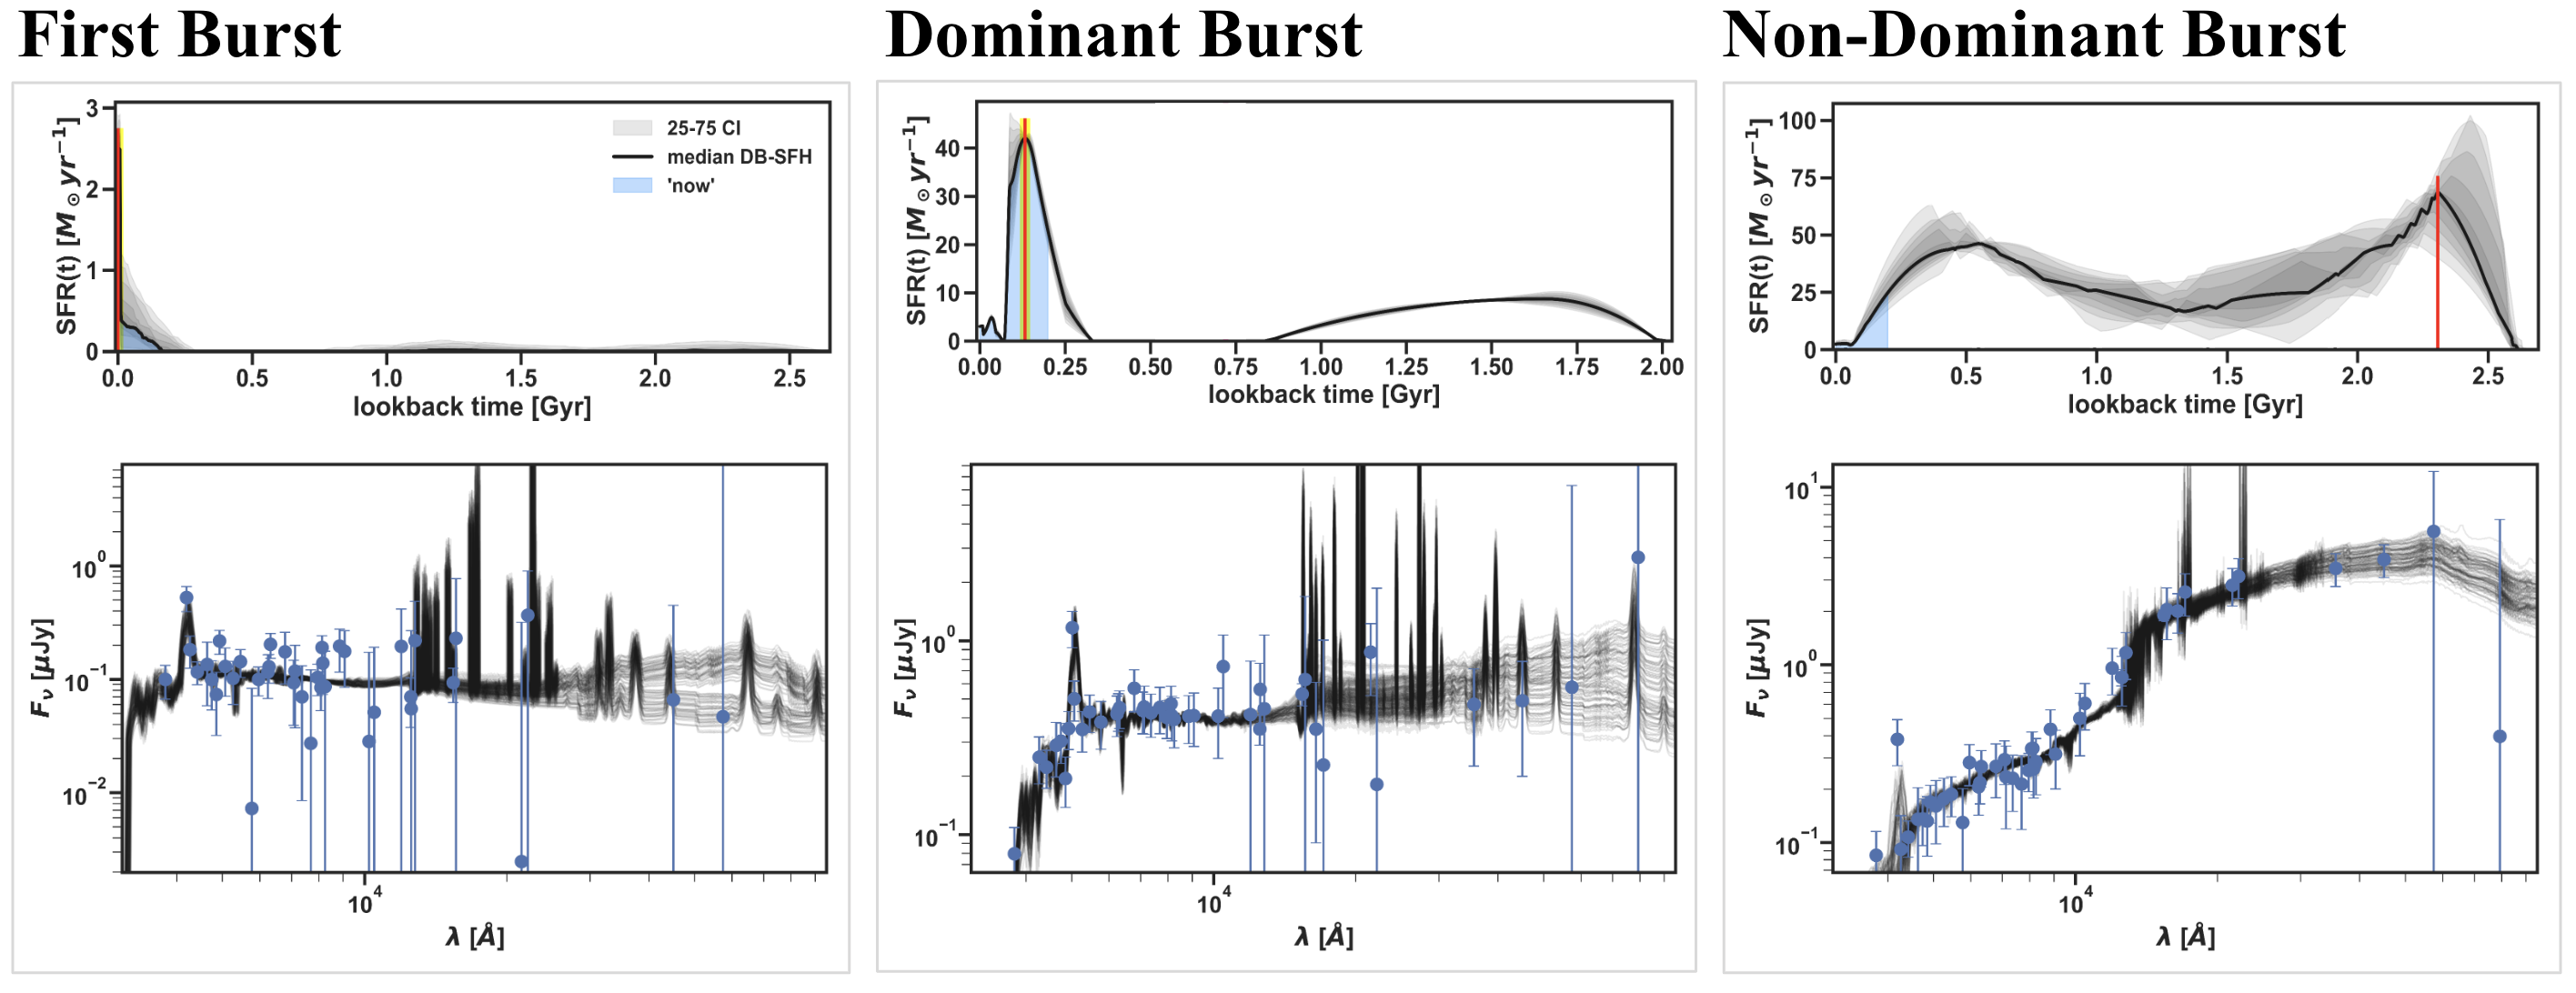
For this paper, we consider three different possible LAE star formation history archetypes (see Figure 6). The first is that associated with the conventional paradigm for LAEs, i.e., galaxies undergoing their first burst of star formation (SFR yr-1) at the time of observation. Alternatively, a galaxy may be undergoing a dominant burst of star formation; in these objects, significant (SFR yr-1) bursts of star formation occurred in the past, but none of these bursts are as large as the present SFR. The third category is for non-dominant burst LAEs; in these objects, the greatest SFR occurred in the past.
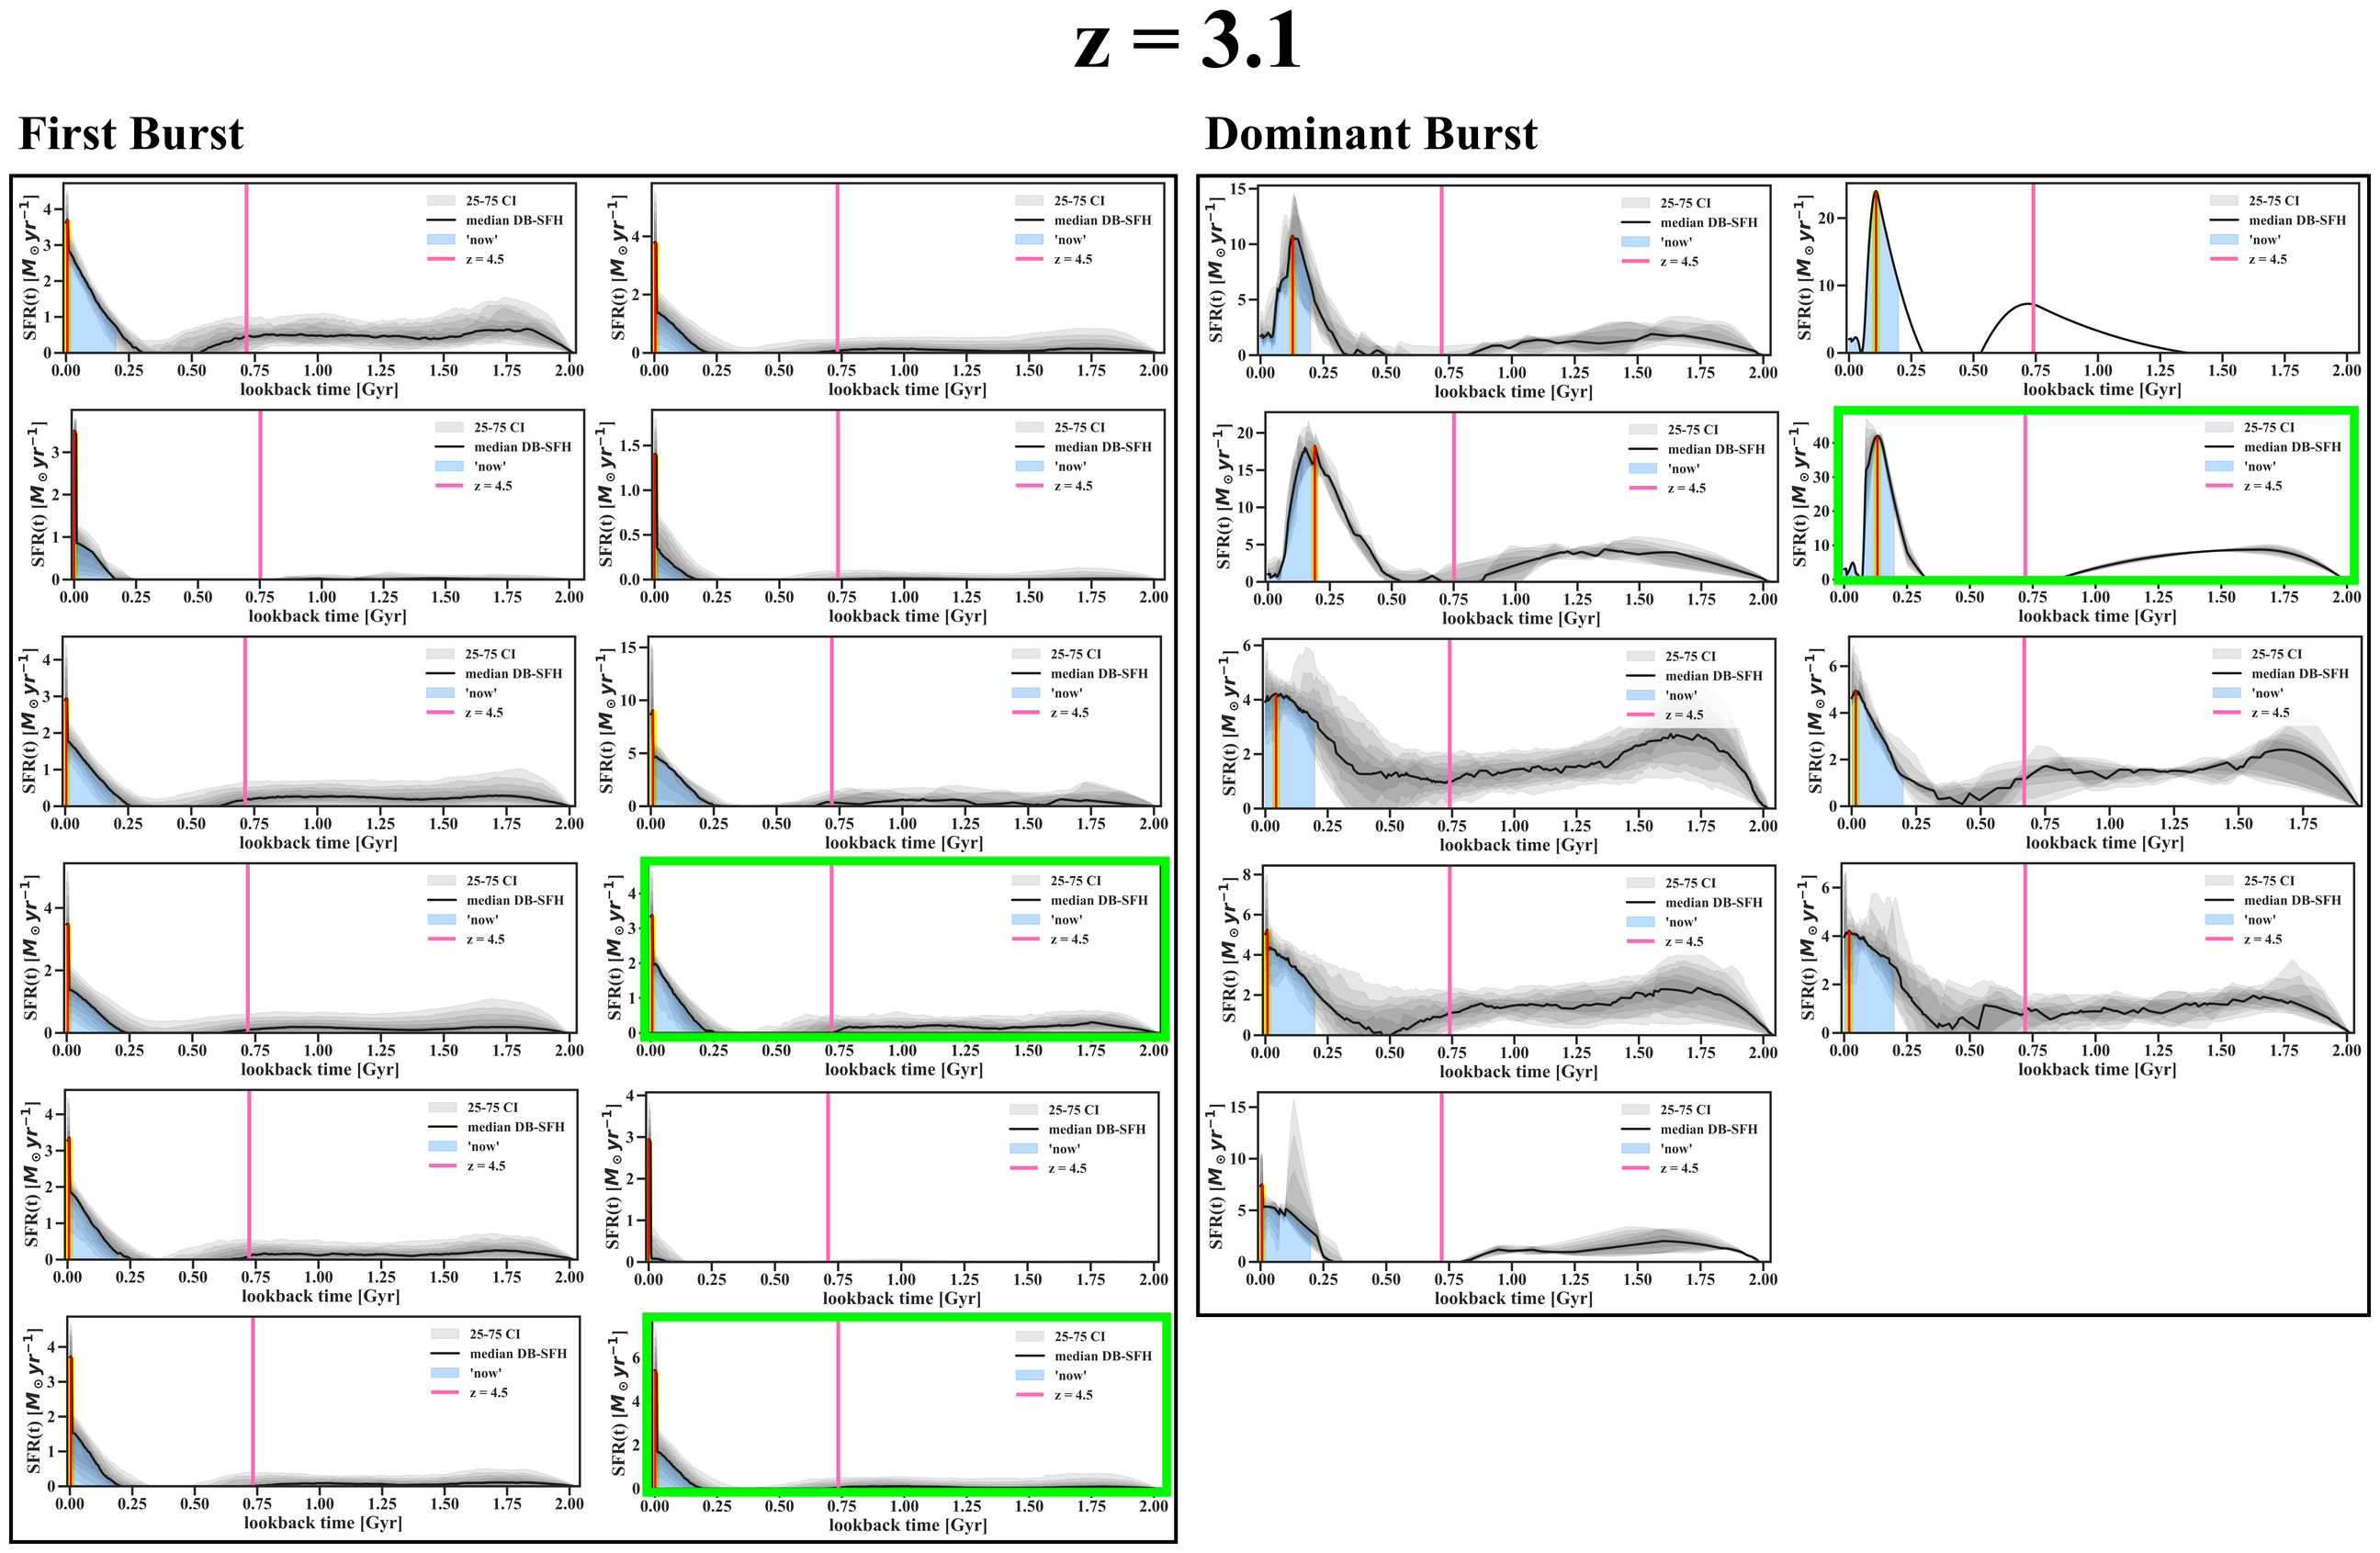
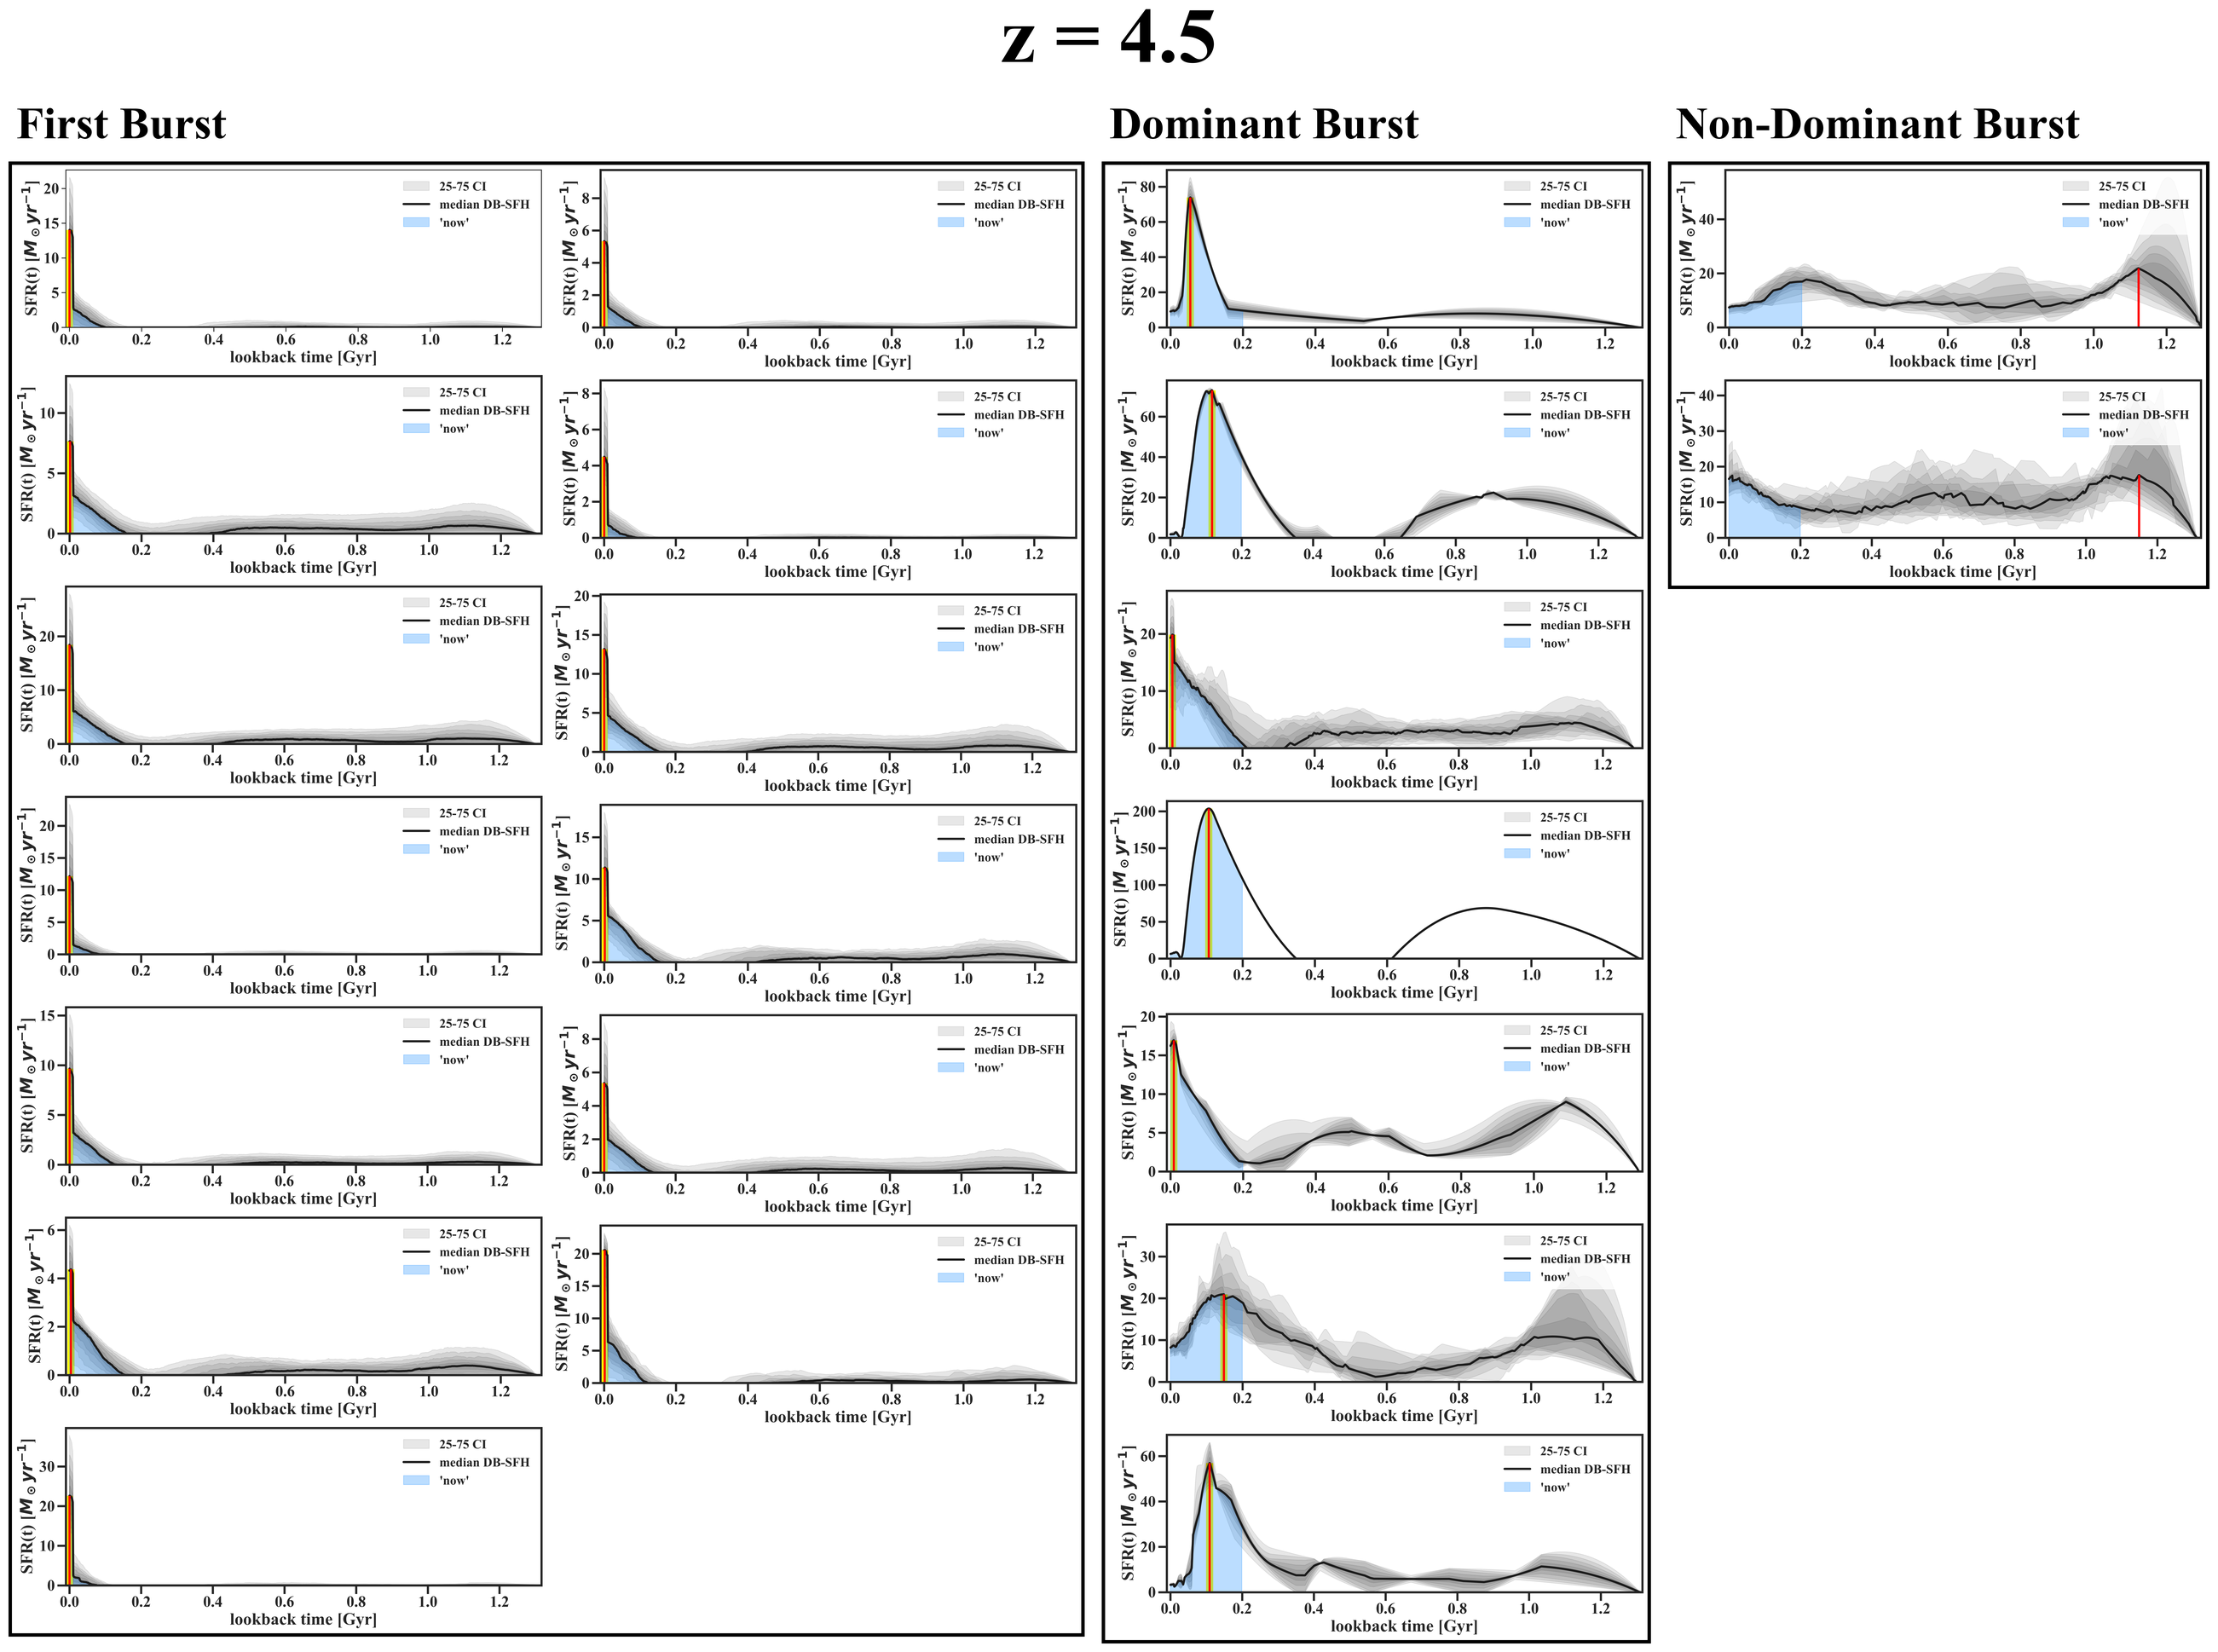
At = 2.4, 3.1, and 4.5, respectively, we find that 77%, 57%, and 59% of LAEs fall into the first burst category; 16%, 43%, and 32% fall into the dominant burst category; and 6%, 0%, and 9% fall into the non-dominant burst category (see Figures 2-4 for individual star formation histories for each LAE sample). These results suggest that undergoing a first major burst of star formation at the time of observation is quite common but is not a prerequisite for a galaxy to be classified as an LAE. We can, therefore, conclude that there must be multiple stellar mass assembly scenarios capable of exhibiting strong Ly emission at the time of observation.
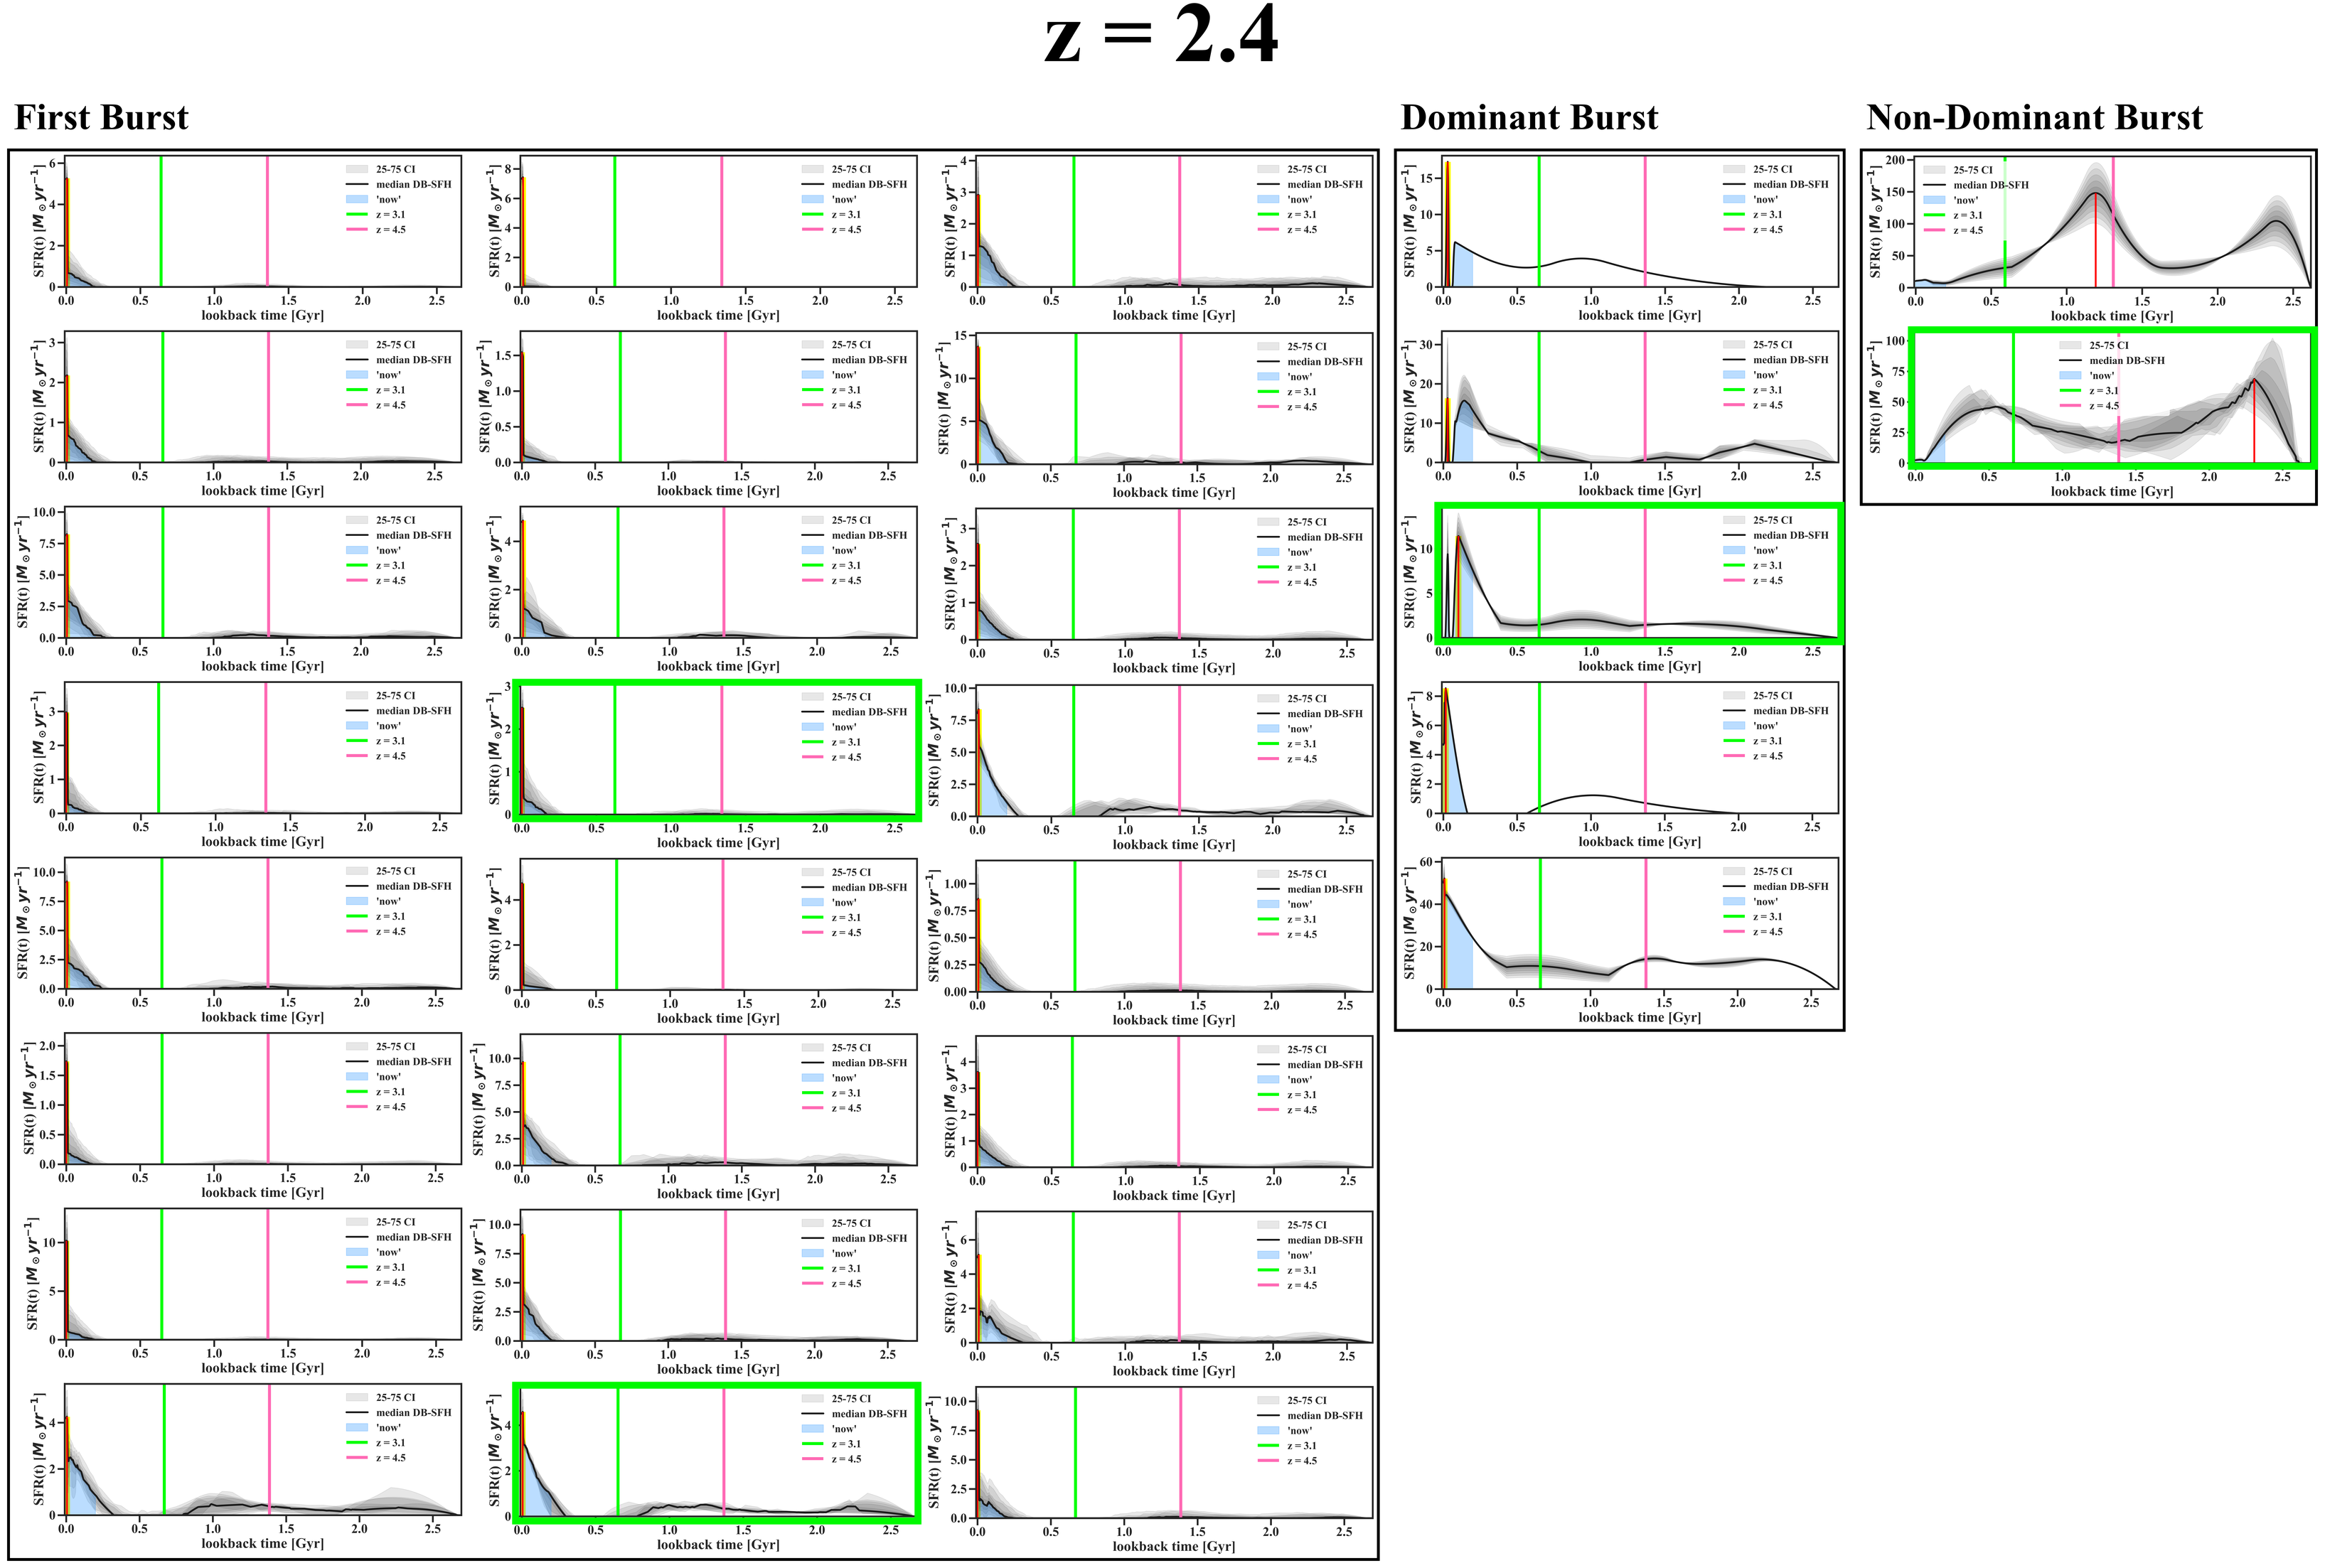
While dominant burst LAEs are not entirely out of the realm of expected LAE SFHs, it would have been highly surprising if non-dominant burst LAEs were common in the samples. This is because LAEs are selected for ongoing star formation without significant quenching of Ly photons by dust. That being said, even the presence of the four observed non-dominant bursts is worth trying to understand (despite the small number statistics of finding two such LAEs at and two more at prohibiting us from being able to make precise measurements about just how rare this type of LAEs is at each redshift). We note that the minimum time-of-observation SFR of our LAEs is not particularly high, roughly yr-1. For more massive galaxies like those seen as non-dominant bursts at = 2.4, this does not require anything close to a peak of star formation. A lack of dust is harder to imagine in such galaxies. This implies that the regions of such galaxies from which Ly photons are escaping have either had most of their dust destroyed and not yet re-formed in a new starburst, or that the anisotropic radiative transfer of those Ly photons is fortuitous in allowing them to escape towards Earth.
Further, we find that the = 4.5 LAEs with non-dominant burst star formation histories tend to have maximum bursts of star formation with similar amplitudes to LAEs with first burst and dominant burst star formation histories at the same redshift. In contrast, the = 2.4 LAEs with non-dominant burst star formation histories experienced bursts of star formation that are an order of magnitude higher in amplitude than those of first burst and dominant burst LAEs. We interpret these 2 LAEs as possible evidence of several past galaxy mergers, which have built the galaxies’ current stellar mass over the course of 2.8 billion years. That being said, there is still more investigation into the morphology of these sources that is needed to draw more definitive conclusions about the likelihood of these scenarios. For this reason, we encourage the reader to interpret these LAEs with non-dominant burst SFHs as interesting case studies that highlight the diversity in possible LAE stellar mass assembly scenarios rather than representations of all non-dominant burst LAEs within the overall population.
In Figure 5, we present the total stellar mass distribution for LAEs compared to LBGs within each star formation history archetype. For further comparison, we also plot random subsets of high stellar mass LBGs that were not included in the stellar mass-limited sample. The breakdown of objects in each subplot of Figure 5 reveals that LAEs preferentially fall into the first burst archetype while LBGs preferentially fall into the dominant burst archetype, hinting at a characteristic difference in stellar mass assembly scenarios that are likely to produce a galaxy detected as an LAE vs. an LBG. We find that the total stellar mass accumulated, , increases modestly as we move from first burst to dominant burst, to non-dominant burst, telling us that the functional behaviors of the star formation histories also generally correlate with cumulative stellar mass.
4.2 Formative Burst of Star Formation
In this section we refer to all stellar mass assembly in the last 200 Myr as “the time of observation” since the UV SFR is a weighted average over the last 200 Myr SFR. We find that 94%, 100%, and 91% of LAEs are in their maximum period of star formation since the Big Bang at the time of observation at = 2.4, 3.1, and 4.5, respectively, compared to 100%, 99%, and 97% of the corresponding LBG samples. The differences are not significant compared to Poisson uncertainties in the numbers of galaxies with non-dominant bursts at each epoch.
We further investigate the stellar mass assembly by measuring the median fraction of stellar mass created during the time of observation for LAEs compared to LBGs. We find that is 1.03, 1.33, and 1.64 times higher in LAEs than LBGs at = 2.4, 3.1, and 4.5, respectively (see Figure 6). To test the statistical significance of the difference in the distribution of measurements for LAEs vs. LBGs, we perform a Kolmogorov-Smirnov test (e.g., Berger & Zhou, 2014), which returns p-values of 0.80, 1.8E-04, and 1.7E-05, respectively. We conclude that the null hypothesis of being drawn from the same underlying distribution is rejected with very high confidence for the = 3.1 and 4.5 samples. The null hypothesis of being drawn from the same underlying distribution is not rejected for the = 2.4 samples. This suggests that LBGs at = 2.4 are more like LAEs at = 2.4 than the higher- LBGs, however it may also be a consequence of the smaller LBG sample size, making it more difficult to distinguish any noticeable differences between the LAEs and LBGs. Overall, these results suggest that LAEs typically assemble more fractional stellar mass than LBGs in the 200 Myr prior to observation, although the quantitative difference is not dramatic.
Examining Figure 6 in more detail, we note that very few objects’ SFHs are consistent with forming 100% of their stellar mass within the last 200 Myr. Even though first burst LAEs represent a majority, the SFHs typically imply low-level star formation at earlier times, with SFRs too low for us to classify as “bursts.” This is not unexpected given hierarchical structure formation; even in a region of the universe that is just forming an LAE at the time of observation, it would be quite surprising if no low-mass galaxies with existing stars were present. Additionally, we see a higher fraction of recent stellar mass in the lower-redshift samples (see Figure 6). We hypothesize that this is because the mass range of our LAE (and hence LBG control) samples is evolving downwards (due to luminosity distance squared) faster than galaxy properties are evolving.
The broader characterization of LAE star formation discussed in this section leads us to the conclusion that most LAEs are best described as experiencing a formative burst of star formation, ie. a burst that played a major role in the formation of the galaxy being observed. We designate this significant subset of LAEs by combining the galaxies with first burst and dominant burst SFH archetypes. The results discussed in this section also elucidate clear differences between the LAE and LBG samples, however they still do not provide a full picture of the fundamental differences driving the detection of a galaxy as an LAE vs. an LBG. Further investigation into radiative transfer mechanisms and ISM geometry including the opening angle for Ly emission will be necessary to more fully develop this picture.
4.3 Is the LAE Phenomenon Long- Lived?
While we find that the vast majority of LAEs are experiencing a formative burst of star formation, the prevalence of past star formation in our LAE SFHs motivates the question of whether or not an LAE had sufficient past star formation to plausibly have been an LAE at earlier times as well. We investigate this possibility by comparing the star formation rates at earlier times to those of our LAEs at the time of observation. When the star formation rate of an LAE at any given lookback time is comparable to the minimum time-of-observation star formation rate of our LAE samples, 1 yr-1, we consider this object to have possibly been an LAE at an earlier time as well. We note that this star formation rate threshold should be interpreted as a necessary but far from sufficient condition for these objects to be classified as an LAE at earlier times. This is because the star formation rate is not the only factor that contributes to a galaxy being classified as an LAE since it does not incorporate the nuances of radiative transfer and the orientation of the line-of-sight to Earth.
We find that only 23% (7) of the = 2.4 LAEs had star formation rates exceeding 1 yr-1 at some earlier time, implying that they could plausibly have been observed as LAEs at that earlier epoch. Applying the same SFR threshold, 6 of those = 2.4 LAEs could have plausibly been LAEs at = 3.1 and 5 at = 4.5. For the = 3.1 LAE sample, 43% (9) had star formation rates exceeding 1 yr-1 at some earlier time; 5 of those LAEs could have plausibly been LAEs at = 4.5. And for the = 4.5 LAE sample, 41% (9) had star formation rates exceeding 1 yr-1 at some earlier time. Finding similar numbers for specific epochs vs. any earlier epoch matches the visual impression from Figures 2-4 that a subset of each observed LAE sample has SFHs with high SFR over a long time period. Together, these results suggest that “LAE” should be viewed as a classification that is both temporary and of varying duration, and that a galaxy may possibly be an LAE (or have LAE progenitors) at multiple points during its lifetime.
5 Conclusions
The Dense Basis method introduced state-of-the-art advancements to star formation history reconstruction, enabling the flexibility to model smooth star formation histories with several periods of star formation and quenching (Iyer & Gawiser, 2017; Iyer et al., 2019). We applied this approach to LAEs discovered in the COSMOS field by ODIN, a narrow-band survey program designed to discover , and 4.5 Ly emission over extremely wide fields.
In this work, we paired data from the ODIN narrowband LAE survey with rest-UV-through-NIR photometry and photometric redshifts from UVCANDELS to produce samples of LAEs and control samples of LBGs at = 2.4, 3.1, and 4.5. With the Dense Basis methodology and galaxy samples, we reconstructed star formation histories and explored the stellar mass assembly of LAEs in detail. This allowed us to test the conventional understanding that LAEs are young galaxies uniquely experiencing their first significant period of star formation at the time of observation and better understand how LAE stellar mass assembly compares to other star forming galaxies. The main conclusions of this work are summarized below.
-
1.
LAE star formation histories can be characterized by three archetypes: first burst at the time of observation, dominant burst showing the highest SFR at the time of observation but with at least one significant star formation episode in the past, and non-dominant burst describing the case where the highest SFR occurred in the past. While the majority of LAEs at all three redshifts have first burst SFHs, a significant fraction at each redshift has dominant burst SFHs, and non-dominant burst SFHs are quite rare. These results show that a first major burst of star formation is not a prerequisite for a galaxy to be discovered as an LAE. Multiple stellar mass assembly scenarios are consistent with a galaxy exhibiting strong Ly emission at the time of observation.
-
2.
Within LAE and LBG “control” samples with the same median stellar mass, the majority of LAE SFHs exhibit the first burst archetype at all three redshifts, as do the majority of control LBGs at , while the majority of control LBGs at and (and the majority of massive LBGs at all three redshifts) have SFHs exhibiting the dominant burst archetype. This demonstrates that LAE stellar mass assembly differs from other star-forming galaxies.
-
3.
The fraction of stellar mass created by LAEs at the time of observation (last 200 Myr) is on average 1.33 times that of LBGs at comparable redshifts and stellar masses, affirming that LAEs generally have less evolved stellar populations than other star-forming galaxies.
-
4.
By examining the characteristics of LAE stellar mass assembly outlined above, we conclude that the vast majority (95%) of LAEs are best described as experiencing a formative burst of star formation, i.e., a burst that played a major role in the formation of the galaxy being observed.
-
5.
On average 36% of LAEs have star formation rates at some earlier period that are comparable to the minimum time-of-observation star formation rate of our LAE samples. These results suggest that “LAE” should be viewed as a classification that is both temporary and of varying duration, and that a galaxy may be an LAE (or have LAE progenitors) at multiple points during its lifetime.
Overall, our results suggest that the conventional understanding of LAE stellar mass assembly is incomplete and that there are several evolutionary paths that lead to the formation of galaxies with strong observed Ly emission. With this work, we begin to understand what makes LAEs unique probes of the high redshift universe, opening up new avenues to observe LAE stellar mass assembly, progenitor history, and radiative transfer in the post-reionization universe.
6 Acknowledgments
This work utilizes observations at Cerro Tololo Inter-American Observatory, NSF’s NOIRLab (Prop. ID 2020B-0201; PI: KSL), which is managed by the Association of Universities for Research in Astronomy under a cooperative agreement with the NSF.
This material is based upon work supported by the NSF Graduate Research Fellowship Program under Grant No. DGE-2233066 to NF. NF and EG acknowledge support from NSF grant AST-2206222 and NASA Astrophysics Data Analysis Program grant 80NSSC22K0487. NF would like to thank the LSSTDA Data Science Fellowship Program, which is funded by LSST Discovery Alliance, NSF Cybertraining Grant 1829740, the Brinson Foundation, and the Moore Foundation; her participation in the program has benefited this work greatly. EG acknowledges the support of an IBM Einstein fellowship for his sabbatical at IAS during the completion of this manuscript. KSL and VR acknowledge financial support from the NSF under Grant Nos. AST-2206705, AST-2408359, and AST-2206222, and from the Ross-Lynn Purdue Research Foundations. YY is supported by the Basic Science Research Program through the National Research Foundation of Korea funded by the Ministry of Science, ICT & Future Planning (2019R1A2C4069803). RC and CG acknowledge support from NSF grant AST-2408358. The Institute for Gravitation and the Cosmos is supported by the Eberly College of Science and the Office of the Senior Vice President for Research at the Pennsylvania State University. LG thanks support from FONDECYT regular proyecto No. 1230591. JL is supported by the National Research Foundation of Korea (NRF-2021R1C1C2011626). HS acknowledges the support of the National Research Foundation of Korea grant, No. 2022R1A4A3031306, funded by the Korean government (MSIT). XW is supported by the National Natural Science Foundation of China (grant 12373009), the CAS Project for Young Scientists in Basic Research Grant No. YSBR-062, the Fundamental Research Funds for the Central Universities, the Xiaomi Young Talents Program, and the science research grant from the China Manned Space Project.
| Instrument | Filter | (nm) | Width (nm) | Survey/Reference |
| CTIO/DECam | 419.3 | 7.5 | ODIN (Lee et al., 2024) | |
| CTIO/DECam | 501.4 | 7.6 | ODIN (Lee et al., 2024) | |
| CTIO/DECam | 675.0 | 10.0 | ODIN (Lee et al., 2024) | |
| Subaru/Suprime-Cam | 711.98 | 7.2 | Taniguchi et al. (2007, 2015) | |
| Subaru/Suprime-Cam | 815.01 | 11.8 | Taniguchi et al. (2007, 2015) | |
| Subaru/Suprime-Cam | 426.51 | 20.5 | Taniguchi et al. (2007, 2015) | |
| Subaru/Suprime-Cam | 463.59 | 21.75 | Taniguchi et al. (2007, 2015) | |
| Subaru/Suprime-Cam | 485.0 | 22.8 | Taniguchi et al. (2007, 2015) | |
| Subaru/Suprime-Cam | 506.31 | 23.05 | Taniguchi et al. (2007, 2015) | |
| Subaru/Suprime-Cam | 526.11 | 24.2 | Taniguchi et al. (2007, 2015) | |
| Subaru/Suprime-Cam | 576.48 | 27.25 | Taniguchi et al. (2007, 2015) | |
| Subaru/Suprime-Cam | 623.44 | 29.95 | Taniguchi et al. (2007, 2015) | |
| Subaru/Suprime-Cam | 678.1 | 33.55 | Taniguchi et al. (2007, 2015) | |
| Subaru/Suprime-Cam | 707.36 | 31.6 | Taniguchi et al. (2007, 2015) | |
| Subaru/Suprime-Cam | 736.19 | 32.35 | Taniguchi et al. (2007, 2015) | |
| Subaru/Suprime-Cam | 768.53 | 36.4 | Taniguchi et al. (2007, 2015) | |
| Subaru/Suprime-Cam | 824.13 | 34.05 | Taniguchi et al. (2007, 2015) | |
| HST/WFC3 | 270.9 | 40.5 | UVCANDELS (Wang et al., 2024) | |
| CFHT/MegaCam | 378.16 | 72.0 | CFHT-LS (Gwyn, 2012) | |
| HST/ACS | 434.13 | 90.3 | UVCANDELS (Wang et al., 2024) | |
| Subaru/Suprime-Cam | 441.95 | 98.0 | Taniguchi et al. (2007, 2015) | |
| Subaru/Suprime-Cam | 474.21 | 133.5 | Taniguchi et al. (2007, 2015) | |
| CFHT/MegaCam | 492.45 | 146.0 | CFHT-LS (Gwyn, 2012) | |
| Subaru/Suprime-Cam | 545.65 | 97.48 | Taniguchi et al. (2007, 2015) | |
| HST/ACS | 595.79 | 232.2 | UVCANDELS (Wang et al., 2024) | |
| Subaru/Suprime-Cam | 627.06 | 139.99 | Taniguchi et al. (2007, 2015) | |
| CFHT/MegaCam | 631.62 | 116.0 | CFHT-LS (Gwyn, 2012) | |
| Subaru/Suprime-Cam | 795.23 | 136.88 | Taniguchi et al. (2007, 2015) | |
| HST/ACS | 807.34 | 182.0 | UVCANDELS (Wang et al., 2024) | |
| CFHT/MegaCam | 811.84 | 164.0 | CFHT-LS (Gwyn, 2012) | |
| CFHT/MegaCam | 884.68 | 94.0 | CFHT-LS (Gwyn, 2012) | |
| Subaru/Suprime-Cam | 906.84 | 117.0 | Taniguchi et al. (2007, 2015) | |
| VISTA/VIRCAM | 1021.12 | 92.0 | UltraVISTA (McCracken et al., 2012) | |
| Mayall/NEWFIRM | 1046.88 | 149.0 | NMBS (Whitaker et al., 2011) | |
| Mayall/NEWFIRM | 1195.42 | 149.0 | NMBS (Whitaker et al., 2011) | |
| HST/WFC3 | 1251.62 | 300.4 | CANDELS (Grogin et al., 2011; Koekemoer et al., 2011) | |
| VISTA/VIRCAM | 1254.11 | 171.0 | UltraVISTA (McCracken et al., 2012) | |
| Mayall/NEWFIRM | 1278.48 | 140.0 | NMBS (Whitaker et al., 2011) | |
| HST/WFC3 | 1539.23 | 287.4 | CANDELS (Grogin et al., 2011; Koekemoer et al., 2011) | |
| Mayall/NEWFIRM | 1560.87 | 165.0 | NMBS (Whitaker et al., 2011) | |
| VISTA/VIRCAM | 1646.38 | 290.0 | UltraVISTA (McCracken et al., 2012) | |
| Mayall/NEWFIRM | 1707.21 | 174.0 | NMBS (Whitaker et al., 2011) | |
| VISTA/VIRCAM | 2148.76 | 308.0 | UltraVISTA (McCracken et al., 2012) | |
| Mayall/NEWFIRM | 2215.38 | 380.0 | NMBS (Whitaker et al., 2011) | |
| Spitzer/IRAC | 3557.26 | 741.08 | S-COSMOS (Sanders et al., 2007) | |
| Spitzer/IRAC | 4504.93 | 1007.22 | S-COSMOS (Sanders et al., 2007) | |
| Spitzer/IRAC | 5738.59 | 1385.04 | S-COSMOS (Sanders et al., 2007) | |
| Spitzer/IRAC | 7927.38 | 2818.16 | S-COSMOS (Sanders et al., 2007) |
References
- Acquaviva et al. (2012) Acquaviva, V., Vargas, C., Gawiser, E., & Guaita, L. 2012, ApJ Letters, 751, L26, doi: 10.1088/2041-8205/751/2/L26
- Ashby et al. (2013) Ashby, M., Willner, S., Fazio, G., et al. 2013, ApJ, 769, 80, doi: 10.1088/0004-637X/769/1/80
- Berger & Zhou (2014) Berger, V. W., & Zhou, Y. 2014, Wiley statsref: Statistics reference online, doi: 10.1002/9781118445112.stat06558
- Broussard et al. (2019) Broussard, A., Gawiser, E., Iyer, K., et al. 2019, ApJ, 873, 74, doi: 10.3847/1538-4357/ab04ad
- Calzetti et al. (2000) Calzetti, D., Armus, L., Bohlin, R. C., et al. 2000, ApJ, 533, 682, doi: 10.1086/308692
- Carnall et al. (2019) Carnall, A. C., Leja, J., Johnson, B. D., et al. 2019, ApJ, 873, 44, doi: 10.3847/1538-4357/ab04a2
- Ceban (2024) Ceban, D. 2024, PhD thesis, University of Groningen
- Chabrier (2003) Chabrier, G. 2003, PASP, 115, 763, doi: 10.1086/376392
- Conroy & Gunn (2010) Conroy, C., & Gunn, J. E. 2010, ApJ, 712, 833, doi: 10.1088/0004-637X/712/2/833
- Conroy et al. (2009) Conroy, C., Gunn, J. E., & White, M. 2009, ApJ, 699, 486, doi: 10.1088/0004-637X/699/1/486
- Firestone et al. (2024) Firestone, N. M., Gawiser, E., Ramakrishnan, V., et al. 2024, ApJ, 974, 217, doi: 10.3847/1538-4357/ad71c9
- Gawiser et al. (2007) Gawiser, E., Francke, H., Lai, K., et al. 2007, ApJ, 671, 278, doi: 10.1086/522955
- Grogin et al. (2011) Grogin, N. A., Kocevski, D. D., Faber, S., et al. 2011, ApJS, 197, 35, doi: 10.1088/0067-0049/197/2/35
- Guaita et al. (2011) Guaita, L., Acquaviva, V., Padilla, N., et al. 2011, ApJ, 733, 114, doi: 10.1088/0004-637X/733/2/114
- Gwyn (2012) Gwyn, S. D. 2012, ApJ, 143, 38, doi: 10.1088/0004-6256/143/2/38
- Heavens et al. (2000) Heavens, A. F., Jimenez, R., & Lahav, O. 2000, NMRAS, 317, 965, doi: 10.1046/j.1365-8711.2000.03692.x
- Hui & Gnedin (1997) Hui, L., & Gnedin, N. Y. 1997, MNRAS, 292, 27, doi: 10.48550/arXiv.astro-ph/9612232
- Iani et al. (2024) Iani, E., Caputi, K. I., Rinaldi, P., et al. 2024, ApJ, 963, 97, doi: 10.3847/1538-4357/ad15f6
- Im et al. (2024) Im, S. H., Hwang, H. S., Park, J., et al. 2024, ApJ, 972, 196, doi: 10.3847/1538-4357/ad67d2
- Iyer & Gawiser (2017) Iyer, K., & Gawiser, E. 2017, ApJ, 838, 127, doi: 10.3847/1538-4357/aa63f0
- Iyer (2019) Iyer, K. G. 2019, PhD thesis, Rutgers The State University of New Jersey, School of Graduate Studies
- Iyer et al. (2019) Iyer, K. G., Gawiser, E., Faber, S. M., et al. 2019, ApJ, 879, 116, doi: 10.3847/1538-4357/ab2052
- Johnson et al. (2021) Johnson, B. D., Leja, J., Conroy, C., & Speagle, J. S. 2021, ApJS, 254, 22, doi: 10.3847/1538-4365/abef67
- Kikuta et al. (2023) Kikuta, S., Ouchi, M., Shibuya, T., et al. 2023, ApJS, 268, 24, doi: 10.3847/1538-4365/ace4cb
- Koekemoer et al. (2011) Koekemoer, A. M., Faber, S., Ferguson, H. C., et al. 2011, ApJS, 197, 36, doi: 10.1088/0067-0049/197/2/36
- Kunth et al. (1998) Kunth, D., Mas-Hesse, J., Terlevich, E., et al. 1998, A&A, v. 334, p. 11-20 (1998), 334, 11, doi: 10.48550/arXiv.astro-ph/9802253
- Kusakabe et al. (2018) Kusakabe, H., Shimasaku, K., Ouchi, M., et al. 2018, PASJ, 70, 4, doi: 10.1093/pasj/psx148
- Lee et al. (2024) Lee, K.-S., Gawiser, E., Park, C., et al. 2024, ApJ, 962, 36, doi: 10.3847/1538-4357/ad165e
- Leja et al. (2019) Leja, J., Carnall, A. C., Johnson, B. D., Conroy, C., & Speagle, J. S. 2019, ApJ, 876, 3, doi: 10.3847/1538-4357/ab133c
- Leja et al. (2017) Leja, J., Johnson, B. D., Conroy, C., Van Dokkum, P. G., & Byler, N. 2017, ApJ, 837, 170, doi: 10.3847/1538-4357/aa5ffe
- McCracken et al. (2012) McCracken, H., Milvang-Jensen, B., Dunlop, J., et al. 2012, A&A, 544, A156, doi: 10.1051/0004-6361/201219507
- Mehta et al. (2024) Mehta, V., Rafelski, M., Sunnquist, B., et al. 2024, ApJS, 275, 17, doi: 10.3847/1538-4365/ad7d8f
- Ouchi et al. (2020) Ouchi, M., Ono, Y., & Shibuya, T. 2020, Annual Review of A&A, 58, 617, doi: 10.1146/annurev-astro-032620-021859
- Papovich et al. (2001) Papovich, C., Dickinson, M., & Ferguson, H. C. 2001, ApJ, 559, 620, doi: 10.1086/322412
- Partridge & Peebles (1967) Partridge, R. B., & Peebles, P. J. E. 1967, ApJ, 147, 868, doi: 10.1086/149079
- Ramakrishnan et al. (2023) Ramakrishnan, V., Moon, B., Hyeok Im, S., et al. 2023, ApJ, 951, 119, doi: 10.3847/1538-4357/acd341
- Ramakrishnan et al. (2024a) Ramakrishnan, V., Lee, K.-S., Artale, M. C., et al. 2024a, arXiv preprint arXiv:2406.08645, doi: 10.48550/arXiv.2406.08645
- Ramakrishnan et al. (2024b) Ramakrishnan, V., Lee, K.-S., Firestone, N., et al. 2024b, arXiv preprint arXiv:2410.18341, doi: 10.48550/arXiv.2410.18341
- Reichardt et al. (2001) Reichardt, C., Jimenez, R., & Heavens, A. F. 2001, MNRAS, 327, 849, doi: 10.1046/j.1365-8711.2001.04768.x
- Rosani et al. (2020) Rosani, G., Caminha, G., Caputi, K., & Deshmukh, S. 2020, A&A, 633, A159, doi: 10.1051/0004-6361/201935782
- Sanders et al. (2007) Sanders, D. B., Salvato, M., Aussel, H., et al. 2007, ApJS, 172, 86, doi: 10.1086/517885
- Shapley (2011) Shapley, A. E. 2011, ARA&A, 49, 525, doi: 10.1146/annurev-astro-081710-102542
- Simha et al. (2014) Simha, V., Weinberg, D. H., Conroy, C., et al. 2014, arXiv preprint arXiv:1404.0402, doi: 10.48550/arXiv.1404.0402
- Taniguchi et al. (2007) Taniguchi, Y., Scoville, N., Murayama, T., et al. 2007, ApJS, 172, 9, doi: 10.1086/516596
- Taniguchi et al. (2015) Taniguchi, Y., Kajisawa, M., Kobayashi, M. A., et al. 2015, PASJ, 67, 104, doi: 10.1093/pasj/psv106
- Tojeiro et al. (2007) Tojeiro, R., Heavens, A. F., Jimenez, R., & Panter, B. 2007, MNRAS, 381, 1252, doi: 10.1111/j.1365-2966.2007.12323.x
- Vargas et al. (2014) Vargas, C. J., Bish, H., Acquaviva, V., et al. 2014, ApJ, 783, 26, doi: 10.1088/0004-637X/783/1/26
- Wang et al. (2024) Wang, X., Teplitz, H. I., Sun, L., et al. 2024, RNAAS, 8, 26, doi: 10.3847/2515-5172/ad1f6f
- Whitaker et al. (2011) Whitaker, K. E., Labbé, I., van Dokkum, P. G., et al. 2011, ApJ, 735, 86, doi: 10.1088/0004-637X/735/2/86
- White et al. (2024) White, M., Raichoor, A., Dey, A., et al. 2024, JCAP, 2024, 020, doi: 10.1088/1475-7516/2024/08/020