[1,2]\fnmAlessandro \surHill
1]\orgdivDepartment of Electrical, Electronic and Information Engineering “Guglielmo Marconi” (DEI), \orgnameUniversity of Bologna, \orgaddress\streetViale del Risorgimento, 2, \cityBologna, \postcode40136, \countryItaly
2]\orgdivDepartment of Industrial and Manufacturing Engineering, \orgnameCalifornia Polytechnic State University, \orgaddress\street1 Grand Ave, \citySan Luis Obispo, \postcode93407, \stateCA, \countryUSA
Recommending the right academic programs: An interest mining approach using BERTopic
Abstract
Prospective students face the challenging task of selecting a university program that will shape their academic and professional careers. For decision-makers and support services, it is often time-consuming and extremely difficult to match personal interests with suitable programs due to the vast and complex catalogue information available. This paper presents the first information system that provides students with efficient recommendations based on both program content and personal preferences. BERTopic, a powerful topic modeling algorithm, is used that leverages text embedding techniques to generate topic representations. It enables us to mine interest topics from all course descriptions, representing the full body of knowledge taught at the institution. Underpinned by the student’s individual choice of topics, a shortlist of the most relevant programs is computed through statistical backtracking in the knowledge map, a novel characterization of the program-course relationship. This approach can be applied to a wide range of educational settings, including professional and vocational training. A case study at a post-secondary school with 80 programs and over 5,000 courses shows that the system provides immediate and effective decision support. The presented interest topics are meaningful, leading to positive effects such as serendipity, personalization, and fairness, as revealed by a qualitative study involving 65 students. Over 98% of users indicated that the recommendations aligned with their interests, and about 94% stated they would use the tool in the future. Quantitative analysis shows the system can be configured to ensure fairness, achieving 98% program coverage while maintaining a personalization score of 0.77. These findings suggest that universities could expand student support services by implementing this real-time, user-centered, data-driven system to improve the program selection process.
keywords:
Higher education, recommender system, university program selection, machine learning, topic modeling1 Introduction
Every prospective college student faces the strategic decision of which program to enroll in. Selecting the right major is crucial, as it serves as a key building block for a successful career, fruitful personal development, and a positive college experience. However, the vast and complex academic program data often makes it very challenging for students to choose the option that best aligns with their interests and expectations. In 2022, 18.6 million students were enrolled in college programs in the USA [1], selecting from over 1,800 majors [2] and 44,000 accredited programs at around 6,000 colleges [3]. The significant financial investment is evident when considering that 2.5% of the GDP was spent on higher education in 2020 [4]. The U.S. ranks second among the Organization for Economic Cooperation and Development (OECD) countries in per-student spending on postsecondary education, investing nearly twice the OECD average [5].
In 2024, a survey by Welding [6] revealed that 54% of college students experienced doubts about their choice of major at least occasionally, even though only 11% of incoming students are undecided about their career plans [7]. However, more than 50% of students change their major at least once. For instance, [8] found that around 35% of students leaving the computer science (CS) program at the Georgia Institute of Technology (USA) stated that the “CS program is too narrow and could not accommodate my interests outside of CS.” A recent study shows that an impressive 44% of job-seeking graduates regret their major choice [9].
Currently, prospective students rely on a variety of resources, including academic advising, university program catalogs, private consulting services, and personal references. We believe that student support could be significantly enhanced by complementing the solutions currently in use. Students often struggle to find the right academic path, primarily due to the challenge of aligning their interests with available programs, which is crucial for academic success [10]. The sheer number of academic programs and courses can be overwhelming. Furthermore, interdisciplinary content, dynamic program structures, and vague high-level program information—such as learning objectives—can be confusing, as they must align with the learning outcomes of all courses within the program [11]. We believe these factors largely contribute to the difficulties many students face in identifying a suitable academic program, despite the resources available to them.
At the same time, educational institutions have a strong interest in enrolling students in well-matched programs. Reducing the number of internal transfers—students who change programs before graduation—can significantly decrease administrative efforts. Additionally, increasing the number of students satisfied with their chosen field of study is likely to have a positive effect on dropout rates and overall student satisfaction, both of which are important metrics for an institution’s reputation. Furthermore, efficient support may reduce the workload for university advising personnel.
In this work, we present a practice-oriented approach to help prospective and transfer students efficiently match their personal interests with available study programs. Our system is based on the central idea of mining large course description data, which represents the body of knowledge for all programs. Using topic modeling, an unsupervised machine learning technique, we search for manageable sets of related keywords, referred to as topics, which can be interpreted as areas of interest. Throughout this work, we use the term interest topics to denote these areas. A comprehensive set of interest topics is presented to students, allowing them to explore and select topics that match their interests. After receiving a student’s multi-interest topic input, program relevance scores are calculated using a backtracking method. A final program ranking is then established, listing the most relevant majors for consideration in the ranking.
As we demonstrate in our case study, this approach is capable of both identifying unexpected programs and confirming students’ considered fields of study. The decision support provided is instantaneous (automated and efficient), dynamic (utilizing up-to-date program and course data), and comprehensive (matching all available programs). Additionally, the system relies on publicly available program data and Python procedures that incorporate open-source packages. While our case study assumes the selection of a single university, the approach is adaptable to a wide range of educational institutions and can be extended to cover multiple schools simultaneously, both nationally and internationally. We are confident that this new recommendation system can become an important component of future student support.
Moreover, program directors, curriculum committees, and administrative personnel can benefit from this tool in managing programs, leading to increased attractiveness and efficiency. A careful analysis of relevant interest topics and corresponding system recommendations could lead to improved course descriptions, reduced overlap with other programs, enhanced interdisciplinary collaboration, and greater structural synergies.
In contrast to the recommender systems suggested in the literature, our recommendations are not based on student characteristics such as entrance exam scores or high school performance. Our method has the advantage of being entirely based on open-source data and does not require access to confidential student information. Furthermore, to the best of our knowledge, no automated method that utilizes course description data or other low-level program content has been proposed thus far.
As highlighted by Tang [12], there is a growing need for research on diversity, equity, and inclusion. Our system promotes equity by helping individuals who may lack access to conventional support systems—such as lower-income families, first-generation students, and marginalized communities—make informed decisions about their education.
Our work supports both prospective students and universities through the following key contributions:
-
•
A novel and broadly applicable machine learning-based decision support system for study program recommendations.
-
•
Practical design and implementation guidelines derived from real-world experience at a large university.
-
•
Comprehensive qualitative and quantitative evaluation of the information system, based on real recommendations, student surveys, and computational analysis.
-
•
Opportunities to expand existing student support services through a real-time, accessible, user-centered, data-driven system, enhancing the overall program selection process.
The paper is structured as follows. After this introductory section, we review the related literature in Section 2. The proposed information system is described in detail in Section 3, followed by the case study including the system evaluation in Section 4. We conclude by summarizing our findings and providing an outlook on future research in Section 5. Supplementary material is provided in the Appendix.
2 Related Work
In this section, we review methods employed by past studies to assist students in making informed decisions when selecting the most suitable major at a university. Table 1 presents an overview of the methodologies used to develop corresponding Decision Support Systems (DSS). The methods encompass a range of techniques, including Multiple Criteria Decision Making (MCDM) models, fuzzy systems, Rule-based Method of Knowledge Representation (RBMKR), supervised Machine Learning (ML) algorithms, and unsupervised clustering techniques.
Multiple studies have developed DSS for major selection using MCDM methods where the goal is to identify the best alternative based on multiple decision criteria. Permanasari et al. [13] introduced the Hybrid MCDM model tailored for senior high school students in Indonesia, covering majors such as mathematics, natural sciences, social science, and language. This model integrates several MCDM methods, including Simple Additive Weighting (SAW), Technique for Order of Preference by Similarity to Ideal Solution (TOPSIS), and Gray Relational Analysis (GRA), leveraging their respective strengths. The dataset utilized includes information such as test scores, academic reports, and student majors. Khasanah et al. [14] developed a DSS using the Fuzzy SAW method to aid high school students in major selection, considering uncertainties in decision-making. Criteria in this model are derived from academic performance, psychological test results, and students’ interest questionnaire. Furthermore, Conejero et al. [15] applied the TOPSIS method to assess the performance of vocational and educational training programs, emphasizing their impact on employability. The study involved a dataset of 28,000 student records, encompassing both educational and labor-related information.
Prior research has employed multiple reasoning models for major selection, including the rule-based method [16] and the Theory of Reasoned Action (TRA) [17]. The former developed a rule-based expert system with an object-oriented database, representing majors as objects with attributes and skill values. Major selection rules are based on essential admission requirements and individual preferences, considering factors like high school scores, graduation year, and grades. On the other hand, Kumar and Kumar [17] utilized the TRA framework to model students’ decision-making for business majors, considering attitudes towards job opportunities, social image, personal aptitude, and subjective norms from family, friends, teachers, and counselors. Gender differences and the decided/undecided status of students were also noted as influencing factors in major selection decisions.
Previous studies have explored the application of supervised and unsupervised ML techniques in developing recommender systems for major selection. Zayed et al. [18] applied supervised ML algorithms, including decision trees, support vector machines, and random forests, to predict optimal majors for individual students. The models were trained on a comprehensive dataset encompassing academic performance, grades, labor market data, salary insights, student experiences, and gender. The random forest model proved most effective, achieving a 97.7% accuracy. Stein et al. [19] developed a recommender system using a supervised nearest-neighbor approach for major selection. Utilizing nine years of historical student data, the system based recommendations on students’ first two years of courses and performance, evaluating how a student’s performance in a major compares to the average for that major.
An unsupervised ML method has been applied by Alghamdi et al. [20] and Obeid et al. [21] to provide recommendations. Alghamdi et al. [20] devised a fuzzy-based recommendation system considering academic performance and student preferences. They employed a similarity-based clustering technique to group majors based on content or field similarity. Meanwhile, Obeid et al. [21] proposed an ontology-based recommender system focusing on students’ skills, interests, and preferences rather than grades. Clusters, formed from graduate student profiles, are utilized to recommend majors based on the similarity of student profiles to the generated clusters.
Reference Method MCDM RBMKR ML Supervised Unsupervised Permanasari et al. [13] ✓ Khasanah et al. [14] ✓ Conejero et al. [15] ✓ Ayman Al Ahmar [16] ✓ Kumar and Kumar [17] ✓ Zayed et al. [18] ✓ Stein et al. [19] ✓ Alghamdi et al. [20] ✓ Obeid et al. [21] ✓ This Work ✓
Related to program selection, researchers have also developed systems to guide students in selecting the most appropriate courses for given university programs. Al-Badarenah and Alsakran [22] created a collaborative recommender system for elective courses, utilizing the -means clustering algorithm to group students based on course grade similarity. The -nearest neighborhood approach was then applied to match students with the most fitting group, and personalized recommendations were generated using association rule mining. Elbadrawy and Karypis [23] took a comprehensive approach, considering factors such as student majors, academic levels, degree requirements, and enrollment patterns. They integrated these features into methods such as matrix factorization, user-based collaborative filtering, and popularity-based ranking, resulting in more accurate predictions compared to existing models.
Jing and Tang [24] introduced a recommender system for Massive Open Online Courses (MOOCs) based on user interest, demographic profiles, and course prerequisites, demonstrating superior performance on XuetangX, a major Chinese MOOC platform. Bakhshinategh et al. [25] focused on Graduating Attributes (GAs) in a time-aware course recommendation system, integrating student evaluations to assess courses’ impact on personal capabilities and GAs. In a unique approach, Pardos and Jiang [26] introduced a serendipity-focused recommender system aiming to provide students with unexpected yet relevant course recommendations. They evaluated three models, including course2vec and bag-of-words. Additionally, Hatzakis et al. [11] utilized a program management framework to enhance curriculum coherence in a Master’s-level Information Systems Management course, yielding positive outcomes in both vertical and horizontal coherence according to student surveys.
In this paper, we leverage topic modeling, a statistical unsupervised ML technique, to develop an information system that provides decision support for program selection. Topic modeling helps identify abstract “topics” within a collection of documents by analyzing a corpus of text data. It is known to be an essential tool for building effective information systems that involve text analysis [27]. These topics are assessed based on various metrics such as quality, interpretability, stability, diversity, efficiency, and flexibility [28]. Various topic modeling approaches are discussed in works such as Sharma et al. [29] and Qiang et al. [30], which include earlier contributions from Papadimitriou et al. [31] and Hofmann [32]. These approaches can be broadly categorized into two types: probability-based and embedding-based. Probability-based models use statistical methods to group words together, and some commonly used algorithms are Latent Dirichlet Allocation (LDA) [33] and Non-negative Matrix Factorization (NMF) [34]. However, traditional probability-based methods have drawbacks, such as the need to pre-define the number of clusters and the inability to capture semantic context between words.
To address these challenges, embedding-based methods were introduced, which encode text data to place semantically similar words, sentences, or documents near a cluster’s centroid. These techniques often utilize pre-trained embedding models to represent each document as a vector within an embedding space. Notable algorithms in this category include Top2Vec [35], BERTopic [36], and Cross-lingual Contextualized Topic Models (CTM) [37]. Recent advancements involve leveraging deep learning and pre-trained language models, such as BERT [38], to create Neural Topic Models (NTMs) that offer improved flexibility, effectiveness, and efficiency [39]. Additionally, hybrid approaches have emerged, combining both probabilistic and embedding techniques, like the LDA-BERT model by Basmatkar and Maurya [40].
Topic modeling offers valuable insights through various visualization techniques, enabling humans to understand and analyze extensive collections of documents [41]. This approach has proven successful in diverse fields, such as bioinformatics [42], marketing [43], material sciences [44], social media [45], transportation [46], and tourism [47]. Moreover, topic modeling serves as a valuable tool within the realm of text mining, where vast amounts of data are extracted and processed, with the aim of uncovering valuable and previously unknown information from web data [48]. It can be regarded as a technique for knowledge distillation within text mining, particularly in content mining, which concentrates on generating meaningful clusters of words and documents from unstructured text data [49]. Föll and Thiesse [50] applied topic modeling to analyze and compare Information Systems (IS) curricula from German universities. Using text mining, the authors efficiently examined over 90 programs and 3,700 modules, identifying key topics such as business intelligence, project management, and programming. This study offers valuable insights for academic institutions, employers, and students, highlighting how curricula align with industry needs while providing a scalable alternative to manual content analysis.
Prior studies have utilized a variety of methodologies to aid students in program or major selection at universities. However, our approach clearly differs from previous work. We focus on interest matching, and leverage unused potential to generate interest topics via data mining. Our system revolves around mining extensive course description datasets. Employing machine learning, we generate manageable sets of interest topics presented to prospective and current students. Upon receiving a student’s multi-interest input, program relevance scores are computed using a backtracking method. The final program ranking is then established, listing the top relevant majors for consideration. As demonstrated in our case study, our approach excels in both uncovering unexpected programs and confirming fields already under consideration. In contrast to prevalent recommender systems in the literature, our recommendations do not rely on student features like entrance exam scores or high school performance. Furthermore, to the best of our knowledge, no automated method utilizing course description data has been proposed thus far.
Our system is one of the few that uses unsupervised ML to develop a recommender system for program selection, as shown in Table 1. Unsupervised ML offers several advantages for recommender systems, particularly the elimination of the need for labeled data. This feature makes unsupervised methods more scalable and cost-effective compared to supervised approaches. In contrast to MCDM, which relies on predefined criteria and weights that can introduce bias, unsupervised methods focus solely on patterns observed in the data. This approach enables more adaptive and personalized recommendations, making it especially suitable for scenarios with limited user feedback and diverse or changing preferences.
3 The Recommender System
In this section, we describe the developed decision support system, called Top Program Recommender (TopProRec). It leverages machine learning, specifically topic modeling—a form of text mining—to extract meaningful information from extensive program data. We provide a detailed description of the modular system, covering the recommendation process, data framework, applied methods, and system interfaces.
3.1 Overview and Recommendation Process
Our data-driven approach enables students to quickly receive a curated list of programs that align with their interests. The primary users are prospective students seeking to identify the best program for enrollment. To assist with this, we present a system that suggests a manageable number of finalist programs for further consideration. This system, referred to as TopProRec, operates as a Recommender System (RS), defined by Ricci et al. [51] as “a software tool that provides suggestions for items most likely of interest to a particular user.” In our context, the “overwhelming number of items” that users must navigate consists of university programs. TopProRec functions as a session-based RS, designed for first-time users without prior user-related data. It generates personalized recommendations based on a single interaction, capturing the user’s interests in real-time. The overall process is illustrated in Figure 1.
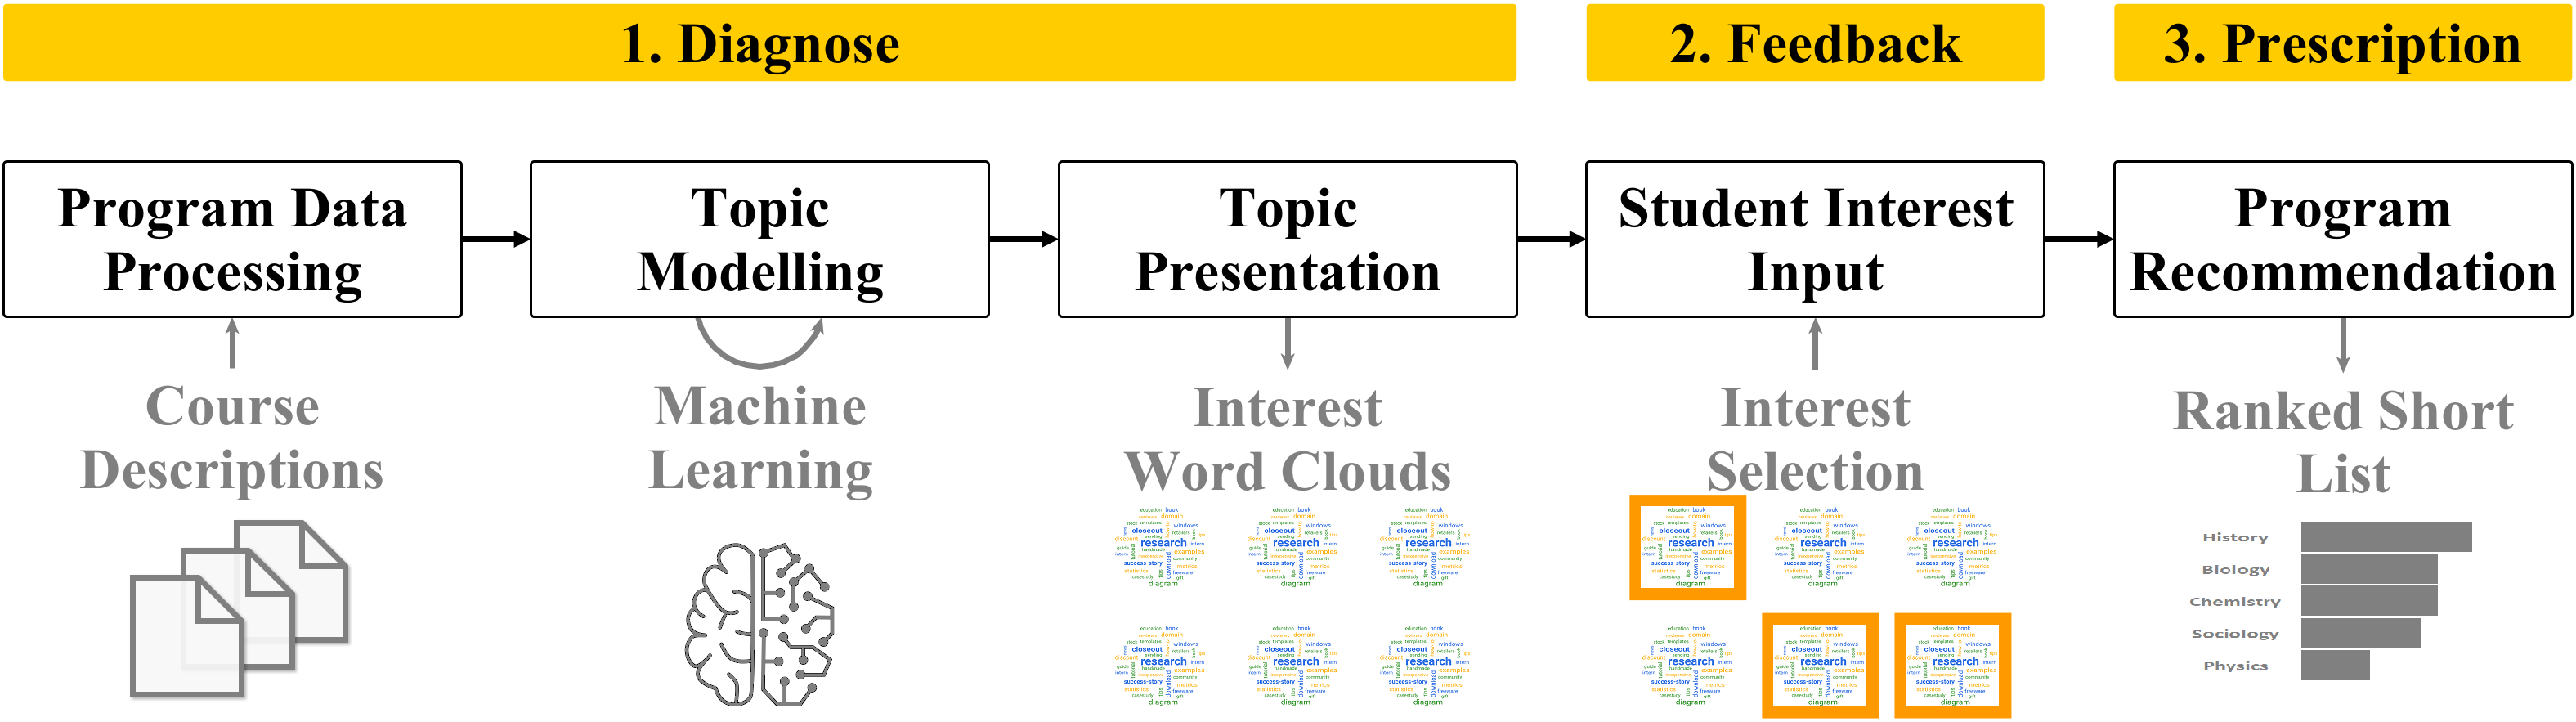
The process consists of three main phases: (1) diagnostic analysis of program data, (2) an interactive user feedback step, and (3) the final recommendation of programs. This approach uses both detailed course data and student interests to generate a ranked shortlist of programs. Its prescriptive nature lies in its ability to suggest options for further, in-depth exploration. The core concept used is an ‘interest topic,’ which represents a set of keywords. These keywords, which may appear once or multiple times in course descriptions, are selected by instructors to describe course content. Users can relate these keywords to areas such as study subjects, activities, societal themes, and personal experiences.
In the following sections, we provide a detailed description of the sub-processes. The symbols used are explained in Table 2.
| Symbol | Explanation | |
|---|---|---|
| Program Data | Index set for all study programs. | |
| Index set for all courses. | ||
| Set for all course descriptions consisting of all words; . | ||
| Set for all cleaned course descriptions consisting of keywords only; . | ||
| Directed knowledge network (map) with node set and edge set . | ||
| Course-program relation . | ||
| Number of programs . | ||
| Number of courses . | ||
| Topic Modeling | Index set for computed interest topics. | |
| Number of computed interest topics. | ||
| Number of keywords in an interest topic. | ||
| Recommendation | Index set for recommended programs (). | |
| Maximal number of interest topics chosen by a user. | ||
| Number of recommended programs . | ||
| Program interest score for program . | ||
| Relative program interest score for program . | ||
| Final program interest score for program used for recommendation ranking. | ||
| Evaluation | Program reachability (coverage). | |
| Survey | Binary program recommendation matrix. | |
| Binary college recommendation matrix. | ||
| Average similarity of recommended items. |
3.2 Program Data Processing
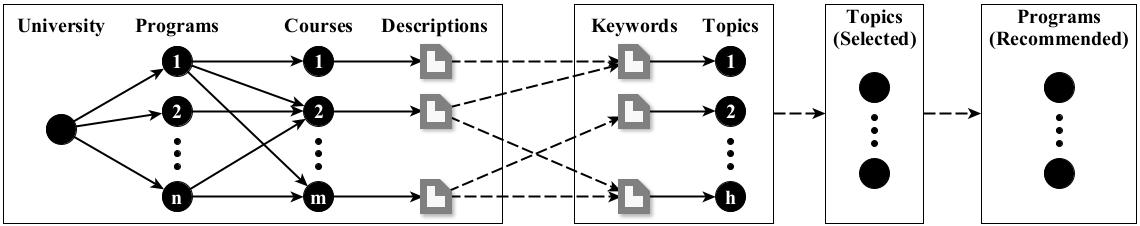
The diagnostic phase begins with the automated extraction of program data which is typically publicly available on the institutional homepage (academic programs, course catalog). This data consists of the list of programs, the list of university courses, and the corresponding course descriptions. Let denote the index set for programs, the index set for courses, and the index set for course descriptions, respectively. We illustrate the structure of data elements in Figure 2. A many-to-many relationship connects courses to programs if they are listed as mandatory (core courses) or optional (elective courses). The bi-modal network representing this relationship consists of nodes in and and directed edges in . In Section 4 (Figure 5), we demonstrate the complexity and scale of the course-to-program relationship using real data. Each course is associated with a single course description which is text, commonly restricted to a limited number of words. Note that course names and descriptions are not necessarily unique. Course descriptions serve as input for our topic modeling process, resulting in a set of keywords for each topic, which may not be entirely unique. The data representation shown in Figure 2 is important to manage data efficiently but, more importantly, to be able to backtrack from topic keywords to programs, as we will describe later.
Note that our approach can also be extended to multiple universities, providing recommendations based on an even larger number of potential programs. Conversely, it is also possible to restrict the system to work with only a subset of the institution’s programs.
3.3 Topic Modeling Method
Topic modeling is a powerful statistical technique designed to uncover the latent topics or themes present in a collection of documents [52]. Within the realm of topic modeling, a “word” serves as the fundamental unit of data. A “document” is a sequence of words, and a “corpus” is a comprehensive collection containing such documents, often representing the entire dataset. In this context, each word represents a course description, a document serves as a collection of course descriptions related to a program, and the corpus encompasses the exhaustive array of programs available for selection. The “vocabulary” is the set containing all unique words present in the corpus, while a “topic” is represented as a probability distribution that spans this vocabulary. A document can be denoted as , where represents the th word in the sequence and is the total number of words within that document. Consequently, a corpus is represented by or more succinctly as , with each equivalent to signifying the th document in the corpus, and denoting the total number of documents within the corpus. Topics are represented by various probabilistic or stochastic distributions, depending on the specific method employed. In its simplest form, and when not considering hierarchies or sequential relationships, topics can be represented as , where represents the th topic, and defines the number of topics that span the entire corpus. The per-topic word distribution is denoted as , representing the likelihood of words given a specific topic . Similarly, the per-document topic distribution is denoted as , representing the likelihood of topics in a given document . The primary goal of topic modeling is to infer the latent variables: the per-document topic distributions and the per-topic word distributions . Once the model is trained and the latent variables are estimated, each document can be represented as a mixture of topics, and each topic is represented as a distribution over words. This representation provides valuable insights into the main themes present in the corpus and allows for better understanding and organization of the document collection.
The topic modeling process involves several key steps and elements. It begins with a collection of documents (corpus) comprising text data, such as articles, blog posts, or research papers. Next, the text preprocessing step standardizes the raw text by removing punctuation, converting to lowercase, eliminating stop words, and applying stemming or lemmatization. The feature extraction stage converts the preprocessed text into numerical representations, specifically word frequencies in each document. This transformation enables the data to be utilized by topic modeling algorithms. The core of the process is topic modeling, wherein a topic modeling algorithm (e.g., Latent Dirichlet Allocation (LDA) or Non-negative Matrix Factorization (NMF)) uncovers latent topics present in the collection of documents. These topics are hidden themes or patterns within the data. The output of the topic modeling algorithm provides latent topic distributions for each document in the corpus. Each document is represented as a mixture of topics, where the proportion of each topic indicates its relevance within that document. Additionally, the topic modeling algorithm generates topic-word distributions, which indicate the likelihood of each word occurring within each topic. This information helps to understand the main themes represented by each topic. In this study, we leverage topic-word distributions, also called interest topics in our study, to effectively capture and analyze student interests.
In this paper, we utilize BERTopic [36], a powerful topic modeling algorithm that leverages text embedding techniques to generate topic representations. Text embedding techniques encode textual data in a manner that places semantically similar words, sentences, or documents in proximity to a cluster’s centroid. For this purpose, BERTopic employs pre-trained language models like all-MiniLM-L6-v2 for English and paraphrase-multilingual-MiniLM-L12-v2, which is applicable to 50 different languages. To improve the clustering algorithm’s performance in terms of accuracy and time, a dimensionality reduction technique is incorporated after obtaining the text embeddings. This step reduces the dimensionality of the embeddings, and popular methods such as Principal Component Analysis (PCA), t-distributed Stochastic Neighbor Embedding (t-SNE), or Uniform Manifold Approximation and Projection (UMAP) can be employed for this purpose. Subsequently, the Hierarchical Density-based Spatial Clustering of Applications with Noise (HDBSCAN) algorithm is applied to create clusters from the reduced embeddings. HDBSCAN employs a soft-clustering approach, which allows noise to be modeled as outliers, leading to more robust and accurate clustering results. BERTopic further enhances the topic modeling process by implementing the Class-based Term Frequency-inverse Document Frequency (c-TF-IDF) algorithm [45]. This algorithm quantifies the importance of words within each cluster and generates topic-word representations. A higher c-TF-IDF value indicates that a word is more representative of its corresponding topic. BERTopic has demonstrated remarkable success across diverse domains, making it a versatile and effective topic modeling algorithm. Its applications have spanned numerous fields, including tourism [53], social media [45], healthcare [54], and banking [55].
Figure 3 illustrates BERTopic as a sequential process for generating its topic representations. Within each step, various options are available, enabling users to construct a personalized topic modeling pipeline. BERTopic employs the following default models for each step: (a) embeddings: sentence-transformers, (b) dimensionality reduction: UMAP, (c) clustering: HDBSCAN, (d) tokenizer: CountVectorizer, and (e) weighting scheme: c-TF-IDF. Notably, the inclusion of the c-TF-IDF method allows for rapid generation of accurate topic representations. Nonetheless, given the rapidly evolving landscape of Natural Language Processing (NLP), novel methodologies frequently emerge. To stay current with these advancements, the BERTopic framework facilitates the refinement of c-TF-IDF topics by integrating techniques such as GPT, T5, KeyBERT, Spacy, and others.
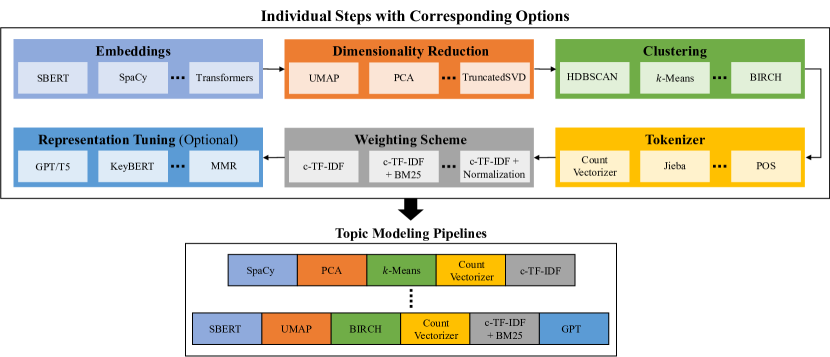
BERTopic provides more benefits and strengths in comparison to other topic modeling methods by leveraging contextual embeddings from transformers such as BERT [56], enabling a deeper understanding of word meanings in context rather than relying solely on word frequency. By combining UMAP for dimensionality reduction and HDBSCAN for flexible clustering, it can effectively handling complex and noisy data structures. The use of c-TF-IDF improves topic interpretability by identifying representative terms for each cluster [36]. Moreover, its seamless integration with Python libraries such as Hugging Face Transformers [57] enhances usability and allows for easy incorporation into existing workflows.
3.4 Topic Presentation and Interest Feedback
Once interest topics are computed by the topic modeling pipeline discussed above, we present the topics in order to capture student interests. The computed interest topics are denoted by . In a pre-processing step, technical content such as class type (e.g., lecture, laboratory), class mode (e.g., virtual, face-to-face), and prerequisite courses are removed. To identify the most relevant keywords for each topic, BERTopic assigns importance scores to individual terms within the topic cluster. Terms that appear frequently within the topic are considered more significant and are more likely to be chosen as keywords. For visual representation, we utilize word clouds (Figure 1) to illustrate each keyword cluster. These word clouds are limited to include only the top keywords (or terms) based on their importance scores. Words vary in size and color according to their relevance to the respective interest topic as determined by the topic modeling approach. They are placed both horizontally and vertically in a space-optimized layout. Word clouds are presented to the user in a matrix fashion in an arbitrary order. Students are asked to select a subset of up to interest topics after their evaluation with respect to personal interests.
3.5 Program Recommendation
Building upon the relationships illustrated in our data scheme (see Figure 2), we developed a network backtracking technique. This method calculates a statistical score for each program based on the selected interest topics (keyword clouds). Specifically, we compute the following two metrics for each program:
-
•
Program Interest Score (PIS): We count the number of times that keywords in selected topics appear in one of the courses that can be taken within the program.
-
•
Relative Program Interest Score (R-PIS): This relative metric compares PIS to the total number of courses in the program to eliminate the advantage of large programs.
-
•
Final score (SCORE): This normalized metric scales the R-PIS to the interval [0,100] and is finally presented to the user together with the recommendation.
We present the top programs () as a ranked list to the student, highlighting programs worth considering in greater detail. For the final decision-making process, students are encouraged to consult resources specific to each program, course, and department.
The complete backtracking method including the metric calculation is described in Algorithm 1. First, the three interest scores (PIS, R-PIS, SCORE) are initialized in lines 1-4. We assume that the user selected at least one interest topic; i.e., . In the actual backtracking, we iterate over the user-selected interest topics (line 5) and the corresponding keywords (line 6). For every course, we check if the considered keyword is contained in the cleaned course description (lines 7-8). If this is the case then we increment the PIS for each program that the course is associated with (lines 9-10). Note that this can be done by using the arcs in the course-program network (see Section 3.2). Using the programs’ PIS values, we calculate the R-PIS next (lines 11-12). Then, at most top programs () are identified by sorting the programs in descending order with respect to PIS (lines 13-16). We do not recommend programs that have no interest overlap; i.e., if the R-PIS value equals to zero. The SCORE values are calculated for the recommended programs (lines 17-18) before the procedure returns them together with all metric values (line 19).
4 Case Study
We conducted a comprehensive case study in which we developed a fully functional prototype of the TopProRec system. The system was based on real-world data for the academic year 2021/22 from a large polytechnic university in the USA. The following sections provide a detailed overview of the development process and system architecture, followed by a rigorous experimental evaluation with 65 users, approved by the university’s Institutional Review Board (IRB).
4.1 Data Collection
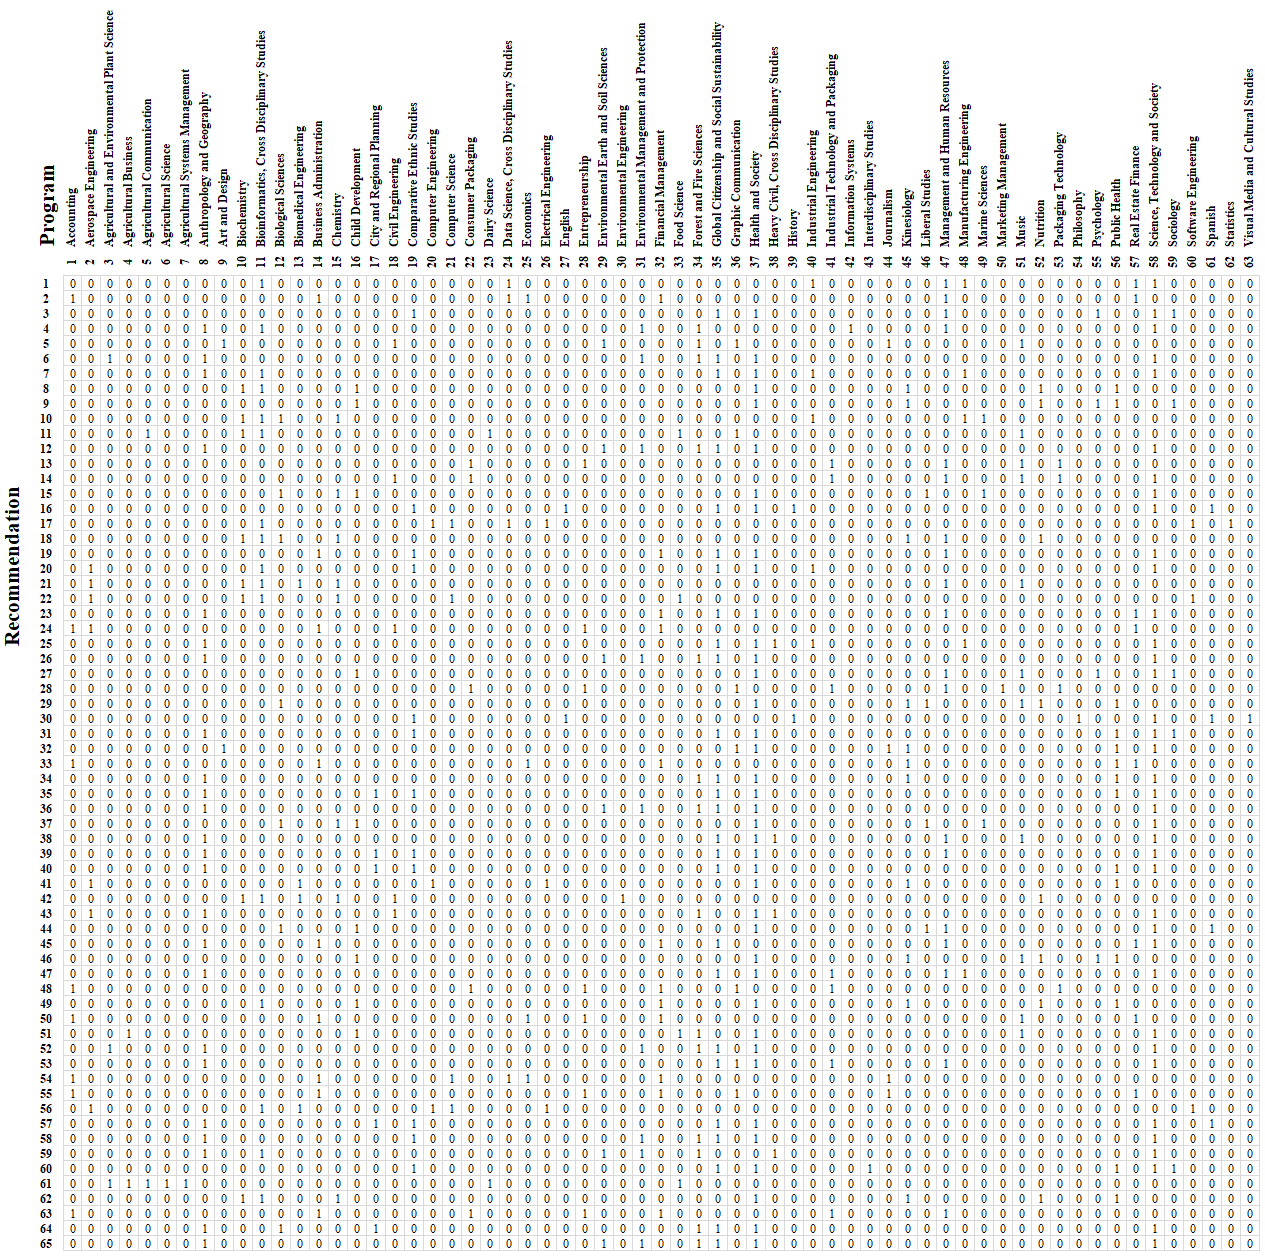
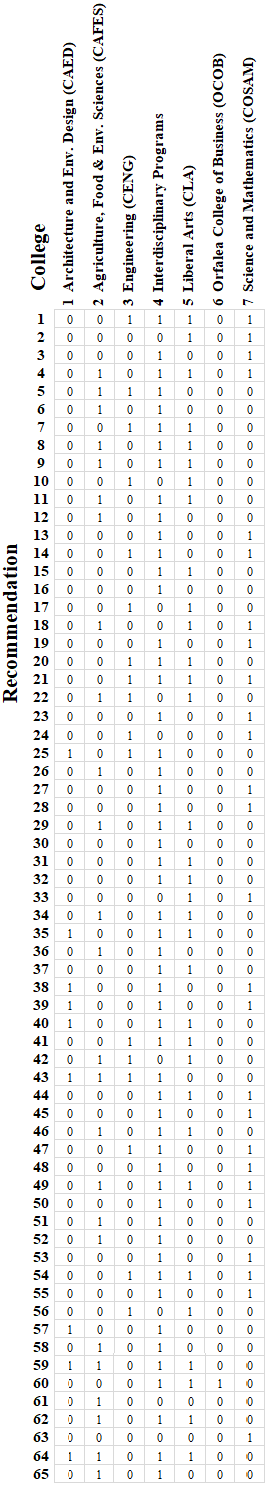
We utilized data from 84 programs111catalog.calpoly.edu/programsaz across six colleges, encompassing all majors, interdisciplinary minors, and concentrations within the business school. The course data222catalog.calpoly.edu/coursesaz included 4,251 course descriptions, each containing an average of 42.3 words, with a maximum allowed length of 50 words per description. In total, we extracted 19,283 keywords, averaging 16.8 characters in length and composed of approximately 2.0 individual words per keyword. The number of courses per program ranged from 11 to 224, with an average of 75.1 courses per program. Courses were associated with at least one program and up to 22 programs—as in the case of Calculus IV—averaging 2.1 programs per course. The university has a total enrollment of about 21,000 students, with approximately 6,000 students enrolled in the largest college, namely Engineering.
The number of courses offered by each college is provided in Table 3. Note that Interdisciplinary Programs only contains one program: Liberal Arts and Engineering Studies.
| College | # | College | # | |||
|---|---|---|---|---|---|---|
| 1 | Agriculture, Food & Environ. Sciences | 1768 | 5 | Architecture & Environ. Design | 328 | |
| 2 | Engineering | 1446 | 6 | College of Business | 286 | |
| 3 | Liberal Arts | 1302 | 7 | Interdisciplinary Programs | 82 | |
| 4 | Science & Mathematics | 1098 |
The number of courses that can be taken in a program varied significantly, ranging from 224 (Environmental Management and Protection) to 11 (Accounting). Figure 4 shows the top 10 and bottom 10 programs based on the number of eligible courses they offer. On average, there were 92.9 courses per program.

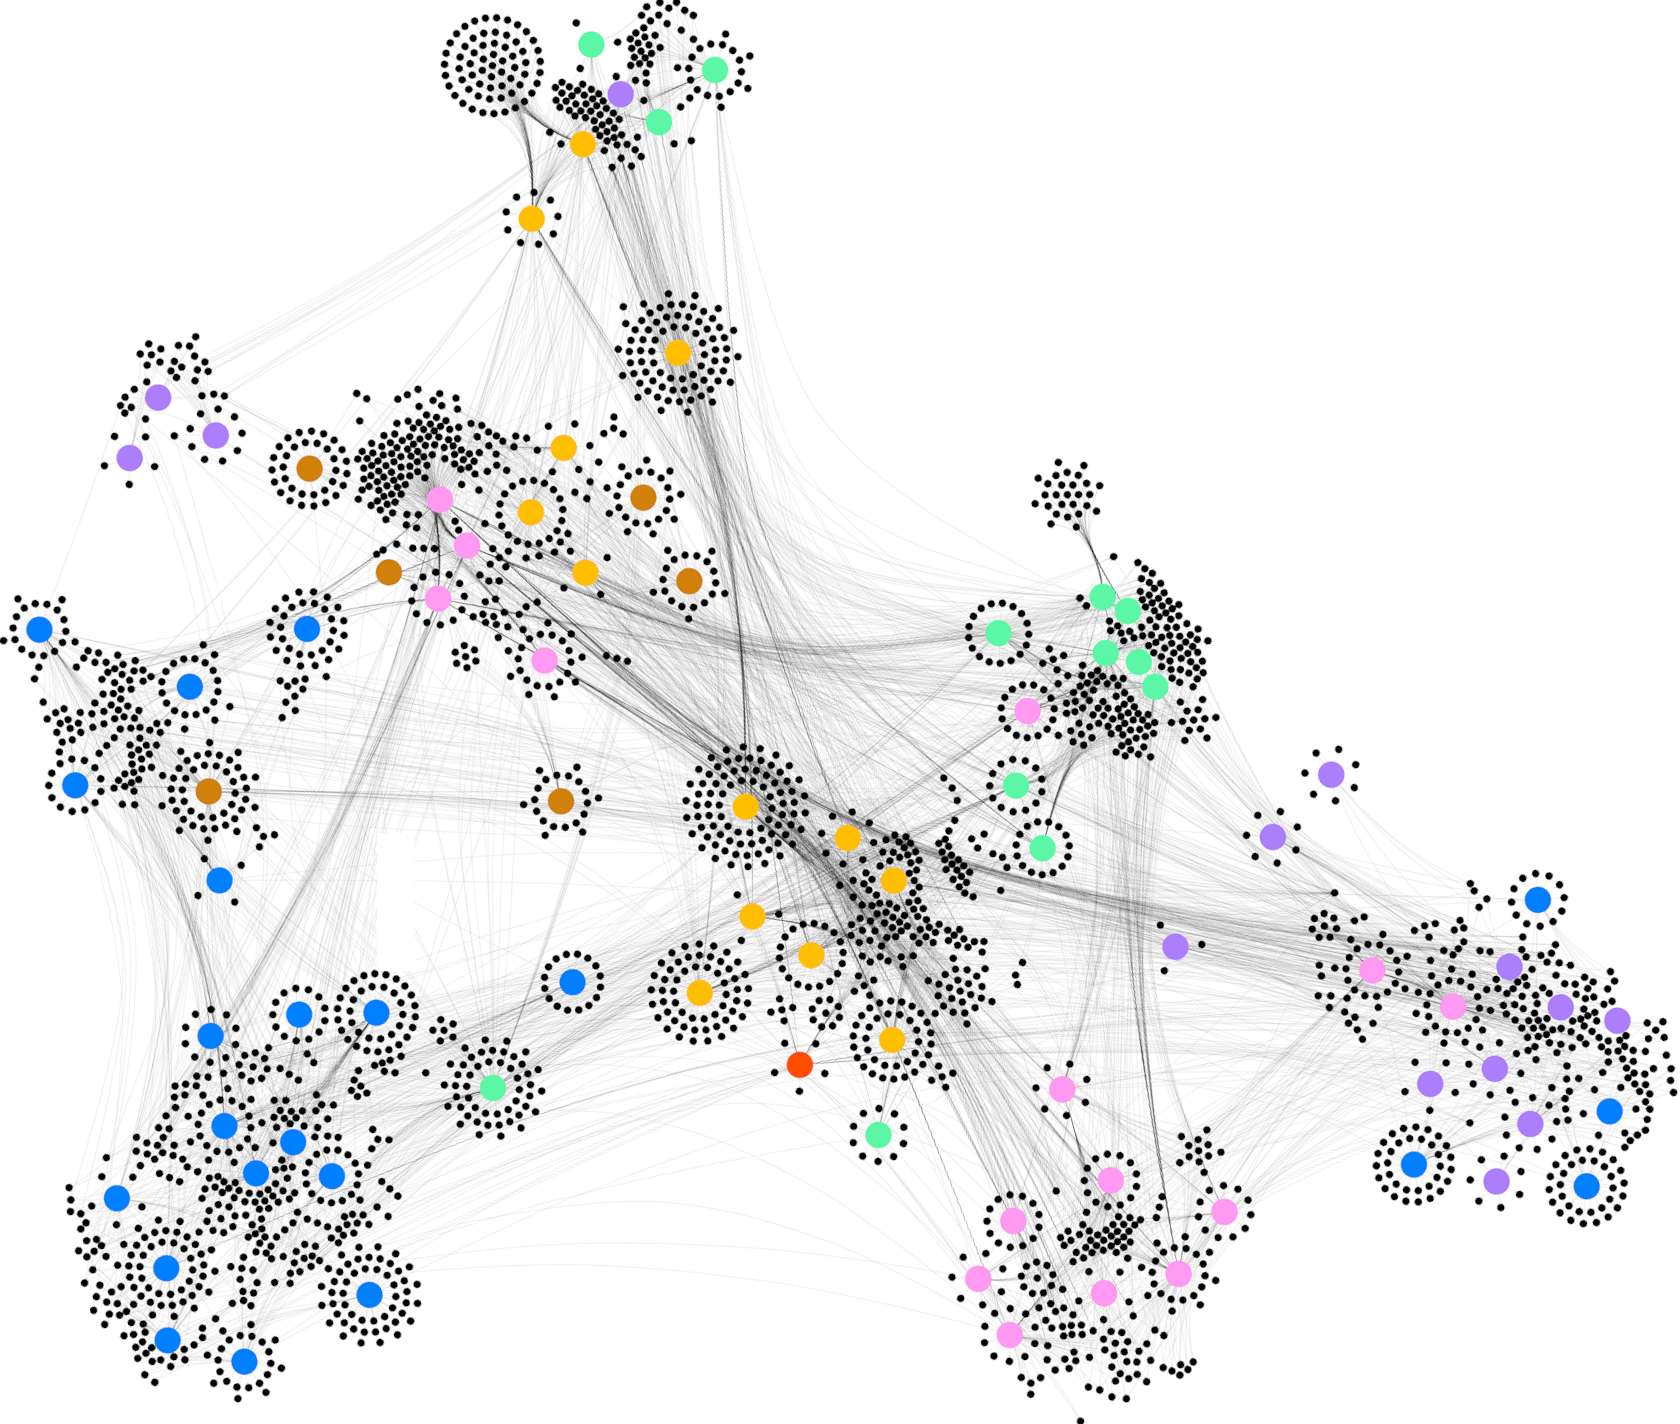
Additionally, we analyzed the corresponding network () with two categories of nodes (programs, courses) and edges if courses can be taken in programs. We call this network the knowledge map. This complex relationship between programs and courses is illustrated in Figure 5. Larger nodes represent programs, color-coded depending on the college and small black nodes are associated with individual courses. The organic layout is the optimized result of simulating physical forces and using the Louvain modularity method as the natural clustering algorithm. We used the Python package NetworkX333networkx.org to construct and represent the network and the free network diagramming software, yEd444yworks.com/products/yed, to generate the layout and visualize it.
4.2 System Architecture and Interfaces
We suggest the implementation of TopProRec using a modular system architecture. The system design shown in Figure 6 and explains the interplay of the individual modules including, program data sources, data management, analytics engine, and user interface.
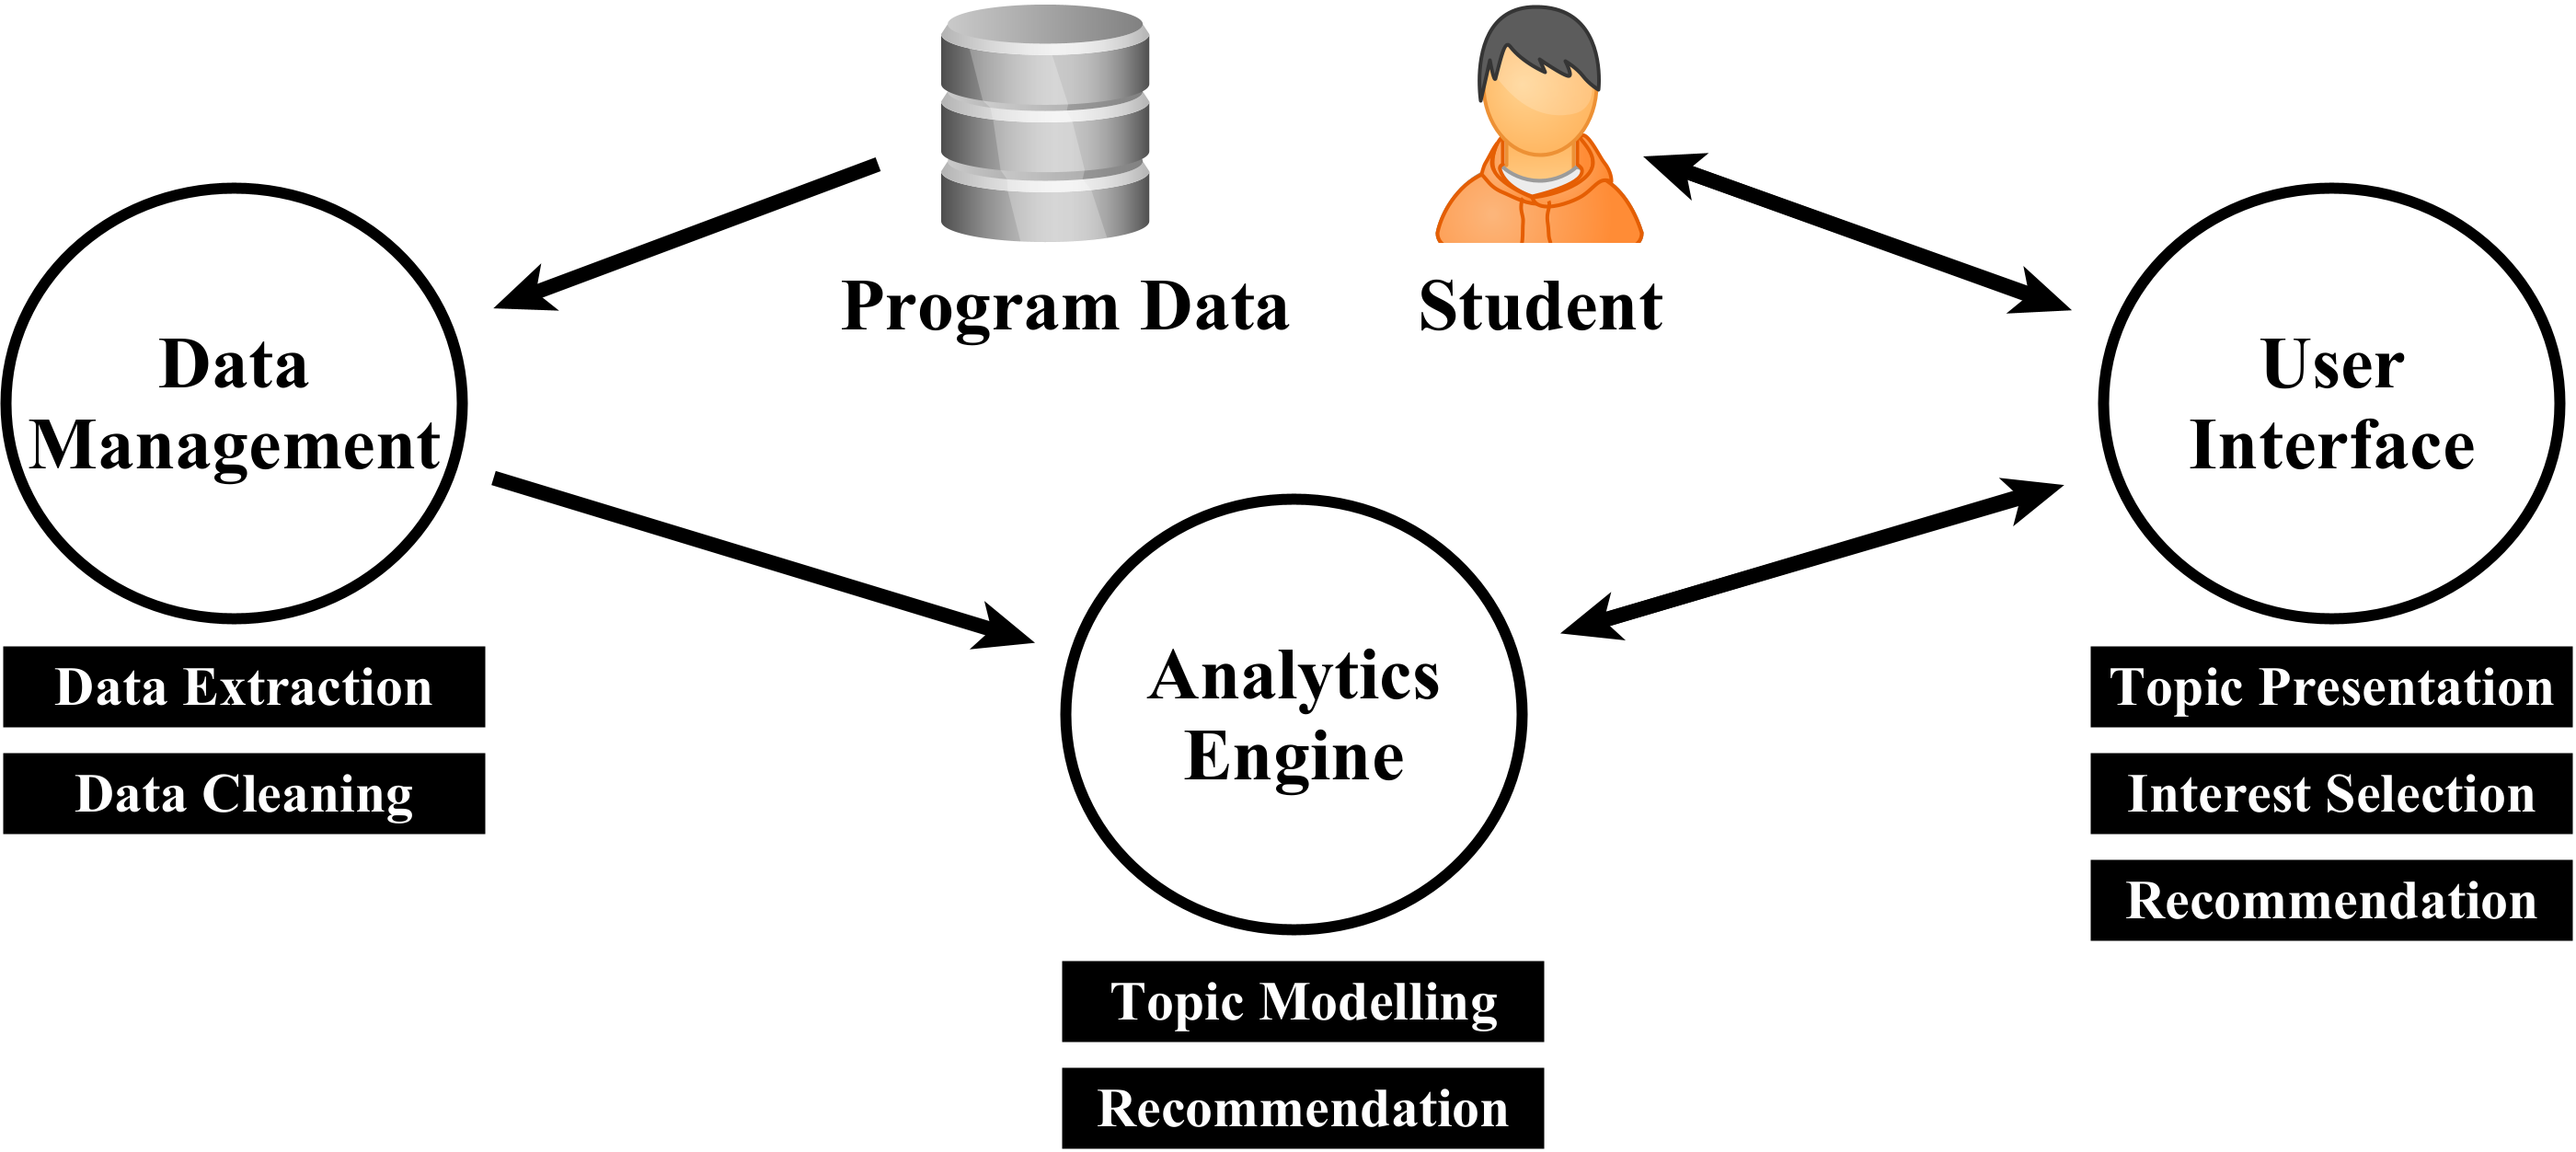
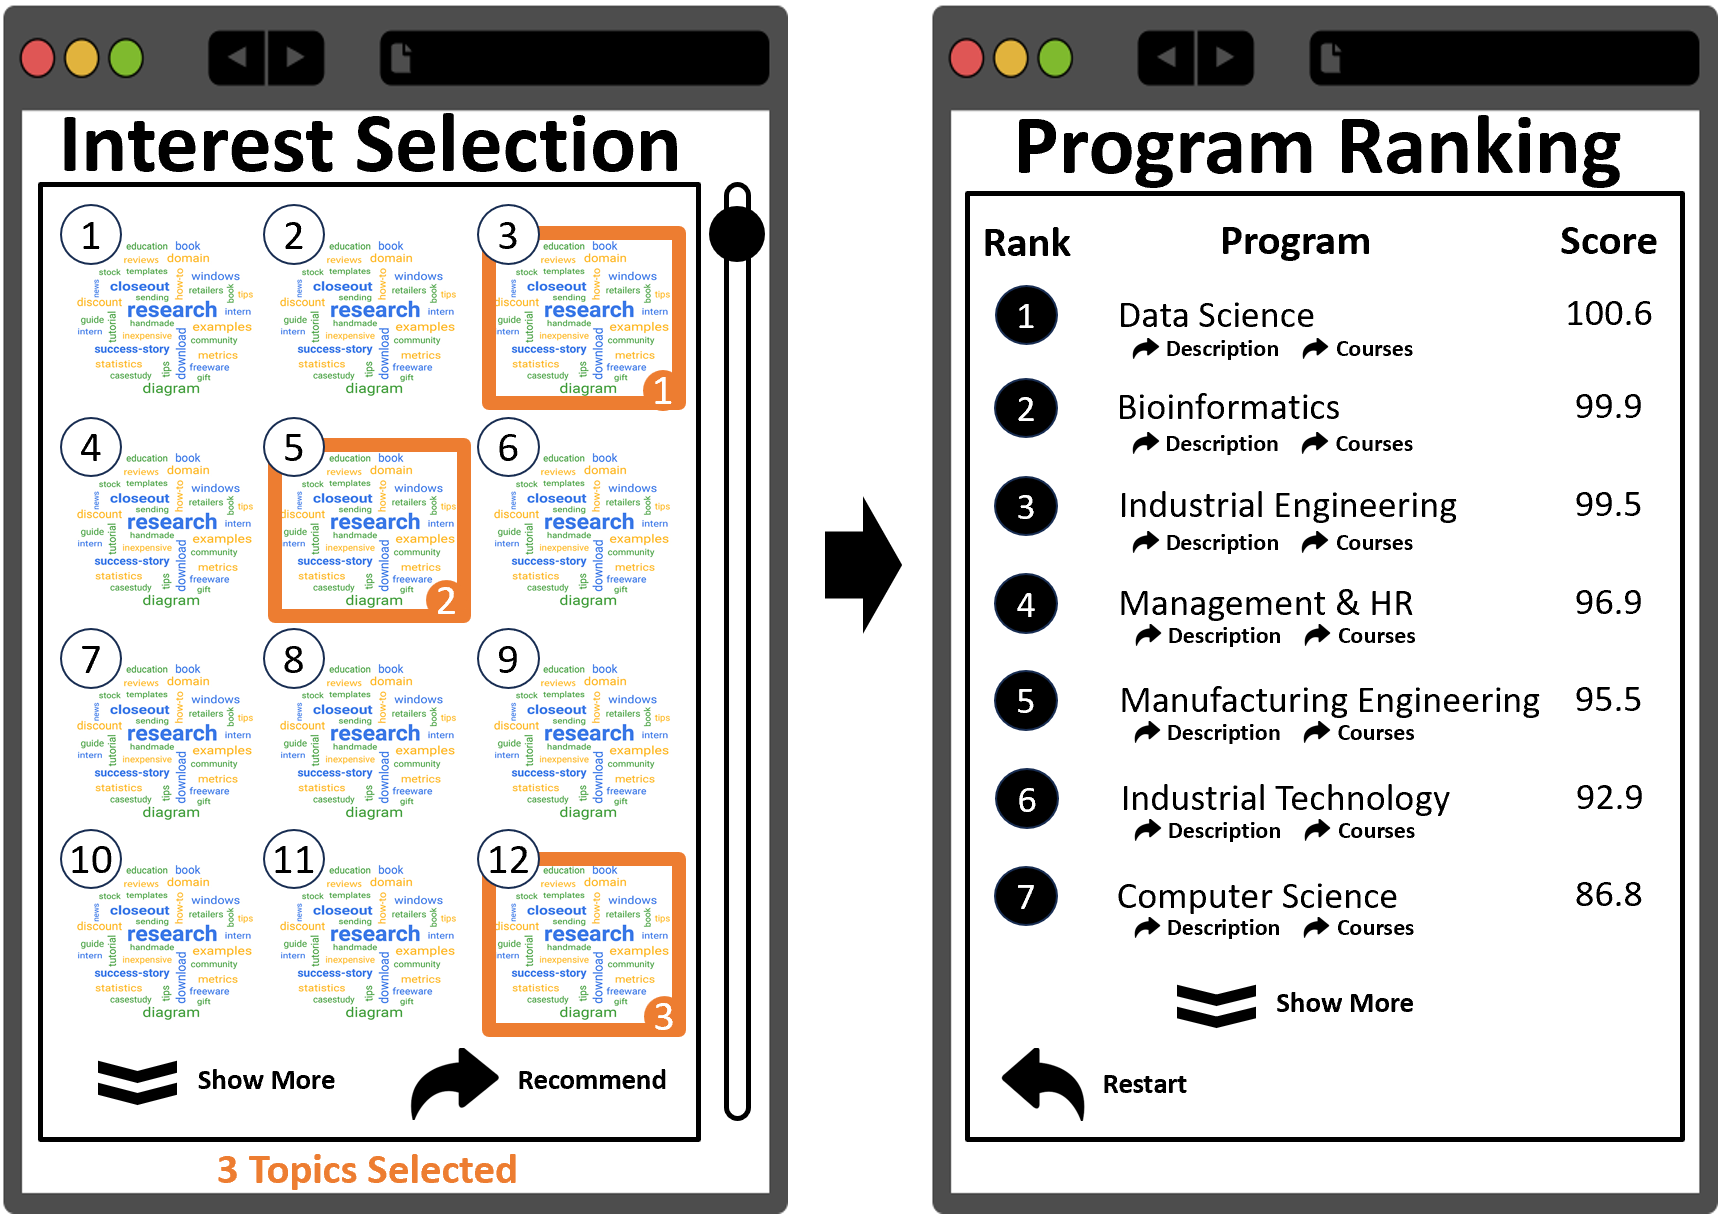
Figure 7 shows a TopProRec interface that could be used on personal computers as well on mobile devices. On a first screen, all computed interest topics are presented to the user (left). After the user selects a subset of topics that match personal interests, the computation of the recommendation (Algorithm 1) is triggered. The recommended programs are then displayed on a second screen together with the final scores (right). Moreover, the user is offered the option to restart the process with a revised interest topic selection.
4.3 Implementation
We implemented the system using Python 3.10 on a MacOS machine with a 2.6 GHz 6-core Intel Core i7 processor and 16 GB of RAM. For the steps in the process described in Section 3.1, we used the following packages. The online program and course data retrieval was done using a Python library called Beautiful Soup [58] that provides a convenient way to parse and navigate the content of web pages, making it easier to extract specific information such as text, links, and data tables. We utilized the Natural Language Toolkit (NLTK) [59] to preprocess text data using functionalities such as tokenization, stop word removal, stemming, and lemmatization. These preprocessing steps are crucial before feeding text data into a topic modeling algorithm as they help reduce noise and improve the quality of topics generated. Topic modeling was performed via the BERTopic [36] implementation in version v0.13.0, together with the built-in CountVectorizer from scikit-learn [60]. CountVectorizer is a text processing technique that converts text data into a numerical format, making it suitable as input for machine learning algorithms. Word clouds were visualized by WordCloud [61]. Furthermore, we used the following system parameter values (see Section 3): (Number of interest topics); (Number of top keywords per interest topic); (Maximum number of user-selected interest topics); (Number of top programs in final ranking).
4.4 A Real Recommendation
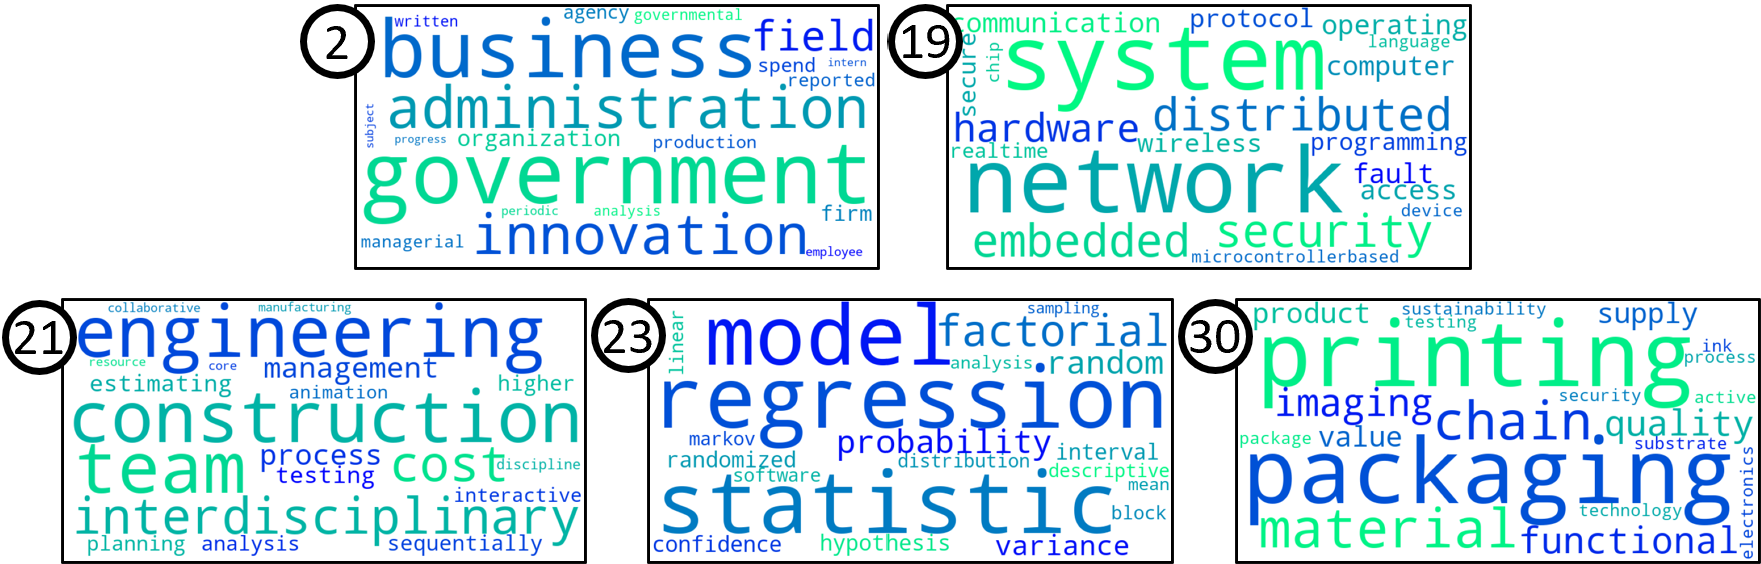
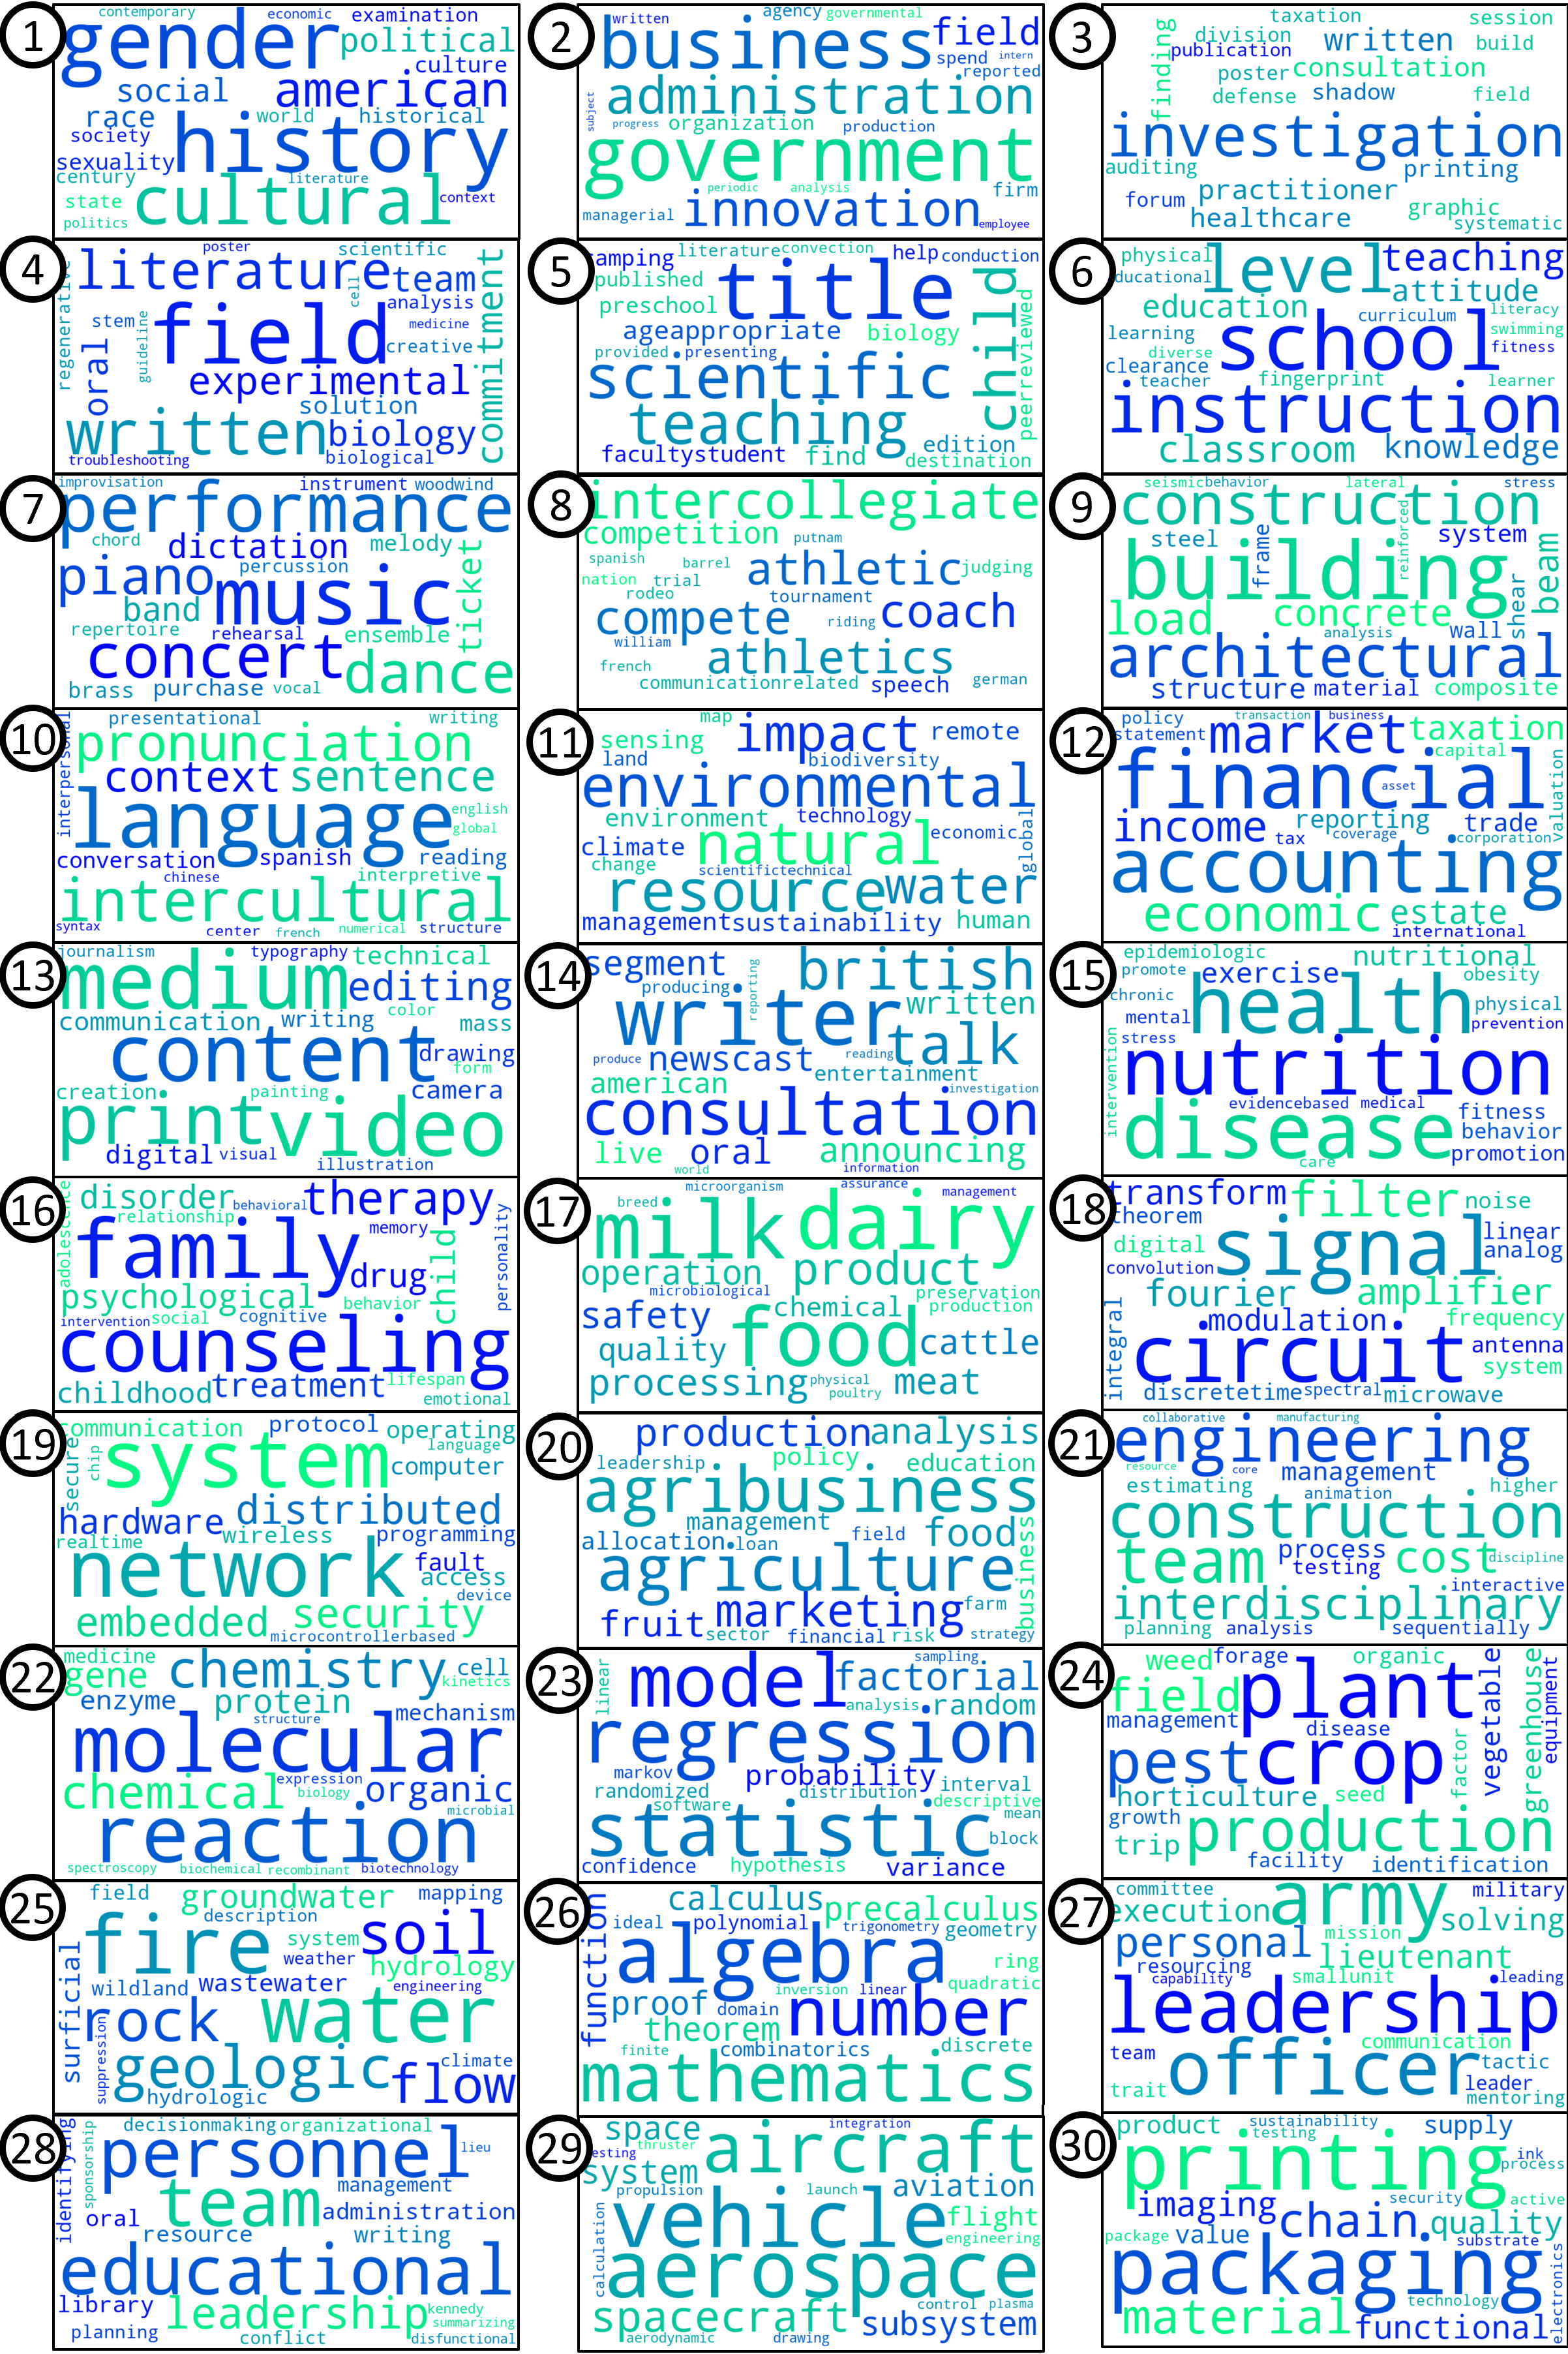
In the following, we illustrate our system by providing a full example of program recommendation based on the actual data and a fictitious student. Let the 5 word clouds (#1, #18, #20, #22, #29) in Figure 8 correspond to the selection made by the student. We observe that the presented topics are related and the programs can be associated with the keywords contained in the corresponding topics. The remaining 25 unselected word clouds can be found in Appendix A.
For this selection, our backtracking algorithm computed the metrics and ranking shown in Table 4. Although the PIS scores significantly vary for the presented programs, the R-PIS scores are consistently high. Solely Computer Science, which is ranked last, is shows a lower R-PIS and final score, after a 7-point drop. Now it is up to the student to further examine the programs in the list before making a final decision.
Rank Program #Courses PIS R-PIS SCORE 1 Data Science 21 113 5.381 100.0 2 Bioinformatics 16 86 5.375 99.9 3 Industrial Engineering 102 546 5.353 99.5 4 Management & Human Res. 14 73 5.214 96.9 5 Manufacturing Engineering 115 585 5.087 94.5 6 Industrial Technology 27 135 5.000 92.9 7 Computer Science 176 822 4.670 86.8
4.5 System Evaluation
In this section, we evaluate TopProRec using common metrics typically applied to recommender systems. Our primary goal is to determine whether our tool can effectively support both prospective and current students in practice. The first part focuses on a quantitative analysis of the system design, while the second part presents a qualitative analysis based on a survey. Note that both aspects rely on the program data used and the student population considered. We begin by describing the experimental setup used to gather system performance data.
4.5.1 User Experiment
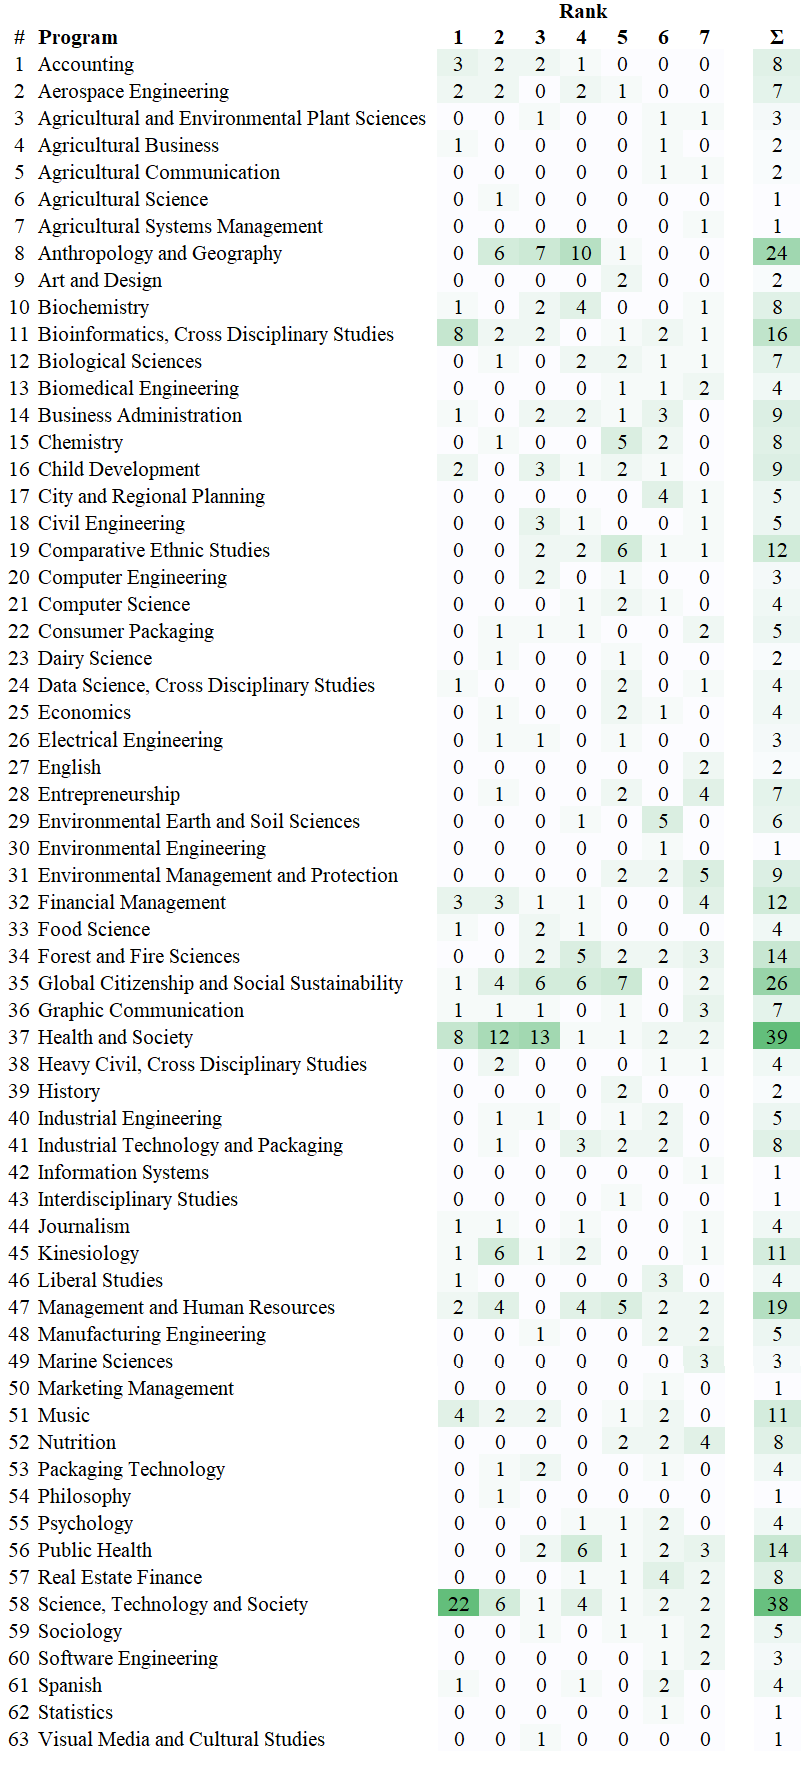
To capture the usefulness of our tool in practice, we conducted an experiment in which each participant went through the full recommendation process. After selecting interests, the personalized program ranking was presented to the user. In a survey, participants were asked about their experience. We randomly selected 64 students from 39 different majors, of which 50 were students at the experiment university and 14 from other local colleges. They all participated voluntarily and no incentive was provided. Students were in there first year (5), second year (22), third year (13), fourth year (14), and beyond (11). We configured our system to interest topics containing keywords each. Users were asked to select up to 8 interest topics to match their interests. The list of recommended programs ranked the top programs. How often a program was recommended to a user and how often at what rank is shown in Appendix B. Note that overall 63 programs were recommended to the 65 users. Similarly, the corresponding rank and recommendation analysis for the colleges is given in Appendix B. Interdisciplinary Programs was not recommended at all. This is probably due to the fact that it only contains one program. We will show in our evaluation (Section 4.5.2) that theoretically 98.8% (83 out of 84 programs) can appear in the recommendation for the parameters used. Solely the program “Plant Sciences” is excluded.
4.5.2 System Design
In the following, we evaluate the system design measuring explainability, user controllability, fairness, robustness, bias, privacy protection, personalization, and trustworthiness.
Explainability
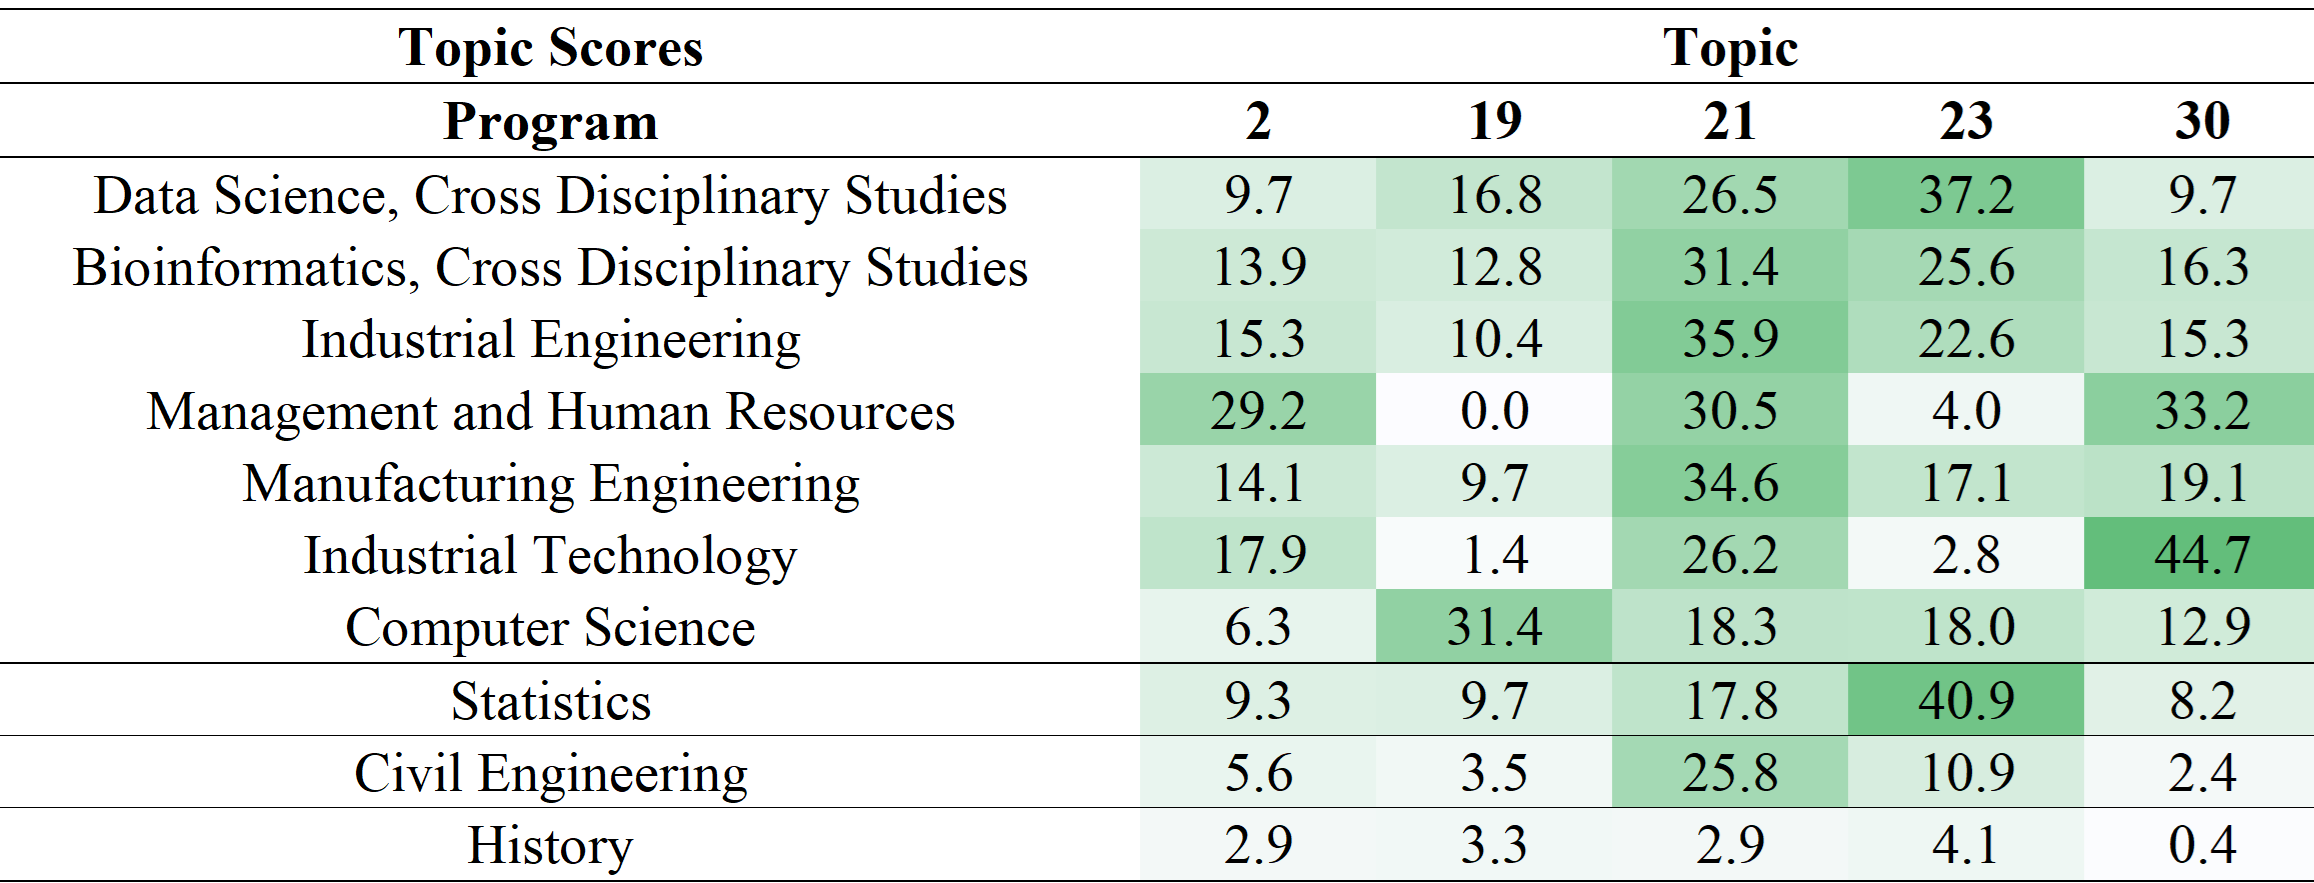
Explainability focuses on making the recommendation process and the reasons behind specific recommendations clearer to the users [62]. To increase explainability, we suggest a system add-on that provides information on the importance of user-selected interest topics for the recommended programs. For a topic and a program , let the topic score be defined as the normalized relative number of appearances of keywords related to in the course descriptions of . Using this information, we can explain to the user which topic choice was least or most influential in the recommendation of a program. This insight can help the user revise their selection of interest topics and experiment in a sensitivity-analysis fashion. The table in Figure 9 shows the corresponding values for the example topic selection and the recommended programs. Additionally, the topic scores for a runner-up program (Statistics; SCORE = 0.859), an alternative engineering program (Civil Engineering; SCORE = 0.481), and a liberal arts program (History; SCORE = 0.136) are presented. As expected, non-recommended programs show low scores for most topics. Interestingly, Topic 19 is not represented in any of the courses of the recommended program Management and Human Resources, and Topic 30 is largely responsible for the recommendation of the Industrial Technology program. This information can also help users understand why they are presented with unexpected programs.
Furthermore, we believe that a degree of explainability is achieved by providing each user with an introductory guide that explains the basic principles and process. For a more detailed discussion on implementing explainable recommender systems, we refer to Tintarev and Masthoff [63].
User Controllability
TopProRec does not allow the user to customize and participate in the recommendation method. However, such user controllability [62] could be achieved by giving the user access to parameters such as the number of presented interest topics (), or allowing the application of input filters on the list of programs and colleges (e.g., only show engineering programs). Depending on the education system and the institution, it can be very important to consider program requirements such as minimum entry scores. Our system can be extended with user-specified filters that exclude non-eligible programs. Note that the interest topics need to be recomputed to avoid considering irrelevant course descriptions. On a parallel note, a useful extension could allow users to include certain programs a priori. Using the topic scores (Figure 9), users could then understand why a current or favored program was not recommended.
Fairness
A well-known issue regarding the fairness is the under-recommendation of items [64, 65, 66, 67]. Programs that are under-ranked could seriously suffer from not being considered by future students. It is not immediately clear whether our tool is equitable with respect to the programs offered by the university. That is, does the model allow the declaration of interests such that potentially every program is suggested? Therefore, we investigate the program reachability; i.e., the programs that potentially appear in the final ranking based on the user input. In the context of recommender systems, this number of items that can be recommended for a given training data is also called coverage. In order to better understand the impact of parameters (# topics), (# selected topics), (# words in word cloud), and (# programs in ranking), we conduct a sensitivity analysis. For , selected interest topics , number of recommended programs , and number of topic keywords , we calculate all possible rankings using all possible combinations of topics. We define program reachability as the relative number of programs in that were suggested in the top- ranking at least once. That is, for a given parameter quadruplet :
Here, denotes the set of recommended programs obtained by TopProRec when using the corresponding parameter values. The results are shown in Figure 10.
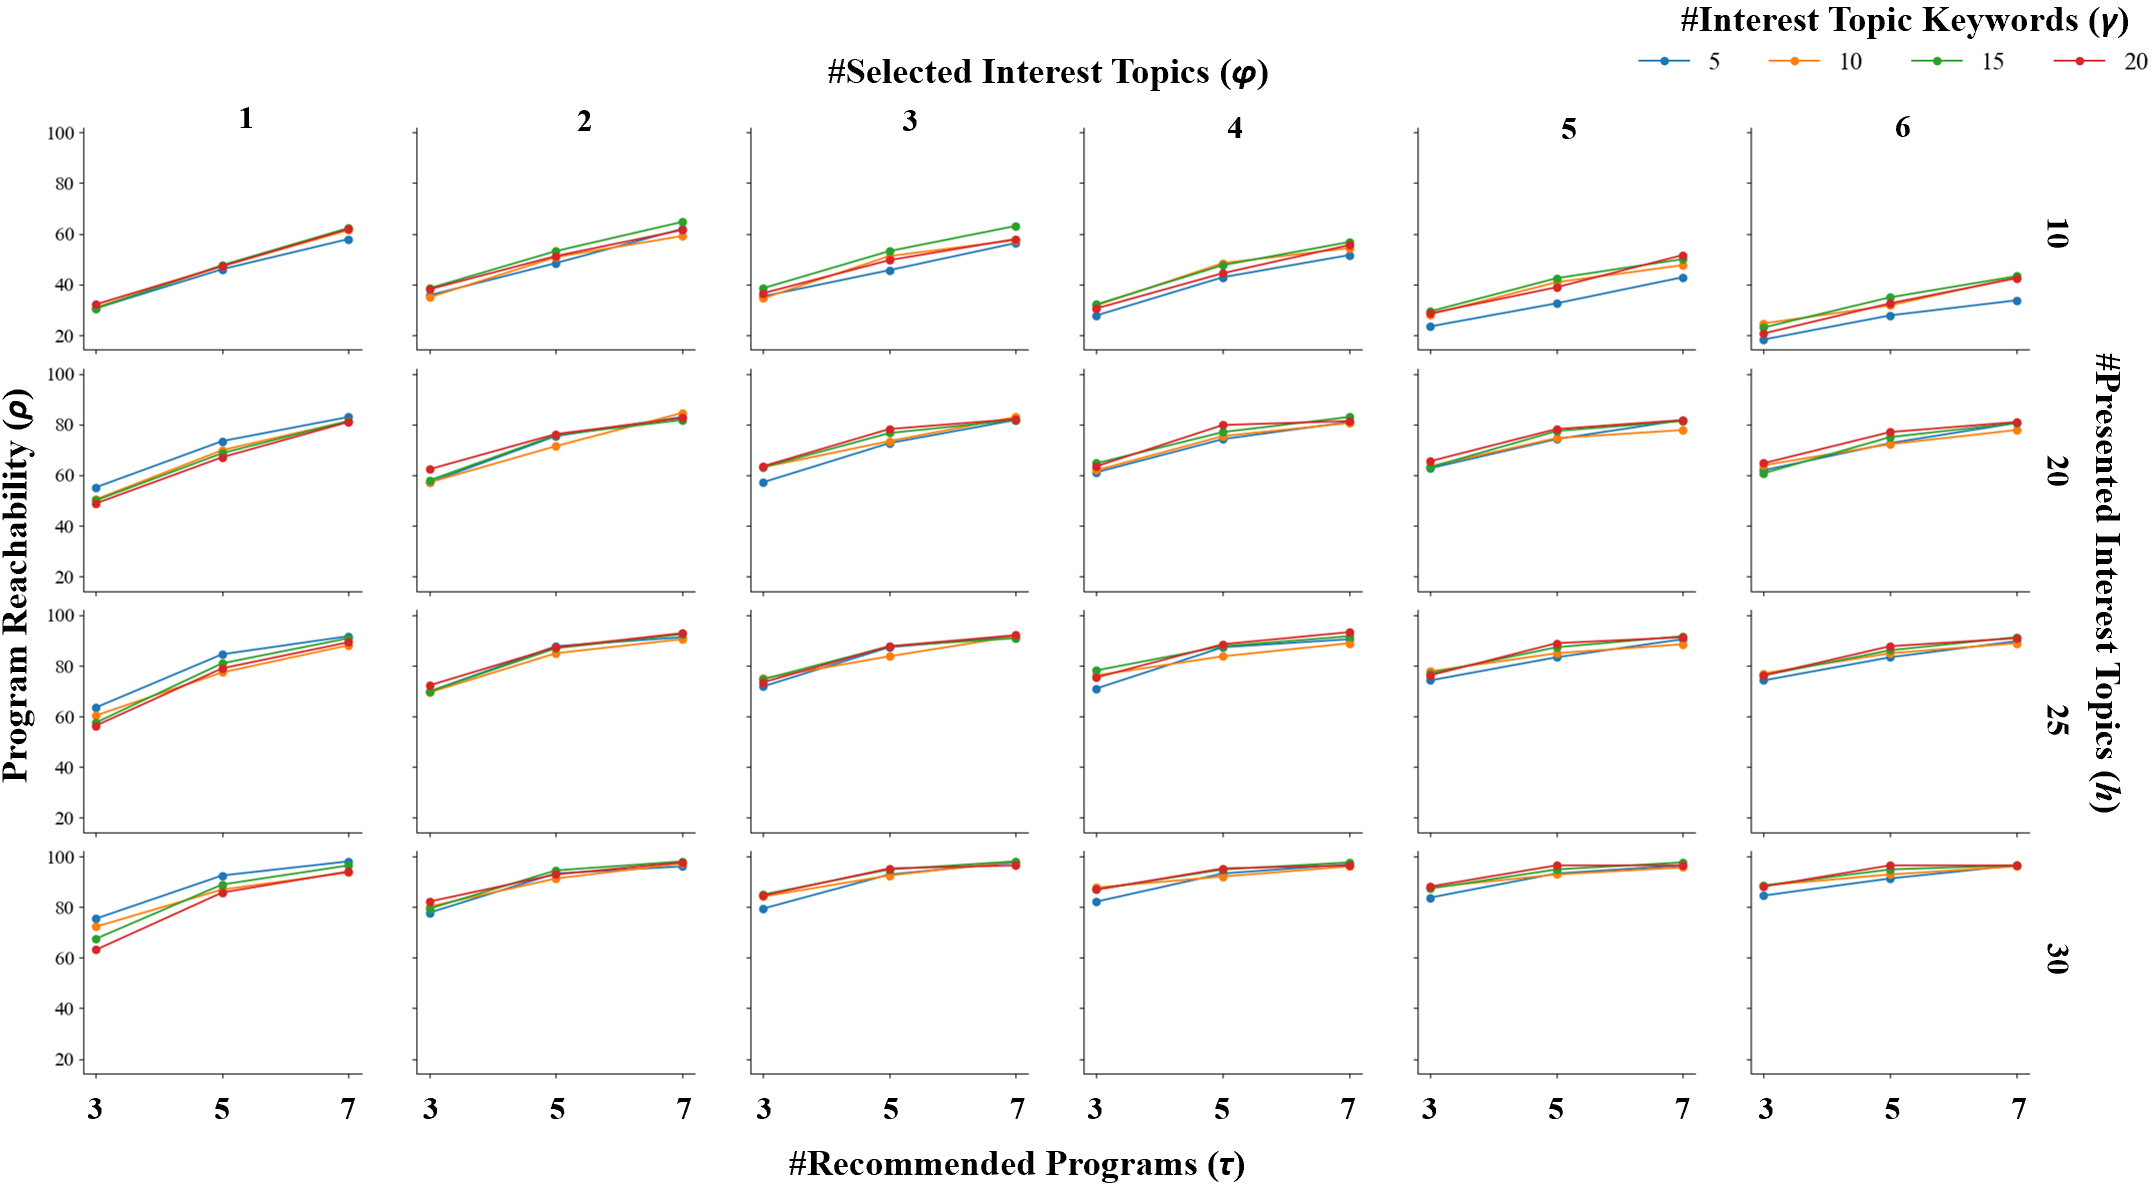
We observe that the reachability ranged from 16.7% (14 programs; ) to 100.0% (84 programs; ). A reduced number of presented interest topics () led to poor reachability. For example, when setting , was at most 66.7%. The number of user-selected interest topics () had an ambiguous impact on the reachability. For higher values of , increasing results in a better . Conversely, decreased when working with lower values of . It is not clear how the number of keywords () in the interest topics influences . Although it seems to have a minor impact, augmenting resulted in both improved reachability (e.g., ) and deteriorated reachability (e.g., ). Based on these numbers, we decided the parameter setting in our case study (Section 4). We suggest a configuration that yields a reachability of . This can be achieved by using parameters , , , and . The observed coverage values are high compared to what is often seen with collaborative filter approaches in other recommender systems.
Robustness
Two types of users participate in our recommender system: the program managers and the prospective students. Changes in program and especially course description data can lead to corrupted results. We suggest the validation of the system to detect irrelevant keywords (see also Section 3.2). Such occurrences could also be detected on a continuous basis by including a corresponding question in a short user survey after having obtained a recommendation.
Bias and Privacy Protection
We consider our system as practically unbiased since recommendations for distinct users are independent [68]. Popular programs - among students and in the provided ranking - are solely presented based on the user’s interest topic selection. To ensure privacy protection [69], neither the users’ interests nor the recommended programs are shared with third parties.
Personalization
To better understand the grade of personalization provided by our system, we quantify the dissimilarity of the 65 recommendations that our system generated for the participants using cosine similarity. Let be the binary experiment recommendation matrix with if program was included in the recommendation for user , and otherwise. Then the cosine similarity between two recommendations (rows in ) be denoted by . It will always be in the interval since the underlying matrix is binary. The personalization score is calculated as where is the average similarity; i.e., . In our case study, we observe a high personalization score of 0.77 for program recommendation. The corresponding college personalization score is lower (0.48), which we attribute to the low number of available colleges (7). The complete experiment recommendation matrix is given in Appendix B.
Furthermore, the number of unique program recommendations was 59 (91.0%) and the number of unique recommended colleges was 25 (38.5%). More detailed, there were 9 matching program recommendation on the program level and 126 on the college level, respectively. At most 4 colleges were recommended to a single user. In 4 cases (6.2%), the recommended programs were all located at a single college.
Trustworthiness
It is crucial for recommender systems to ensure that the user trusts the system [70]. We see two categories of TopProRec users: prospective students and educational program managers. For the former group, we use the coverage argument which is also used to support system fairness. To better understand the reception of our system by future students, we refer to survey results in the next section. In Question 6, over 94% of the users stated that they would consider using TopProRec in the future. We claim that future students seeing their interests reflected (98.1%; see Question 2) will create confidence.
4.5.3 User Feedback
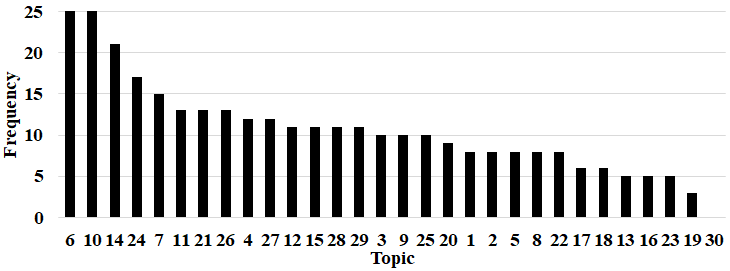
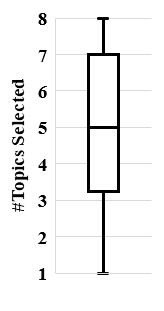
The most popular topics were picked by 25 participants (39%). Only one topic (topic 30) was never selected in our experiment. On average, each topic was selected by 10.6 participants (16%). The distribution of how many times a cluster was selected is presented in Figure 11 (right). On average, students picked 4.9 topics.
For the current program metric, we need to keep in mind that not everyone chose their major based on their interests.
| # | Question | Yes | No | ||
|---|---|---|---|---|---|
| 1 | “My current program was recommended” | 46.3 | 53.7 | ||
| 2 | “One or more of the recommended programs matched my interests” | 98.1 | 1.9 | ||
| 3 | “There is an unexpected program that I did not consider yet” | 74.5 | 25.5 | ||
| 4 | “A program that I would consider (besides the one I’m enrolled in) | 57.4 | 42.6 | ||
| is not recommended” |
We show the user feedback regarding our binary questions in Table 5. 75% of the students stated that there was an unexpected program suggested that they didn’t consider yet. Moreover, more than 98% indicated that one or more of the recommended programs matched their interests. It could be there are programs of interest among the unexpected programs. This would mean our method allows for serendipity in program recommendation.
Furthermore, we asked the experiment users questions concerning usefulness and usability of the system. Table 6 shoes these survey results that we obtained using a Likert scale. It can be seen that over 96% of participant agreed that the tool can be useful. Similarly, more than 94% would use consider using the system in the future. However, one user strongly disagreed to consider this support. The presented topic wordclouds were meaningful for about 93% of the students. Even though 85% did find it easy to select topics that match their interests, 13% had a neutral feeling about this task. All participants stated that overall using this tool was easy.
# Question Strongly Agree Neutral Disagree Strongly Agree Disagree 5 “I think this tool can be useful to 53.7 42.6 1.9 1.9 0.0 select a major.” 6 “I would consider using this tool 50.0 44.4 3.7 0.0 1.9 in addition to existing resources.” 7 “I think the interest word clouds 31.5 61.1 7.4 0.0 0.0 were mostly meaningful.” 8 “It was easy for me to select 50.0 35.2 13.0 1.9 0.0 interesting word clouds.” 9 “Overall, it was easy to use this tool.” 77.8 22.2 0.0 0.0 0.0
We asked for suggestions for improvement of this tool and all user comments are listed in Figure 7.
| # | Comment |
|---|---|
| 1 | “Really awesome! Maybe do a blind study without people knowing this is a major test?” |
| 2 | “This tool was a very interesting way to map interests to specific majors.” |
| 3 | “Excluding the name of majors from clusters might decrease bias.” |
| 4 | “Awesome!” |
| 5 | “Maybe a step further and could recommend potential jobs/internships :) thought this was pretty snazzy.” |
| 6 | “I think this tool is far more beneficial to students who have not declared a major yet, since it provides many different options (helpful for someone searching for a major idea). Overall a very cool idea and tool.” |
| 7 | “As an art and design major I didn’t see many clusters that described my particular program, maybe expanding those clusters to be sure they focus in on each major that is offered.” |
| 8 | “Look into legibility research of different typefaces for fonts of word clusters.” |
| 9 | “Maybe organize the word clusters so that they are spaced a little further apart.” |
| 10 | “Consider using weighting for the different word clouds.” |
| 11 | “Great work!” |
| 12 | “I liked it.” |
| 13 | “Include images in the clouds.” |
| 14 | “None, this is a fantastic project!” |
| 15 | “I think it was very easy to use and found it very interesting to see what I found interesting. I wish I could have seen this when I first applied to [the university].” |
| 16 | “My of an explanation about how the clusters were derived and the relationship between them (but maybe that spoils too much of the point of this project).” |
| 17 | “Seems like a great tool to get starting points for recommendations. If anything, having multiple rounds could be interesting, to further narrow down a selection.” |
| 18 | “I think the words should be more theoretical it was very literal explanations and I could tell what the clusters would recommend to me.” |
Users provided a range of feedback on our tool, expressing both praise and suggestions for improvement, as shown in Table 7. Many users found the tool’s concept intriguing and innovative, particularly in its ability to map personal interests to specific majors. Positive sentiments were succinctly shared with comments like “Awesome!” and “Great work!”, highlighting the overall appreciation for the tool’s value and effectiveness. Users also praised the tool’s potential to assist undecided students by presenting them with a diverse range of major options, making it especially beneficial for those who haven’t declared a major yet. Some even expressed a sense of nostalgia, wishing they had access to such a tool when they first applied to the university.
However, among the areas for improvement identified by users, a notable suggestion was to conduct a blind study, which could potentially enhance the tool’s credibility and effectiveness by removing any bias associated with participants knowing it’s a major test. Some users recommended refining the presentation of the word clusters for better legibility, including exploring different typefaces and adjusting the spacing between clusters to enhance readability and the user experience. The concept of incorporating images within the word clouds was also suggested, adding a visual element that could enrich the tool’s engagement.
Additionally, users proposed ways to improve the accuracy of the recommendations. One user recommended removing major names from clusters to reduce potential bias, while another suggested using weighted word clouds to better reflect the significance of certain interests within each major. Some users also expressed a desire for a more detailed explanation of how the clusters were derived and their relationships, though this request was balanced with the acknowledgment that too much detail might compromise the intended user experience of exploration and discovery.
Furthermore, users shared ideas for expanding the functionality beyond major recommendations. The idea of suggesting potential jobs and internships based on the identified interests was praised for its innovation and its potential to offer even more value to users. Some users also suggested introducing multiple rounds of recommendations to further narrow down options, which could help refine choices and provide a more tailored selection process.
In summary, the user feedback highlighted a balance of appreciation for the system’s unique concept and suggestions for improvement across various aspects. Users recognized its potential value for both undecided students and those seeking more specialized recommendations. The suggestions ranged from technical adjustments to more sophisticated features, all aimed at making the tool even more effective, engaging, and valuable to its users.
5 Conclusion
In this paper, we presented a novel information system that supports prospective and current students in making informed decisions when choosing a study program. The system is applicable across a wide range of educational settings and can assist educational institutions in positively impacting student transfers, dropout rates, and overall satisfaction. Our tool leverages extensive course description data and applies advanced machine learning techniques to generate keyword clusters representing interest topics. Students match their personal interests with one or more of these suggested topics, which are then used to create a ranked list of the most relevant study programs, assisting students in their final decision-making process. While our approach is the first to incorporate program data at the course level, it relies on course descriptions being both well-written and accurate.
We implemented and evaluated the system at a large polytechnic university. In a qualitative study involving more than 60 personalized rankings, we found that users highly valued the recommendations, considering them meaningful and helpful. Our quantitative analysis demonstrated how to configure the system to ensure fairness, achieving 98% program coverage while maintaining a high personalization score of 0.77. Additionally, students reported experiencing both serendipity and trustworthiness in the recommendations. We are currently focused on integrating our system into existing student support services to enhance the overall program selection process.
For future research, we recommend extending our system to related areas, such as vocational and professional training. Additionally, integrating offerings from multiple universities, minors, certificates, and study abroad opportunities could further benefit students. Providing recommendations at the course level could also be an interesting feature. Another key consideration is exploring strategies to increase user control—such as allowing users to exclude certain topics or programs from recommendations based on factors like admission exam scores. Finally, we believe the accuracy of the system could be enhanced by incorporating more detailed course data, including syllabi, class activities, and course materials.
Acknowledgements
We would like to thank Daniel Waldorf for his valuable feedback and for naming the knowledge map. We are also grateful to all the users who participated in our experiments.
Declarations
The authors have no competing interests to declare that are relevant to the content of this article.
A. All 30 word clouds representing the interest topics for the example in Section 4.4.
B. The complete recommendation data for the case study in Section 4.
![[Uncaptioned image]](/html/2501.06581/assets/pics/RecomAnalysisCollege1.png)
C. The complete PIS data for the case study in Section 4.
# Program 1 2 3 4 5 6 7 8 9 10 11 12 13 14 15 16 17 18 19 20 21 22 23 24 25 26 27 28 29 30 1 Aerospace Engineering 10 49 0 59 4 14 9 0 100 15 17 5 5 2 16 5 13 44 35 52 102 9 73 17 67 31 17 9 258 16 95 2 Agricultural and Environ. Plant Sci. 26 41 7 28 9 6 1 3 28 35 82 10 7 14 20 1 102 6 10 109 61 42 19 217 31 7 2 45 18 18 85 3 Agricultural Business 24 36 0 17 3 7 1 0 18 4 51 32 4 13 21 2 95 2 5 104 34 15 22 66 23 3 7 18 6 17 45 4 Agricultural Communication 23 28 0 19 7 7 0 0 16 11 43 18 39 8 17 6 69 8 19 80 23 15 18 39 15 7 24 21 4 12 44 5 Agricultural Science 50 60 1 23 4 12 3 2 30 7 137 41 17 18 36 12 197 8 24 177 83 18 24 177 63 5 18 64 18 29 107 6 Agricultural Systems Mngmt 24 39 6 45 2 13 2 0 46 9 105 21 18 10 21 8 125 11 22 103 90 23 43 62 65 5 16 37 44 45 81 7 Animal Science 36 108 5 84 19 34 6 9 86 27 180 52 5 19 111 49 300 20 23 238 140 159 56 174 43 19 10 96 43 48 202 8 Anthropology and Geography 133 26 8 37 17 20 1 2 28 30 247 36 18 20 30 38 39 5 10 46 49 12 24 46 39 1 2 24 5 21 65 9 Architectural Engineering 5 24 0 27 0 6 1 0 85 4 6 2 10 3 9 3 8 14 14 24 54 3 40 2 24 13 5 1 34 4 49 10 Architecture 17 3 0 3 0 5 0 0 71 2 16 1 17 3 6 6 9 2 5 8 15 1 2 3 8 3 5 5 15 3 37 11 Art and Design 134 28 10 23 1 9 2 4 14 14 14 8 136 15 4 18 16 14 10 24 49 7 8 14 1 0 18 11 14 16 88 12 Biochemistry 8 30 4 69 30 37 0 0 43 15 15 3 8 1 23 8 37 7 5 31 36 179 31 22 16 13 1 0 23 14 76 13 Biological Sciences 65 51 20 143 71 65 0 0 65 32 211 16 14 31 72 43 47 15 23 79 90 156 78 71 52 27 13 36 35 39 142 14 Biomedical Engineering 13 57 1 77 7 13 0 0 92 20 19 6 16 3 21 11 27 73 33 55 113 73 87 13 53 58 10 10 78 53 98 15 BioResource and Agricultural Eng. 19 22 3 38 5 7 0 0 37 10 59 9 11 4 13 4 38 18 11 32 64 25 35 23 62 17 7 8 56 17 63 16 Business Administration 27 37 2 15 1 5 2 0 18 11 25 74 5 13 6 10 12 1 6 57 25 2 26 11 1 1 10 16 7 19 33 17 Chemistry 8 28 4 62 32 37 0 0 33 16 13 3 8 1 17 7 35 11 16 29 36 138 45 16 17 22 2 0 26 12 69 18 Child Development 27 5 1 18 24 22 0 0 15 5 13 3 6 2 21 88 3 3 1 5 3 13 11 0 0 2 2 5 0 1 39 19 City and Regional Planning 192 64 14 48 8 15 1 0 56 24 295 58 38 27 21 67 32 10 13 80 101 1 63 33 46 10 20 63 15 25 124 20 Civil Engineering 11 21 3 38 4 7 0 0 66 9 55 5 9 8 8 10 20 20 13 29 97 22 41 13 121 34 5 14 65 9 70 21 Communication Studies 45 10 2 11 1 4 0 1 10 5 12 4 16 4 2 13 1 1 10 9 9 0 14 1 2 1 15 10 0 4 26 22 Comparative Ethnic Studies 580 58 15 58 22 39 16 16 56 70 191 93 28 85 29 101 16 5 16 74 67 1 49 15 36 2 10 25 13 17 156 23 Computer Engineering 14 45 4 51 4 13 5 0 59 19 33 4 14 5 15 10 35 93 88 56 88 19 70 23 30 52 11 16 49 63 83 24 Computer Science 31 60 3 86 16 38 11 2 105 45 74 21 51 19 10 23 57 86 297 93 173 56 170 41 65 58 31 40 113 122 176 25 Construction Management 11 25 0 18 4 9 2 0 88 4 37 20 7 4 8 6 18 4 4 37 95 6 25 12 19 5 7 15 17 15 54 26 Dairy Science 12 35 3 25 6 14 3 0 29 12 50 28 14 10 41 11 175 7 11 121 48 59 27 88 12 8 8 39 15 18 89 27 Economics 14 19 0 7 1 1 1 1 11 4 12 38 1 9 2 5 1 3 16 24 16 0 24 4 1 2 5 0 9 9 20 28 Electrical Engineering 33 102 13 119 12 21 18 0 159 38 64 28 61 14 15 17 74 290 253 121 198 42 158 38 104 90 33 34 157 95 215 29 English 86 12 5 26 18 19 0 6 7 94 6 4 26 31 0 6 2 1 18 11 10 0 10 4 0 0 1 16 1 1 60 30 Environmental Earth & Soil Sci. 136 82 14 69 21 34 3 2 85 44 473 44 41 28 54 47 161 17 31 196 177 58 66 226 300 8 22 111 52 51 221 31 Environmental Engineering 13 18 1 33 2 11 1 0 33 10 61 7 9 9 22 10 30 13 6 31 52 49 44 21 65 17 6 11 45 13 60 32 Environ. Mngmt & Protection 154 93 14 76 26 35 3 2 79 37 503 55 39 25 52 51 171 16 21 220 185 67 73 245 266 6 17 126 41 54 224 33 Food Science 21 27 1 28 10 10 3 0 20 12 42 8 5 12 28 12 160 4 1 87 33 46 20 39 14 6 1 10 15 43 66 34 Forest and Fire Sciences 152 86 15 65 23 38 3 2 78 36 530 54 41 27 60 53 186 17 22 218 198 61 64 261 311 6 11 141 47 51 223 35 General Engineering 6 24 0 40 9 5 2 0 44 21 8 2 4 0 6 5 11 13 12 29 61 47 44 12 23 19 10 4 35 14 52 36 Graphic Communication 14 42 50 25 1 3 2 0 20 13 64 25 96 11 7 8 51 25 40 76 67 12 31 41 3 11 46 44 13 101 67 37 History 134 7 0 8 0 7 0 5 9 49 19 19 3 12 0 13 0 2 8 8 7 0 10 1 2 0 0 4 2 1 45 38 Industrial Engineering 48 84 16 100 13 10 4 0 87 22 123 38 14 26 11 17 48 35 57 114 197 17 124 41 47 31 24 52 74 84 102 39 Industrial Tech. and Packaging 4 9 1 5 0 5 1 0 4 5 20 8 3 8 3 1 23 2 5 17 14 5 14 11 1 2 5 13 6 37 24 40 Interdisciplinary Studies 54 4 0 7 0 4 0 0 4 3 7 9 7 4 0 11 0 3 4 6 13 0 26 1 1 3 4 3 4 3 18 41 Journalism 34 18 6 7 1 4 1 2 7 15 12 16 88 44 1 9 11 14 11 28 13 1 32 14 0 6 15 23 3 2 46 42 Kinesiology 54 29 13 49 14 40 4 4 42 13 49 9 15 21 183 98 24 9 18 35 28 34 22 15 8 5 29 34 14 12 89 43 Landscape Architecture 24 6 4 11 3 18 0 0 16 1 34 2 18 5 5 5 10 10 7 12 27 3 13 16 10 6 12 8 20 9 45 44 Liberal Arts and Engineering Studies 35 43 17 38 2 11 9 3 50 17 41 8 35 11 6 8 33 33 64 52 102 3 66 23 31 22 16 22 50 63 82 45 Liberal Studies 293 35 7 94 72 153 5 7 58 58 88 28 17 61 66 120 41 11 28 60 50 66 27 34 33 39 15 29 31 21 160 46 Manufacturing Engineering 48 87 16 100 16 12 4 0 93 26 132 39 20 26 18 13 68 31 60 115 214 30 106 47 52 28 23 51 78 118 115 47 Marine Sciences 49 40 22 102 53 48 2 0 44 34 171 14 15 35 17 22 33 10 20 57 86 90 72 40 48 23 8 28 34 24 118 48 Materials Engineering 18 46 7 63 18 37 5 0 78 19 43 19 12 9 23 7 44 16 24 57 108 47 58 21 41 24 11 11 58 73 100 49 Mathematics 7 40 3 42 2 18 4 1 51 22 12 11 3 7 8 3 17 59 40 49 60 8 119 8 19 106 10 9 35 22 108 50 Mechanical Engineering 16 62 13 83 9 22 7 0 99 17 34 3 26 21 30 5 56 41 66 57 149 26 84 33 65 33 17 13 93 79 126 51 Microbiology 16 40 7 74 20 8 1 0 44 15 43 5 4 8 40 7 90 12 15 68 41 146 51 58 19 13 6 7 28 23 94 52 Music 22 14 9 27 7 10 170 0 8 8 1 0 8 15 0 2 2 5 1 7 5 3 5 7 0 1 0 3 0 2 60 53 Nutrition 39 35 5 65 25 15 6 0 49 18 37 16 12 15 119 75 47 12 16 55 34 121 28 31 13 17 8 9 22 16 102 54 Philosophy 43 9 2 13 3 8 0 8 10 2 22 4 1 4 6 15 2 0 1 12 10 1 8 3 1 2 1 2 4 16 38 55 Physics 13 14 4 28 6 4 0 0 17 5 8 0 3 4 4 8 6 18 3 13 16 8 24 0 4 20 3 0 10 14 39 56 Political Science 188 48 3 14 2 3 0 5 25 17 49 39 11 18 9 43 8 4 11 39 23 3 26 9 9 4 10 19 11 9 80 57 Public Health 128 33 5 41 14 33 2 4 58 75 106 19 27 18 207 119 32 8 30 56 39 55 48 30 8 9 21 34 12 19 116 58 Psychology 107 14 4 31 14 24 0 1 26 12 22 8 7 12 33 107 4 2 6 20 13 13 16 2 1 3 10 23 6 5 57 59 Recreation, Parks & Tourism Admin. 137 73 12 50 18 26 3 5 46 22 198 57 37 42 24 65 77 7 12 160 111 4 46 69 15 9 47 101 10 37 115 60 Sociology 168 45 1 23 7 17 1 4 39 17 51 23 11 13 15 95 15 8 18 48 40 5 32 14 14 2 16 25 13 16 66 61 Software Engineering 24 51 3 76 14 34 7 2 95 44 70 15 29 18 10 28 51 72 242 84 145 57 162 36 53 57 26 37 96 99 154 62 Spanish 322 44 19 78 42 42 12 70 46 155 110 49 32 59 19 62 5 3 29 39 49 4 28 4 9 0 7 27 4 9 132 63 Statistics 2 25 3 30 2 1 2 0 28 9 4 0 6 5 0 1 6 24 26 26 48 0 110 4 4 41 9 6 26 22 50 64 Theatre Arts 22 18 9 18 3 5 16 1 26 11 4 2 17 24 4 5 11 2 5 15 21 5 9 9 2 0 3 8 2 11 43 65 Wine and Viticulture 40 66 2 49 15 6 1 3 36 52 72 66 16 16 14 11 84 5 11 146 55 61 31 93 19 5 8 46 10 35 101 66 Accounting 2 2 8 0 0 0 0 0 1 1 2 37 2 8 0 0 2 0 0 8 6 1 0 1 1 0 0 1 4 3 11 67 Consumer Packaging 1 6 3 3 0 2 0 0 3 2 10 4 5 2 3 1 11 1 0 9 11 3 7 3 0 1 1 2 3 40 15 68 Entrepreneurship 10 20 2 12 0 1 0 0 7 1 12 23 6 4 0 7 6 0 6 18 16 2 3 6 1 0 14 11 5 25 16 69 Ethics, Law and Social Justice 85 8 1 8 0 1 0 3 11 2 11 12 5 5 4 20 0 2 0 10 15 4 9 1 1 1 0 1 5 6 34 70 Financial Management 12 16 6 5 0 1 0 1 14 7 20 102 1 7 1 3 11 3 13 52 22 6 14 10 2 6 1 7 5 16 32 71 Global Citizenship & Social Sustain. 205 14 12 20 12 9 0 5 20 24 168 40 17 30 4 47 12 1 8 27 45 1 10 9 17 0 6 28 5 16 50 72 Health and Society 156 8 14 37 23 20 0 2 21 18 154 13 16 17 55 89 17 2 7 29 41 8 7 11 10 3 7 20 9 18 43 73 Industrial Technology 4 26 6 8 0 4 2 0 8 2 21 21 7 6 3 4 22 0 2 30 38 2 4 19 0 0 7 16 9 65 27 74 Information Systems 2 12 0 3 0 3 1 0 5 2 11 8 3 1 0 1 7 1 10 20 20 0 6 7 2 0 4 11 6 8 12 75 Management and Human Resources 5 22 0 8 0 6 7 0 7 2 28 12 0 1 0 5 7 0 0 23 23 1 3 11 0 1 11 21 2 25 14 76 Marketing Management 3 14 2 6 0 2 0 0 3 0 3 2 5 5 0 3 6 3 3 26 8 0 6 3 0 0 3 2 5 9 12 77 Packaging Technology 0 10 4 2 0 2 0 0 2 0 3 4 4 5 2 0 20 0 0 13 12 3 3 3 0 0 1 0 4 39 15 78 Quantitative Analysis 4 23 0 20 0 1 1 0 21 4 5 12 1 3 1 1 4 35 18 31 26 0 73 2 3 46 3 2 13 10 41 79 Real Estate Finance 8 9 2 4 0 0 0 1 10 2 27 28 1 2 1 1 8 2 3 17 16 2 9 11 5 1 2 8 2 6 14 80 Science, Technology and Society 107 5 15 27 22 11 0 6 10 20 188 17 25 20 12 30 10 2 16 20 41 0 4 8 24 1 15 22 9 43 36 81 Visual Media and Cultural Studies 141 25 7 29 10 5 16 10 19 22 11 3 24 25 0 12 8 4 9 24 28 0 18 9 2 0 3 2 3 8 53 82 Bioinformatics 0 12 1 23 5 2 2 0 16 8 4 0 1 2 2 1 6 1 11 12 27 41 22 5 1 2 4 5 10 14 16 83 Data Science 0 11 0 12 0 4 2 0 13 7 5 0 4 1 0 1 5 12 19 14 30 0 42 5 2 18 5 7 14 11 21 84 Heavy Civil 2 5 0 6 0 0 1 0 40 0 14 3 3 5 0 0 8 0 2 12 55 0 7 16 10 0 0 9 12 7 19
References
- \bibcommenthead
- Statista [2023] Statista: College enrollment in the United States from 1965 to 2022 and projections up to 2031 for public and private colleges (in millions). Accessed 10 November 2024 from www.statista.com/statistics/183995/us-college-enrollment-and-projections-in-public-and-private-institutions (2023)
- MyMajors [n.d.] MyMajors: List of College Majors. Accessed 20 August 2024 from www.mymajors.com/college-majors (n.d.)
- Bryant [2023] Bryant, J.: How Many Colleges Are in the U.S.? Accessed 20 August 2024 from www.bestcolleges.com/blog/how-many-colleges-in-us (2023)
- Statista [2023] Statista: Expenditure on higher education as a share of GDP in selected countries worldwide in 2020, by source of funding. Accessed 20 August 2024 from www.statista.com/statistics/707557/higher-education-spending-share-gdp (2023)
- National Center for Education Statistics [2023] National Center for Education Statistics: Education Expenditures by Country. Accessed 10 November 2024 from nces.ed.gov/programs/coe/indicator/cmd/education-expenditures-by-country (2023)
- Welding [2024] Welding, L.: More Than Half of College Students Experience Doubt About Their Choice of Major. Accessed 10 November 2024 from www.bestcolleges.com/research/college-students-doubt-major-choice-survey (2024)
- Stolzenberg et al. [2019] Stolzenberg, E.B., Eagan, M.K., Aragon, M.C., Cesar-Davis, N.M., Jacobo, S., Couch, V., Rios-Aguilar, C.: The American freshman: National norms fall 2019. Higher Education Research Institute, UCLA (2019)
- Biggers et al. [2008] Biggers, M., Brauer, A., Yilmaz, T.: Student perceptions of computer science: A retention study comparing graduating seniors with CS leavers. SIGCSE Bulletin 40(1), 402–406 (2008)
- Buber [2022] Buber, S.: The Most Regretted and Most Loved College Majors. Accessed 20 August 2024 from www.ziprecruiter.com/blog/regret-free-college-majors (2022)
- Harackiewicz et al. [2016] Harackiewicz, J.M., Smith, J.L., Priniski, S.J.: Interest matters: The importance of promoting interest in education. Policy insights from the behavioral and brain sciences 3(2), 220–227 (2016)
- Hatzakis et al. [2007] Hatzakis, T., Lycett, M., Serrano, A.: A programme management approach for ensuring curriculum coherence in is (higher) education. European Journal of Information Systems 16(5), 643–657 (2007)
- Tang [2024] Tang, C.S.: Diversity, equity, and inclusion: decision science research opportunities. Decision Sciences 55(1), 7–16 (2024)
- Permanasari et al. [2020] Permanasari, A.E., Wisaksono, M., Kusumawardani, S.S.: A multi criteria decision making to support major selection of senior high school. International Journal of Information Technology and Electrical Engineering 3(4), 128–132 (2020)
- Khasanah et al. [2015] Khasanah, F.N., Permanasari, A.E., Suning Kusumawardani, S.: Fuzzy MADM for major selection at senior high school. In: 2nd International Conference on Information Technology, Computer, and Electrical Engineering (ICITACEE), pp. 41–45 (2015). IEEE
- Conejero et al. [2021] Conejero, J.M., Preciado, J.C., Prieto, A.E., Bas, M., Bolós, V.J.: Applying data driven decision making to rank vocational and educational training programs with topsis. Decision Support Systems 142, 113470 (2021)
- Ayman Al Ahmar [2012] Ayman Al Ahmar, M.: A prototype rule-based expert system with an object-oriented database for university undergraduate major selection. International Journal of Applied Information Systems 4(8), 38–42 (2012)
- Kumar and Kumar [2013] Kumar, A., Kumar, P.: An examination of factors influencing students selection of business majors using TRA framework. Decision Sciences Journal of Innovative Education 11(1), 77–105 (2013)
- Zayed et al. [2022] Zayed, Y., Salman, Y., Hasasneh, A.: A recommendation system for selecting the appropriate undergraduate program at higher education institutions using graduate student data. Applied Sciences 12(24), 12525 (2022)
- Stein et al. [2020] Stein, S.A., M. Weiss, G., Chen, Y., Leeds, D.D.: A college major recommendation system. In: Proceedings of the 14th ACM Conference on Recommender Systems. RecSys ’20, pp. 640–644. Association for Computing Machinery, New York, NY, USA (2020)
- Alghamdi et al. [2019] Alghamdi, S., Alzhrani, N., Algethami, H.: Fuzzy-based recommendation system for university major selection. In: International Joint Conference on Computational Intelligence (IJCCI) (2019)
- Obeid et al. [2018] Obeid, C., Lahoud, I., El Khoury, H., Champin, P.-A.: Ontology-based recommender system in higher education. In: Companion Proceedings of the Web Conference 2018, pp. 1031–1034 (2018)
- Al-Badarenah and Alsakran [2016] Al-Badarenah, A., Alsakran, J.: An automated recommender system for course selection. International Journal of Advanced Computer Science and Applications 7(3), 166–175 (2016)
- Elbadrawy and Karypis [2016] Elbadrawy, A., Karypis, G.: Domain-aware grade prediction and top-n course recommendation. In: Proceedings of the 10th ACM Conference on Recommender Systems, pp. 183–190 (2016)
- Jing and Tang [2017] Jing, X., Tang, J.: Guess you like: course recommendation in MOOCs. In: Proceedings of the International Conference on Web Intelligence, pp. 783–789 (2017)
- Bakhshinategh et al. [2017] Bakhshinategh, B., Spanakis, G., Zaiane, O., ElAtia, S.: A course recommender system based on graduating attributes. In: International Conference on Computer Supported Education, vol. 2, pp. 347–354 (2017)
- Pardos and Jiang [2020] Pardos, Z.A., Jiang, W.: Designing for serendipity in a university course recommendation system. In: Proceedings of the Tenth International Conference on Learning Analytics & Knowledge, pp. 350–359 (2020)
- Müller et al. [2016] Müller, O., Junglas, I., Brocke, J.v., Debortoli, S.: Utilizing big data analytics for information systems research: challenges, promises and guidelines. European Journal of Information Systems 25, 289–302 (2016)
- Abdelrazek et al. [2023] Abdelrazek, A., Eid, Y., Gawish, E., Medhat, W., Hassan, A.: Topic modeling algorithms and applications: A survey. Information Systems 112, 102131 (2023)
- Sharma et al. [2017] Sharma, D., Kumar, B., Chand, S.: A survey on journey of topic modeling techniques from SVD to deep learning. International Journal of Modern Education and Computer Science 9(7), 50 (2017)
- Qiang et al. [2022] Qiang, J., Qian, Z., Li, Y., Yuan, Y., Wu, X.: Short text topic modeling techniques, applications, and performance: A survey. IEEE Transactions on Knowledge & Data Engineering 34(03), 1427–1445 (2022)
- Papadimitriou et al. [1998] Papadimitriou, C.H., Tamaki, H., Raghavan, P., Vempala, S.: Latent semantic indexing: A probabilistic analysis. In: Proceedings of the Seventeenth ACM SIGACT-SIGMOD-SIGART Symposium on Principles of Database Systems, pp. 159–168 (1998)
- Hofmann [1999] Hofmann, T.: Probabilistic latent semantic indexing. In: Proceedings of the 22nd Annual International ACM SIGIR Conference on Research and Development in Information Retrieval, pp. 50–57 (1999)
- Blei et al. [2003] Blei, D.M., Ng, A.Y., Jordan, M.I.: Latent Dirichlet Allocation. Journal of Machine Learning Research 3(Jan), 993–1022 (2003)
- Lee and Seung [2000] Lee, D., Seung, H.S.: Algorithms for non-negative matrix factorization. Advances in neural information processing systems 13, 535–541 (2000)
- Angelov [2020] Angelov, D.: Top2Vec: Distributed Representations of Topics. arXiv 2008.09470 (2020)
- Grootendorst [2022] Grootendorst, M.: BERTopic: Neural topic modeling with a class-based TF-IDF procedure. arXiv 2203.05794 (2022)
- Bianchi et al. [2021] Bianchi, F., Terragni, S., Hovy, D., Nozza, D., Fersini, E.: Cross-lingual Contextualized Topic Models with Zero-shot Learning. arXiv 2004.07737 (2021)
- Devlin et al. [2019] Devlin, J., Chang, M.-W., Lee, K., Toutanova, K.: BERT: Pre-training of Deep Bidirectional Transformers for Language Understanding. arXiv 1810.04805 (2019)
- Zhao et al. [2021] Zhao, H., Phung, D., Huynh, V., Jin, Y., Du, L., Buntine, W.: Topic Modelling Meets Deep Neural Networks: A Survey. arXiv 2103.00498 (2021)
- Basmatkar and Maurya [2022] Basmatkar, P., Maurya, M.: An overview of contextual topic modeling using bidirectional encoder representations from transformers. In: Proceedings of Third International Conference on Communication, Computing and Electronics Systems: ICCCES 2021, pp. 489–504 (2022)
- Lee et al. [2012] Lee, H., Kihm, J., Choo, J., Stasko, J., Park, H.: iVisClustering: An interactive visual document clustering via topic modeling. In: Computer Graphics Forum, vol. 31, pp. 1155–1164 (2012). Wiley Online Library
- Liu et al. [2016] Liu, L., Tang, L., Dong, W., Yao, S., Zhou, W.: An overview of topic modeling and its current applications in bioinformatics. SpringerPlus 5(1), 1–22 (2016)
- Reisenbichler and Reutterer [2019] Reisenbichler, M., Reutterer, T.: Topic modeling in marketing: recent advances and research opportunities. Journal of Business Economics 89(3), 327–356 (2019)
- Rani and Kumar [2021] Rani, S., Kumar, M.: Topic modeling and its applications in materials science and engineering. Materials Today: Proceedings 45, 5591–5596 (2021)
- Egger and Yu [2022] Egger, R., Yu, J.: A topic modeling comparison between LDA, NMF, Top2Vec, and BERTopic to demystify twitter posts. Frontiers in Sociology 7 (2022)
- Rose et al. [2022] Rose, R.L., Puranik, T.G., Mavris, D.N., Rao, A.H.: Application of structural topic modeling to aviation safety data. Reliability Engineering & System Safety 224, 108522 (2022)
- Mishra et al. [2021] Mishra, R.K., Urolagin, S., Jothi, J.A.A., Neogi, A.S., Nawaz, N.: Deep learning-based sentiment analysis and topic modeling on tourism during Covid-19 pandemic. Frontiers in Computer Science 3, 775368 (2021)
- Johnson and Gupta [2012] Johnson, F., Gupta, S.K.: Web content mining techniques: A survey. International Journal of Computer Applications 47(11), 44–50 (2012)
- Tan [1999] Tan, A.-H.: Text mining: The state of the art and the challenges. In: Proceedings of the PAKDD 1999 Workshop on Knowledge Disocovery from Advanced Databases, vol. 8, pp. 65–70 (1999)
- Föll and Thiesse [2021] Föll, P., Thiesse, F.: Exploring information systems curricula: a text mining approach. Business & Information Systems Engineering 63(6), 711–732 (2021)
- Ricci et al. [2022] Ricci, F., Rokach, L., Shapira, B. (eds.): Recommender Systems Handbook, 3rd edn. Springer, ??? (2022)
- Vayansky and Kumar [2020] Vayansky, I., Kumar, S.A.: A review of topic modeling methods. Information Systems 94, 101582 (2020)
- Moreno et al. [2023] Moreno, M.R., Sánchez-Franco, M.J., Tienda, M.D.l.S.R.: Examining transaction-specific satisfaction and trust in airbnb and hotels. an application of BERTopic and zero-shot text classification. Tourism & Management Studies 19(2), 21–37 (2023)
- Uncovska et al. [2023] Uncovska, M., Freitag, B., Meister, S., Fehring, L.: Rating analysis and BERTopic modeling of consumer versus regulated mHealth app reviews in Germany. NPJ Digital Medicine 6(1), 115 (2023)
- Ogunleye et al. [2023] Ogunleye, B., Maswera, T., Hirsch, L., Gaudoin, J., Brunsdon, T.: Comparison of topic modelling approaches in the banking context. Applied Sciences 13(2), 797 (2023)
- Kenton and Toutanova [2019] Kenton, J.D.M.-W.C., Toutanova, L.K.: BERT: Pre-training of Deep Bidirectional Transformers for Language Understanding. In: Proceedings of NAACL-HLT, vol. 1, p. 2 (2019). Minneapolis, Minnesota
- Wolf et al. [2020] Wolf, T., Debut, L., Sanh, V., Chaumond, J., Delangue, C., Moi, A., Cistac, P., Rault, T., Louf, R., Funtowicz, M., et al.: Transformers: State-of-the-art Natural Language Processing. In: Proceedings of the 2020 Conference on Empirical Methods in Natural Language Processing: System Demonstrations, pp. 38–45 (2020)
- Richardson [n.d.] Richardson, L.: Beautiful Soup Documentation. Accessed 20 August 2024 from www.crummy.com/software/BeautifulSoup/bs4/doc (n.d.)
- Bird et al. [2009] Bird, S., Klein, E., Loper, E.: Natural Language Processing with Python. O’Reilly Media, Inc., ??? (2009)
- Pedregosa et al. [2011] Pedregosa, F., Varoquaux, G., Gramfort, A., Michel, V., Thirion, B., Grisel, O., Blondel, M., Prettenhofer, P., Weiss, R., Dubourg, V., Vanderplas, J., Passos, A., Cournapeau, D., Brucher, M., Perrot, M., Duchesnay, E.: Scikit-learn: Machine learning in Python. Journal of Machine Learning Research 12, 2825–2830 (2011)
- Mueller [2009] Mueller, A.C.: Word Cloud Generator in Python. Accessed 20 August 2024 from github.com/amueller/word_cloud (2009)
- Tsai and Brusilovsky [2020] Tsai, C.-H., Brusilovsky, P.: The effects of controllability and explainability in a social recommender system. User Modeling and User-Adapted Interaction 31, 591–627 (2020)
- Tintarev and Masthoff [2015] Tintarev, N., Masthoff, J.: Explaining recommendations: Design and evaluation. In: Recommender Systems Handbook, pp. 353–382. Springer, Boston, MA, USA (2015)
- Li et al. [2023] Li, Y., Chen, H., Xu, S., Ge, Y., Tan, J., Liu, S., Zhang, Y.: Fairness in recommendation: Foundations, methods, and applications. ACM Transactions on Intelligent Systems and Technology 14(5) (2023)
- Pitoura et al. [2022] Pitoura, E., Stefanidis, K., Koutrika, G.: Fairness in rankings and recommendations: an overview. The VLDB Journal 31, 431–458 (2022)
- Deldjoo et al. [2023] Deldjoo, Y., Jannach, D., Bellogin, A., Difonzo, A., Zanzonelli, D.: Fairness in recommender systems: research landscape and future directions. User Modeling and User-Adapted Interaction, 1–50 (2023)
- Ekstrand et al. [2022] Ekstrand, M.D., Das, A., Burke, R., Diaz, F.: Fairness in recommender systems. In: Ricci, F., Rokach, L., Shapira, B. (eds.) Recommender Systems Handbook, pp. 679–707. Springer, New York, NY, USA (2022)
- Chen et al. [2021] Chen, J., Dong, H., Wang, X., Feng, F., Wang, M., He, X.: Bias and Debias in Recommender System: A Survey and Future Directions. arXiv 2010.03240 (2021)
- Jeckmans et al. [2013] Jeckmans, A.J.P., Beye, M., Erkin, Z., Hartel, P., Lagendijk, R.L., Tang, Q.: Privacy in recommender systems. In: Ramzan, N., Zwol, R., Lee, J.-S., Clüver, K., Hua, X.-S. (eds.) Social Media Retrieval, pp. 263–281. Springer, London (2013)
- Wang et al. [2023] Wang, S., Zhang, X., Wang, Y., Liu, H., Ricci, F.: Trustworthy Recommender Systems. arXiv 2208.06265 (2023)