COLOR: A compositional linear operation-based representation of protein sequences for identification of monomer contributions to properties
Abstract
The properties of biological materials like proteins and nucleic acids are largely determined by their primary sequence. While certain segments in the sequence strongly influence specific functions, identifying these segments, or so-called motifs, is challenging due to the complexity of sequential data. While deep learning (DL) models can accurately capture sequence-property relationships, the degree of nonlinearity in these models limits the assessment of monomer contributions to a property - a critical step in identifying key motifs. Recent advances in explainable AI (XAI) offer attention and gradient-based methods for estimating monomeric contributions. However, these methods are primarily applied to classification tasks, such as binding site identification, where they achieve limited accuracy (40–45%) and rely on qualitative evaluations. To address these limitations, we introduce a DL model with interpretable steps, enabling direct tracing of monomeric contributions. We also propose a metric (), inspired by the masking technique in the field of image analysis and natural language processing, for quantitative analysis on datasets mainly containing distinct properties of anti-cancer peptides (ACP), antimicrobial peptides (AMP), and collagen. Our model exhibits 22% higher explainability, pinpoints critical motifs (RRR, RRI, and RSS) that significantly destabilize ACPs, and identifies motifs in AMPs that are 50% more effective in converting non-AMPs to AMPs. These findings highlight the potential of our model in guiding mutation strategies for designing protein-based biomaterials.
keywords:
American Chemical Society, LaTeX1] Department of Mechanical Engineering, Northwestern University, Evanston, Illinois 60208, United States 1] Department of Mechanical Engineering, Northwestern University, Evanston, Illinois 60208, United States \alsoaffiliation[2] Department of Civil and Environmental Engineering, Northwestern University, Evanston, Illinois 60208, United States \abbreviationsIR,NMR,UV
1 Main
Proteins are defined by their amino acid sequences, also known as the primary sequence, which dictates their structure and function 1. Specific residues or segments within the sequence often play pivotal roles in functionality 2, 3, 4, but identifying these critical regions from just the primary sequence remains a challenge as the residue names represent dense chemical information. Numerous studies have explored the relationship between primary sequence and protein function using experimental techniques like X-ray crystallography, solid-state NMR, and Raman spectroscopy 5, 6, 7, 8, 9, 10, as well as computational approaches like Molecular Dynamics (MD) simulations 11, 12, 13, 14. Moreover, MD simulations offer mechanistic insights into the fundamental processes such as the effect of the processing conditions on the mechanical properties 15, 16, 10, transport mechanism of proteins across cell membrane 17, and the mechanism of protein folding 18. Both experimental techniques 19, 20, 21, 22, 23 and MD simulations 24, 25, 26 have been used to investigate the impact of mutations on functionalities like binding affinity and mechanical properties. However, their time-intensive nature limits the ability to exhaustively explore mutations across the sequence, highlighting the need for predictive models that can efficiently estimate the contribution of individual monomers to overall protein function.
Machine learning (ML) models have emerged as a powerful tool for establishing primary sequence-to-property relationships in proteins 27, 28, 29. This remains an active research area, as sequence data is more accessible than structural data. Deep learning (DL) models like AlphaFold2/3 30, 31 predict structures from sequences but often show low confidence for amorphous and fold-switching proteins 32, 33. This limits their reliability for materials with more disordered regions, notably structural proteins such as silks 34. Models like Transformers 35, Long Short-Term Memory (LSTM) networks 36, 37, 38, 39, and 1D convolution Neural Networks (1D CNN) 40, 41, 42 excel at capturing sequential dependencies. These models enable accurate prediction of protein’s secondary structure 43, antimicrobial capability 44, B-factor 45, 46, and mechanical properties 47, often achieving and accuracies over 0.8. Transformers have also enabled pre-trained models like ProtBERT 27, 29, ESM 48, and ProtTXL 29, which differ in training strategies. For example, ProtTXL uses an auto-regressive method, while ProtBERT predicts masked monomers 29. Trained on millions of protein sequences 49, these models capture patterns like sequential relationships 50, 27, and clustering based on protein families and physicochemical properties 50, 29. Their success has driven transfer learning frameworks, leveraging pre-trained model outputs as inputs to neural networks for predicting protein properties 48, 27, 51. Despite advances in sequence-property prediction, DL models lack interpretability due to several non-linear transformations. This limits their ability to dissect monomers’ contribution to the property. Understanding these contributions is essential for identifying critical motifs 52 to design mutations for enhanced protein properties 2, 53. Thus, there is a great need for a model that elucidates monomer-level contributions while establishing sequence-property relationships.
With the growing emphasis on Explainable AI (XAI) and interpretability 54, some progress has been made in understanding monomeric contributions in proteins 55, 56, 52, 57, 58, 59, 60 while handling primary sequence as an input. One widely used XAI approach is based on the self-attention mechanism in transformers, where a monomer’s contribution is determined by the attention it receives from other monomers in the sequence 61. Another popular method is Grad-CAM (Class Activation Mapping) 62, which attributes monomeric contribution to the gradient of the output with respect to the monomer’s latent space representation. While attention and gradient-based methods have made some strides in providing interpretability for protein sequences 55, 56, 52, 57, 58, they come with limitations. The self-attention mechanism has been shown to be unreliable as an XAI tool to identify critical segments in a sequence 63, 64, 65. Similarly, Grad-CAM typically relies on the embeddings from certain Transformer or LSTM-based Large Language Models (LLM) which already have layers of non-linear transformations 3, 66. Furthermore, Grad-CAM has been mostly employed for images and graph-based input data 62, 66. Therefore, there exists a gap for a more interpretable and explainable model that can effectively elucidate the contributions of individual monomers within protein sequences.
Current XAI methods for proteins focus primarily on classification tasks like binding site identification, with limited accuracy (40–45%) in detecting all the sites 3. These approaches have not been extended to continuous properties like melting temperature and are mainly used for qualitative analyses, such as identifying critical regions in the vicinity of high-contributing monomers 57, 58, 52, 3. Additionally, no comprehensive evaluation strategy exists to validate the monomeric contribution scores in proteins. In contrast, image analysis 67, 68, 69, 70 and NLP 71 have advanced in quantifying contribution scores using insertion and deletion techniques, which evaluate the impact by systematically adding or removing input segments based on score rankings. To our knowledge, this approach has not been applied to validate monomeric contributions in protein property prediction. We propose leveraging this method to quantify and validate monomeric contribution scores in proteins.
Building on the above discussion, this work aims to develop a more interpretable model for elucidating monomeric contributions within primary sequences and systematically evaluating the contribution scores generated by the model. As the first step, we develop a novel DL model that establishes a primary sequence-property relationship while enabling the tracing of monomeric contributions from predicted outputs. Our analysis involves: (1) benchmarking the predictive performance of our architecture against state-of-the-art (SOTA) models like Transformers, LSTMs, and 1D CNNs; (2) introducing an insertion/deletion-based parameter inspired by image and NLP techniques to evaluate monomeric contribution scores; and (3) using this metric to compare our model’s performance with attention- and gradient-based XAI methods. We mainly evaluate our model’s performance on diverse datasets, including Anti-Cancer Peptide (ACP) properties 72, protein solubility 73, binding affinity 74, collagen thermal stability 51, and Antimicrobial Peptide (AMP) classification 44. Our results demonstrate the model’s ability to capture monomeric importance across sequences with varying motif sizes and long-range dependencies. Further quantitative analysis reveals that our model exhibits superior explainability for estimating monomeric contribution while maintaining competitive predictive performance. Notably, our model also identifies critical motifs such as RRR, RRI, and RSS that compromise ACP stability, as well as AMP motifs that enhance the likelihood of converting non-AMP sequences to AMP sequences by over 50% compared to SOTA models. These findings lay a foundation for using our interpretable DL model to design protein-based materials with improved properties.
2 Materials and Methods
2.1 Deep-Learning Framework
Protein’s primary sequence is defined by the sequence of amino acids 1, which is typically described by a series of letters representing the chemical structure of 20 common amino acids. However, the primary sequence does not contain any explicit information about the secondary and tertiary structure of the protein which defines the shape of the protein in the 3D space 1. Today, deep learning models such as AlphaFold2/3 30, 31 enable the prediction of protein structures based on their primary sequences. However, AlphaFold2/3 often exhibits low confidence in predicting amorphous structures and fold-switching regions in proteins 32, 33. As a result, primary sequence data is more readily accessible as input compared to structural information for proteins, especially for proteins with more disordered regions. Therefore in the literature, there is a lot of work available on predicting protein properties just based on its primary sequence 27, 28, 29, 51. Furthermore, it has been demonstrated that deep learning (DL) models outperform traditional machine learning (ML) methods, such as ridge regression, support vector machines, and random forests, when training datasets exceed 1,000–2,000 samples due to their over-parameterized architectures 75. However, obtaining even 1,000 high-quality training samples remains a challenge in certain specialized applications 2, 51, 76. Therefore, there is still a gap for an interpretable sample-efficient deep-learning (DL) model that can estimate the contribution of monomers in the primary sequence. Understanding monomeric contributions will enable the identification of critical motifs within sequences, which are vital for maintaining specific functions or enhancing desired properties. Therefore, we have formulated an interpretable DL model for proteins in this work.
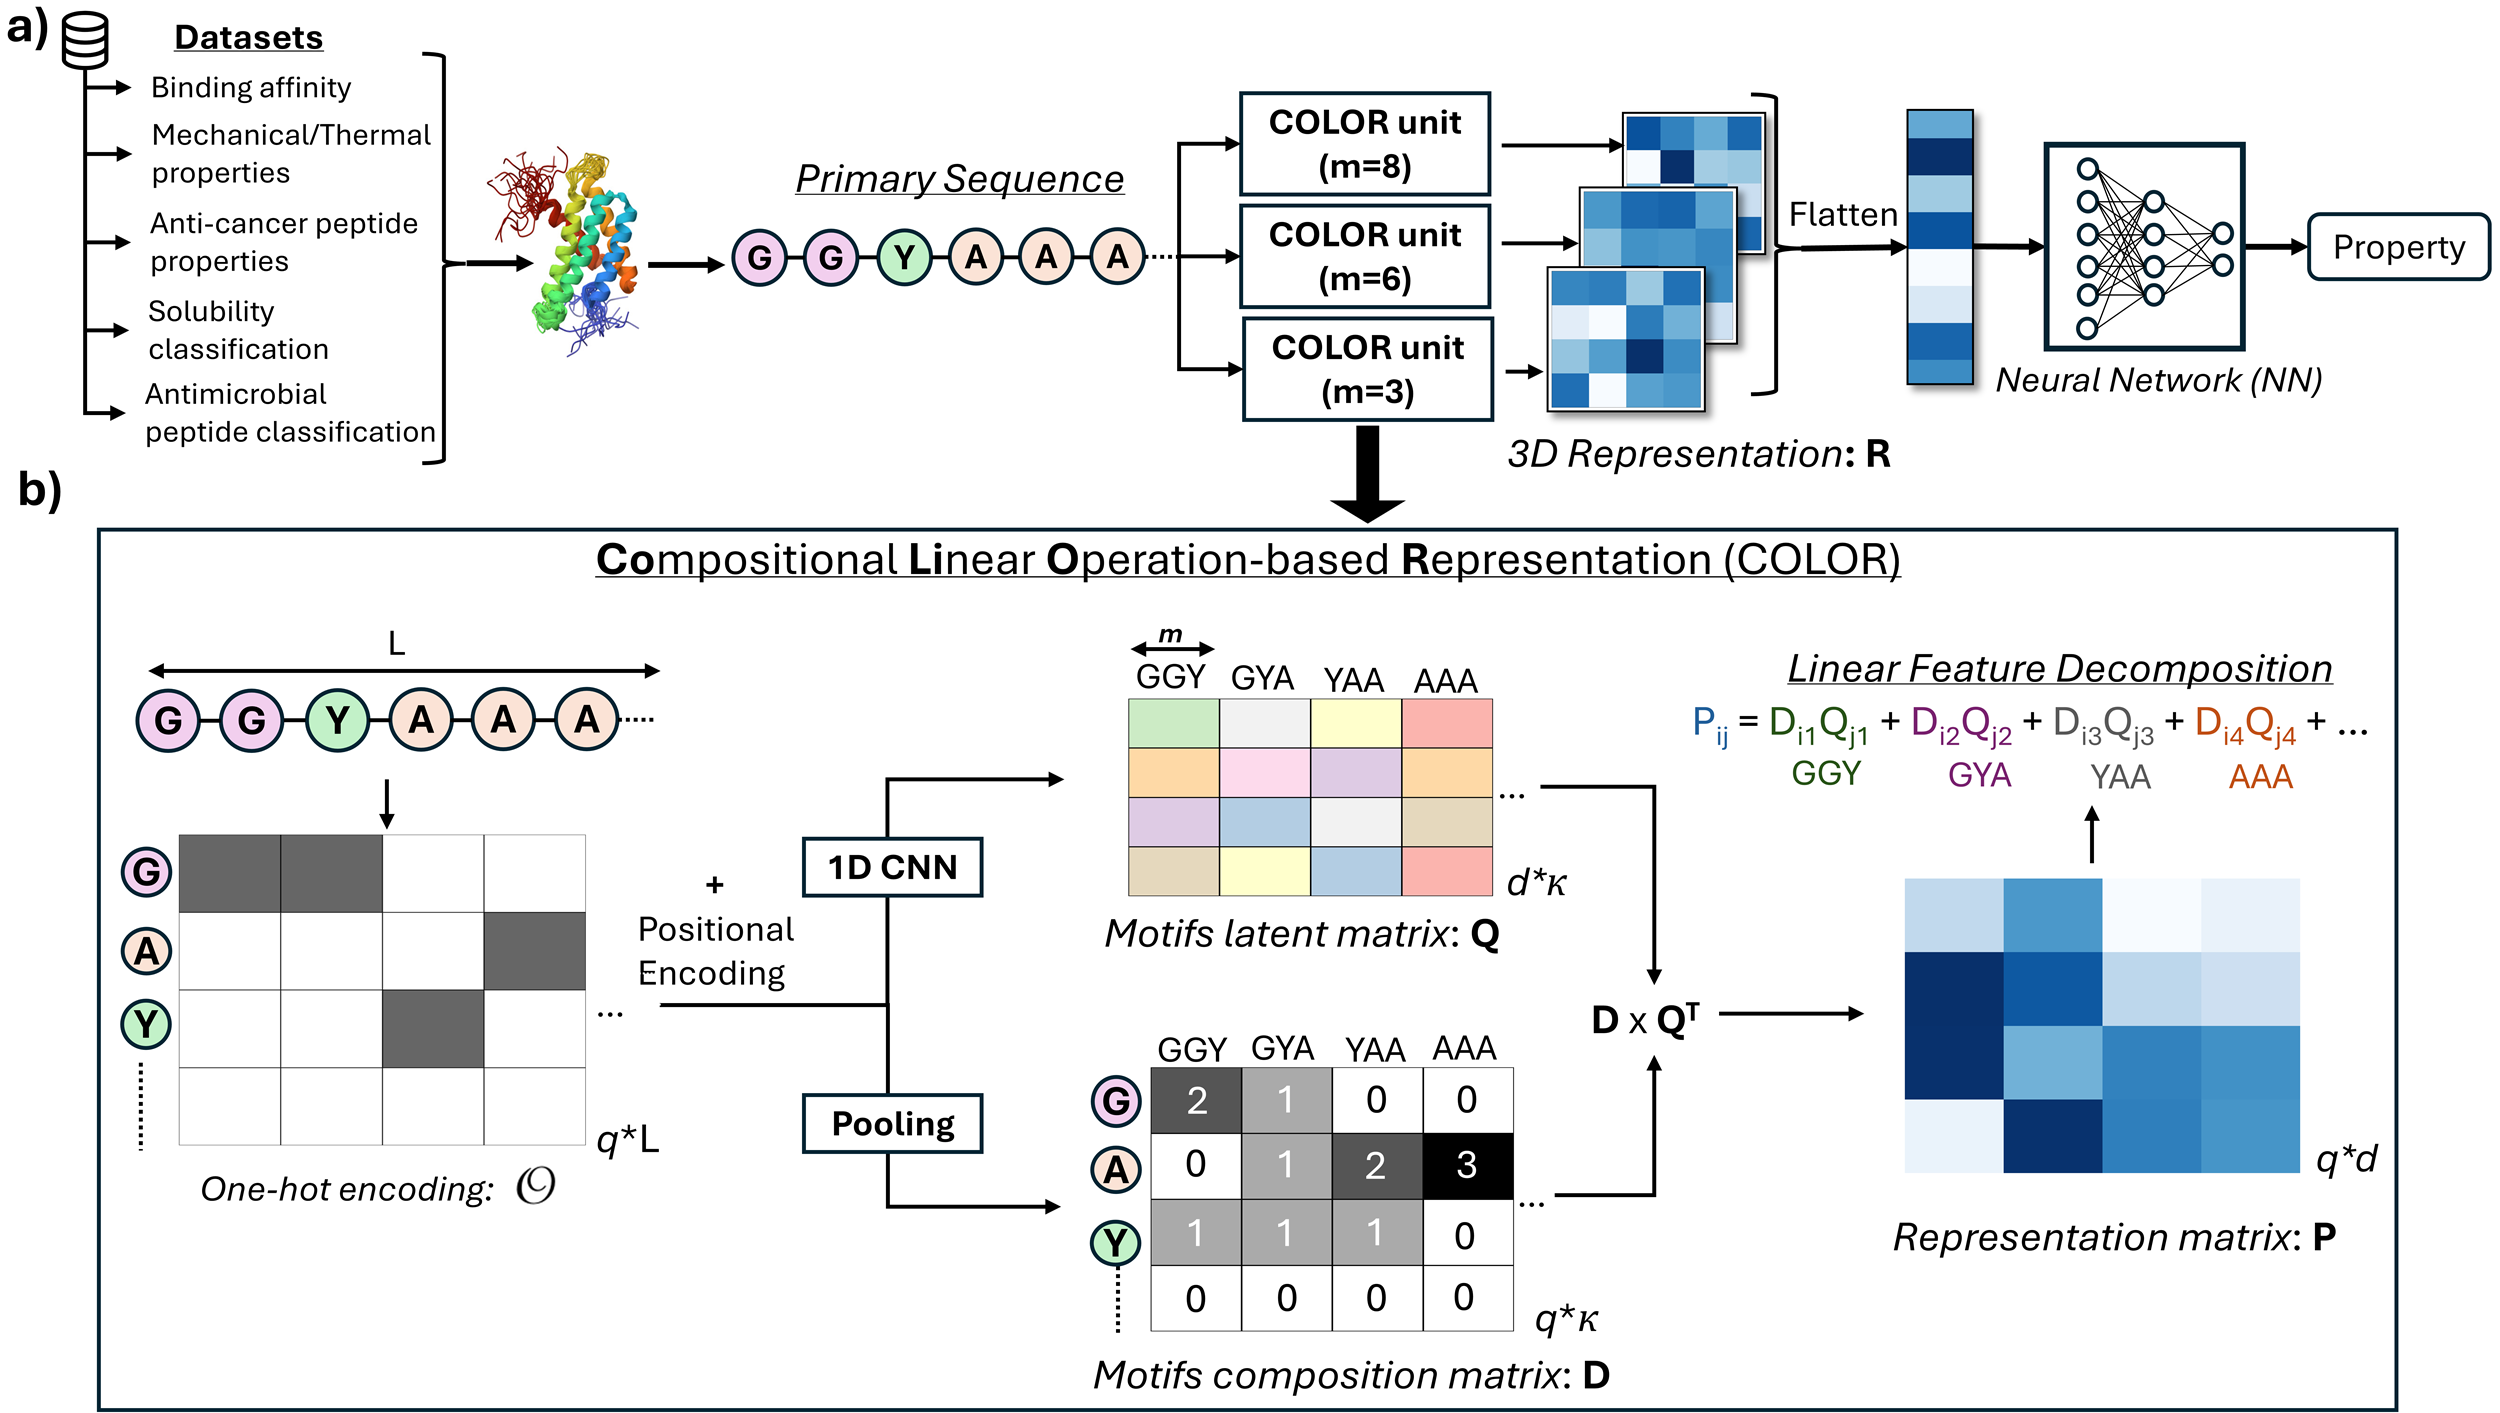
Our DL model uses a Compositional Linear Operation-based Representation (COLOR) unit, a key contribution of the work. A COLOR unit consists of 3 modules namely: sequence-to-motif conversion module, motif composition module, and linear weighted summation module. COLOR unit architecture is shown in Fig.1. Before describing these modules, we introduce the term number of qualitative variables (), representing the total distinct qualitative variables that can appear in the sequence. For proteins, is typically considered to be 21, accounting for the 20 most common amino acids and one additional for uncommon amino acids such as hydroxyproline and hydroxylysine in collagen protein 77. Additionally, the term ”motif” will be used frequently in the model description and, in this context, refers to any sub-segment of the primary sequence.
2.1.1 Sequence-to-Motif Module
This module divides the primary sequence into several motifs using a 1D convolution network (CNN) 40. For example, GGYAAA can be divided into motifs such as GGY, GYA, YAA, and AAA of size 3. The motif size () can be controlled by regulating the filter size in the 1D CNN 78. The filter size controls the number of neighboring amino acids that the 1D CNN considers in front of each monomer for feature extraction. It is important to note that motifs are created by sweeping with a filter of size across the primary sequence with the stride of 1. Therefore, the number of motifs () of size obtained from a primary sequence of length is ().
The 1D CNN uses the one-hot encoded representation of the primary protein sequence as input 79. For example, if the sequence contains the amino acid ’G’ at a specific position, its encoding is represented as [1, 0, 0, …], where the first position in the vector corresponds to ’G’. The one-hot encoding ( ) is the sparse representation of the primary sequence simply capturing the type of qualitative variable at every position in the primary sequence. The 1D CNN divides the primary sequence into motifs and generates a latent space vector of size for each motif as follows:
| (1) |
This step is illustrated in Fig.1 where each column of the matrix Q represents a latent vector for a motif.
2.1.2 Motif Composition Module
In this part of the COLOR unit, the model captures the composition of each motif i.e., it captures the number of different qualitative variables present in each motif. This is obtained by the pooling operation which takes as input and produces motif composition matrix D as follows:
| (2) |
An example of matrix D is shown in Fig.1.
2.1.3 Linear Weighted Summation Module
Till this stage, the model has converted the primary sequence into motifs and has computed latent space (Q ) and composition (D ) matrix. However, to predict the property based on the primary sequence it is important to accumulate the impact of all the motifs. Hence in this module of the COLOR unit, a representation matrix P is obtained by linearly combining the properties of the motifs in the latent space as follows:
| (3) |
Element captures the linear combination of latent property (where, i = 1,2…) of motifs weighted by the number of (where, j = 1,2…) qualitative variable in each motif. It is important to note that the size of the matrix P is independent of the sequence length , unlike other architectures like Transformers, LSTM, and 1D CNNs, where the output size depends on .
2.1.4 Positional Encoding
It is important to note that the linear weighted sum of the property of motifs in the latent space to obtain P does not consider the order of occurrence of motifs in the primary sequence. This can lead to the loss of any sequential information and poor prediction. We apply positional encoding (PE) defined as
| (4) | ||||
to each position (=1,2…L), and add the resulting PE to before inputting it into the 1D CNN, ensuring the retention of sequential information. In Eq.4, for even , assumes on the values {0,2,4,..,}, while takes on the values {1,3,5,..,-1}. It should be noted that sine and cosine functions are used for the even and odd positions along the rows of , respectively. We incorporate positional encoding (PE) from Vaswani et al.35 into COLOR, avoiding the direct use of the numeric position as PE. Using as PE can cause feature scaling issues, particularly for longer sequences (), which can hinder model optimization. Instead, as shown in Eq. 4, PE is embedded as a vector of size , allowing the model to effectively capture and retain relative positional information.
2.1.5 Complete Architecture
In the above sections, we discussed the method to obtain sequence-length independent representation matrix P for a particular motif size using the COLOR unit. However, using P pertaining to just one motif size,, can be insufficient to fully capture the behavior of the protein since motifs of varying size may contribute strongly to a given property. For this reason, we can use several COLOR units to obtain different P based on several motif sizes as shown in Fig.1a with the detailed structure of COLOR unit depicted in Fig.1b. Different P matrix can be assembled into a 3D representation matrix R . Subsequently R is flattened and fed into a neural network (NN) to make the property prediction. The cardinality of the set , representing the number of COLOR units in R , is denoted as . It is important to consider that increasing increases the model’s trainable parameters, so this should be scaled appropriately with the available training data to prevent overfitting. The process to select and the values of will be discussed later in Sec.Hyperparameter Selection. As a note, we would like to highlight that whenever the term ’COLOR method’ is used in the text, it refers to the DL model based on COLOR units.
2.1.6 Quantifying Predictability
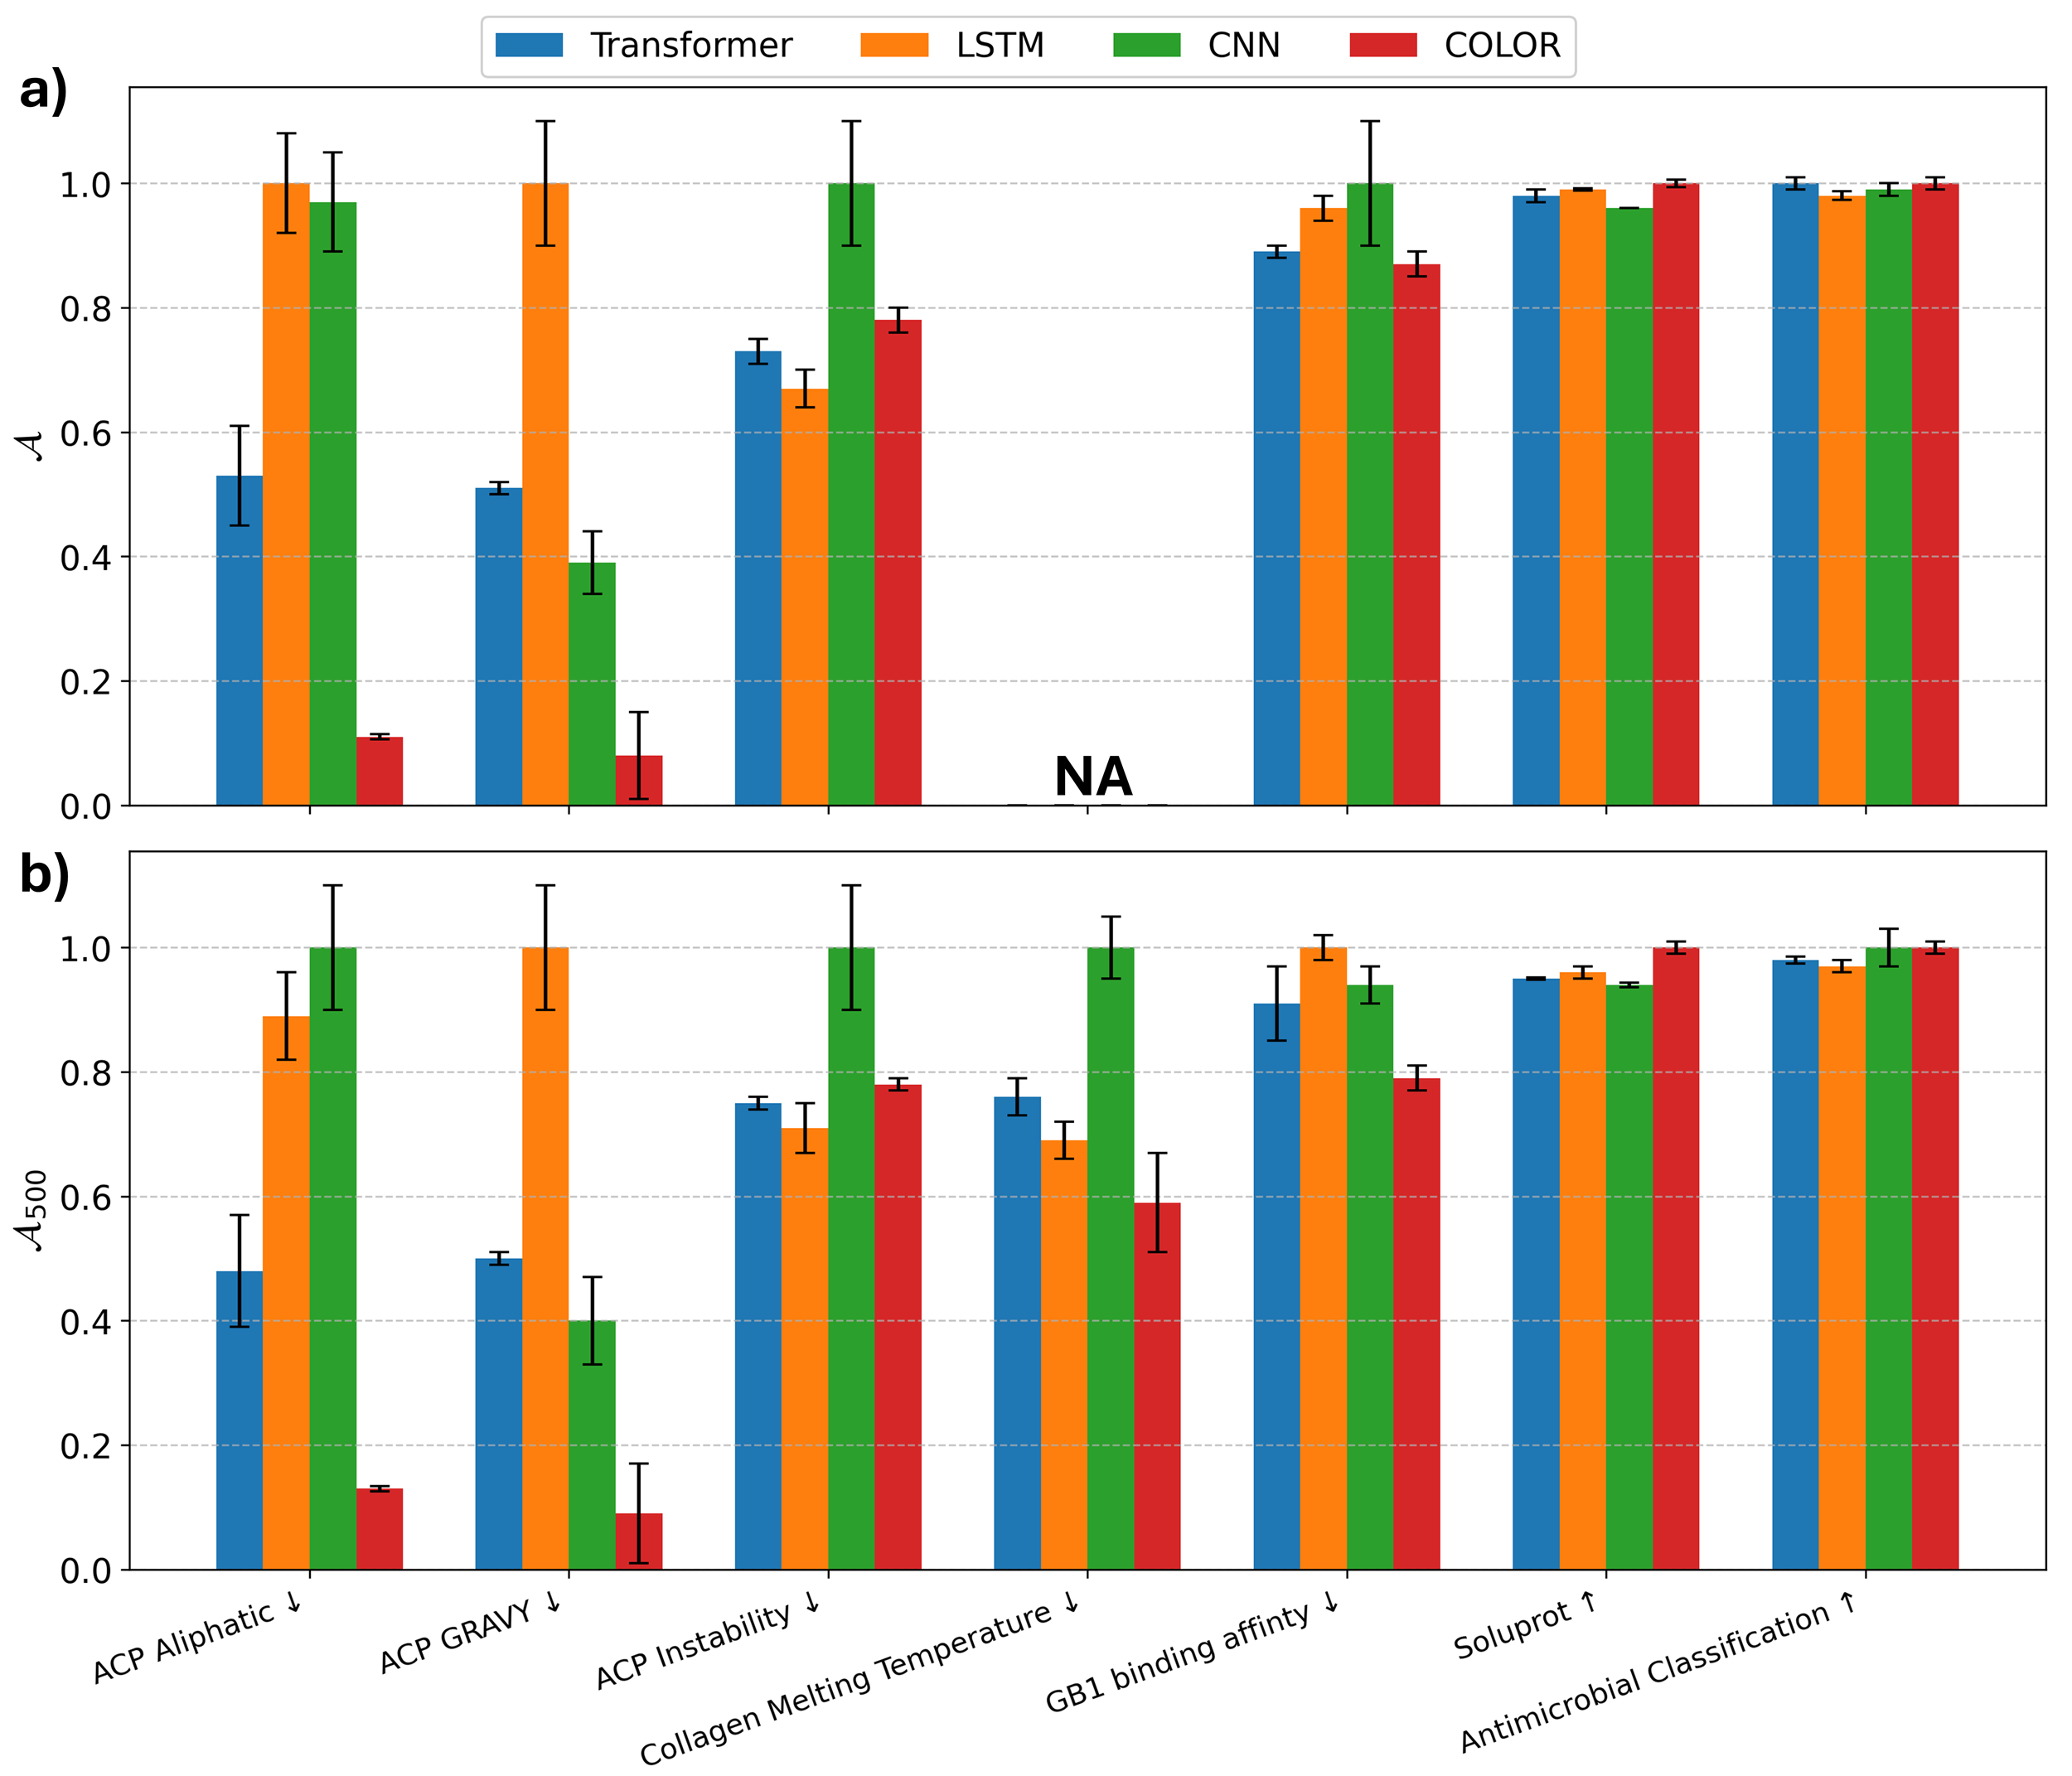
To quantify the predictive performance of the proposed deep learning model, we adopt an approach inspired by Bornschein et al. 80, where the error is plotted as a function of the training dataset size (). The area under this curve is then utilized as the metric to evaluate the model’s predictive capability. Specifically, we consider two distinct areas under the curve to analyze the model’s performance across different data regimes. The first metric, , computed as
| (5) |
quantifies the predictive performance across all training data regimes. In the equation, represents the mean absolute error (MAE) for regression tasks and accuracy for classification tasks. The second metric, , computed as
| (6) |
focuses on the model’s predictive ability in the low-data regime. For regression tasks, lower values of and indicate superior model performance. However, for classification tasks, higher values correspond to better model effectiveness.
2.2 Monomeric Contribution Calculation Method
Studying the contribution of monomers in the primary sequence can help estimate the segments/motifs responsible for modulating properties within proteins. However, estimating monomeric contribution is not straightforward for DL models due to the added layers of non-linearity applied to the primary sequence during property prediction. The added non-linearity makes it nearly impossible to trace the impact of each position on the property. Thus, there is a need for interpretable DL models to address this challenge effectively, and COLOR offers the interpretability necessary to estimate monomeric contribution. Therefore, in this section, we develop steps to estimate the monomeric contribution scores based on the COLOR unit. We show how the architectural decisions in the COLOR unit make it possible to trace the impact of positions on the property.
2.2.1 Estimating Monomeric Contribution using COLOR unit
Estimating the monomeric contribution based on COLOR discussed in Sec.Deep-Learning Framework is a two-step process. The first step is estimating the importance of all the features in R . The second step involves propagating the importance of features in R to motifs in matrix Q . The details of both the steps are as follows:
Step 1: Feature Importance
After training the model using the architecture shown in Fig.1, we first estimate the importance of elements in 3D matrix R . However, as discussed in Sec.Complete Architecture, the elements of R are the elements of the different 2D matrices P . Therefore, for simplicity, let us assume that we are estimating the importance of elements in P . For the feature importance study, we use the method called permutation feature algorithm 81. According to this method, to calculate the importance of a feature in P , we do the following:
-
•
First calculate the loss (eo) for the test data with the original set of features using the trained DL model.
-
•
Then freeze all the features as in the original set except . Shuffle among all the test examples. This breaks the relation that the DL model has learned between and the output.
-
•
Use the trained model to estimate the loss (ep) with the shuffled feature.
-
•
Importance of is calculated as 100*(ep - eo)/eo) and is indicated by
The steps outlined above are repeated for all features in P . We are only concerned with the relative importance of all features, all values are divided by the maximum importance value across all features. This scales all the between 0 and 1, with 1 indicating the most important feature.
Step 2: Monomeric Contribution Calculation
The importance of elements in P does not directly translate into the contribution of motifs in the primary sequence. So, in this step, we formulate the method to propagate the importance of features to monomeric contribution. From Eq.3, every element in P can be expanded as
| (7) |
, where every term in the equation corresponds to one motif, with a total of motifs. The greater the magnitude of , the stronger the influence of the motif on the corresponding . Therefore, based on the magnitude of , all the motifs corresponding to can be ranked from 0 to (-1) with indicating their ranks. Given and ranks of different motifs, the contribution score assigned to each motif is calculated as
| (8) |
The non-linearity introduced by the neural network (NN) in the model architecture can lead to noisy latent properties () for motifs, particularly affecting the with smaller magnitudes. Hence, to mitigate the effect of such noise on , we apply min-max scaling of in Eq.8, effectively reducing the contribution of noisy, smaller values to nearly zero. It is important to note that motifs might repeat themselves within a sequence but are treated uniquely, as the 1D CNN in Eq. 1 generates distinct latent space representations for each occurrence in Q . This differentiation is enabled by positional encoding (Eq.4) that is added to to inform the model about the relative position of monomers in the sequence.
In the method discussed above, handling motif sizes ( ) of 5 and 25 is very different. To illustrate, for a primary sequence with length =50, motif sizes () of 5 and 25 yield 46 and 26 motifs, respectively. Consequently, a motif ranked 5th out of 46 should be assigned a higher score than the one ranked 5th out of 26, as the ranking reflects a larger search space for smaller motif sizes. To account for this, we introduce a variable which indicates the number of positions in the primary sequence that have been assigned a contribution score. Using we scale the contribution score as
| (9) |
Once is assigned to different motifs, a contribution score will be associated with every position in the primary sequence.
2.2.2 Quantifying Explainability
Methods such as Grad-CAM and attention tracing have been used to visualize the important regions in proteins 62, 55, 56, 52, 82. However, a systematic evaluation of the monomeric contribution scores () within primary sequences remains unexplored in the field of protein property prediction. In contrast, the fields of natural language processing (NLP) and computer vision have established methodologies to assess contribution scores 67, 83, 84. In these works, authors mask certain important positions (pixels in the case of an image) and re-train the model with the masked input. The model which is efficient in ranking positions (or pixels) based on contribution score, leads to a higher drop in the performance after masking. Masking a position or pixel refers to zeroing out its contribution to the model’s final output.
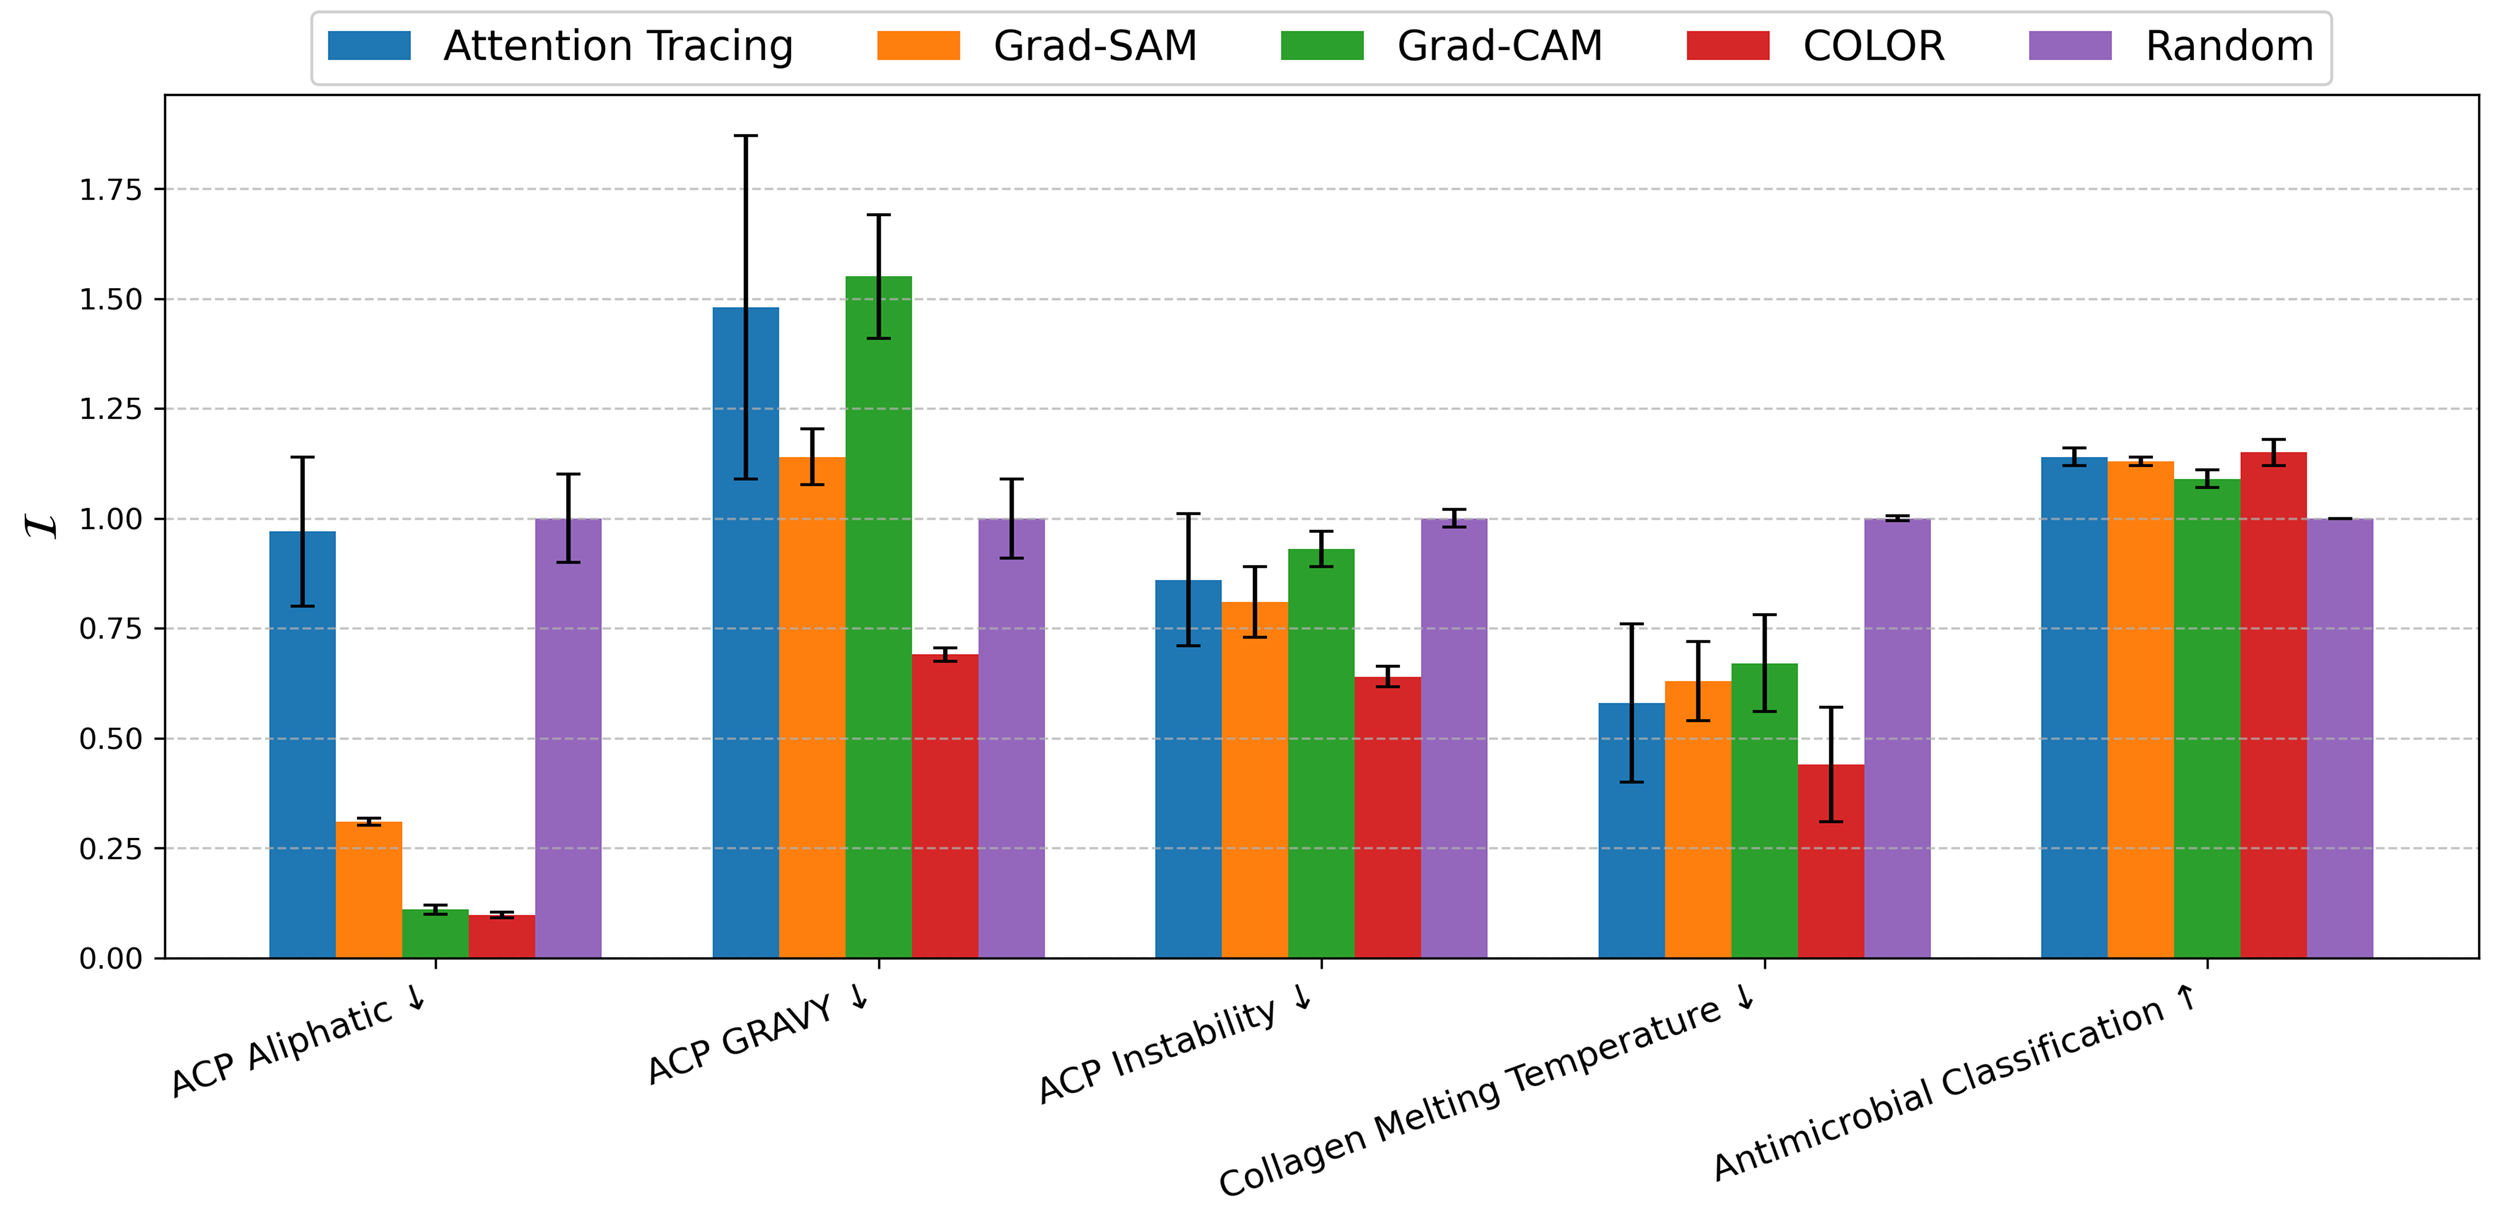
Drawing inspiration from the masking-based method discussed above, we have formulated a similar technique to evaluate the contribution scores. Once the contribution scores are calculated, the monomers in the primary sequence are ranked. Subsequently, all monomers are masked except for the top %, after which the model is re-trained to assess performance. The value of is incrementally increased, and with each step, the model is re-trained, while the error (or accuracy) on the test data is recorded after each retraining. By plotting the error (or accuracy) as a function of the unmasked percentage (%), a curve is generated. The area under this curve, , calculated as
| (10) |
is used as a quantitative metric to evaluate the explainability of the model. The explainability of the COLOR method will be rigorously evaluated against state-of-the-art XAI models, including Grad-CAM 62, Attention Tracing 85, 55, 56, 52, and Grad-SAM 86, with details presented in Sec. Related interpretable models for protein sequences of Supplementary Information.
2.3 Dataset
In the main paper, we present results for 7 unique properties derived from distinct datasets. These datasets include continuous properties analyzed as regression tasks and categorical properties analyzed as classification tasks. The details of all these datasets will follow shortly. We also conduct additional analysis to further demonstrate the robustness of the COLOR method using two toy datasets and a computational silk dataset 76 which are discussed in detail in Sec.Supplementary Datasets in Supplementary Information.
2.3.1 Anti-Cancer Peptide (ACP) Properties
The instability index of the protein captures the intracellular stability of the protein 87. It can hugely vary based on the primary sequence of proteins. Sun et al. 72 have constructed a comprehensive dataset documenting the instability index of several ACPs with ranging between 20-97. In our current work, we utilize this documented instability index for different primary sequences as one of the key datasets. We have also included the Aliphatic 88 and GRAVY 89 index of ACPs documented in the same database 72 as two different datasets for our current study. The aliphatic index of a protein is defined as the proportion of the volume occupied by aliphatic side chains, which include alanine (A), valine (V), isoleucine (I), and leucine (L). The GRAVY index is the sum of the hydropathy value of all the amino acids, divided by the sequence length (). Including the Aliphatic and GRAVY index in the dataset is crucial for conducting monomeric contribution calculation studies, where the primary sequence is masked based on its contribution score, and the properties are re-evaluated as described in Sec. Quantifying Explainability. In the case of these two datasets, re-evaluating the properties is straightforward due to the availability of an analytical formulation.
2.3.2 Collagen Melting Temperature ()
Collagen is one of the most abundant proteins in animals and has numerous applications in the field of medicine 90. Due to its ubiquitous applications, collagen needs to be thermally stable. Yu et al.51 have experimentally gathered the melting temperature of 633 different primary sequences of collagen to investigate their thermal stability. The higher the melting temperature, the greater the stability of collagen.
2.3.3 GB1 binding affinity
Olson et al. 74 developed a dataset containing an experimentally calculated binding affinity of double mutated protein G domain B1 (GB1) to immunoglobulin G fragment crystallizable (IgGFC). This dataset contains the binding affinity of mutated sequences of GB1 protein.
2.3.4 Soluprot
2.3.5 Antimicrobial Peptide (AMP) Classification
AMPs are small molecular peptide that possesses anti-microbial functions against a broad range of microorganisms such as bacteria, fungi, parasites, and viruses. Gupta et al. 44 have curated a dataset of 5200 short peptides, with 2,600 experimentally verified as AMPs, while the remaining sequences are non-AMPs.
The data split for all the datasets mentioned above is given in Tab.1.
| Dataset | Training | Validation | Test | |
|---|---|---|---|---|
|
850 | 150 | 150 | |
|
506 | 63 | 64 | |
|
10000 | 5255 | 5308 | |
| Soluprot | 8336 | 3100 | 3100 | |
|
3200 | 1000 | 1000 |
2.4 Hyperparameter Selection
The current model architecture enables tuning of various hyperparameters, allowing control over the model size and its capability to capture protein behavior, as assessed by metrics and . The size of the latent space vectors in Q can be tuned to be large enough to capture motif properties in the latent space, but not so large as to increase the number of trainable parameters unnecessarily. In the current work, values ranging from 4-20 are selected based on the observed variation of across different values. A parametric analysis of is presented in Sec. Parametric Study. The analysis reveals that is influenced by , with higher generally requiring larger values. Notably, across the datasets mentioned, the model handles values ranging from 4 to 20, as detailed in Supplementary Table 1. One of the important variables for obtaining matrix Q is which controls the size of the motifs as discussed in Sec.Sequence-to-Motif module. The value of should be selected based on the application. For example, Glycine (G) appears at every third position in collagen protein, suggesting motifs of size 3 92; hence choosing to be 3 is a logical choice. In many cases, the exact value of or suitable for a specific application may be unknown. However, a sensitivity analysis can be performed to identify and values that achieve an optimal balance between predictability and explainability, as detailed in Sec.Parametric Study. Based on the above discussion, several factors influence the model’s performance. We provide key guidelines and recommendations in Sec. Strategies for Enhancing Model Performance of Supplemental information to aid in optimizing the architecture.
3 Results and Discussion
3.1 Predictive Capability
To study the predictive capability of the model proposed in Sec.Deep-Learning Framework, we test it on all the datasets discussed in Sec.Dataset and compare the results with the current state-of-the-art (SOTA) models such as Transformers, LSTM, and 1D CNN. We also present additional analysis on two toy datasets and a silk dataset in Sec.Comprehensive Predictive Capability in Supplementary Information. The details of the models used for various datasets are given in Supplementary Tables 1 and 2. We employ the area under the curve metrics, namely and , as introduced in Sec.Quantifying Predictability, to compare the predictive capabilities of various models. The metric is specifically used to evaluate the model’s predictive capability under data-constraint scenarios (smaller training data). The metrics and are derived from the curve of MAE (for regression) or Accuracy (for classification) plotted against the number of training samples. These curves are shown in Supplementary Figure 4. A comparison of models is shown in Fig.2. COLOR outperforms the next best SOTA model by 1-79% across various datasets except for the ACP Instability dataset, where it performs worse by 16%. The lower performance in the case of the instability dataset can be attributed to the lower degree of non-linearity in COLOR as it aggregates the contribution of various motifs through a simple linear operation as shown in Eq.3. However, it will be demonstrated in a later section, that despite the lower predictive performance in the case of the two datasets, the model excels at capturing the monomeric contribution within the primary sequence; emphasizing the higher explainability offered by COLOR.
3.2 How Explainable is the model?
Having shown that our current model has a good predictive capability in the above section, we proceed to show its capability to capture monomeric contribution in the primary sequence as discussed in Sec.Monomeric Contribution Calculation Method. The multiple layers of non-linearity in DL models render them non-interpretable, making it difficult to trace the contribution of each position in the primary sequence to the predicted property. Therefore, it is safe to say that for the model to predict the monomeric contribution, it needs to be interpretable. To that end, we use our method discussed in Sec.Monomeric Contribution Calculation Method to predict the monomeric contribution and quantify it using the metric introduced in Eq.10. The calculation of involves re-training the model after unmasking of the monomers in the sequence. However, re-training is not required for ACP GRAVY and Aliphatic index datasets, as their output can be computed analytically. For this study, we dropped the GB1 binding affinity and Soluprot dataset. We do not consider the GB1 binding affinity dataset for this study as it contains highly similar sequences with only two mutations in the wild-type protein. Additionally, we also drop the Soluprot dataset as it contains noisy labels for the solubility of proteins 73 leading to lower model accuracy as shown in Supplementary Figure 4.
In this study, we use random assignment of the monomeric contribution scores within the primary sequence as one of the baseline methods. This random method provides a baseline against which our method should perform better, indicating that it has learned some meaningful information about the sequence. A comparison of COLOR with other SOTA models along with random baseline is given in Fig.3. The values reported are obtained from the curves shown in Supplementary Figure 5. All results are normalized using the results from the random method. The figure shows that the COLOR method achieves the highest performance, outperforming the next-best method by 1–38% across datasets, with an average gain of 22%. Notably, our approach consistently outperforms random baselines, a result not guaranteed by other SOTA models. The above observations suggest that our method offers more interpretability, making it more effective in estimating the monomeric contribution within the primary sequence. Additional analyses highlighting the explainability of the COLOR are presented in Sec.Comprehensive Explainability in Supplementary Information.
3.3 Parametric Study
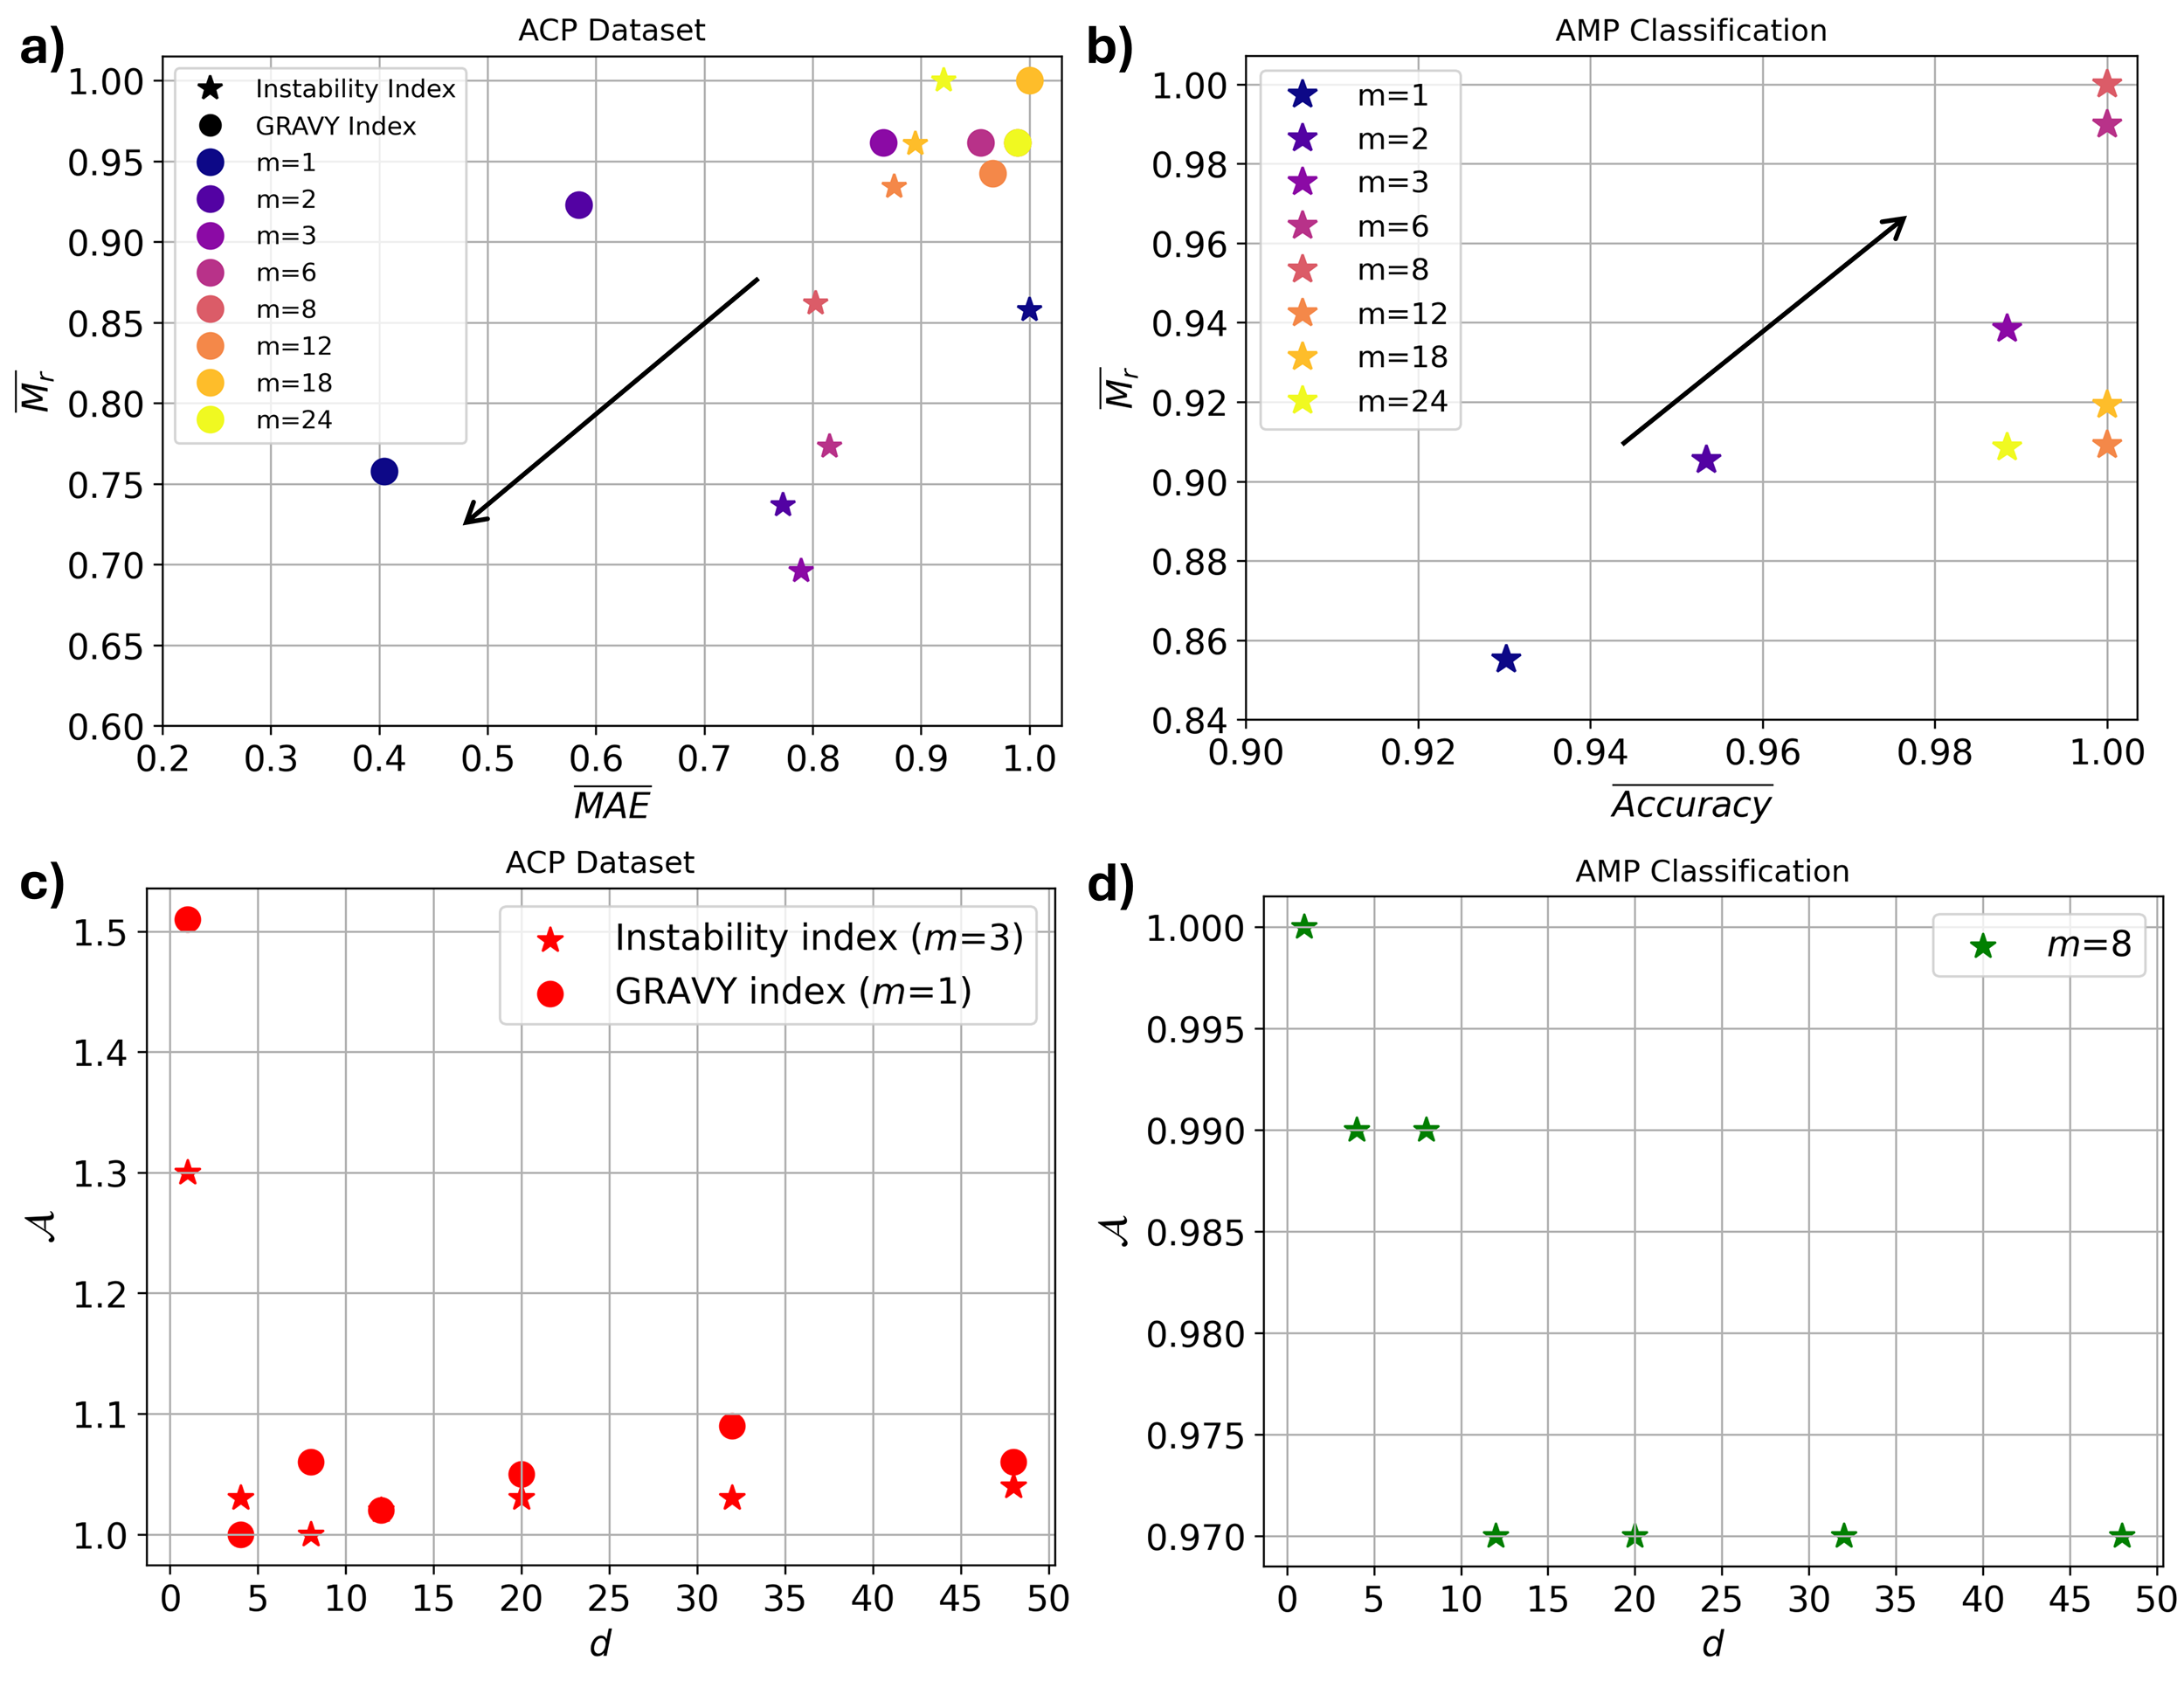
As discussed in Sec.Complete Architecture, the motif size and the dimensionality of the latent space representation for each motif are key parameters that define a COLOR unit. Hence, in this section, we conduct a parametric study to examine the impact of varying and on the model’s predictive performance and explainability. To quantify explainability in the parametric study, we introduce a scaled parameter , defined as
| Predictive performance with only 20% sequence unmasked | (11) | |||
While computing in Eq.11, the monomers within the top 20% based on their contribution scores are unmasked, while the remainder of the sequence is masked. To evaluate predictive performance, we utilize scaled MAE () for regression tasks and scaled accuracy () for classification tasks. The scaling process for MAE and accuracy follows the same approach as outlined in Eq.11. Furthermore, to examine the effect of , we fix to 1 and vary the value of . This approach enables us to isolate the influence of motif size on the performance of COLOR.
In Fig.4a&b, we show the effect of on the model’s predictive performance and explainability. For the parametric study in regression tasks, we selected two properties (Instability index and GRAVY index) from the ACP dataset. The GRAVY index was specifically chosen because is sufficient for accurate prediction, making it an interesting case to explore the impact of increasing on predictive performance. It is evident from Fig.4a&b that explainability drops while using 12 in the case of instability index and AMP classification. This can be attributed to the fact that in the COLOR method, the contribution score is assigned at the motif level as per Eq.8 & 9. This means that while working with larger values, the model can end up assigning a higher contribution score to a larger motif of which only a smaller segment is important and the rest of the motif is insignificant. For the same reason, in the case of the GRAVY Index, which is independent of any interactions between neighboring monomers in the sequence, using any 1 adversely affects explainability as evident from Fig.4a. It can also be noted that in the case of instability index and AMP classification, the model’s predictive capability is lower while using =1. This is because the model does not consider any neighboring monomers while generating matrix Q and linearly combining the effect of various monomers in Eq.3 might not be sufficient to capture the effect of neighboring monomers in the sequence.
There is also a subtle but important difference in the effect of on ACP instability and AMP classification dataset. For the ACP instability dataset, a smaller motif size (36) yields optimal performance, whereas the AMP classification dataset requires a larger motif size (=6 or 8) for better results. This difference can be attributed to the nature of the datasets: the AMP dataset consists of sequences made up of nucleotide bases (A, G, C, and T), where every three nucleotides correspond to a single amino acid. Since amino acids are crucial for protein function, a larger motif size in nucleotide sequence is necessary to capture 2–3 amino acids in each motif, thereby improving both predictive accuracy and explainability.
For a fixed value of , varying can lead to different predictive capabilities. Since determines the size of the vector representing each motif in matrix Q , adjusting it primarily impacts the number of tunable parameters, thus influencing the model’s predictive capability. To study the impact of , we first fix to be 1, 3, and 8 for the GRAVY index, Instability index, and AMP classification datasets respectively based on the results shown in Fig.4 a&b. In Fig.4 c&d, we show the variation of (see Eq.5) for ACP and AMP datasets. From the figure, it can be noted that in the case of the ACP dataset, choosing 4 is a robust choice for better predictive performance. On the other hand, for the AMP dataset, for all values are within 3% of each other. The better performance observed with lower values in the AMP dataset could be attributed to the composition of the sequences, which consist of nucleotides ( = 4), necessitating a lower dimensionality () for effective representation. This study suggests that users may consider setting proportional to .
3.4 Interpretability through the lens of human intuition
3.4.1 Is latent space representation meaningful?
To study whether COLOR learns a meaningful latent representation of motifs in matrix Q , we designed two tasks: in the first, we trained the model to predict the sum of monomeric hydropathy 93; in the second, we trained it to predict the sum of the isoelectric (pI) point 94. The pI point of a monomer is reflective of its charge. As the hyperparameters, we fix and to be 1, indicating that we generate the latent representation for every single monomer rather than motifs. We also replace the neural network shown in Fig.1 by a simple sum of all the elements of P (i.e., yp=). After training, we expect the latent space representation learned for each monomer to converge to its respective hydropathy (in the first task) and pI values (in the second task). When comparing the actual monomeric hydropathy and pI values with their corresponding latent space representations from Q , we achieve an of 1.0, indicating that the model learns meaningful and application-specific representations.
3.4.2 Does the contribution score reflect expected patterns?
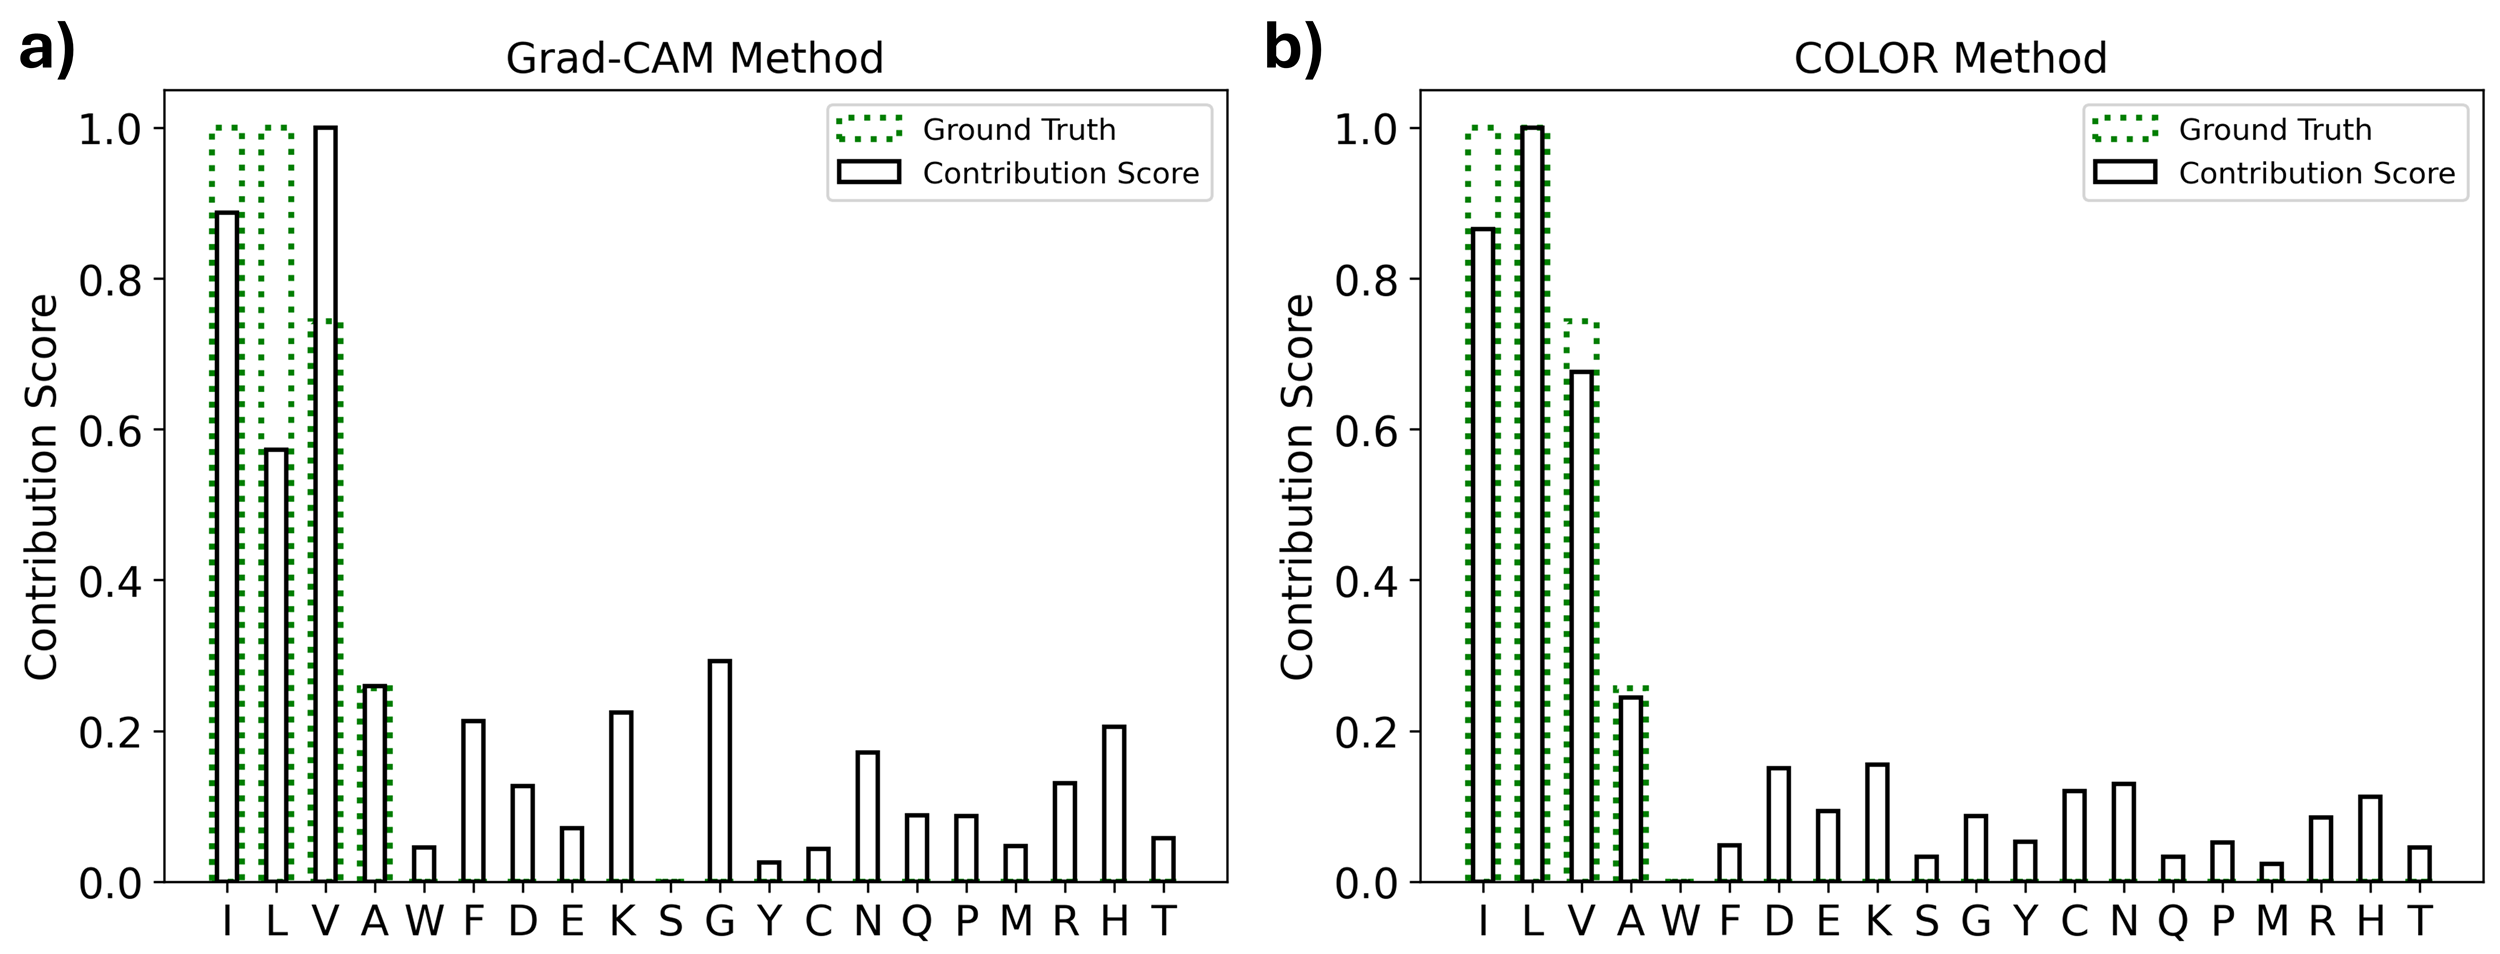
In this section, we study if the contribution score assigned to different amino acids is proportional to their actual contribution to the output . First, we consider the example of ACP aliphatic index prediction. Given a primary sequence, the aliphatic index can be analytically obtained as
| (12) |
, where is the amino acid compositional fraction. According to this equation, amino acids isoleucine (I) and leucine (L) have the highest significance, followed by valine (V) and alanine (A). The mean contribution scores COLOR assigns to every amino acid closely follow the expected trend, as shown in Fig.5b. It should be noted that there are non-zero contribution values for amino acids that are expected to have zero contribution. This arises from the noisy latent vectors learned due to the non-linearity introduced by the neural network in Fig.1. In contrast to the COLOR method, the contribution scores from the Grad-SAM method (refer Fig.5a), although the second-best interpretable approach for this dataset as indicated in Fig.3, exhibit notable deviations from the expected trend, particularly underestimating the contribution of amino acid A. It is noteworthy that both COLOR and the transformer-based model exhibit excellent predictive capabilities, achieving 0.99 in both instances. Consequently, the variation in the contribution scores presented in Fig. 5 can be attributed solely to the explainability of the respective models.
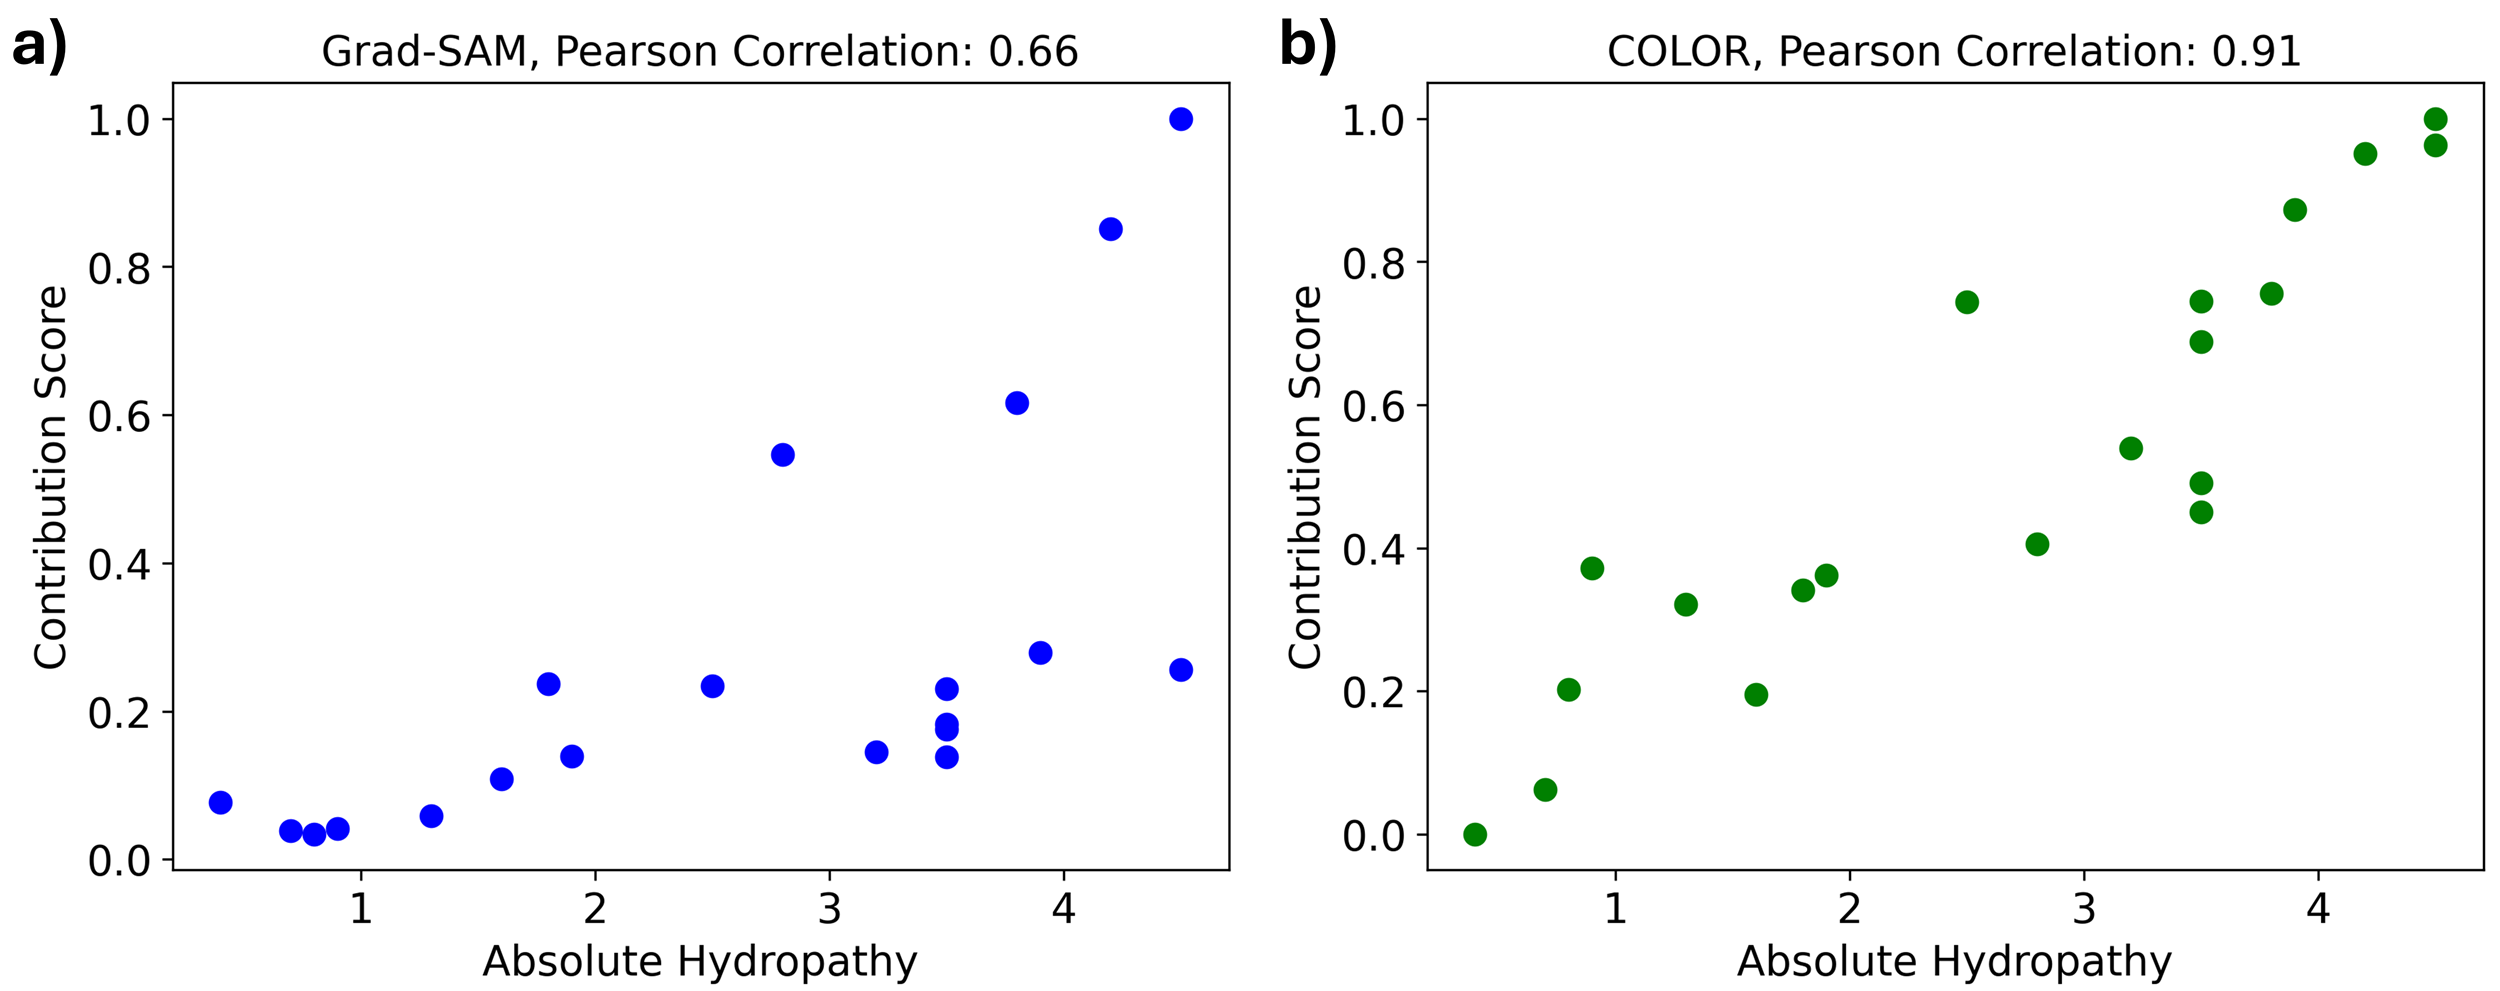
We perform a very similar study with the ACP GRAVY index prediction dataset. Analytically, the GRAVY index is the summation of the hydropathy of all monomers in the primary sequence. Fig.6 shows the comparison between the contribution scores and absolute hydropathy of amino acids, wherein we anticipate a strong correlation between the two variables. In Fig.6a & b, the contribution scores are obtained using Grad-SAM (second best interpretable model) and our method respectively. The contribution scores from COLOR have 35% higher correlation with the absolute hydropathy value, highlighting the effectiveness of our approach in accurately capturing the significance of various amino acids. It is again important to note that both COLOR and the transformer-based model exhibit high predictive capabilities, with 0.99. Therefore, the differences illustrated in Fig. 6 arise from the varying explainability of the two models.
3.5 Application in motif identification
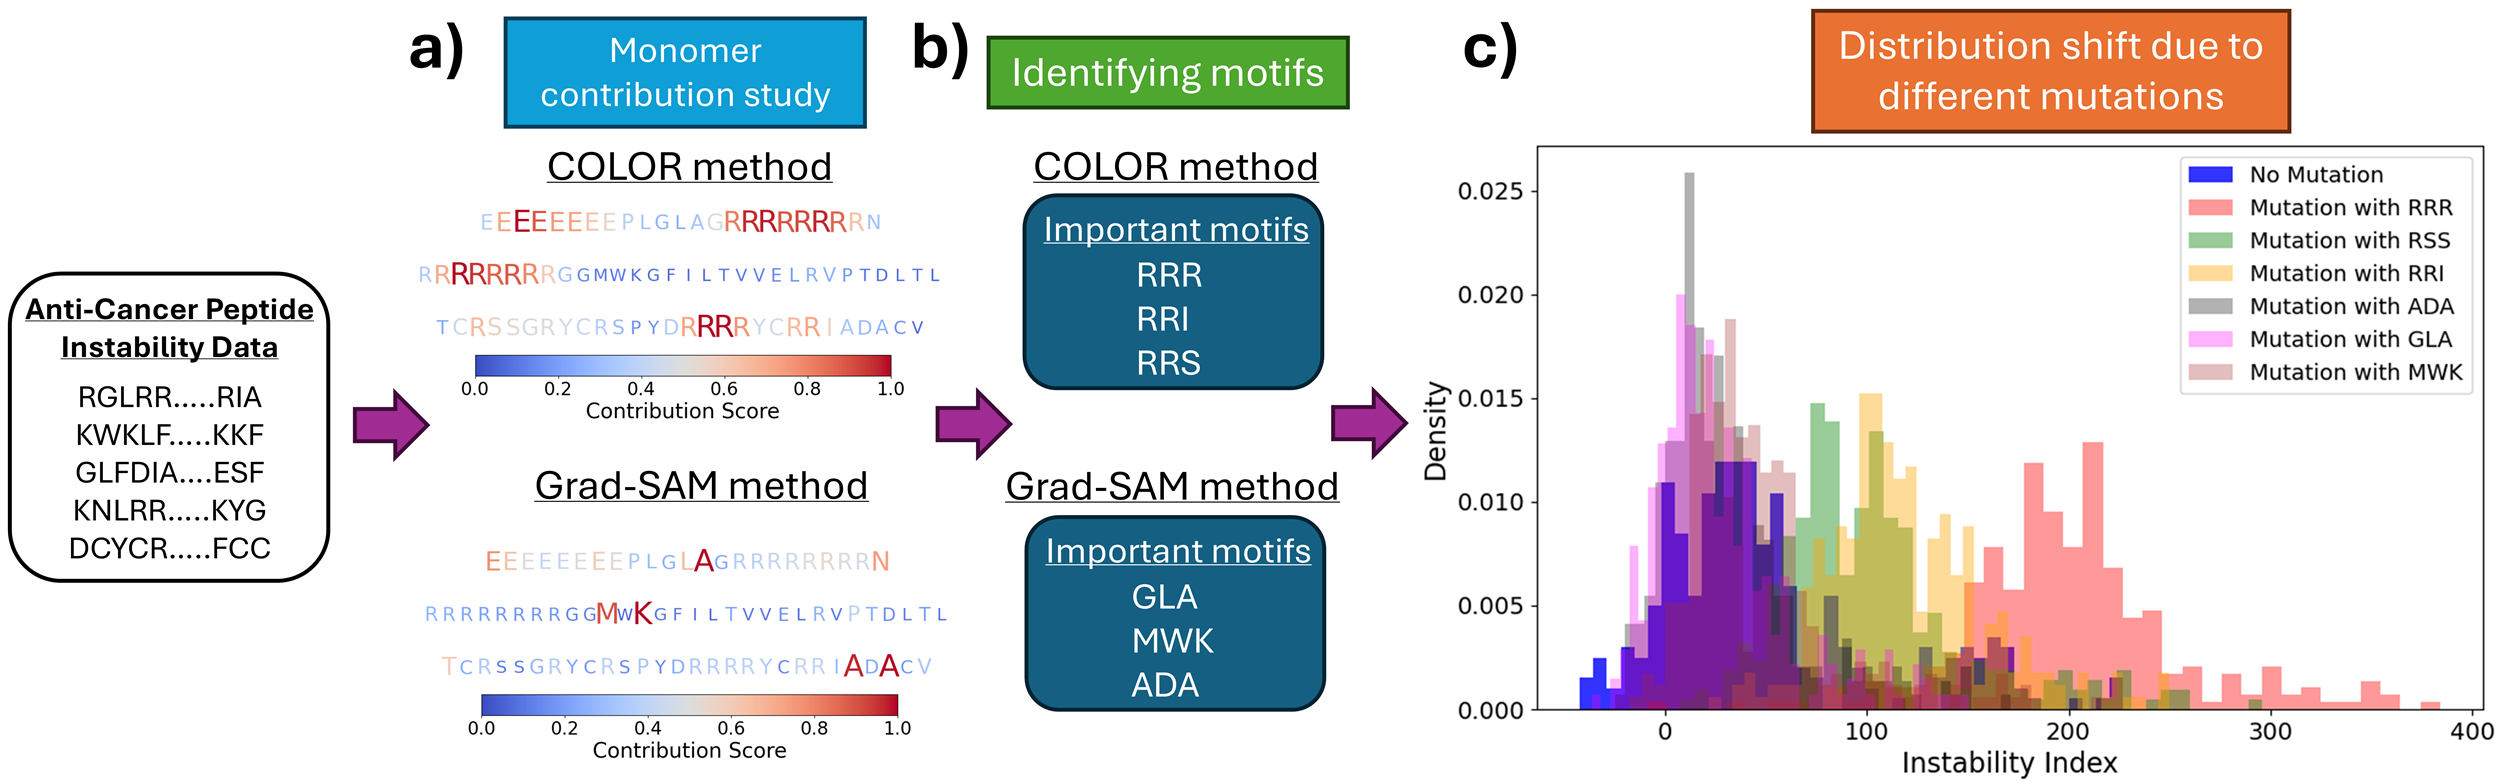
Having quantitatively demonstrated the explainability of COLOR, we now extend its application to motif identification. Given the rise of anti-cancer peptides for cancer therapies, in this section, we identify the motifs responsible for its instability. We first choose the three most unstable peptides from the ACP Instability index dataset and study the monomeric contribution using Grad-SAM and COLOR as shown in Fig.7a. Grad-SAM was chosen as the method for comparison as it is the second-best interpretable method for instability dataset as shown in Fig.3. Subsequently, based on the contribution score, we identify the three most important motifs () in the case of both the methods as shown in Fig.7b. To validate the impact of identified motifs, all the test sequences, , are mutated to at the three most important positions () using . In short, = (, , ), where represents the mutation of at positions using motif . For a fair comparison between the two methods, we conduct multiple scenarios: in half of the scenarios, the mutation positions are determined based on contribution scores from the Grad-SAM method, while in the other half, they are selected using the COLOR method. To further avoid any bias, the instability index of is calculated using both methods. The distribution of the instability index of is shown in Fig.7c in comparison with the distribution of the instability index of . The shift is dominant when mutated with identified using the COLOR method, reinforcing its capability to identify impactful motifs. This study also demonstrates that motifs RRR, RSS, and RRI significantly compromise the stability of ACP.
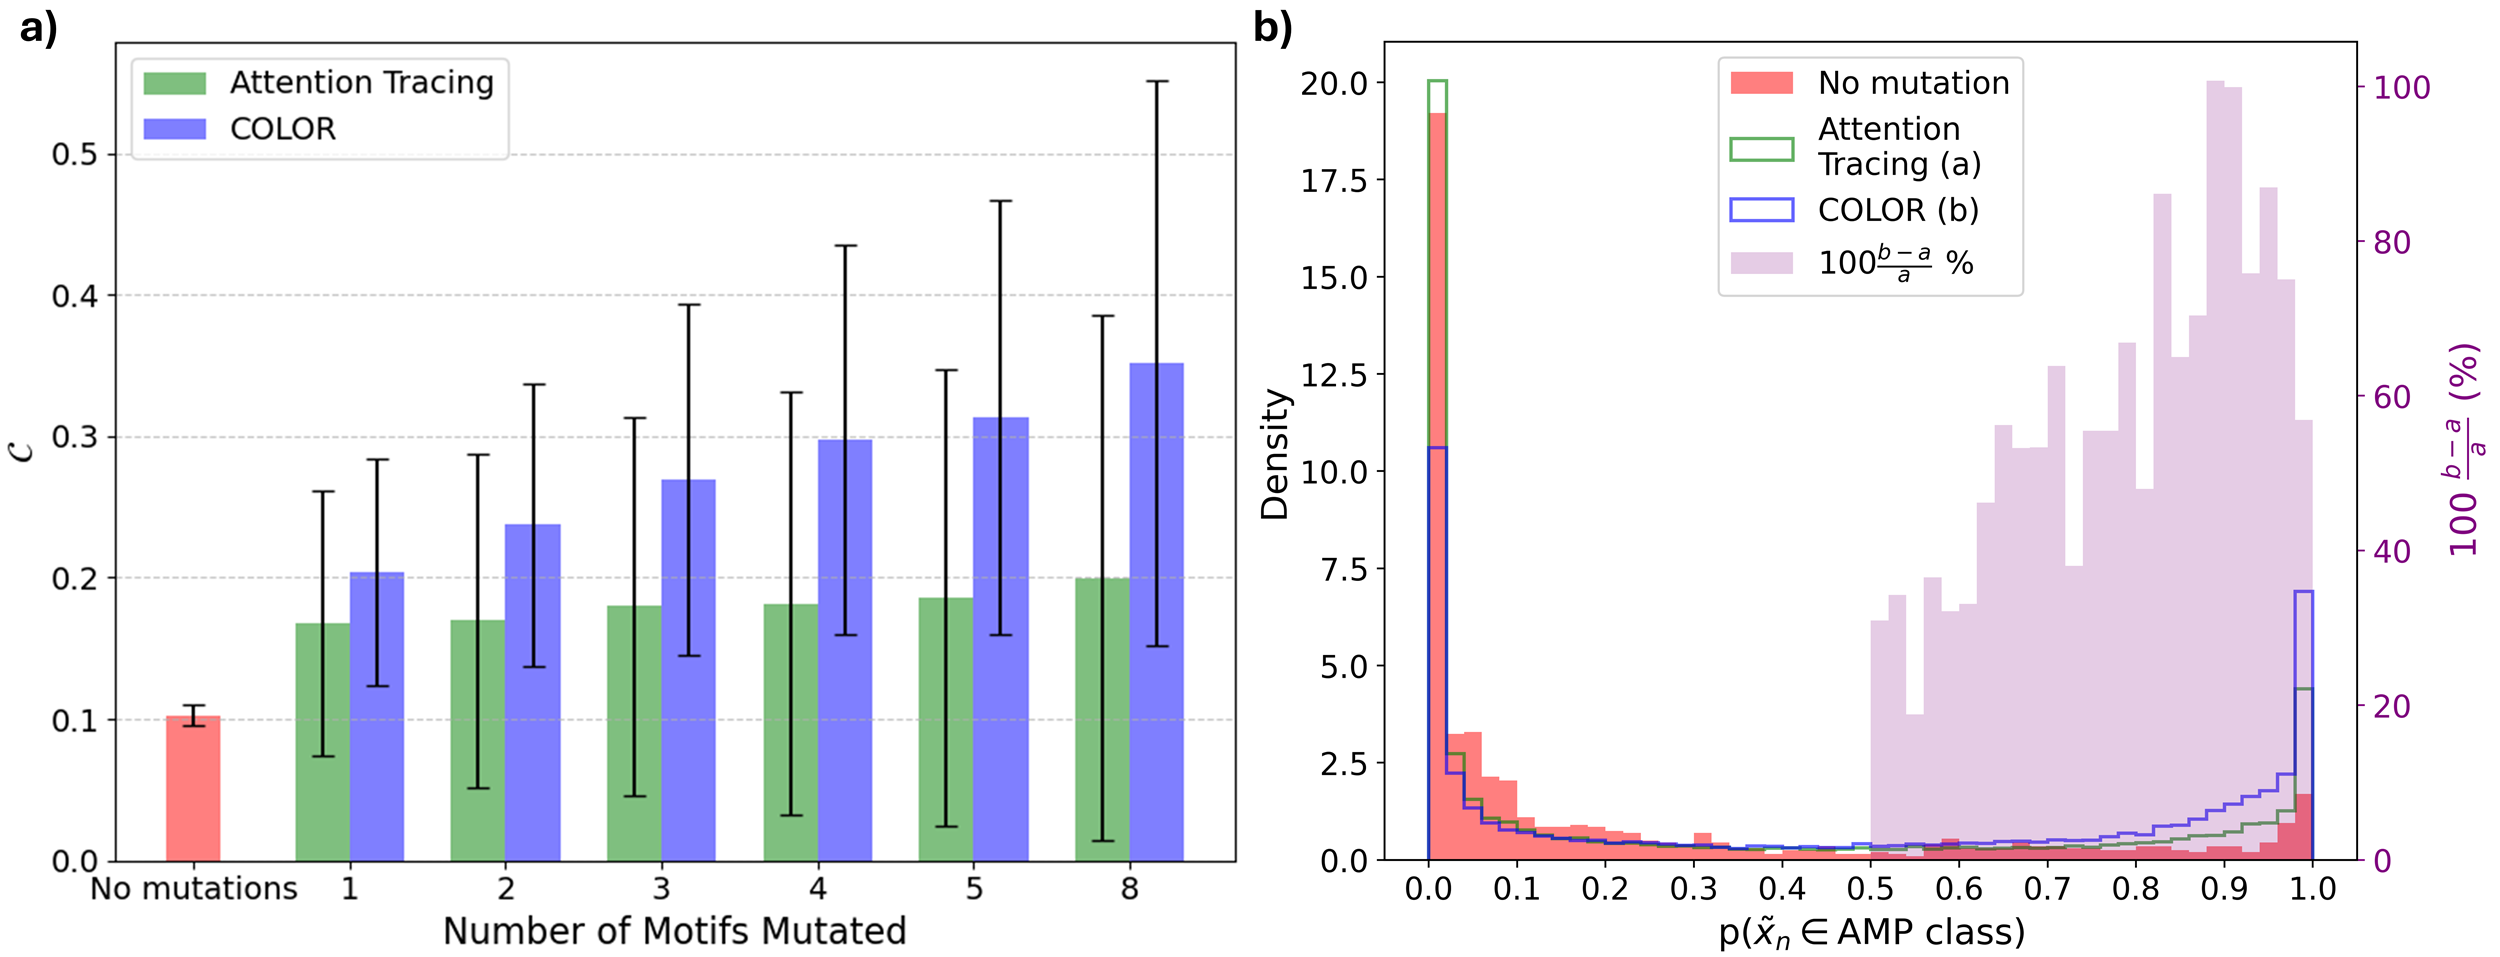
As highlighted in Sec.Dataset, AMPs possess broad-spectrum antimicrobial capabilities making them promising for treating drug-resistant microorganisms 95. Previous studies have utilized generative ML models to design AMPs with better physicochemical properties 44, 96, underscoring the significance of understanding and designing newer AMPs. Therefore, in this study, we aim to identify key motifs in AMP sequences and validate their impact through mutation analyses. We first identify key motifs () in AMP sequences using Attention tracing (second-best explainable model, see Fig.3) and COLOR. To evaluate the impact of identified by the two methods, we first select specific positions () for mutation in non-AMP sequences. Similar to the study with ACPs, we conduct multiple scenarios: in half of the scenarios, the mutation positions are determined based on contribution scores from the attention-tracing method, while in the other half, they are selected using the COLOR method. Subsequently, all the non-AMP sequences in the test data, , are mutated to , where =(, , ). As in the mutation study on ACPs, represents the mutation of position with motif in . It is important to note that for a given , can also be a list for facilitating mutations at multiple positions. Additionally, since is derived from , their cardinality remain the same for a given and , i.e., =. Following the mutations, the probability of a belonging to the AMP class, p(AMP class), is recalculated using both models to eliminate potential bias toward either method. To quantify the impact of mutation(s), we introduce the variable defined as
| (13) |
The term represents the fraction of non-AMP sequences that exhibit a high probability (0.8) of being classified as AMPs following mutation(s).
Fig.8a shows the variation of with respect to the number of mutations introduced in the non-AMP sequences. The higher values observed for motifs identified from AMP sequences using the COLOR method reflect its effectiveness in identifying critical motifs in the sequences. Overall, based on values, COLOR demonstrates a 53% mean improvement in the likelihood of converting a non-AMP sequence into an AMP sequence compared to the attention tracing method. Fig.8b depicts the overall distribution of p(AMP class) calculated for mutated non-AMP sequences after 8 mutations using both the methods, compared with the distribution without any mutations (p(AMP class)). Both methods increase the density in the 0.8-1.0 range; however, the COLOR method demonstrates a higher impact. COLOR method also leads to a substantial decrease in the density in 0-0.1 region. Conversely, the Attention tracing method increases the density in 0-0.1 region, highlighting that certain motifs () identified by the method negatively impact the likelihood of converting a non-AMP sequence into an AMP sequence. Sequences with p(AMP class)0.5 are classified as AMPs. Therefore, we also present the improvement offered by the motifs identified using the COLOR method over the attention tracing method in the p(AMP class)0.5 range. The improvement plot again highlights mean 50% higher likelihood of converting a non-AMP sequence into an AMP when motifs identified by the COLOR method are used for mutations. In Sec.Motif Identification in a Toy Dataset of the Supplementary Information, we further demonstrate COLOR’s enhanced ability to accurately identify motifs in a toy dataset with known critical motifs.
3.6 Conclusion
The primary sequence of a protein, which predominantly determines its functions, is more readily accessible than structural information. Consequently, significant efforts have been devoted to establishing primary sequence-property relationships. Deep learning models have proven to be very powerful as the surrogate to establish primary sequence-property relationships in proteins. However, these models contain layers of non-linear transformation, making them uninterpretable. Lack of interpretability makes it difficult to estimate the contribution of each monomer in the sequence which is crucial for the insights about the critical regions in proteins. With the recent efforts towards Explainable AI (XAI), attention and gradient-based methods have been developed to dissect monomeric contribution in proteins. However, current XAI methods primarily focus on classification tasks, such as identifying binding sites in sequences, with limited exploration of continuous properties like melting temperature or mechanical properties. Additionally, these XAI methods have also been shown to have limitations in correctly identifying the important parts of the sequential input in the literature.
To address the gap for an interpretable model to estimate monomeric contribution, we, rather than improving the existing methods, developed a novel DL model named COLOR in which every step is interpretable to trace back the monomeric contribution from the predicted output. Taking inspiration from the field of NLP and image processing, we also formulated a metric to measure the effectiveness of the model in capturing the monomeric contribution. Firstly, we evaluate the predictive capabilities of COLOR against SOTA models, including transformers, LSTM, and 1D CNN. COLOR demonstrates competitive performance, specifically outperforming these SOTA models on 7 out of 10 datasets in the low training data regime (500), underscoring its superior data efficiency. Subsequently, the rigorous quantitative analysis revealed that COLOR also achieves 22% higher explainability than the other XAI methods applied to protein data. Notably, COLOR achieves enhanced explainability without compromising the predictive capability.
We further extend the capability of COLOR towards identifying critical motifs in the primary sequence. By analyzing the monomeric contribution scores of anti-cancer peptide (ACP) sequences, we demonstrate that COLOR effectively identifies key motifs—RRR, RRI, and RSS—that significantly compromise ACP stability. Extending this analysis to antimicrobial peptides (AMP), we show that the motifs identified by COLOR have a 50% higher chance of converting a non-AMP sequence to an AMP when used for mutation, compared to those identified by an attention-based XAI method. This demonstrates COLOR’s ability to elucidate the role of individual monomers and identify critical motifs in protein sequences. Additionally, COLOR’s monomeric contribution score-driven sequence optimization offers a promising alternative to deep generative models, which typically demand large training data. This capability provides the foundation for monomeric contribution score-driven sequence optimization to accelerate the design of de novo proteins that have great potential to be used for nanomedicine, catalysis, and sustainable protein-based biomaterials.
4 Data availability
The authors did not generate any new data for the current study.
5 Code availability
The codes and files necessary files will be shared after the peer-review process.
The authors acknowledge funding from the National Science Foundation’s MRSEC program (DMR-2308691) at the Materials Research Center of Northwestern University. AP also acknowledges Payal Mohapatra from the Department of Electrical and Computer Engineering at Northwestern University for her valuable input regarding the preparation of this manuscript.
6 Authors Contribution
A.P., S.K., and W.C. conceived the idea. A.P. performed all implementations. A.P., S.K., and W.C. contributed to the manuscript writing.
7 Declaration of Interests
The authors declare no competing interests.
References
- Branden and Tooze 2012 Branden, C. I.; Tooze, J. Introduction to protein structure; Garland Science, 2012
- Arakawa et al. 2022 Arakawa, K.; Kono, N.; Malay, A. D.; Tateishi, A.; Ifuku, N.; Masunaga, H.; Sato, R.; Tsuchiya, K.; Ohtoshi, R.; Pedrazzoli, D.; others 1000 spider silkomes: Linking sequences to silk physical properties. Science advances 2022, 8, eabo6043
- Chen et al. 2023 Chen, J.; Gu, Z.; Xu, Y.; Deng, M.; Lai, L.; Pei, J. QuoteTarget: A sequence-based transformer protein language model to identify potentially druggable protein targets. Protein Science 2023, 32, e4555
- Konc and Janežič 2022 Konc, J.; Janežič, D. Protein binding sites for drug design. Biophysical reviews 2022, 14, 1413–1421
- Ellis and McGavin 1970 Ellis, D.; McGavin, S. The structure of collagen—An X-ray study. Journal of ultrastructure research 1970, 32, 191–211
- Asakura 2020 Asakura, T. Structure and dynamics of spider silk studied with solid-state nuclear magnetic resonance and molecular dynamics simulation. Molecules 2020, 25, 2634
- Simmons et al. 1994 Simmons, A.; Ray, E.; Jelinski, L. W. Solid-state 13C NMR of Nephila clavipes dragline silk establishes structure and identity of crystalline regions. Macromolecules 1994, 27, 5235–5237
- Hu et al. 2021 Hu, Y.; Cheng, K.; He, L.; Zhang, X.; Jiang, B.; Jiang, L.; Li, C.; Wang, G.; Yang, Y.; Liu, M. NMR-based methods for protein analysis. Analytical chemistry 2021, 93, 1866–1879
- Wang et al. 2022 Wang, Q.; McArdle, P.; Wang, S. L.; Wilmington, R. L.; Xing, Z.; Greenwood, A.; Cotten, M. L.; Qazilbash, M. M.; Schniepp, H. C. Protein secondary structure in spider silk nanofibrils. Nature Communications 2022, 13, 4329
- Schmuck et al. 2022 Schmuck, B.; Greco, G.; Bäcklund, F. G.; Pugno, N. M.; Johansson, J.; Rising, A. Impact of physio-chemical spinning conditions on the mechanical properties of biomimetic spider silk fibers. Communications Materials 2022, 3, 83
- Keten et al. 2010 Keten, S.; Xu, Z.; Ihle, B.; Buehler, M. J. Nanoconfinement controls stiffness, strength and mechanical toughness of -sheet crystals in silk. Nature materials 2010, 9, 359–367
- Keten and Buehler 2010 Keten, S.; Buehler, M. J. Nanostructure and molecular mechanics of spider dragline silk protein assemblies. Journal of the Royal Society Interface 2010, 7, 1709–1721
- Hollingsworth and Dror 2018 Hollingsworth, S. A.; Dror, R. O. Molecular dynamics simulation for all. Neuron 2018, 99, 1129–1143
- Arnittali et al. 2019 Arnittali, M.; Rissanou, A. N.; Harmandaris, V. Structure of biomolecules through molecular dynamics simulations. Procedia Computer Science 2019, 156, 69–78
- Rim et al. 2017 Rim, N.-G.; Roberts, E. G.; Ebrahimi, D.; Dinjaski, N.; Jacobsen, M. M.; Martín-Moldes, Z.; Buehler, M. J.; Kaplan, D. L.; Wong, J. Y. Predicting silk fiber mechanical properties through multiscale simulation and protein design. ACS biomaterials science & engineering 2017, 3, 1542–1556
- Lin et al. 2015 Lin, S.; Ryu, S.; Tokareva, O.; Gronau, G.; Jacobsen, M. M.; Huang, W.; Rizzo, D. J.; Li, D.; Staii, C.; Pugno, N. M.; others Predictive modelling-based design and experiments for synthesis and spinning of bioinspired silk fibres. Nature communications 2015, 6, 6892
- Herce and Garcia 2007 Herce, H. D.; Garcia, A. E. Molecular dynamics simulations suggest a mechanism for translocation of the HIV-1 TAT peptide across lipid membranes. Proceedings of the National Academy of Sciences 2007, 104, 20805–20810
- Karplus and Kuriyan 2005 Karplus, M.; Kuriyan, J. Molecular dynamics and protein function. Proceedings of the National Academy of Sciences 2005, 102, 6679–6685
- Tong et al. 2005 Tong, Y.; Hughes, D.; Placanica, L.; Buck, M. When Monomers Are Preferred: A Strategy for the Identification and Disruption of Weakly Oligomerized Proteins. Structure 2005, 13, 7–15
- Li et al. 2023 Li, J.; Jiang, B.; Chang, X.; Yu, H.; Han, Y.; Zhang, F. Bi-terminal fusion of intrinsically-disordered mussel foot protein fragments boosts mechanical strength for protein fibers. Nature communications 2023, 14, 2127
- Eijsink et al. 2005 Eijsink, V. G.; Gåseidnes, S.; Borchert, T. V.; Van Den Burg, B. Directed evolution of enzyme stability. Biomolecular engineering 2005, 22, 21–30
- Couñago et al. 2006 Couñago, R.; Chen, S.; Shamoo, Y. In vivo molecular evolution reveals biophysical origins of organismal fitness. Molecular cell 2006, 22, 441–449
- Nemtseva et al. 2019 Nemtseva, E. V.; Gerasimova, M. A.; Melnik, T. N.; Melnik, B. S. Experimental approach to study the effect of mutations on the protein folding pathway. PloS one 2019, 14, e0210361
- Diessner et al. 2023 Diessner, E. M.; Takahashi, G. R.; Cross, T. J.; Martin, R. W.; Butts, C. T. Mutation effects on structure and dynamics: adaptive evolution of the SARS-CoV-2 main protease. Biochemistry 2023, 62, 747–758
- Mou et al. 2015 Mou, Y.; Huang, P.-S.; Thomas, L. M.; Mayo, S. L. Using molecular dynamics simulations as an aid in the prediction of domain swapping of computationally designed protein variants. Journal of molecular biology 2015, 427, 2697–2706
- Graham and Keten 2023 Graham, J. J.; Keten, S. Increase in charge and density improves the strength and toughness of mussel foot protein 5 inspired protein materials. ACS Biomaterials Science & Engineering 2023, 9, 4662–4672
- Brandes et al. 2022 Brandes, N.; Ofer, D.; Peleg, Y.; Rappoport, N.; Linial, M. ProteinBERT: a universal deep-learning model of protein sequence and function. Bioinformatics 2022, 38, 2102–2110
- Xu et al. 2020 Xu, Y.; Verma, D.; Sheridan, R. P.; Liaw, A.; Ma, J.; Marshall, N. M.; McIntosh, J.; Sherer, E. C.; Svetnik, V.; Johnston, J. M. Deep dive into machine learning models for protein engineering. Journal of chemical information and modeling 2020, 60, 2773–2790
- Elnaggar et al. 2021 Elnaggar, A.; Heinzinger, M.; Dallago, C.; Rehawi, G.; Wang, Y.; Jones, L.; Gibbs, T.; Feher, T.; Angerer, C.; Steinegger, M.; others Prottrans: Toward understanding the language of life through self-supervised learning. IEEE transactions on pattern analysis and machine intelligence 2021, 44, 7112–7127
- Jumper et al. 2021 Jumper, J. et al. Highly accurate protein structure prediction with AlphaFold. Nature 2021, 596, 583–589
- Abramson et al. 2024 Abramson, J. et al. Accurate structure prediction of biomolecular interactions with AlphaFold 3. Nature 2024, 630, 493–500
- Chakravarty and Porter 2022 Chakravarty, D.; Porter, L. L. AlphaFold2 fails to predict protein fold switching. Protein Science 2022, 31, e4353
- Chakravarty et al. 2024 Chakravarty, D.; Schafer, J. W.; Chen, E. A.; Thole, J. F.; Ronish, L. A.; Lee, M.; Porter, L. L. AlphaFold predictions of fold-switched conformations are driven by structure memorization. Nature Communications 2024, 15, 7296
- Lefèvre et al. 2007 Lefèvre, T.; Rousseau, M.-E.; Pézolet, M. Protein secondary structure and orientation in silk as revealed by Raman spectromicroscopy. Biophysical journal 2007, 92, 2885–2895
- Vaswani 2017 Vaswani, A. Attention is all you need. Advances in Neural Information Processing Systems 2017,
- Hochreiter 1997 Hochreiter, S. Long Short-term Memory. Neural Computation MIT-Press 1997,
- Van Houdt et al. 2020 Van Houdt, G.; Mosquera, C.; Nápoles, G. A review on the long short-term memory model. Artificial Intelligence Review 2020, 53, 5929–5955
- Mohapatra et al. 2023 Mohapatra, P.; Pandey, A.; Keten, S.; Chen, W.; Zhu, Q. Person identification with wearable sensing using missing feature encoding and multi-stage modality fusion. ICASSP 2023-2023 IEEE International Conference on Acoustics, Speech and Signal Processing (ICASSP). 2023; pp 1–2
- Mohapatra et al. 2023 Mohapatra, P.; Pandey, A.; Sui, Y.; Zhu, Q. Effect of attention and self-supervised speech embeddings on non-semantic speech tasks. Proceedings of the 31st ACM International Conference on Multimedia. 2023; pp 9511–9515
- Kiranyaz et al. 2019 Kiranyaz, S.; Ince, T.; Abdeljaber, O.; Avci, O.; Gabbouj, M. 1-D convolutional neural networks for signal processing applications. ICASSP 2019-2019 IEEE International Conference on Acoustics, Speech and Signal Processing (ICASSP). 2019; pp 8360–8364
- Mohapatra et al. 2024 Mohapatra, P.; Wang, L.; Zhu, Q. Phase-driven Domain Generalizable Learning for Nonstationary Time Series. arXiv preprint arXiv:2402.05960 2024,
- Kiranyaz et al. 2019 Kiranyaz, S.; Ince, T.; Abdeljaber, O.; Avci, O.; Gabbouj, M. 1-D convolutional neural networks for signal processing applications. ICASSP 2019-2019 IEEE International Conference on Acoustics, Speech and Signal Processing (ICASSP). 2019; pp 8360–8364
- Yu et al. 2022 Yu, C.-H.; Chen, W.; Chiang, Y.-H.; Guo, K.; Martin Moldes, Z.; Kaplan, D. L.; Buehler, M. J. End-to-end deep learning model to predict and design secondary structure content of structural proteins. ACS biomaterials science & engineering 2022, 8, 1156–1165
- Gupta and Zou 2019 Gupta, A.; Zou, J. Feedback GAN for DNA optimizes protein functions. Nature Machine Intelligence 2019, 1, 105–111
- Pandey et al. 2023 Pandey, A.; Liu, E.; Graham, J.; Chen, W.; Keten, S. B-factor prediction in proteins using a sequence-based deep learning model. Patterns 2023, 4
- Sun et al. 2019 Sun, Z.; Liu, Q.; Qu, G.; Feng, Y.; Reetz, M. T. Utility of B-factors in protein science: interpreting rigidity, flexibility, and internal motion and engineering thermostability. Chemical reviews 2019, 119, 1626–1665
- Liu et al. 2022 Liu, F. Y.; Ni, B.; Buehler, M. J. PRESTO: Rapid protein mechanical strength prediction with an end-to-end deep learning model. Extreme Mechanics Letters 2022, 55, 101803
- Lin et al. 2023 Lin, Z.; Akin, H.; Rao, R.; Hie, B.; Zhu, Z.; Lu, W.; Smetanin, N.; Verkuil, R.; Kabeli, O.; Shmueli, Y.; others Evolutionary-scale prediction of atomic-level protein structure with a language model. Science 2023, 379, 1123–1130
- Boutet et al. 2016 Boutet, E.; Lieberherr, D.; Tognolli, M.; Schneider, M.; Bansal, P.; Bridge, A. J.; Poux, S.; Bougueleret, L.; Xenarios, I. UniProtKB/Swiss-Prot, the manually annotated section of the UniProt KnowledgeBase: how to use the entry view. Plant bioinformatics: methods and protocols 2016, 23–54
- Detlefsen et al. 2022 Detlefsen, N. S.; Hauberg, S.; Boomsma, W. Learning meaningful representations of protein sequences. Nature communications 2022, 13, 1914
- Khare et al. 2022 Khare, E.; Gonzalez-Obeso, C.; Kaplan, D. L.; Buehler, M. J. CollagenTransformer: end-to-end transformer model to predict thermal stability of collagen triple helices using an NLP approach. ACS Biomaterials Science & Engineering 2022, 8, 4301–4310
- Vig et al. 2021 Vig, J.; Madani, A.; Varshney, L. R.; Xiong, C.; Socher, R.; Rajani, N. F. BERTology Meets Biology: Interpreting Attention in Protein Language Models. 9th International Conference on Learning Representations, ICLR 2021, Virtual Event, Austria, May 3-7, 2021. 2021
- Pandey et al. 2024 Pandey, A.; Chen, W.; Keten, S. Sequence-based data-constrained deep learning framework to predict spider dragline mechanical properties. Communications Materials 2024, 5, 83
- Ali et al. 2023 Ali, S.; Abuhmed, T.; El-Sappagh, S.; Muhammad, K.; Alonso-Moral, J. M.; Confalonieri, R.; Guidotti, R.; Del Ser, J.; Díaz-Rodríguez, N.; Herrera, F. Explainable Artificial Intelligence (XAI): What we know and what is left to attain Trustworthy Artificial Intelligence. Information fusion 2023, 99, 101805
- Danilevicz et al. 2023 Danilevicz, M. F.; Gill, M.; Fernandez, C. G. T.; Petereit, J.; Upadhyaya, S. R.; Batley, J.; Bennamoun, M.; Edwards, D.; Bayer, P. E. DNABERT-based explainable lncRNA identification in plant genome assemblies. Computational and Structural Biotechnology Journal 2023, 21, 5676–5685
- Avsec et al. 2021 Avsec, Ž.; Agarwal, V.; Visentin, D.; Ledsam, J. R.; Grabska-Barwinska, A.; Taylor, K. R.; Assael, Y.; Jumper, J.; Kohli, P.; Kelley, D. R. Effective gene expression prediction from sequence by integrating long-range interactions. Nature methods 2021, 18, 1196–1203
- Chen et al. 2021 Chen, J.; Cheong, H. H.; Siu, S. W. xDeep-AcPEP: deep learning method for anticancer peptide activity prediction based on convolutional neural network and multitask learning. Journal of chemical information and modeling 2021, 61, 3789–3803
- Monteiro et al. 2022 Monteiro, N. R.; Simões, C. J.; Ávila, H. V.; Abbasi, M.; Oliveira, J. L.; Arrais, J. P. Explainable deep drug–target representations for binding affinity prediction. BMC bioinformatics 2022, 23, 237
- Yu et al. 2024 Yu, H.; Yang, H.; Sun, W.; Yan, Z.; Yang, X.; Zhang, H.; Ding, Y.; Li, K. An interpretable RNA foundation model for exploring functional RNA motifs in plants. Nature Machine Intelligence 2024, 1–10
- Jiménez-Luna et al. 2020 Jiménez-Luna, J.; Grisoni, F.; Schneider, G. Drug discovery with explainable artificial intelligence. Nature Machine Intelligence 2020, 2, 573–584
- Wu et al. 2020 Wu, Z.; Nguyen, T.-S.; Ong, D. C. Structured self-attention weights encode semantics in sentiment analysis. arXiv preprint arXiv:2010.04922 2020,
- Selvaraju et al. 2017 Selvaraju, R. R.; Cogswell, M.; Das, A.; Vedantam, R.; Parikh, D.; Batra, D. gradcam. Proceedings of the IEEE international conference on computer vision. 2017; pp 618–626
- Serrano and Smith 2019 Serrano, S.; Smith, N. A. Is Attention Interpretable? Proceedings of the 57th Annual Meeting of the Association for Computational Linguistics. Florence, Italy, 2019; pp 2931–2951
- Bai et al. 2021 Bai, B.; Liang, J.; Zhang, G.; Li, H.; Bai, K.; Wang, F. Why attentions may not be interpretable? Proceedings of the 27th ACM SIGKDD conference on knowledge discovery & data mining. 2021; pp 25–34
- Wiegreffe and Pinter 2019 Wiegreffe, S.; Pinter, Y. Attention is not not Explanation. Proceedings of the 2019 Conference on Empirical Methods in Natural Language Processing and the 9th International Joint Conference on Natural Language Processing (EMNLP-IJCNLP). Hong Kong, China, 2019; pp 11–20
- Gligorijević et al. 2021 Gligorijević, V.; Renfrew, P. D.; Kosciolek, T.; Leman, J. K.; Berenberg, D.; Vatanen, T.; Chandler, C.; Taylor, B. C.; Fisk, I. M.; Vlamakis, H.; Xavier, R. J.; Knight, R.; Cho, K.; Bonneau, R. Structure-based protein function prediction using graph convolutional networks. Nature Communications 2021, 12, 3168
- Covert et al. 2023 Covert, I. C.; Kim, C.; Lee, S.-I. Learning to Estimate Shapley Values with Vision Transformers. ICLR. 2023
- Nazir et al. 2023 Nazir, S.; Dickson, D. M.; Akram, M. U. Survey of explainable artificial intelligence techniques for biomedical imaging with deep neural networks. Computers in Biology and Medicine 2023, 156, 106668
- Yoshikawa and Iwata 2024 Yoshikawa, Y.; Iwata, T. Explanation-based Training with Differentiable Insertion/Deletion Metric-aware Regularizers. International Conference on Artificial Intelligence and Statistics. 2024; pp 370–378
- Zhou et al. 2022 Zhou, L.; Meng, X.; Huang, Y.; Kang, K.; Zhou, J.; Chu, Y.; Li, H.; Xie, D.; Zhang, J.; Yang, W.; others An interpretable deep learning workflow for discovering subvisual abnormalities in CT scans of COVID-19 inpatients and survivors. Nature Machine Intelligence 2022, 4, 494–503
- Jahromi et al. 2024 Jahromi, M. N.; Muddamsetty, S. M.; Jarlner, A. S. S.; Høgenhaug, A. M.; Gammeltoft-Hansen, T.; Moeslund, T. B. SIDU-TXT: An XAI algorithm for NLP with a holistic assessment approach. Natural Language Processing Journal 2024, 7, 100078
- Sun et al. 2024 Sun, X.; Liu, Y.; Ma, T.; Zhu, N.; Lao, X.; Zheng, H. DCTPep, the data of cancer therapy peptides. Scientific Data 2024, 11, 541
- Hon et al. 2021 Hon, J.; Marusiak, M.; Martinek, T.; Kunka, A.; Zendulka, J.; Bednar, D.; Damborsky, J. SoluProt: prediction of soluble protein expression in Escherichia coli. Bioinformatics 2021, 37, 23–28
- Olson et al. 2014 Olson, C. A.; Wu, N. C.; Sun, R. A comprehensive biophysical description of pairwise epistasis throughout an entire protein domain. Current biology 2014, 24, 2643–2651
- Nikolados et al. 2022 Nikolados, E.-M.; Wongprommoon, A.; Aodha, O. M.; Cambray, G.; Oyarzún, D. A. Accuracy and data efficiency in deep learning models of protein expression. Nature Communications 2022, 13, 7755
- Kim et al. 2023 Kim, Y.; Yoon, T.; Park, W. B.; Na, S. Predicting mechanical properties of silk from its amino acid sequences via machine learning. Journal of the Mechanical Behavior of Biomedical Materials 2023, 140, 105739
- Ricard-Blum 2011 Ricard-Blum, S. The collagen family. Cold Spring Harbor perspectives in biology 2011, 3, a004978
- Paszke et al. 2017 Paszke, A.; Gross, S.; Chintala, S.; Chanan, G.; Yang, E.; DeVito, Z.; Lin, Z.; Desmaison, A.; Antiga, L.; Lerer, A. Automatic differentiation in PyTorch. NIPS-W. 2017
- Harding-Larsen et al. 2024 Harding-Larsen, D.; Funk, J.; Madsen, N. G.; Gharabli, H.; Acevedo-Rocha, C. G.; Mazurenko, S.; Welner, D. H. Protein representations: Encoding biological information for machine learning in biocatalysis. Biotechnology Advances 2024, 108459
- Bornschein et al. 2020 Bornschein, J.; Visin, F.; Osindero, S. Small data, big decisions: Model selection in the small-data regime. International conference on machine learning. 2020; pp 1035–1044
- Molnar 2020 Molnar, C. Interpretable machine learning; Lulu. com, 2020
- Madsen et al. 2021 Madsen, A.; Meade, N.; Adlakha, V.; Reddy, S. Evaluating the faithfulness of importance measures in nlp by recursively masking allegedly important tokens and retraining. arXiv preprint arXiv:2110.08412 2021,
- Hooker et al. 2019 Hooker, S.; Erhan, D.; Kindermans, P.-J.; Kim, B. A benchmark for interpretability methods in deep neural networks. Advances in neural information processing systems 2019, 32
- Pham et al. 2022 Pham, T.; Bui, T.; Mai, L.; Nguyen, A. Double Trouble: How to not Explain a Text Classifier’s Decisions Using Counterfactuals Synthesized by Masked Language Models? Proceedings of the 2nd Conference of the Asia-Pacific Chapter of the Association for Computational Linguistics and the 12th International Joint Conference on Natural Language Processing (Volume 1: Long Papers). Online only, 2022; pp 12–31
- Wu et al. 2020 Wu, Z.; Nguyen, T.-S.; Ong, D. Structured Self-AttentionWeights Encode Semantics in Sentiment Analysis. Proceedings of the Third BlackboxNLP Workshop on Analyzing and Interpreting Neural Networks for NLP. Online, 2020; pp 255–264
- Barkan et al. 2021 Barkan, O.; Hauon, E.; Caciularu, A.; Katz, O.; Malkiel, I.; Armstrong, O.; Koenigstein, N. Grad-sam: Explaining transformers via gradient self-attention maps. Proceedings of the 30th ACM International Conference on Information & Knowledge Management. 2021; pp 2882–2887
- Guruprasad et al. 1990 Guruprasad, K.; Reddy, B. B.; Pandit, M. W. Correlation between stability of a protein and its dipeptide composition: a novel approach for predicting in vivo stability of a protein from its primary sequence. Protein Engineering, Design and Selection 1990, 4, 155–161
- Ikai 1980 Ikai, A. Thermostability and aliphatic index of globular proteins. The Journal of Biochemistry 1980, 88, 1895–1898
- Kyte and Doolittle 1982 Kyte, J.; Doolittle, R. F. A simple method for displaying the hydropathic character of a protein. Journal of molecular biology 1982, 157, 105–132
- Deshmukh et al. 2016 Deshmukh, S. N.; Dive, A. M.; Moharil, R.; Munde, P. Enigmatic insight into collagen. Journal of Oral and Maxillofacial Pathology 2016, 20, 276–283
- Berman et al. 2017 Berman, H. M.; Gabanyi, M. J.; Kouranov, A.; Micallef, D.; Westbrook, J. Protein structure initiative–targettrack 2000-2017–all data files. Zenodo. doi 2017, 10
- Yu et al. 2022 Yu, C.-H.; Khare, E.; Narayan, O. P.; Parker, R.; Kaplan, D. L.; Buehler, M. J. ColGen: An end-to-end deep learning model to predict thermal stability of de novo collagen sequences. Journal of the mechanical behavior of biomedical materials 2022, 125, 104921
- Kyte and Doolittle 1982 Kyte, J.; Doolittle, R. F. A simple method for displaying the hydropathic character of a protein. Journal of molecular biology 1982, 157, 105–132
- Ouellette and Rawn 2014 Ouellette, R. J.; Rawn, J. D. Organic chemistry study guide: Key concepts, problems, and solutions; Elsevier, 2014
- Papagianni 2003 Papagianni, M. Ribosomally synthesized peptides with antimicrobial properties: biosynthesis, structure, function, and applications. Biotechnology advances 2003, 21, 465–499
- Das et al. 2021 Das, P.; Sercu, T.; Wadhawan, K.; Padhi, I.; Gehrmann, S.; Cipcigan, F.; Chenthamarakshan, V.; Strobelt, H.; Dos Santos, C.; Chen, P.-Y.; others Accelerated antimicrobial discovery via deep generative models and molecular dynamics simulations. Nature Biomedical Engineering 2021, 5, 613–623
See pages - of SI.pdf