AI-powered virtual tissues from spatial proteomics for clinical diagnostics and biomedical discovery
Abstract
Spatial proteomics technologies have transformed our understanding of complex tissue architectures by enabling simultaneous analysis of multiple molecular markers and their spatial organization. The high dimensionality of these data, varying marker combinations across experiments and heterogeneous study designs pose unique challenges for computational analysis. Here, we present Virtual Tissues (VirTues), a foundation model framework for biological tissues that operates across the molecular, cellular and tissue scale. VirTues introduces innovations in transformer architecture design, including a novel tokenization scheme that captures both spatial and marker dimensions, and attention mechanisms that scale to high-dimensional multiplex data while maintaining interpretability. Trained on diverse cancer and non-cancer tissue datasets, VirTues demonstrates strong generalization capabilities without task-specific fine-tuning, enabling cross-study analysis and novel marker integration. As a generalist model, VirTues outperforms existing approaches across clinical diagnostics, biological discovery and patient case retrieval tasks, while providing insights into tissue function and disease mechanisms.
1 School of Computer and Communication Sciences, EPFL, Lausanne, Switzerland,
2 Department of Computer Science, ETH, Zurich, Switzerland,
3 Department of Medical Oncology and Hematology, University Hospital Zurich, Zurich, Switzerland,
4 University of Zurich, Faculty of
Medicine, Zurich, Switzerland,
5 Swiss Institute for Experimental Cancer Research, School of Life Sciences, EPFL, Lausanne, Switzerland.
6 These authors contributed equally.
7 Correspondence to: charlotte.bunne@epfl.ch.
Introduction
Tissues, particularly in cancer, display pronounced heterogeneity across patients, disease stages and even within individual tumors—evident in diverse cell phenotypes, states and spatial organization 1. Accounting for this heterogeneity is critical: tumor development and response to therapy depend not just on cancer cells, but on their complex interactions with their surrounding environment. Different cell phenotypes may act as promoters or suppressors of tumor development and progression, depending on the biological context 2, 3, with their spatial co-occurrence patterns predicting immunotherapy response 4, 5, disease relapse 6 and survival 7. Understanding the spatial organization, composition and function of the tumor microenvironment (TME) has thus emerged as an important element for advancing cancer treatment.
Capturing complex tissue structure requires advanced molecular imaging techniques that go beyond traditional methods 8.
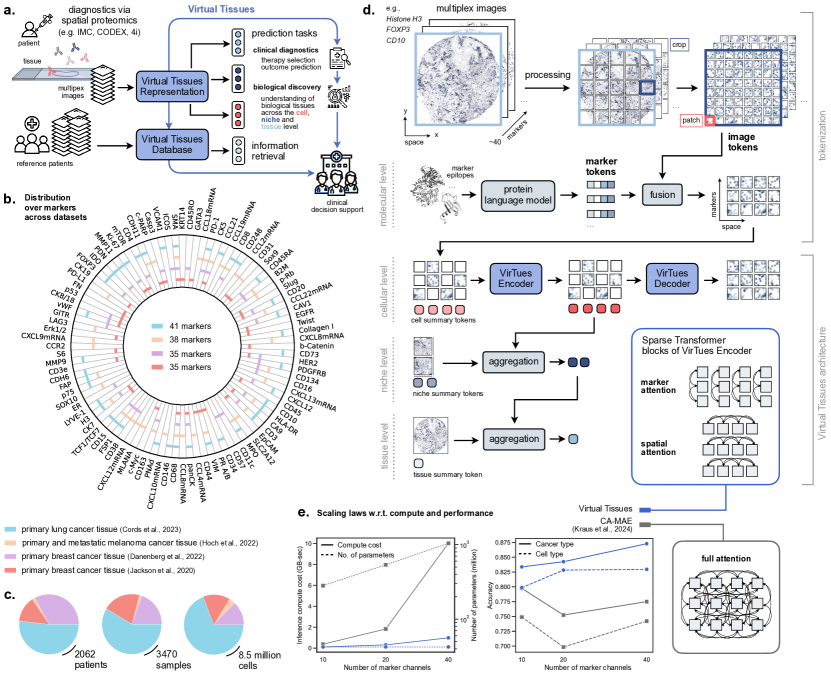
The emergence of multiplexed imaging technologies—including co-detection by indexing (CODEX) 9, imaging mass cytometry (IMC) 10 and multiplex immunohistochemistry (IHC) 11—has revolutionized our ability to study the TME by enabling in situ detection of multiple markers on a single slide 12. IMC, in particular, can measure up to 150 target proteins at cellular and sub-cellular scales, serving as a crucial tool for precision oncology 13 (Fig. 1a).
Advancement in computational tools of multiplexed tissue imaging data from patient tumors may provide three critical functions in clinical oncology: clinical diagnostics, e.g., the identification and characterization of tumors, biological discovery, e.g., understanding disease mechanisms and therapy responses, and clinical decision support through retrieval of comparable patient cases for molecular tumor boards 14 (Fig. 1a). The complexity of multiplexed data, characterized by immense scale and highly non-linear, context-dependent relationships between molecular markers, necessitates AI methods for meaningful pattern interpretation and prediction 15.
To achieve this, we present Virtual Tissues, an artificial intelligence (AI)-driven foundation model framework for representing biological tissues from spatial proteomics data. Trained on diverse datasets covering breast 13, 17, lung 18 and melanoma 19 tissues and evaluated via zero-shot inference on diabetic pancreatic tissue 20, VirTues achieves strong performance across various clinical and biological tasks without task-specific training. Importantly, it can generate virtual tissue representations of new cancer types or diseases without fine-tuning, while maintaining robustness to dataset-specific artifacts.
Recent foundation models in digital pathology 21, 22, 23 and cellular microscopy 16, 24, 25, 26 (such as CellPainting data 27), have established vision transformers (ViT) 28 as the predominant architecture for analyzing spatial biomedical data. However, neither these transformer-based approaches nor CNN-based methods 7 adequately address the unique challenges inherent in multiplex imaging data: First, multiplex images are high-dimensional—instead of the three-dimensional RGB format of H&E slices, these images often comprise more than 40 channels of intensity values indicating the presence of different protein or RNA molecules. Second, every experiment may record a different set of markers, requiring architectures that scale and deal with flexible inputs of potentially never-measured markers and their distribution within cells and tissues (Fig. 1b). Lastly, multiplex tissue imaging remains costly, resulting in fewer, often smaller datasets. The relative data scarcity necessitates models that can robustly generalize across diverse study contexts and incorporate future patient cohorts while maintaining reliable performance (Fig. 1c).
Following the vision of constructing multi-scale foundation models for biology 29, VirTues provides new innovations in AI architecture development: Its success stems from its transformer architecture that respects biological hierarchy across multiple scales, providing representations and insights into tissue function. At the molecular level, it is powered by protein language models (PLM) trained on the entire protein data bank (PDB), enabling it to capture complex relationships between protein markers, distinguish the semantic meanings of different markers, and generalize to previously unseen markers. Through hierarchical internal representations spanning cellular, niche, and tissue levels 30, combined with its novel attention mechanism (Fig. 1d), VirTues achieves biological interpretability by identifying the specific tissue regions and biomarkers driving each prediction. This interpretability is crucial for clinical applications and provides deeper insights into underlying biological mechanisms.
VirTues is a generalist model: Contrary to existing tools, VirTues is the first model able to tackle a wide range of prediction and retrieval tasks across cell, niche and tissue levels, while consistently outperforming all baselines and demonstrating emergent capabilities for embedding unseen markers, patients and diseases.
Results
A novel vision transformer to construct AI-powered Virtual Tissues
A pivotal characteristic of foundation models is their ability to leverage larger and more diverse training datasets in order to achieve superior performance across multiple downstream tasks. Importantly, the current state of vision transformers 16, 24, 25, 26, 31 developed for biological imaging face several limitations when applied to multiplexed biomedical data (Fig. 1e). First, the current architectures’ computational complexity scales quadratically with both spatial dimensions and number of channels, making them impractical for high-dimensional spatial data. Second, their token-based representations typically treat all channels equally, failing to capture the distinct ones and filter out the potentially redundant biological information of different markers. Third, they lack explicit mechanisms for integrating differing marker combinations across experiments or for incorporating prior knowledge about protein interactions.
We specifically design VirTues to overcome the identified challenges and introduce a purpose-built ViT model for multiplexed imaging. By disentangling transformer’s attention mechanism 32, 33 into marker and spatial attention components, VirTues not only enables training on images with hundreds of channels, but also learns to distinguish between the spatial distribution and composition of cells that determine the molecular profile of a tissue as well as the relation and interaction between protein and RNA markers. Another critical innovation in VirTues is the introduction of a new tokenization scheme for spatial transcriptomics and proteomics: by combining protein language model embeddings with spatially-patched channel information and learnable cell summary tokens, we enable flexible processing of variable marker combinations while incorporating biological meaning and subcellular spatial distribution of markers (Fig. 1d, details in Methods). This multi-scale design 29, 34 enables the integration of heterogeneous datasets containing different marker combinations (Fig. 1b), as demonstrated across lung cancer 18 (41 markers), melanoma 19 (38 markers) and breast cancer tissues 17, 13 (35 markers each). These datasets show substantial variation in cohort sizes (2,062 total patients), cell counts (8.5 million total cells) and samples (3,470 total images) across different cancer types (Fig. 1c). We also note that VirTues’ design does not provide a network architecture for biological vision foundation models simply due to its ability to scale: While modality-agnostic architectures used in previous methods do not profit from providing richer biological features, VirTues’ performance scales with increasing number of markers, as demonstrated on a task on the cellular level (i.e., cell type classification) and the tissue level (i.e., cancer type) (Fig. 1e).
The Virtual Tissues framework is based on a masked autoencoder (MAE) architecture 35. The VirTues Encoder and Decoder are trained in an unsupervised fashion through reconstructing partially masked marker-space tensors (Fig. 2, details in Methods). Multiplex imaging data provide information at a subcellular resolution and thus provide the foundation for tissue understanding on the cell, niche and tissue level. To allow for downstream predictions across all biological tissue scales, VirTues generates cell, niche and tissue summary tokens that serve as hierarchical and multi-scale tissue representation used across a variety of downstream tasks (Figs. 3 and 4, details in Methods).
Virtual Tissues understand tissue architectures and relations between markers
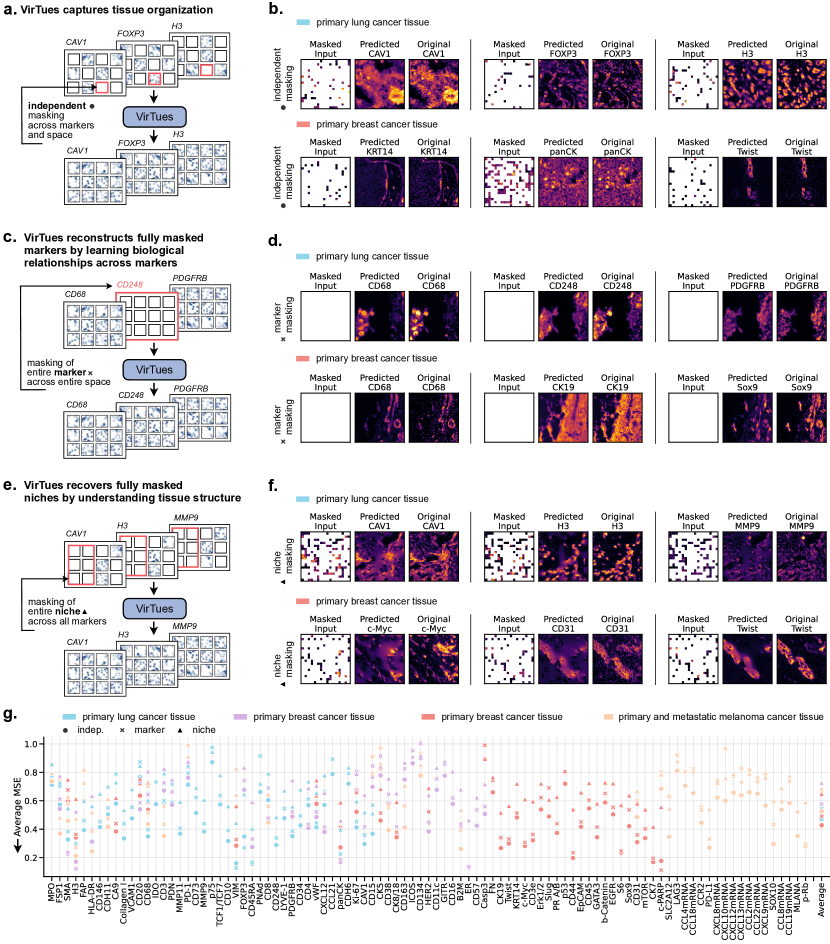
To evaluate VirTues’ understanding of tissue architecture, we challenge its ability to reconstruct tissues masked in three different ways of increasing difficulty: (1) independent masking, where independently for each marker patches are masked at random spatial locations (Figs. 2a,b), (2) marker masking, where all patches of a single marker are masked (Figs. 2c,d) and (3) niche masking, where patches across all markers are masked at randomly selected spatial locations (Figs. 2e,f).
In the independent masking experiments, VirTues successfully reconstructs masked regions across markers, e.g., CAV1, FOXP3, H3 in Fig. 2b in lung cancer tissue 18 and KRT14, panCK, Twist in breast cancer samples 17, preserving both spatial distribution and intensity patterns (Suppl. Figs. LABEL:suppfig:mae_independent_cords, LABEL:suppfig:mae_independent_jackson, LABEL:suppfig:mae_independent_danenberg, LABEL:suppfig:mae_independent_hoch for results on further channels of all datasets 18, 19, 17, 13). This demonstrates the model’s ability to leverage contextual information across both spatial and marker dimensions.
For marker reconstruction (Fig. 2c,d), we completely mask individual markers across the entire space. VirTues accurately recovers the expression patterns of masked markers (e.g., CD68, CD248, PDGFRB in lung cancer 18 and CD68, CK19, Sox9 in breast cancer tissue 17, Suppl. Figs. LABEL:suppfig:mae_marker_cords, LABEL:suppfig:mae_marker_jackson, LABEL:suppfig:mae_marker_danenberg, LABEL:suppfig:mae_marker_hoch for results on further channels of all datasets 18, 19, 17, 13), indicating its ability to learn biological relationships between different markers. Since with marker masking the VirTues Decoder receives only the encoded cell summary tokens as input, its ability to decode a channel absent from the encoder’s input further demonstrates that the cell summary tokens generated by VirTues effectively capture a meaningful and robust representation of the molecular tissue architecture.
In niche-level experiments (Figs. 2e,f), we mask entire tissue regions across all markers. The model successfully reconstructs complex tissue architectures, recovering marker patterns (e.g., CAV1, H3, MMP9 in lung cancer 18 and c-Myc, CD31, Twist in breast cancer tissue 17, Suppl. Figs. LABEL:suppfig:mae_niche_cords, LABEL:suppfig:mae_niche_jackson, LABEL:suppfig:mae_niche_danenberg, LABEL:suppfig:mae_niche_hoch for results on further channels of all datasets 18, 19, 17, 13) while maintaining biological plausibility. Quantitative evaluation in terms of the average mean squared error (MSE) across different markers, cancer types and masking strategies (Fig. 2g) shows robust reconstruction capability with significant improvements over the reconstructions based on predicting the mean channel intensity of all visible patches (Suppl. Fig. LABEL:suppfig:reconstruction_losses_with_damond).
Performing biological discovery and clinical diagnostics tasks across the scales of biology
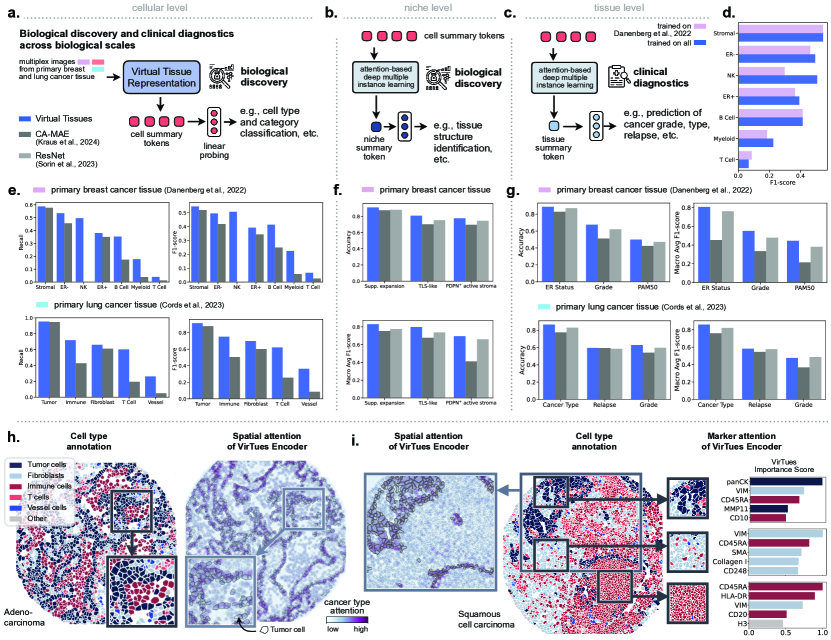
VirTues enables comprehensive analysis of tissues across biological scales through a unified framework (Figs. 3a-c). At the cellular level, cell summary tokens support tasks such as cell type classification. Niche summary tokens facilitate tissue structure analysis, while tissue summary tokens enable clinical diagnostics like the prediction of cancer type and grade. This unified multi-scale approach is particularly powerful as it allows predictions and queries across the inherent hierarchical organization of biological tissues, where molecular and cellular patterns inform higher-level tissue structures that ultimately contribute to clinical outcomes.
For biological discovery tasks at the cellular level, we employ logistic regression on the encoded cell summary tokens (Fig. 3a), a common practice referred to as linear probing, which measures discriminative performance and the representation quality of a foundation model encoder 36. For niche and tissue level tasks, we learn niche and tissue summary tokens (Fig. 1d) using attention-based multiple instance learning (ABMIL) 37 on the cell summary tokens which enables addressing biological discovery and clinical diagnostic tasks on individual niches and tissue of patients (for details see Methods, Fig. 3b,c).
VirTues consistently outperforms other pretrained encoders and vision transformers 16, 24 trained unsupervised on multiplex images (Fig. 3), across all cell, niche and tissue level tasks performed on breast 13 and lung cancer tissue 18 (see Suppl. Fig. LABEL:suppfig:tasks_jackson for additional results on Jackson et al. 17). Specifically, we benchmark against CA-MAE16 16 and ResNet7 7 as they represent the current state-of-the-art architectures for cellular imaging data, respectively (for additional baselines, see Suppl. Fig. LABEL:suppfig:pca_benchmark). CA-MAE16 follows the vision transformer architecture, however, it features a common encoder and separate decoders for each multiplex channel. ResNet7 is pre-trained on ImageNet, where each channel is embedded separately and reduced to 16 dimensions with PCA. While CA-MAE16 is able to conduct predictions across different tasks on all scales (cell, niche and tissue level), ResNet7’s architecture is restricted to niche and tissue level tasks, since it aggregates spatial information directly into niche-level embeddings.
Importantly—and a critical property of foundation models—the performance on such downstream tasks increases when trained on a large collection of datasets, here demonstrated for an exemplary downstream task on the Danenberg et al. 13 patient cohort when comparing the VirTues platform with a VirTues Encoder/Decoder pair trained on the Danenberg et al. 13 dataset only (Fig. 3d).
Identifying the cell types in a tissue sample offers critical insights into its functional dynamics and cellular makeup. Moreover, it helps in dissecting the complex interactions between different cell types within a TME, which can help guiding systemic therapies geared towards the tumor environment (such as immunotherapy), treatments targeting the tumor cells themselves, and ultimately refine a broad range of systemic anti-cancer treatment regimens. For instance, we can gauge the strength of immune response through the high presence of tumor-infiltrating lymphocytes38, or adjust treatments to target tumor- or resistance-promoting stroma39.
At the cellular level (Fig. 3e), VirTues outperforms baseline methods in cell type multi-class classification for both breast cancer (distinguishing stromal, ER+, NK, ER-, B cell, myeloid and T cell populations) and lung cancer tissues (tumor, immune, fibroblast, T cell and vessel cells). The cell type classification tasks are affected by significant class imbalance (see Fig. LABEL:suppfig:cellular-task-supports for the test set distribution). For instance, NK and B cells are severely underrepresented in the breast cancer dataset, while vessel and T cells are underrepresented in the lung cancer dataset. Despite this, the model demonstrates particular strength compared to baselines in identifying rare cell populations, maintaining robust performance across varying cell type frequencies. Additional classification results for fine-grained, highly-imbalanced cell types on Cords et al. 18 show consistent trends (see Suppl. Figs. LABEL:suppfig:cords_cell_finegrained and LABEL:suppfig:cellular-task-supports-finegrained for results and support distribution).
For breast cancer tissue, VirTues achieves F1-scores of 0.55 for stromal cells and 0.49 for ER- cells, surpassing CA-MAE16 by 4.94% and 18.27% respectively. The performance advantage is even more pronounced for rare cell types such as NK and B cell, which cover only 1.17% and 3.27% of the test set. We first notice that VirTues is able to achieve an F1-score of 0.51 for NK, while CA-MAE16 fails to identify any NK cell. In case of B cells, VirTues achieves an F1-score of 0.41, surpassing CA-MAE16 by 66.26%. In lung cancer analysis, VirTues maintains its superior performance, achieving F1-scores of 0.91 for tumor cells and 0.75 for immune cells, representing improvements of 4.05% and 48.83% over CA-MAE16 respectively. For the challenging and underrepresented vessel cell identification task, VirTues achieves an F1-score of 0.36, outperforming the baseline by a significant margin of 324.38%.
At the niche level (Fig. 3f), VirTues demonstrates robust performance in identifying multicellular tissue structures as defined by the respective authors of the studies including suppressive expansion, tertiary lymphoid structures (TLS)-like regions, PDPN+ regions. These regions reflect distinct cellular compositions and functional states: suppressive expansion regions contain regulatory T cells and PD-1-expressing cells indicating immune suppression; TLS-like regions show complex immune cell organization similar to tertiary lymphoid structures; and PDPN+ regions represent areas of active stroma. The structures present within the niches of the TME often recur across tumors 13 and identifying such structures gives insights into the functional state of the TME providing prognostic value.
For suppressed expansion regions, binary classification based on VirTues learned representation achieves an accuracy of 0.85, surpassing CA-MAE16 by 4.11% (P < 0.006), and ResNet7 by 3.45% (P < 0.005). The VirTues-based model maintains strong performance across other tissue structures, with accuracies of 0.81 for TLS-like regions and 0.78 for PDPN+ regions, consistently outperforming CA-MAE16 by 15.01% (P < 0.006) and 11.49% (P < 0.005), and ResNet7 by 7.28% (P < 0.005) and 4.24% (P < 0.005) for TLS-like and PDPN+ respectively.
Akin to a pathologist, AI models should evaluate tissue characteristics comprehensively for robust clinical classifications and predictions. The model’s tissue level predictions (Fig. 3g) show particularly strong performance in critical clinical tasks such as ER status determination, tumor grade classification and PAM50 subtyping in breast cancer, as well as the prediction of cancer type, cancer relapse and grade classification in lung cancer. ER status indicates estrogen receptor presence, affecting treatment response. Tumor grade reflects cancer cell differentiation and growth rate. PAM50 subtyping classifies breast cancers into intrinsic subtypes (Luminal A/B, HER2-enriched, Basal-like, Normal-like), guiding treatment strategies. In lung cancer, accurate cancer type classification (e.g., adenocarcinoma vs. squamous cell carcinoma) and grade assessment are crucial for treatment planning and prognosis.
For breast cancer, VirTues representations achieve accuracies of 0.89 for ER Status and 0.68 for cancer grade prediction, representing improvements of 7.26% (P < 0.005) and 32.16% (P < 0.005) over CA-MAE16, and 1.88% (P < 0.199) and 8.86% (P < 0.02) over ResNet7 respectively. Similarly, in lung cancer analysis, the model demonstrates superior performance in cancer type prediction (0.87 accuracy, 11.72% over CA-MAE16 (P < 0.006) and 4.36% over ResNet7 (P < 0.005)) and cancer grade prediction (0.63 accuracy, 16.21% over CA-MAE16 (P < 0.006), and 5.37% over ResNet7 (P < 0.005)). Importantly, some tasks exhibit a high class imbalance, e.g., ER Status and PAM50 (see Suppl. Fig. LABEL:suppfig:tissue-task-supports for details).
A common strategy to deal with the high-dimensionality of multiplex images is to project image channels that contain measurements of different markers onto a lower-dimensional manifold 40, subset markers or features 41 or to summarize all markers into a single value per pixel 42, 43. However, such approaches risk losing crucial marker-specific patterns and biological relationships that are essential for understanding tissue organization and function. VirTues’ marker attention mechanism takes a fundamentally different approach by maintaining the full biological dimensionality while learning to attend to relevant marker combinations in a context-dependent manner. This allows the model to capture complex marker interactions and their spatial distributions, preserving biological interpretability while efficiently handling the high-dimensional nature of multiplex data. See Suppl. Fig. LABEL:suppfig:pca_benchmark for comparison against transformer architectures operating on compressed images.
Spatial and marker attention provides explainability of algorithmic decisions
VirTues provides interpretable insights into its decision-making process through spatial and marker attention mechanisms (Fig. 3h,i). Importantly, the newly introduced attention scheme allows to disentangle the influence of spatial regions and markers that are critical for an algorithmic decision—an ability no other architecture possesses.
Here highlighted for adenocarcinoma (Fig. 3h) and squamous cell carcinoma samples (Fig. 3i), spatial attention maps reveal the influence of distinct cellular neighborhoods and the tumor architecture on the predictions of clinical properties. When classifying a patient’s cancer type, for example, the spatial attention of VirTues’ Encoder is high on tumor cell regions throughout the tissue.
Marker attention analysis, on the other hand, provides insights into the relative importance of different RNAs and proteins in algorithmic decisions. This analysis can be conducted across the entire tissue or in spatial regions of interest, e.g., for tissue niches that are rich in tumor cells, a fibroblast neighborhood or the tumor immune microenvironment (TIME) (Fig. 3i). To quantify the importance of a marker for the generated representation, we showcase the importance scores perceived by VirTues, which signifies the relative marker attention scores learned by VirTues for the region of interest (see Methods for details).
When analyzing an immune-cell infiltrated tumor region of squamous cell carcinoma, for example, the model assigns high importance to tumor cell markers panCK and MMP11 and immune cell markers CD45RA and CD10. panCK is a positive marker for carcinomas of epithelial origin 44. Matrix metalloproteinase-11 (MMP11) is secreted by stromal cells in the tumor microenvironment, and its overexpression correlates with tumor aggressiveness by inhibiting apoptosis and promoting the migration and invasion of cancer 45. CD45RA is expressed on naive T and B cells 46, while CD10 is primarily found on early B lymphocytes and certain T cell subsets 47, making both proteins reliable markers for identifying specific immune cell populations within the tumor and its microenvironment.
Regions of the tissue mostly populated by fibroblasts with interspersed immune cells show high attention weights for both stromal and immune markers. Vimentin (VIM) and smooth muscle actin (SMA) are canonical markers for fibroblasts and myofibroblasts 48, while Collagen I is associated with extracellular matrix production and stromal cell activation 49. CD248 (endosialin) expression in cancer is complex and context-dependent —while it is found on fibroblasts and pericytes in healthy tissue, its expression pattern and cellular localization can vary significantly between different carcinomas 50. Fittingly, its role in this region may reflect stromal components of the TIME.
Lastly, densely packed immune cells in the TIME exhibit strong attention to lymphocyte-specific markers. CD45RA and HLA-DR are key markers for immune cell identification and activation status, while CD20 specifically marks B lymphocytes. While histone H3 appears in the attention profile, as a structural component of chromatin it is present in all nucleated cells, making it more likely a general nuclear marker in this context rather than a specific indicator of cellular state.
VirTues learns biologically meaningful marker importance across various spatial regions without requiring knowledge of the underlying cell type composition during training. This explainability enables the validation of known biological relationships as well as the potential discovery of novel biomarkers and thus ultimately potential targets for drug development.
Retrieval via the Virtual Tissues database for clinical decision support
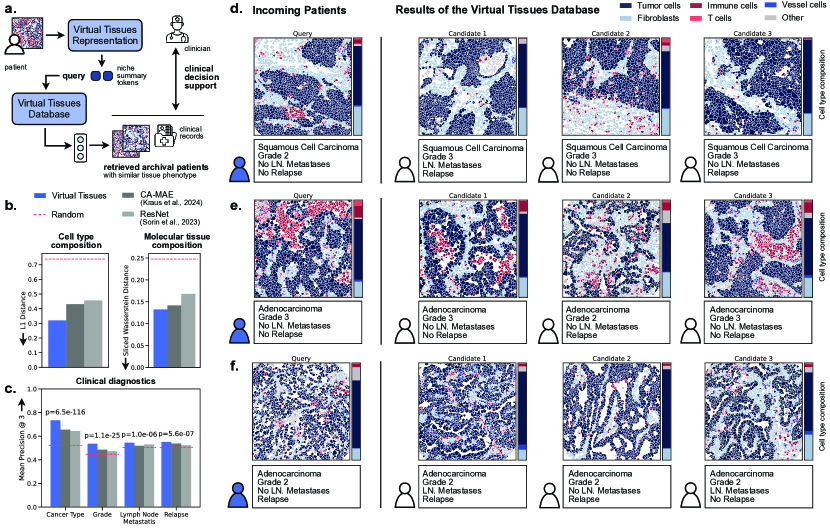
VirTues facilitates clinical decision support through a novel retrieval system that identifies similar cases from a database of previous patients (Fig. 4a). This system could enable clinicians to make informed decisions by comparing tissue phenotypes, applied therapies, and clinical outcomes across cases. Given a VirTues representation of a patient’s tissue through niche summary tokens that capture tissue composition, architecture and interactions between different cellular neighborhoods, the Virtual Tissue platform allows querying the VirTues Database for archival cases with similar molecular profiles. To achieve this, VirTues measures the structural similarity between virtual tissue embeddings using an optimal transport-based approach. Concretely, we compute the pairwise Wasserstein distance 51, 52 between the respective niche summary tokens of the query tissue and samples in the VirTues Database. Top-k matches, along with the clinical records of their corresponding patients are retrieved for clinical decision support.
Quantitative evaluation demonstrates superior performance in matching both cell type composition and molecular tissue structure compared to existing methods (i.e., ResNet7, CA-MAE16) and random retrievals. Concretely, we measure the L1 distance between normalized histograms of the cell type distributions in each patient sample. In our example of primary lung cancer tissue 18, VirTues significantly outperforms other methods 7, 16, 24 (Fig. 4b, left). To quantify the similarity in molecular tissue structure between query and retrieval samples, we introduce an optimal transport-based evaluation metric based on computing the sliced Wasserstein distance of the raw pixel values of the corresponding multiplex images 53 (see Methods for details). Again, VirTues retrieves archival patient samples whose molecular tissue composition is highly similar to the query (Fig. 4b, right). So while the retrieval is based on VirTues niche summary tokens, the similarity also holds with regards to other representations of the tissues, such as cell type annotations or raw images.
Further, we evaluate the similarity of the retrieved archival patients not only in terms of cell type and molecular tissue composition but also their associated clinical records. Concretely, we perform a McNemar test for each clinical label to compare the number of hits among the top three results achieved by VirTues with the number of hits for random retrieval. The model achieves significant improvements in critical clinical diagnostic tasks (Fig. 4c), including cancer type classification (P = 6.5e-116), grade determination (P = 1.1e-25), lymph node metastasis prediction (P = 1.0e-06) and relapse prediction (P = 5.6e-07).
Three case studies demonstrate VirTues’ ability to retrieve relevant matches across different cancer presentations: (1) A grade 2 squamous cell carcinoma case retrieving similar cases with varying lymph node metastasis and relapse outcomes (Fig. 4d), (2) a grade 3 adenocarcinoma case matching samples with similar tissue architecture and lymph node (LN) metastasis status but different clinical trajectories (Fig. 4e) and (3) a grade 2 adenocarcinoma case with lymph node metastasis and relapse, showing previous adenocarcinoma cases with comparable grades and tissue architectures (Fig. 4f). Each retrieved case includes a visualization of the cell type distribution (tumor, immune, vessel, fibroblast, T cells) and clinical annotations, enabling direct comparison of tissue architecture and outcomes. Further case studies are exhibited in Suppl. Fig. LABEL:suppfig:retrieval_examples_cords.
The systematic evaluation of VirTues’ retrieval capabilities demonstrates not only its ability to identify molecular similar tissue architectures but also the clinical relevance of these similarities, as evidenced by the concordance of retrieved cases’ clinical features and outcomes. Thus, by integrating molecular profiles, tissue architecture and clinical outcomes in a unified retrieval framework, VirTues provides the foundation for a data-driven comparison of tissue phenotypes across patient cohorts.
Virtual Tissues represent patient samples of previously unseen cancer type or disease
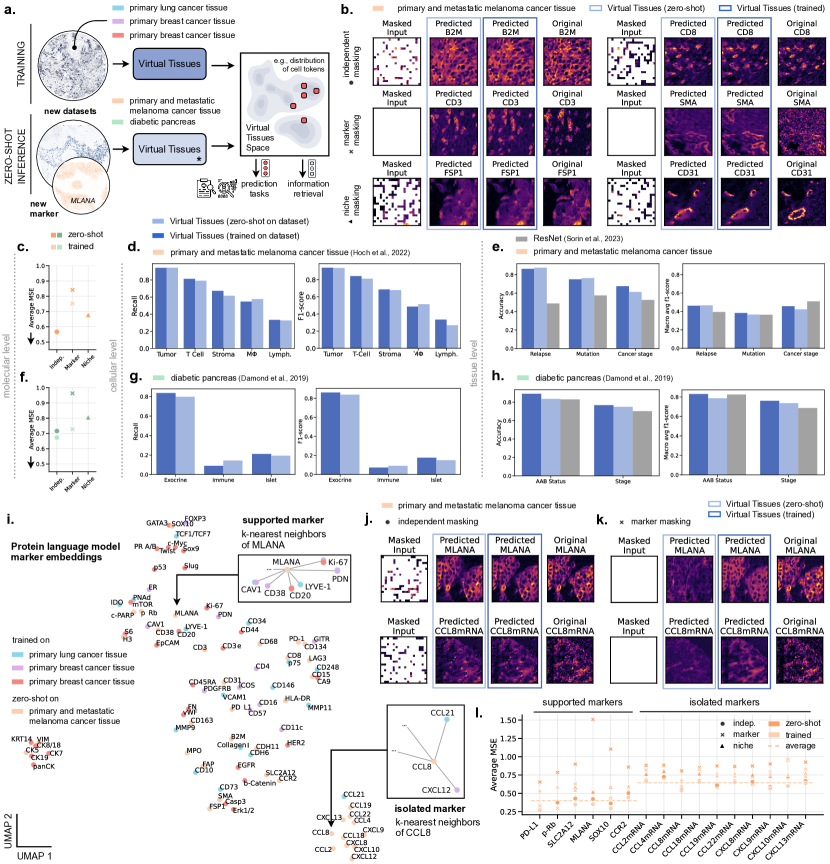
The rapid advancement of precision oncology and the emergence of new molecular disease subtypes require computational methods that can immediately analyze novel cancer types without the time-consuming process of collecting large training datasets and retraining models. This is particularly critical in clinical settings, where prompt analysis of rare cancers or newly characterized disease subtypes can directly impact treatment decisions. While most approaches require model updates or fine-tuning which risks overfitting and compromising the universality of learned representations, we demonstrate that VirTues achieves true zero-shot generalization to unseen cancer types and diseases (Fig. 5). When tested on new datasets including melanoma 19 and pancreatic tissue samples 19, the model maintains robust performance without any refinement, preserving tissue representation capabilities that are apparently universal across tissue types and downstream tasks.
Trained on primary breast 13, 17 and lung cancer tissue 18, VirTues directly maps primary and metastatic melanoma cancer samples into the Virtual Tissue space (Fig. 5a). To evaluate the VirTues Encoder, we analyze its reconstruction abilities in the zero-shot setting for different - previously described - masking strategies. The evaluation is conducted over the subset of markers in Hoch et al. 19 shared with the train datasets 13, 17, 18. Examples of different marker reconstructions are visible in Fig. 5b. Reconstruction results on further markers can be found in Suppl. Figs. LABEL:suppfig:mae_zeroshot_independent_hoch, LABEL:suppfig:mae_zeroshot_marker_hoch, and LABEL:suppfig:mae_zeroshot_niche_hoch. Quantifying the average MSE over all markers shows that the reconstruction performance for independent and niche masking is relatively stable across the trained (many-shot) or zero-shot setting. When masking an entire marker and thus any information on inter-marker correlation, the performance significantly drops (Fig. 5c, Suppl. Fig. LABEL:suppfig:mae_loss_zeroshot_known_channels). In independent and niche masking, spatial attention can leverage local spatial context and marker attention dynamically picks up correlations between markers to reconstruct missing regions. However, when an entire marker is masked, reconstruction relies solely on learned relations between markers from the training data. Unsurprisingly, in zero-shot settings, these may not fully generalize to novel cancer types where marker relationships could differ from the training distribution.
Most strikingly, quantitative evaluation shows strong performance in the biological discovery and clinical diagnostic tasks even in the zero-shot setting, i.e., cell type classification (Fig. 5d) and clinical feature prediction (Fig. 5e); for melanoma samples performance levels approach those achieved on trained datasets. At the cellular level, we compare the performance of VirTues (zero-shot) with VirTues (many-shot) on cell type classification (distinguishing lymphocytes, macrophages, stromal, T cell and tumor cells). VirTues (zero-shot) achieves F1-scores of 0.94 for tumor cells and 0.81 for T cells, as compared to VirTues (many-shot) achieving F1-scores of 0.94 and 0.84 respectively. Moreover, we notice that in macrophages, VirTues (zero-shot) outperforms VirTues (many-shot) achieving F1-scores of 0.51 and 0.48 respectively. At the tissue level, VirTues shows stronger performance than ResNet7 in general. VirTues (zero-shot) demonstrates superior performance, for example, in Relapse prediction (0.88 accuracy, improving performance by over 79.49% as compared to ResNet7), and Mutation prediction (0.76 accuracy, with relative performance improvement of 32.59% over ResNet7). Benchmarking here is reduced to ResNet7 in the tissue level as CA-MAE16 is not designed to operate in the zero-shot setting. As mentioned before, ResNet7 is restricted to niche- and tissue-level tasks.
Besides representing a completely new cancer type, we test VirTues’ capacity to create virtual tissues of a new disease, specifically, diabetic pancreas tissue 20. This dataset comprises multiplexed IMC data from 843 images from 12 human donors, including eight with type-1 diabetes (T1D), capturing the progression of T1D through comprehensive profiling of pancreatic tissue sections with 32 markers (Fig. LABEL:suppfig:overview_markers_with_damond). While the overall reconstruction performance of masked regions is lower (Fig. 5f) compared to zero-shot performance on a different cancer tissue type (Fig. 5c), the overall findings hold for T1D tissues. Reconstruction results on further markers can be found in Suppl. Figs. LABEL:suppfig:mae_zeroshot_independent_damond, LABEL:suppfig:mae_zeroshot_marker_damond, and LABEL:suppfig:mae_zeroshot_niche_damond. MAE losses for individual markers are shown in Suppl. Fig. LABEL:suppfig:mae_loss_zeroshot_known_channels.
Further, across tasks on the cellular and tissue level, the zero-shot performance of VirTues is on par with the many-shot setting (Fig. 5g,h). At the cellular level, we compare the performance of VirTues (zero-shot) with VirTues (many-shot) on cell type classification (distinguishing exocrine, immune, and islet cell populations). We note that the populations are highly imbalanced, with exocrine cells occupying 84.10% of all cells, while immune and islet cells occupy 3.17% and 12.73% respectively. VirTues (zero-shot) achieves an F1-score of 0.84 for exocrine cells and 0.15 for islet cells, as compared to VirTues (many-shot), which gets 0.84 and 0.18 respectively. Importantly, the overall performance in predicting the immune and islet class is low even in the many-shot setting, likely due to the overall limited amount of training data for these tasks. At the tissue level, VirTues (zero-shot) achieves an accuracy of 0.84 surpasses ResNet7, with an accuracy of 0.83, by 0.80% in AAB status classification, while VirTues (trained) achieves an accuracy of 0.89, and has a larger improvement of 7.50%. For the stage classification task, VirTues (zero-shot) achieves an accuracy of 0.75 outperforms ResNet7, with an accuracy of 0.70, by 6.72%, with VirTues (trained) achieving an accuracy of 0.77 and demonstrating an improvement of 9.25%.
Furthermore, the ability to reconstruct masked tissue regions and marker measurements and tackle prediction tasks across different physical scales of pancreatic tissue suggests that VirTues’ learned tissue representations capture fundamental biological patterns that generalize across diseases and organs.
Multi-scale design enables extrapolation to new markers
The ability to analyze new protein or RNA markers without model retraining is crucial for two key reasons: First, the rapid evolution of protein biomarker discovery in oncology continually identifies new molecular targets that could serve as diagnostic markers or therapeutic targets. While traditional approaches would require complete retraining with new datasets that contain additional markers, this creates an unacceptable delay in clinical translation. Second, different research studies and clinical applications focus on distinct aspects of tumor biology, necessitating flexible combinations and possibly measurement of new markers. A framework that requires retraining for each new marker would severely limit interoperability between studies.
A key innovation of the multi-scale design of VirTues is therefore its ability to incorporate new markers without retraining, enabling both rapid translation of novel biomarkers and integration of data across diverse scientific studies. A critical building block to achieve this is the integrated protein language model that operates on the molecular level of the VirTues architecture which allows zero-shot embedding of new markers. Concretely, VirTues leverages learned relationships between proteins captured in the embeddings of the PLM trained on millions of protein structures 54 to predict the behavior of new markers based on their molecular similarities and biological contexts 34. A UMAP of the PLM embedding of the different markers from the used datasets is displayed in Fig. 5i (see Suppl. Fig. LABEL:suppfig:esm_embeddings for UMAPs of individual datasets). As expected, proteins with similar structures (and functions) cluster together such as various cytokeratins or transcription factors in the bottom right and top of the UMAP, respectively.
We demonstrate VirTues’ capability to perform zero-shot embedding of new unseen markers, that are present in Hoch et al. 19 but absent from VirTues’ training datasets, in two different scenarios of increasing difficulty: First, we embed new proteins that are well supported by markers of highly similar PLM embeddings across training datasets. One such marker is Melan-A (MLANA), also known as melanoma antigen recognized by T cells 1 (MART-1), which contains a fragment that is bound by MHC class I complexes presented to T cells of the immune system (Fig. 5j,k). MLANA is well surrounded by markers such as PDN, cell surface receptor on T cells and B cells, or CD20 or CD38, cell surface molecules of immune cells. Second, increasing the difficulty, we test VirTues on integrating isolated markers that have only a few similar markers across the training datasets, e.g., CCL8-mRNA, the mRNA of a chemokine secreted by tumor-associated macrophages 55. Besides markers such as CCL21 present in Cords et al. 18 and CXCL12, present in Danenberg et al. 13, VirTues has not seen any further marker with related PLM embedding.
Analyzing VirTues ability to reconstruct new markers highlights the importance of VirTues’ multi-scale design: Despite not encountering MLANA (or other well-supported markers such as PD-L1, p-Rn, SLC2A12 and SOX10, see Fig. 5l), the model reaches the reconstruction performance of a version of VirTues that includes the Hoch et al. 19 dataset in training in the independent marking setting. The marker attention is able to process the combined marker and spatial token on the fly, given access to some unmasked patches of the new marker (Fig. 5j). In the setting where the entire marker is masked, VirTues can reconstruct the overall expression of the marker, however, not its intensity (Fig. 5k).
The result on CCL8-mRNA demonstrates that VirTues’ performance varies based on the information support available for new markers (Fig. 5j,k). While the overall trends in VirTues’ reconstruction ability follow the results in Fig. 5j,k on supported markers, the quality is lower the less supported a marker is: Fig. 5l shows all markers in Hoch et al. 19 that are not present in any of the training dataset sorted by the average distance to its 5 nearest neighbors in the PLM embedding space (Fig. 5i). The average squared reconstruction error thereby increases from 0.40 in supported markers to 0.67 in isolated markers. Results on further markers highlighted in Fig. 5l can be found in Suppl. Fig. LABEL:suppfig:mae_zeroshot_hoch_unknown.
This systematic analysis of VirTues’ ability to incorporate new markers reveals both the power and limitations of protein language model-guided marker extrapolation: While the model successfully generalizes to new markers that are molecularly similar to those in the training data, its performance decreases for more isolated markers. This behavior aligns with biological intuition—markers with similar molecular properties are more likely to exhibit related spatial distributions in tissues—and suggests that future improvements in protein language models could further enhance VirTues’ marker extrapolation capabilities.
Discussion
The development of the Virtual Tissues platform represents a new development in computational pathology, introducing a foundation model framework that addresses key challenges in analyzing multiplex imaging data while enabling new capabilities for biological discovery and clinical applications. Our results demonstrate that VirTues achieves three critical objectives: universal tissue representation across cancer types, diseases and organs, flexible incorporation of new molecular markers and interpretable multi-scale analysis from molecular to tissue levels.
A fundamental innovation of VirTues is its ability to generate virtual tissue representations that generalize across cancer types, diseases and organs without requiring retraining or fine-tuning. This capability is particularly valuable for rare cancers and newly characterized disease subtypes, where collecting large training datasets is impractical. The model’s robust zero-shot performance in both melanoma and pancreatic tissue analysis suggests that it captures fundamental biological patterns that transcend specific contexts. This universality is enabled by our novel transformer architecture that explicitly separates spatial and marker attention mechanisms, allowing the model to learn generalizable relationships between molecular markers while maintaining sensitivity to tissue-specific spatial patterns. The integration of protein language models at the molecular scale represents another key advancement, enabling VirTues to incorporate new markers without retraining. This capability is essential for keeping pace with rapid biomarker discovery and accommodating diverse research priorities that require different marker combinations. By leveraging learned protein relationships, VirTues can predict the behavior of novel markers based on their molecular similarities to known markers, as demonstrated with MLANA in melanoma tissue. The model’s ability to handle varying marker combinations also facilitates cross-study comparisons and meta-analyses.
VirTues’ multi-scale design, operating from molecular to tissue levels, provides a comprehensive framework for understanding complex biological systems. This hierarchical approach enables the model to capture how molecular and cellular patterns inform higher-level tissue structures that ultimately determine clinical outcomes. The model’s strong performance across cell type classification, tissue structure identification and clinical feature prediction demonstrates the value of this integrated analysis. Furthermore, the attention-based interpretability mechanisms provide biological insights by revealing critical spatial regions and marker relationships that influence predictions.
The potential clinical utility of VirTues is demonstrated through its retrieval system for clinical decision support. By enabling the identification of similar cases based on molecular and cellular patterns across different study designs, the system could assist in evidence-based clinical assessment. The improvements in matching tissue composition and predicting clinical outcomes suggest that VirTues captures biologically meaningful similarities between cases, though prospective clinical validation would be needed to confirm its utility in clinical decision-making or in selecting patients for clinical trials based on tissue architecture.
Despite these advances, several important limitations of our study should be acknowledged. While VirTues shows promising zero-shot performance, its effectiveness varies depending on the biological similarity between new markers and those in the training set. Performance degradation is particularly noticeable for markers lacking close biological relationships to the training data, as demonstrated by the CCL8 mRNA results. This suggests that the model’s generalization capabilities, while robust, are not unlimited.
Although our study incorporates data from five diverse cohorts spanning different cancer types and diabetes, further validation on larger and more diverse datasets is needed to fully assess VirTues’ scalability and generalization capabilities. While our current results demonstrate strong performance across these initial datasets, the exponential growth in multiplexed imaging data and the emergence of new experimental protocols may reveal additional challenges or limitations in the model’s architecture. This is particularly relevant for assessing the model’s performance across different experimental batches, tissue preparation methods and imaging platforms not represented in our current datasets. Our current implementation focuses primarily on protein and RNA markers. The generalizability to other molecular data types such as metabolomics or disease contexts remains to be fully evaluated. Additionally, the model’s performance on rare cell types or unusual tissue architectures may be limited by their underrepresentation in training data.
While our attention-based interpretability mechanisms provide valuable insights, they may not capture all biologically relevant features. The model’s decisions could be influenced by subtle patterns that are not easily interpretable through attention visualization alone. Furthermore, the clinical relevance of identified patterns requires validation through prospective studies.
Looking forward, several important research directions emerge. The framework could be expanded to handle additional imaging modalities and molecular data types. Methods to improve generalization for markers, which are rarely measured, could be developed through integration of additional protein structure and function information. The incorporation of temporal information could enhance understanding of disease progression and treatment responses, while the clinical decision support system could be enriched with additional metadata and outcome data to provide more comprehensive guidance.
VirTues’ ability to reconstruct fully masked markers through learned biological relationships opens intriguing possibilities for integration with generative AI approaches. While current virtual multiplexing methods focus on generating specific marker patterns from H&E images 56, 57, 58, 59, VirTues’ marker reconstruction capabilities could be leveraged to generate and validate synthetic multiplex data. The model’s understanding of marker relationships could help constrain generative processes to biologically plausible configurations, potentially improving the fidelity of virtual staining approaches. This synergy between reconstruction and generation could enable more robust and biologically accurate virtual multiplexing, particularly for markers that are challenging to measure experimentally.
VirTues represents a significant step toward the broader goal of creating universal computational models for biology that can seamlessly integrate diverse data types and generalize across biological contexts. As multiplex imaging technologies continue to evolve, frameworks like VirTues will become increasingly important for translating molecular insights into clinical applications.
References
- de Souza et al. 2024 Natalie de Souza, Shan Zhao, and Bernd Bodenmiller. Multiplex protein imaging in tumour biology. Nature Reviews Cancer, 24(3):171–191, 2024.
- Hanahan and Weinberg 2011 Douglas Hanahan and Robert A Weinberg. Hallmarks of cancer: the next generation. Cell, 144(5):646–674, 2011.
- Hanahan 2022 Douglas Hanahan. Hallmarks of cancer: new dimensions. Cancer Discovery, 12(1):31–46, 2022.
- Wang et al. 2023 Xiao Qian Wang, Esther Danenberg, Chiun-Sheng Huang, Daniel Egle, Maurizio Callari, Begoña Bermejo, Matteo Dugo, Claudio Zamagni, Marc Thill, Anton Anton, et al. Spatial predictors of immunotherapy response in triple-negative breast cancer. Nature, 621(7980):868–876, 2023.
- Phillips et al. 2021 Darci Phillips, Magdalena Matusiak, Belén Rivero Gutierrez, Salil S Bhate, Graham L Barlow, Sizun Jiang, Janos Demeter, Kimberly S Smythe, Robert H Pierce, Steven P Fling, et al. Immune cell topography predicts response to PD-1 blockade in cutaneous T cell lymphoma. Nature Communications, 12(1):6726, 2021.
- Radtke et al. 2024 Andrea J Radtke, Ekaterina Postovalova, Arina Varlamova, Alexander Bagaev, Maria Sorokina, Olga Kudryashova, Mark Meerson, Margarita Polyakova, Ilia Galkin, Viktor Svekolkin, et al. Multi-omic profiling of follicular lymphoma reveals changes in tissue architecture and enhanced stromal remodeling in high-risk patients. Cancer Cell, 42(3):444–463, 2024.
- Sorin et al. 2023 Mark Sorin, Morteza Rezanejad, Elham Karimi, Benoit Fiset, Lysanne Desharnais, Lucas JM Perus, Simon Milette, Miranda W Yu, Sarah M Maritan, Samuel Doré, et al. Single-cell spatial landscapes of the lung tumour immune microenvironment. Nature, 614(7948):548–554, 2023.
- Lin et al. 2023a Jia-Ren Lin, Yu-An Chen, Daniel Campton, Jeremy Cooper, Shannon Coy, Clarence Yapp, Juliann B Tefft, Erin McCarty, Keith L Ligon, Scott J Rodig, et al. High-plex immunofluorescence imaging and traditional histology of the same tissue section for discovering image-based biomarkers. Nature Cancer, 4(7):1036–1052, 2023a.
- Black et al. 2021 Sarah Black, Darci Phillips, John W Hickey, Julia Kennedy-Darling, Vishal G Venkataraaman, Nikolay Samusik, Yury Goltsev, Christian M Schürch, and Garry P Nolan. Codex multiplexed tissue imaging with dna-conjugated antibodies. Nature Protocols, 16(8):3802–3835, 2021.
- Giesen et al. 2014 Charlotte Giesen, Hao AO Wang, Denis Schapiro, Nevena Zivanovic, Andrea Jacobs, Bodo Hattendorf, Peter J Schüffler, Daniel Grolimund, Joachim M Buhmann, Simone Brandt, et al. Highly multiplexed imaging of tumor tissues with subcellular resolution by mass cytometry. Nature Methods, 11(4):417–422, 2014.
- Lewis et al. 2021 Sabrina M Lewis, Marie-Liesse Asselin-Labat, Quan Nguyen, Jean Berthelet, Xiao Tan, Verena C Wimmer, Delphine Merino, Kelly L Rogers, and Shalin H Naik. Spatial omics and multiplexed imaging to explore cancer biology. Nature methods, 18(9):997–1012, 2021.
- Nordmann et al. 2024 Thierry M. Nordmann, Andreas Mund, and Matthias Mann. A new understanding of tissue biology from MS-based proteomics at single-cell resolution. Nature Methods, 21:2220–2222, 2024.
- Danenberg et al. 2022 Esther Danenberg, Helen Bardwell, Vito RT Zanotelli, Elena Provenzano, Suet-Feung Chin, Oscar M Rueda, Andrew Green, Emad Rakha, Samuel Aparicio, Ian O Ellis, et al. Breast tumor microenvironment structures are associated with genomic features and clinical outcome. Nature Genetics, 54(5):660–669, 2022.
- Tsimberidou et al. 2023 Apostolia M Tsimberidou, Michael Kahle, Henry Hiep Vo, Mehmet A Baysal, Amber Johnson, and Funda Meric-Bernstam. Molecular tumour boards—current and future considerations for precision oncology. Nature Reviews Clinical Oncology, 20(12):843–863, 2023.
- Rigamonti et al. 2024 Alessandra Rigamonti, Marika Viatore, Rebecca Polidori, Daoud Rahal, Marco Erreni, Maria Rita Fumagalli, Damiano Zanini, Andrea Doni, Anna Rita Putignano, Paola Bossi, et al. Integrating AI-Powered Digital Pathology and Imaging Mass Cytometry Identifies Key Classifiers of Tumor Cells, Stroma, and Immune Cells in Non–Small Cell Lung Cancer. Cancer Research, 84(7):1165–1177, 2024.
- Kraus et al. 2024 Oren Kraus, Kian Kenyon-Dean, Saber Saberian, Maryam Fallah, Peter McLean, Jess Leung, Vasudev Sharma, Ayla Khan, Jia Balakrishnan, Safiye Celik, et al. Masked Autoencoders for Microscopy are Scalable Learners of Cellular Biology. In IEEE Conference on Computer Vision and Pattern Recognition (CVPR), pages 11757–11768, 2024.
- Jackson et al. 2020 Hartland W Jackson, Jana R Fischer, Vito RT Zanotelli, H Raza Ali, Robert Mechera, Savas D Soysal, Holger Moch, Simone Muenst, Zsuzsanna Varga, Walter P Weber, et al. The single-cell pathology landscape of breast cancer. Nature, 578(7796):615–620, 2020.
- Cords et al. 2023 Lena Cords, Sandra Tietscher, Tobias Anzeneder, Claus Langwieder, Martin Rees, Natalie de Souza, and Bernd Bodenmiller. Cancer-associated fibroblast classification in single-cell and spatial proteomics data. Nature Communications, 14(1):4294, 2023.
- Hoch et al. 2022 Tobias Hoch, Daniel Schulz, Nils Eling, Julia Martínez Gómez, Mitchell P Levesque, and Bernd Bodenmiller. Multiplexed imaging mass cytometry of the chemokine milieus in melanoma characterizes features of the response to immunotherapy. Science Immunology, 7(70):eabk1692, 2022.
- Damond et al. 2019 Nicolas Damond, Stefanie Engler, Vito RT Zanotelli, Denis Schapiro, Clive H Wasserfall, Irina Kusmartseva, Harry S Nick, Fabrizio Thorel, Pedro L Herrera, Mark A Atkinson, et al. A Map of Human Type 1 Diabetes Progression by Imaging Mass Cytometry. Cell Metabolism, 29(3):755–768, 2019.
- Chen et al. 2024 Richard J Chen, Tong Ding, Ming Y Lu, Drew FK Williamson, Guillaume Jaume, Andrew H Song, Bowen Chen, Andrew Zhang, Daniel Shao, Muhammad Shaban, et al. Towards a general-purpose foundation model for computational pathology. Nature Medicine, 30(3):850–862, 2024.
- Xu et al. 2024 Hanwen Xu, Naoto Usuyama, Jaspreet Bagga, Sheng Zhang, Rajesh Rao, Tristan Naumann, Cliff Wong, Zelalem Gero, Javier González, Yu Gu, et al. A whole-slide foundation model for digital pathology from real-world data. Nature, pages 1–8, 2024.
- Wang et al. 2024 Xiyue Wang, Junhan Zhao, Eliana Marostica, Wei Yuan, Jietian Jin, Jiayu Zhang, Ruijiang Li, Hongping Tang, Kanran Wang, Yu Li, et al. A pathology foundation model for cancer diagnosis and prognosis prediction. Nature, 634(8035):970–978, 2024.
- Kenyon-Dean et al. 2024 Kian Kenyon-Dean, Zitong Jerry Wang, John Urbanik, Konstantin Donhauser, Jason Hartford, Saber Saberian, Nil Sahin, Ihab Bendidi, Safiye Celik, Marta Fay, et al. ViTally Consistent: Scaling Biological Representation Learning for Cell Microscopy. arXiv preprint arXiv:2411.02572, 2024.
- Gupta et al. 2024 Ankit Gupta, Zoe Wefers, Konstantin Kahnert, Jan N Hansen, William D Leineweber, Anthony Cesnik, Dan Lu, Ulrika Axelsson, Frederic Ballllosera Navarro, Theofanis Karaletsos, et al. SubCell: Vision foundation models for microscopy capture single-cell biology. bioRxiv, 2024.
- Bao et al. 2023 Yujia Bao, Srinivasan Sivanandan, and Theofanis Karaletsos. Channel Vision Transformers: An Image Is Worth C x 16 x 16 Words. In International Conference on Learning Representations (ICLR), 2023.
- Bray et al. 2016 Mark-Anthony Bray, Shantanu Singh, Han Han, Chadwick T Davis, Blake Borgeson, Cathy Hartland, Maria Kost-Alimova, Sigrun M Gustafsdottir, Christopher C Gibson, and Anne E Carpenter. Cell Painting, a high-content image-based assay for morphological profiling using multiplexed fluorescent dyes. Nature Protocols, 11(9):1757–1774, 2016.
- Dosovitskiy et al. 2021 Alexey Dosovitskiy, Lucas Beyer, Alexander Kolesnikov, Dirk Weissenborn, Xiaohua Zhai, Thomas Unterthiner, Mostafa Dehghani, Matthias Minderer, Georg Heigold, Sylvain Gelly, Jakob Uszkoreit, and Neil Houlsby. An Image is Worth 16x16 Words: Transformers for Image Recognition at Scale. In International Conference on Learning Representations (ICLR), 2021.
- Bunne et al. 2024 Charlotte Bunne, Yusuf Roohani, Yanay Rosen, Ankit Gupta, Xikun Zhang, Marcel Roed, Theo Alexandrov, Mohammed AlQuraishi, Patricia Brennan, Daniel B. Burkhardt, Andrea Califano, Jonah Cool, Abby F. Dernburg, Kirsty Ewing, Emily B. Fox, Matthias Haury, Amy E. Herr, Eric Horvitz, Patrick D. Hsu, Viren Jain, Gregory R. Johnson, Thomas Kalil, David R. Kelley, Shana O. Kelley, Anna Kreshuk, Tim Mitchison, Stephani Otte, Jay Shendure, Nicholas J. Sofroniew, Fabian Theis, Christina V. Theodoris, Srigokul Upadhyayula, Marc Valer, Bo Wang, Eric Xing, Serena Yeung-Levy, Marinka Zitnik, Theofanis Karaletsos, Aviv Regev, Emma Lundberg, Jure Leskovec, and Stephen R. Quake. How to Build the Virtual Cell with Artificial Intelligence: Priorities and Opportunities. arXiv Preprint arXiv:2409.11654, 2024.
- Hickey et al. 2024 John W Hickey, Eran Agmon, Nina Horowitz, Tze-Kai Tan, Matthew Lamore, John B Sunwoo, Markus W Covert, and Garry P Nolan. Integrating multiplexed imaging and multiscale modeling identifies tumor phenotype conversion as a critical component of therapeutic T cell efficacy. Cell Systems, 15(4):322–338, 2024.
- Doron et al. 2023 Michael Doron, Théo Moutakanni, Zitong S Chen, Nikita Moshkov, Mathilde Caron, Hugo Touvron, Piotr Bojanowski, Wolfgang M Pernice, and Juan C Caicedo. Unbiased single-cell morphology with self-supervised vision transformers. bioRxiv, 2023.
- Vaswani et al. 2017 Ashish Vaswani, Noam Shazeer, Niki Parmar, Jakob Uszkoreit, Llion Jones, Aidan N Gomez, Ł ukasz Kaiser, and Illia Polosukhin. Attention is All you Need. In Advances in Neural Information Processing Systems (NeurIPS), volume 30, 2017.
- Bertasius et al. 2021 Gedas Bertasius, Heng Wang, and Lorenzo Torresani. Is Space-Time Attention All You Need for Video Understanding? In International Conference on Machine Learning (ICML), volume 139, pages 813–824. PMLR, 2021.
- Rosen et al. 2023 Yanay Rosen, Yusuf Roohani, Ayush Agarwal, Leon Samotorčan, Tabula Sapiens Consortium, Stephen R Quake, and Jure Leskovec. Universal Cell Embeddings: A Foundation Model for Cell Biology. bioRxiv, pages 2023–11, 2023.
- He et al. 2022 Kaiming He, Xinlei Chen, Saining Xie, Yanghao Li, Piotr Dollár, and Ross Girshick. Masked Autoencoders Are Scalable Vision Learners. In IEEE Conference on Computer Vision and Pattern Recognition (CVPR), pages 16000–16009, 2022.
- Balestriero et al. 2023 Randall Balestriero, Mark Ibrahim, Vlad Sobal, Ari Morcos, Shashank Shekhar, Tom Goldstein, Florian Bordes, Adrien Bardes, Gregoire Mialon, Yuandong Tian, Avi Schwarzschild, Andrew Gordon Wilson, Jonas Geiping, Quentin Garrido, Pierre Fernandez, Amir Bar, Hamed Pirsiavash, Yann LeCun, and Micah Goldblum. A Cookbook of Self-Supervised Learning. arXiv preprint arXiv:2304.12210, 2023.
- Ilse et al. 2018 Maximilian Ilse, Jakub Tomczak, and Max Welling. Attention-based Deep Multiple Instance Learning. In International Conference on Machine Learning (ICML), pages 2127–2136. PMLR, 2018.
- Fridman et al. 2017 Wolf H Fridman, Laurence Zitvogel, Catherine Sautès-Fridman, and Guido Kroemer. The immune contexture in cancer prognosis and treatment. Nature Reviews Clinical Oncology, 14(12):717–734, 2017.
- Valkenburg et al. 2018 Kenneth C Valkenburg, Amber E De Groot, and Kenneth J Pienta. Targeting the tumour stroma to improve cancer therapy. Nature Reviews Clinical Oncology, 15(6):366–381, 2018.
- Semba and Ishimoto 2024 Takashi Semba and Takatsugu Ishimoto. Spatial analysis by current multiplexed imaging technologies for the molecular characterisation of cancer tissues. British Journal of Cancer, pages 1–11, 2024.
- Jaume et al. 2024 Guillaume Jaume, Lukas Oldenburg, Anurag Vaidya, Richard J Chen, Drew FK Williamson, Thomas Peeters, Andrew H Song, and Faisal Mahmood. Transcriptomics-guided slide representation learning in computational pathology. In IEEE Conference on Computer Vision and Pattern Recognition (CVPR), pages 9632–9644, 2024.
- Liu et al. 2023 Candace C Liu, Noah F Greenwald, Alex Kong, Erin F McCaffrey, Ke Xuan Leow, Dunja Mrdjen, Bryan J Cannon, Josef Lorenz Rumberger, Sricharan Reddy Varra, and Michael Angelo. Robust phenotyping of highly multiplexed tissue imaging data using pixel-level clustering. Nature Communications, 14(1):4618, 2023.
- Gut et al. 2018 Gabriele Gut, Markus D Herrmann, and Lucas Pelkmans. Multiplexed protein maps link subcellular organization to cellular states. Science, 361(6401):eaar7042, 2018.
- Lu et al. 2016 Si-Hong Lu, Wen-Sy Tsai, Ying-Hsu Chang, Teh-Ying Chou, See-Tong Pang, Po-Hung Lin, Chun-Ming Tsai, and Ying-Chih Chang. Identifying cancer origin using circulating tumor cells. Cancer Biology & Therapy, 17(4):430–438, 2016.
- Ma et al. 2021 Bing Ma, Rui Ran, Hai-Yang Liao, and Hai-Hong Zhang. The paradoxical role of matrix metalloproteinase-11 in cancer. Biomedicine & Pharmacotherapy, 141:111899, 2021.
- Tian et al. 2017 Yuan Tian, Mariana Babor, Jerome Lane, Veronique Schulten, Veena S Patil, Grégory Seumois, Sandy L Rosales, Zheng Fu, Gaelle Picarda, Julie Burel, et al. Unique phenotypes and clonal expansions of human CD4 effector memory T cells re-expressing CD45RA. Nature Communications, 8(1):1473, 2017.
- Louhichi et al. 2018 Tahani Louhichi, Hanene Saad, Myriam Ben Dhiab, Sonia Ziadi, and Mounir Trimeche. Stromal CD10 expression in breast cancer correlates with tumor invasion and cancer stem cell phenotype. BMC Cancer, 18:1–9, 2018.
- Kalluri and Zeisberg 2006 Raghu Kalluri and Michael Zeisberg. Fibroblasts in cancer. Nature Reviews Cancer, 6(5):392–401, 2006.
- Tommelein et al. 2015 Joke Tommelein, Laurine Verset, Tom Boterberg, Pieter Demetter, Marc Bracke, and Olivier De Wever. Cancer-associated fibroblasts connect metastasis-promoting communication in colorectal cancer. Frontiers in Oncology, 5:63, 2015.
- Rybinski et al. 2015 Katherine Rybinski, Hongxia Z Imtiyaz, Barrie Mittica, Brian Drozdowski, James Fulmer, Keiji Furuuchi, Shawn Fernando, Marianne Henry, Qimin Chao, Brad Kline, et al. Targeting endosialin/CD248 through antibody-mediated internalization results in impaired pericyte maturation and dysfunctional tumor microvasculature. Oncotarget, 6(28):25429, 2015.
- Cuturi 2013 Marco Cuturi. Sinkhorn Distances: Lightspeed Computation of Optimal Transport. Advances in Neural Information Processing Systems (NeurIPS), 26, 2013.
- Peyré et al. 2019 Gabriel Peyré, Marco Cuturi, et al. Computational Optimal Transport. Foundations and Trends® in Machine Learning, 11(5-6):355–607, 2019.
- Bonneel et al. 2015 Nicolas Bonneel, Julien Rabin, Gabriel Peyré, and Hanspeter Pfister. Sliced and Radon Wasserstein Barycenters of Measures. Journal of Mathematical Imaging and Vision, 51:22–45, 2015.
- Lin et al. 2023b Zeming Lin, Halil Akin, Roshan Rao, Brian Hie, Zhongkai Zhu, Wenting Lu, Nikita Smetanin, Robert Verkuil, Ori Kabeli, Yaniv Shmueli, Allan dos Santos Costa, Maryam Fazel-Zarandi, Tom Sercu, Salvatore Candido, and Alexander Rives. Evolutionary-scale prediction of atomic-level protein structure with a language model. Science, 379(6637):1123–1130, 2023b.
- Zhang et al. 2020 Xiang Zhang, Lu Chen, Wei-qi Dang, Mian-fu Cao, Jing-fang Xiao, Sheng-qing Lv, Wen-jie Jiang, Xiao-hong Yao, Hui-min Lu, Jing-ya Miao, et al. CCL8 secreted by tumor-associated macrophages promotes invasion and stemness of glioblastoma cells via ERK1/2 signaling. Laboratory Investigation, 100(4):619–629, 2020.
- Pati et al. 2024 Pushpak Pati, Sofia Karkampouna, Francesco Bonollo, Eva Compérat, Martina Radić, Martin Spahn, Adriano Martinelli, Martin Wartenberg, Marianna Kruithof-de Julio, and Marianna Rapsomaniki. Accelerating histopathology workflows with generative AI-based virtually multiplexed tumour profiling. Nature Machine Intelligence, 6(9):1077–1093, 2024.
- Wu et al. 2024 Eric Wu, Matthew Bieniosek, Zhenqin Wu, Nitya Thakkar, Gregory W Charville, Ahmad Makky, Christian Schürch, Jeroen R Huyghe, Ulrike Peters, Christopher I Li, et al. ROSIE: AI generation of multiplex immunofluorescence staining from histopathology images. bioRxiv, 2024.
- Pizurica et al. 2024 Marija Pizurica, Yuanning Zheng, Francisco Carrillo-Perez, Humaira Noor, Wei Yao, Christian Wohlfart, Antoaneta Vladimirova, Kathleen Marchal, and Olivier Gevaert. Digital profiling of gene expression from histology images with linearized attention. Nature Communications, 15(1):9886, 2024.
- Andani et al. 2024 Sonali Andani, Boqi Chen, Joanna Ficek-Pascual, Simon Heinke, Ruben Casanova, Bernard Hild, Bettina Sobottka, Bernd Bodenmiller, Tumor Profiler Consortium, Viktor H Koelzer, et al. HistoPlexer: Histopathology-based Protein Multiplex Generation using Deep Learning. medRxiv, 2024.
- Su et al. 2024 Jianlin Su, Murtadha Ahmed, Yu Lu, Shengfeng Pan, Wen Bo, and Yunfeng Liu. Roformer: Enhanced transformer with rotary position embedding. Neurocomputing, 568:127063, 2024.
- Xiong et al. 2020 Ruibin Xiong, Yunchang Yang, Di He, Kai Zheng, Shuxin Zheng, Chen Xing, Huishuai Zhang, Yanyan Lan, Liwei Wang, and Tieyan Liu. On layer normalization in the transformer architecture. In International Conference on Machine Learning (ICML), pages 10524–10533. PMLR, 2020.
- Lefaudeux et al. 2022 Benjamin Lefaudeux, Francisco Massa, Diana Liskovich, Wenhan Xiong, Vittorio Caggiano, Sean Naren, Min Xu, Jieru Hu, Marta Tintore, Susan Zhang, Patrick Labatut, Daniel Haziza, Luca Wehrstedt, Jeremy Reizenstein, and Grigory Sizov. xFormers: A modular and hackable Transformer modelling library. https://github.com/facebookresearch/xformers, 2022.
- Vincent et al. 2008 Pascal Vincent, Hugo Larochelle, Yoshua Bengio, and Pierre-Antoine Manzagol. Extracting and Composing Robust Features with Denoising Autoencoders. In IEEE Conference on Computer Vision and Pattern Recognition (CVPR), pages 1096–1103, 2008.
- Kingma 2014 Diederik P Kingma. Adam: A Method for Stochastic Optimization. arXiv preprint arXiv:1412.6980, 2014.
- Heumos et al. 2023 Lukas Heumos, Anna C Schaar, Christopher Lance, Anastasia Litinetskaya, Felix Drost, Luke Zappia, Malte D Lücken, Daniel C Strobl, Juan Henao, Fabiola Curion, et al. Best practices for single-cell analysis across modalities. Nature Reviews Genetics, 24(8):550–572, 2023.
- Sypetkowski et al. 2023 Maciej Sypetkowski, Morteza Rezanejad, Saber Saberian, Oren Kraus, John Urbanik, James Taylor, Ben Mabey, Mason Victors, Jason Yosinski, Alborz Rezazadeh Sereshkeh, et al. RxRx1: A Dataset for Evaluating Experimental Batch Correction Methods. In IEEE Conference on Computer Vision and Pattern Recognition (CVPR), pages 4285–4294, 2023.
- He et al. 2016 Kaiming He, Xiangyu Zhang, Shaoqing Ren, and Jian Sun. Deep residual learning for image recognition. In IEEE Conference on Computer Vision and Pattern Recognition (CVPR), pages 770–778, 2016.
- Deng et al. 2009 Jia Deng, Wei Dong, Richard Socher, Li-Jia Li, Kai Li, and Li Fei-Fei. ImageNet: A large-scale hierarchical image database. In IEEE Conference on Computer Vision and Pattern Recognition (CVPR), pages 248–255, 2009.
- Chawla et al. 2002 Nitesh V Chawla, Kevin W Bowyer, Lawrence O Hall, and W Philip Kegelmeyer. SMOTE: Synthetic Minority Over-sampling Technique. Journal of Artificial Intelligence Research, 16:321–357, 2002.
Methods
VirTues architecture
Multiplexed imaging data poses modality-specific challenges to the development of scalable machine learning algorithms. The images represent high-dimensional samples, characterized by a large number of measured channels and high spatial resolutions. On the contrary, the number of samples per dataset in terms of entire images and patients is relatively small. Further, the total number as well as the combination of channels varies between datasets as studies use different marker panels. These characteristics of the data modality hinder the simple off-the-shelf application of established vision architectures. Both CNNs and standard Vision Transformers require a constant number of input channels, typically RGB, with a fixed semantic meaning. Moreover, in contrast to RGB channels, which combine to produce colors, multiplex channels convey distinct biological meanings and exhibit complex interrelationships. To address the unique challenges posed by multiplex imaging data, we propose VirTues, an encoder-decoder model based on the ViT architecture. VirTues is designed for the efficient processing of highly-multiplexed image data accommodating varying numbers and combinations of measured markers. Furthermore, VirTues incorporates the attribution of distinct biological meaning to each measured marker. VirTues operates on tokenized image crops of size , capturing tissue niches. Restricting VirTues’ input to such crops increases the number and diversity of pretraining samples while decreasing the dimensionality per sample.
Tokenization.
To preserve the biologically distinct meaning of each channel and allow for a flexible number of channels per image, we employ a multi-channel tokenization procedure 16, 26. Each channel is spatially divided into patches of size , since this approximately captures one cell per patch. Flattening each patch results in a three-dimensional grid of image tokens , where is the number of measured markers and the grid height resp. width. For all markers, we retrieve from a precomputed lookup table the corresponding protein embeddings given by the PLM (ESM-254 with ). We refer to these embeddings as marker tokens. For each channel and each grid position , we project the image token and the corresponding marker token to the same dimension using learnable linear projections, to get and respectively. The image and marker tokens are fused through summation, resulting in the image tokens , where . The fusion of the marker token with the image tokens serves two main purposes: (1) enabling VirTues to differentiate the channel origins of input tokens, and (2) introducing an inductive bias regarding the marker function, which cannot be added through other marker tokenization schemes (such as one-hot or learnable marker embeddings). We note that this is the first of many building blocks enabling VirTues to generalize across unseen markers. Further, to allow VirTues to capture an aggregated representation for each patch, we introduce an additional layer of learnable cell summary tokens , one for each spatial position. Each cell summary token is initialized using the same weights.
Masking.
During training, a portion of the image tokens is masked by replacing them with a special masking token initialized with learnable weights. Masking is applied channel-wise by sampling a masking ratio between 60% and 100% and uniformly selecting the corresponding tokens to mask within the channel. We denote the resulting 3D binary mask by , where the value marks masking. Masked tokens remain linked to their specific markers, which is indicated by adding the marker tokens to the masked tokens.
VirTues Encoder.
The set of all non-masked image tokens and the set of cell summary tokens is passed as an input to the VirTues Encoder. This encoder is constructed by modifying the vision transformer’s architecture 28, to adapt it to work with varying input channels efficiently, and capture marker correlations and spatial patterns separately. In contrast to standard Vision Transformers, which use full multi-head self-attention where all tokens attend pairwise to each other (Fig. 1e), we use two specialized sparse multi-head self-attention mechanisms, marker attention and channel attention, (Fig. 1d) akin to space and time attention employed in video transformers33. In marker attention, only tokens which are placed at the same spatial grid position attend to each other, thereby capturing inter-marker dependencies and correlations. We denote the set of input tokens to the -th transformer block as , where the token is associated to the -th channel and position . In this notation, we treat the layer of cell summary tokens simply as a further channel. Then, a marker attention transformer block computes
where MHSA denotes a transformer block with standard multi-head self-attention. In contrast, in channel attention, only tokens present in the same channel attend to each other, hence capturing spatial patterns across tissue. Following the notation for marker attention, a channel attention transformer block computes as
The VirTues Encoder architecture consists of a sequence of transformer blocks, which alternate between blocks that use marker and channel attention. Each of the transformer blocks uses attention heads. Spatial positions are encoded using 2D rotatory position embeddings 60. Further, we use pre-layer normalization61.
The VirTues Encoder outputs a set of encoded image tokens and a set of encoded cell summary tokens .
VirTues Decoder.
The VirTues Decoder is used during training and inference to reconstruct the original image. It is comprised of a Vision Transformer28 followed by a single linear projection. To reconstruct the original image, the encoded tokens , the encoded cell summary tokens and the masked tokens are regrouped as follows: For each channel , we group the encoded and the masked tokens of that channel with a copy of the encoded cell summary tokens:
These groups of tokens are passed individually to the decoder one by one. Hence, in the decoder tokens of different channels do not interact with each other. This design is intended to force the decoder to extract the majority of the information to reconstruct each channel from the cell summary tokens rather than relying on other channels and thus incentivize the encoder to store a meaningful representation in these. This regrouping further limits the individual token set sizes to , thus allowing us to use full multi-head self-attention instead of marker and channel attention. Processing all tokens by the decoder’s transformer followed by the linear projection yields the final grid of reconstructed image tokens .
Following He et al. 35, we setup the encoder-decoder framework in an asymmetric fashion, where the size of encoder is deeper than the decoder, allowing the major workload of the model to rely on the encoder rather than the decoder. We construct a shallow decoder consisting of 4 transformer blocks with full attention (in contrast to 16 transformer blocks in the encoder with alternating marker and channel attention). Similar to the encoder, we use 2D rotatory position embeddings60 to encode spatial positions and pre-layer normalization61 in the decoder.
Aggregation into niche and tissue level representations.
During inference, VirTues Encoder represents each image crop as a grid of cell summary tokens . To process an entire tissue, the multiplexed image is divided into non-overlapping crops, each representing a niche, which are then embedded individually. Niche or tissue level representations are obtained by aggregating all encoded cell summary tokens from the crop or the full image, respectively. For unsupervised tasks, such as the retrieval experiments in Figure 4, a simple average is used for aggregation, generating task-agnostic embeddings. In supervised settings, a dynamically weighted average is employed, achieved by training an attention-based multiple instance learning classifier 37 on the given task (while the parameters of VirTues’ are kept frozen), generating task-specific embeddings. This attention weighted average computes as
where and are learnable weights, is the sigmoid activation function and indicates element-wise multiplication. In a multi-head setting, this computation is repeated for each head with a different weight vector and the resulting representations are concatenated. Per default, we use 4 heads.
Implementation details.
To efficiently implement marker and channel attention, we reduce these mechanisms to full attention by merging either the spatial or channel axis of the batched token tensor with the batch axis, allowing subsets of tokens that attend to each other to be treated as independent sequences. During inference without masking, this reduction leverages built-in, hardware-optimized implementations of standard self-attention. However, during training, channel-wise independent masking with varying ratios and channel dropout lead to token sequences in the marker and channel attention blocks having variable lengths. This variability poses a technical challenge because efficient built-in PyTorch attention mechanisms require uniform sequence lengths within a batch. To avoid the computational overhead of adding padding tokens, we employ a dynamic re-packaging strategy in conjunction with xFormers’ 62 support for block-diagonal masked self-attention. Non-masked tokens within a batch are repacked into a single sequence, preserving coherent subsequences of tokens that belong to the same sample and channel or spatial position. A block-diagonal mask is generated dynamically to indicate the subsequences, specifying which tokens can attend to each other. The repacked sequence and associated mask are processed using xFormers’ masked self-attention implementation.
VirTues pretraining
Loss function.
VirTues is trained end-to-end to reconstruct image crops in a masked auto-encoding framework35, 63. Our reconstruction loss is the mean squared error between the reconstructed pixels’ intensity values and the original pixels’ intensity values, i.e.,
Note that this loss is computed over all pixels of both masked and non-masked tokens.
Data augmentation.
Before training, we first randomly sample from each tissue image 4 subimages of dimension 256 256, where is the number of 128 128 crops within the tissue image. During training, each size 128 128 is subsampled uniformly at random from a randomly chosen subimage. Such a hierarchical two-step subsampling method approximates randomly sampling crops uniformly at random from the whole image, while avoiding an I/O-bottleneck while training. We further apply random rotations and flips to each selected crop. Moreover, to ensure VirTues learns representations robust to varying combinations of markers, and enhance its ability to generalize to unseen datasets and markers, we also randomly drop up to 25% of input channels randomly, and exclude them from the training sample.
Optimization.
We train VirTues for 3000 epochs using AdamW 64 with an effective batch size of 128, achieved by accumulating gradients over 8 mini-batches. Each epoch involves iterating over one random crop from each training image. A weight decay, applied to all weights except biases and Layer Normalization terms, follows a cosine schedule from 0.04 to 0.4. The learning rate is initialized with a linear warmup over 10 epochs, followed by a cosine schedule from to . Training employs automatic mixed precision. Gradients are clipped to a maximum norm of 1.0.
Datasets for VirTues development
Dataset curation.
For training VirTues, we curated four publicly available image mass cytometry datasets, each mapping the spatial organization of tumor microenvironments across various cancer types and tissue sites. The Cords et al. 18 dataset contains samples of non-small cell lung cancer, Jackson et al. 17 and Danenberg et al. 13 focus on breast cancer tissues, and Hoch et al. 19 examines primary and metastatic melanoma tissues. Images smaller than 256 256 pixels were excluded, resulting in a total of 3,473 distinct images. Each dataset was split into an 80%-20% train-test partition, grouped by patient identities. For each dataset, we compiled a list of markers corresponding to the image channels. We identified the amino acid sequence for each marker and computed its ESM-2 54 embedding. For mRNA markers, we used the sequences of the encoded proteins.
To evaluate the generalization ability of VirTues to a new disease and tissue type, we prepared in a similar manner an additional fifth dataset based on the study of Damond et al. 20, which examines pancreatic tissue sections from both type 1 diabetic and healthy donors.
An overview of all used IMC datasets, their sample sizes in terms of patients, images and cells, as well as available and used annotations can be found in Suppl. Table LABEL:table:datasets.
Dataset preprocessing.
For each image, intensity values are clipped channel-wise at the 99th percentile, followed by a shifted logarithm transformation with a size factor of 1, as commonly applied to scRNA-seq count data 65. Additionally, a Gaussian blur filter with a kernel size of 3 and unit variance is used to smooth each image. Finally, each image is self-standardized channel-wise 66, 16.
Evaluation
VirTues model instances.
In total we have 5 datasets, 4 of which are cancer IMC datasets 18, 13, 17, 19, while Damond et al. 20 is a pancreatic tissue IMC dataset. Unless stated otherwise, the default VirTues model is trained on all 4 cancer IMC datasets and is used in most experiments. To showcase the benefit of training on multiple datasets, we train a second instance of VirTues on Danenberg et al. 13 only (Fig. 3d). A third instance of VirTues is trained on Cords et al. 18, Danenberg et al. 13 and Jackson et al. 17, for benchmarking performance of zero-shot VirTues on Hoch et al. 19 (Fig 5d,e). Finally, as a reference baseline for the zero-shot experiments on Damond et al. 20 (Fig 5f,g), we train VirTues on all 5 IMC datasets.
Comparisons and baselines.
We compare VirTues primarily with two baselines: (1) ResNet7 and (2) CA-MAE16. We utilize a pretrained ResNet7 based on the approach described by Sorin et al. 7. Specifically, each channel is individually embedded using the ResNet50 67 architecture, pretrained on ImageNet-1K 68, where each channel is duplicated thrice to match the input dimension. The resulting ResNet50 embeddings are then projected channel-wise to their 16 principal components and concatenated to generate the crop representation. We specifically choose the top 16 prinicipal components, so that the final crop representation retains approximately the same dimension as VirTues’. Since ResNet is a convolutional neural network that generates niche level representations directly and is thus unable to embed patches at the cellular level. Hence, we compare against ResNet7 only for niche-level and tissue-level tasks. Furthermore, since it utilizes a pretrained network and is channel-agnostic, we also compare against it for zero-shot tasks. Secondly, we use a channel-agnostic masked autoencoder proposed by Kraus et al. 16. This model adopts a multi-channel tokenization strategy and an encoder-decoder framework similar to VirTues, but with key differences: each channel is assigned a separate decoder, marker identities are not encoded in the tokenization, and full attention is utilized. These design choices restrict the model’s capability to scale to a large number of channels, imposes efficiency issues and hinders the model’s ability to zero-shot to unseen markers or datasets. We pretrain CA-MAE16 with the reconstruction objective and procedure described in Kraus et al. 16, setting the patch size to 8 to capture information at the cellular scale. Further, we train CA-MAE16 for each dataset separately addressing scaling issues and mitigating the computational bottlenecks caused by the unequal representation of channels in datasets, which would otherwise lead to a disproportionate increase in model parameters without a corresponding increase in data. From Fig. 1e, we notice that the number of parameters in VirTues is already 25 less than CA-MAE16 for 40 markers. CA-MAE16 can be used to generate both cell-level and niche-level representations. For cell-level representations, we average the embedded tokens along the channel dimension. For self-supervised niche-level representations, we take the average of all embedded tokens of the crop.
Masked reconstructions.
We evaluate VirTues’ understanding of molecular tissue structure and biological relationships between markers by assessing the reconstruction ability of VirTues for three different masking strategies: independent masking, marker masking and niche masking. For independent masking (Fig. 2a,b and Suppl. Figs. LABEL:suppfig:mae_independent_cords-LABEL:suppfig:mae_independent_hoch), we sample a masking ratio independently for each channel in the input image, uniformly between 60% and 100% and mask the corresponding number of patches. This strategy allows the model to leverage both spatial patterns and marker relationships to reconstruct the masked regions, aligning with the masking used during training. For marker masking (Fig. 2c,d and Suppl. Figs. LABEL:suppfig:mae_marker_cords-LABEL:suppfig:mae_marker_hoch), we select a single marker from the input image and mask all corresponding patches. This approach enables us to evaluate VirTues’ understanding of marker correlations is isolation of its spatial understanding. In reverse, niche masking (Fig. 2e,f and Suppl. Figs. LABEL:suppfig:mae_niche_cords-LABEL:suppfig:mae_niche_hoch) is designed to analyze VirTues’ understanding of spatial structures. For each image, we sample a single masking ratio uniformly between 60% and 100% and use this ratio to select the corresponding number of grid positions, where we mask all patches across all channels. We emphasize that in all three masking strategies, channel dropout is not applied during the evaluation phase. To quantify the reconstruction ability, we compute the average mean squared reconstruction error on the test images, per dataset, marker and masking strategy (Fig. 2g and Suppl. Fig. LABEL:suppfig:reconstruction_losses_with_damond). In contrast to the training loss, we compute the reconstruction error for the masked tokens’ pixels only to ensure comparability across masking strategies, despite varying relative masking ratios.
Cell level tasks.
Previous work on IMC image-based learning 7 fails to decode cell types at a cellular scale. In contrast, VirTues demonstrates the ability to: (1) identify the most common cell type within each patch through linear probing with cell-level supervision and (2) highlight key cellular regions, such as tumor areas, contributing to cancer via spatial attention maps, achieved through tissue-level fine-tuning (see Fig. 3h,i). We benchmark the performance of VirTues against CA-MAE16 in identifying the most common cell type within a patch, and in turn their ability to capture biologically meaningful signals. This evaluation spans multiple datasets—Cords et al. 18, Danenberg et al. 13, Hoch et al. 19 and Damond et al. 20 —and, for Cords et al. 18, is performed at two levels of class granularity. These datasets include pixel-wise cell instance segmentation masks and tabular single-cell annotations with phenotype labels. From this metadata, we generate pixel-wise cell type masks, assigning empty pixels (those without a cell) to a separate class. Patch labels are determined by the mode of all pixel labels within each patch.
For the prediction task, we perform linear probing using a logistic regression model with an L-BFGS solver and L2 regularization with coefficient . This ensures the evaluation focuses on the quality of the learned representations rather than the complexity or configuration of the classifier. Since the datasets contain millions of cells, we subsample the patches by randomly sampling 5 crops from each image in the train and test cohort, and further subsampling 100 patches randomly at uniform from them. We keep these patches consistent across VirTues and CA-MAE16. We drop all those patches which have no assigned label or have an unknown or ambiguous label. For Danenberg et al. 13, we regroup the highly nuanced phenotypes provided by the authors into seven high-level categories, filtering out antigen-presenting cells. Similar, we regroup phenotypes provided by Hoch et al. 19 into five high-level categories. The mappings to regroup the phenotypes can be found in Suppl. Tables LABEL:table:mapping_celltype_danenberg and LABEL:table:mapping_celltype_hoch. We avoid resampling strategies as applying them solely to the training set did not yield noticeable performance improvements, except for Damond et al. 20, where we use SMOTE69 to augment the training data for the minority class, and randomly undersample exocrine cells. Each task is treated as multi-class classification, and we report the recall and F1-score per class. The patches are also inherently imbalanced, and we show the cell counts in the test set in Fig. LABEL:suppfig:cellular-task-supports. The labels for each task are as follows:
-
•
Primary lung cancer tissue18 (cell type, coarse): 5 classes, namely tumor, fibroblast, immune, T cell and vessel.
-
•
Primary lung cancer tissue 18 (cell type, fine-grained): 21 classes, namely B cell, blood, CD4, CD8, collagen CAF, HEV, hypoxic tumor, IDO CAF, lymphatic, myeloid, neutrophil, normal tumor, PDPN CAF, SMA CAF, dCAF, hypoxic CAF, hypoxic tpCAF, iCAF, mCAF, tpCAF and vCAF.
-
•
Primary breast cancer tissue 13 (cell type): 7 classes, namely NK, B cell, T cell, myeloid, ER+, ER- and stromal.
-
•
Primary and metastatic melanoma cancer tissue 19 (cell type): 5 classes, namely lymphocytes, macrophages, stroma, T cells, tumor.
-
•
Diabetic pancreas20 (cell type): 3 classes, namely immune, islet and exocrine.
Niche level classification.
Danenberg et al. 13 identifies recurrent multicellular structures within breast tumor microenvironments and we evaluate the VirTues’ ability to predict the presence of these structures using niche-level representations. Imbalance is evident in niche level tasks within the test set: 40.44% of niches contain suppressed expansion regions, 17.62% contain TLS-like regions, and 30.38% contain PDPN+ regions. Each niche level task is treated as binary classification. We treat the classification of the following structures: Suppressed expansion, TLS-like and PDPN+ active stroma — within a niche as binary classification tasks, since a niche can contain multiple such regions. We use gated attention-based multiple instance learning models37 (Gated ABMIL) to predict the presence of the structures, where the input is the set of cell-level representations (cell summary tokens) belonging within the niche. The ABMIL classifiers aggregate the input representations using gated-attention computed over four heads, each with a hidden dimension of 256. Finally, the niche representations are projected to a single value, followed by a sigmoid activation to compute the probability of the structure’s presence. Each batch consists of 32 crops, and we use the Adam64 optimizer with learning rate of . We use early stopping, with patience of 5 epochs over the training loss. For ResNet7, we employ logistic regression instead of ABMIL, as ResNet7 directly provides aggregated niche-level representations. The logistic regression uses the same configuration as cell-level classification tasks.
To train and evaluate the classifiers, we generate training and testing sets of labeled embedded niches as follows: Each training and testing image is divided in non-overlapping crops of size , and excess pixels at the borders of the images are disregarded. Each crop, representing a single niche, is embedded individually using VirTues and the baseline methods. We use the structure annotations available in the published metadata of Danenberg et al. 13 to determine the presence of the target structure in the niche. We report the overall accuracy and macro average F1-score (to emphasize class imbalance) for each task. We report the average metrics over 5 seeded runs, and calculate the values using Mann-Whitney U test.
Tissue level classification.
To evaluate the ability of VirTues’ representations to capture clinically meaningful information about the tissue and the patient, we define and benchmark various tissue-level classification tasks. We derive these tasks from the clinical patient-level annotations available in the metadata of all five published datasets, where each image is treated as an independent sample. For each task, we exclude images without labels and omit classes with ambiguous or missing descriptions. We describe the labels for each task below:
-
•
Primary lung cancer tissue18: (1) Cancer type: We restrict the classes to Adenocarcinoma and Squamous cell carcinoma, as these account for 95% of the samples, (2) Relapse: 2 classes (Relapse, No relapse), and (3) Grade: 3 classes (cancer grade 1, 2, and 3).
-
•
Primary breast cancer tissue13: (1) ER Status: 2 classes (ER positive, ER negative), (2) PAM50: 5 classes (Normal-like, Basal, HER2, Luminal A, Luminal B), and (3) Grade: 3 classes (cancer grade 1, 2, 3).
-
•
Primary breast cancer tissue17: (1) Tumor Clinical Type: 4 classes (HR-HER2+, HR+HER2-, HR+HER2+, Triple Negative (TN)), (2) Tumor Type: 2 classes (invasive ductal, not invasive ductal), and (3) Grade: 3 classes (cancer grade 1, 2, 3).
-
•
Primary and metastatic melanoma cancer tissue19: (1) Relapse: 2 classes (Relapse, No relapse), (2) Mutation: 3 classes (BRAF, NRAS, wild type), and (3) Cancer stage: 2 classes (stage III, stage IV).
-
•
Diabetic pancreas20: (1) Stage: 3 classes (onset, long-duration, non-diabetic), and (2) AAB Status: 2 classes (negative, positive).
For all tasks, we train Gated ABMIL classifiers as prediction models, similar to the models for niche-level tasks. In contrast to the niche-level classification, the full set of all embedded representations — cell-level for VirTues and CA-MAE16, and niche-level for ResNet7— belonging to an image constitutes an individual sample and an input to the ABMIL classifiers. We report the overall accuracy and macro average F1-score (to emphasize class imbalance) for each task.
Information retrieval.
We construct the Virtual Tissue database for Cords et al. 18 by extracting the central grid of crops with each crop sized , for each image, excluding those smaller than this grid. This choice of grid size maximizes the tissue area captured per image while minimizing the number of excluded images. Additionally, it often eliminates empty or irrelevant corners as a side effect. Similar to tissue level tasks, we keep those images associated with Adenocarcinoma or Squamous cell carcinoma. The remaining crops are embedded using VirTues or one of the baselines and the resulting niche-level representations are stored in the database. For VirTues and CA-MAE16, we use self-supervised niche-level representations, computed as the average of cell-level embeddings.
The database is used to retrieve tissues similar to a given reference image, measured using the 2-Wasserstein distance between sets of niche-level representations. Given the niche-level representations for two tissues, the Wasserstein distance computes as
where .
For a given reference image, we identify the closest matches based on this distance metric.
To evaluate the efficacy of the retrieval mechanism, we compare it quantitatively across different embedding methods. Specifically, we compute two alternative distance metrics between the reference image and its closest retrieved match, then compare their average values to those from randomized retrieval – (1) The first metric evaluates similarity based on cell type composition by calculating the proportion of each coarse cell type with the image using published metadata and computing the L1-distance between the resulting proportion vectors, and (2) the second metric assesses molecular tissue composition by treating each image as a set of pixel vectors and calculating the sliced Wasserstein distance53 between these sets. Given the pixels for two tissue images, where is the number of pixels in an image, the sliced Wasserstein distance is defined as
where denotes the projection of each row on the unit vector . We use the sliced Wasserstein distance as an computationally efficient approximation of the Wasserstein distance since the number of pixels per image is very large.
We also perform a McNemar test to analyze clinical label matches. For each clinical label, we compare the number of correct matches retrieved by the top three results of our Wasserstein-based retrieval method with those from three random retrievals, reporting the resulting p-values. If are the correct matches from Wasserstein-based retrieval while being incorrect from random retrievals, and be the incorrect matches from Wasserstein-based retrieval while being correct from random retrievals, we calculate the test-statistic, which follows a chi-square distribution (with 1 DOF) as , and the p-value is computed as , and suggests a significant difference between the retrieval methods in terms of clinical label matches.
Zero-shot inference.
We demonstrate the zero-shot capability of VirTues across two scenarios (with increasing level of difficulty): (1) a new cancer type and (2) a new organ and disease. In both cases, we compare zero-shot performance with the performance of VirTues (trained), which includes the corresponding dataset in pretraining. For zero-shot inference on a new cancer type, we embed the images using markers overlapping with pretraining and use the model trained on Cords et al. 18, Danenberg et al. 13, and Jackson et al. 17. Performance is benchmarked on two tasks: (a) IMC image reconstruction (Fig. 5b,c), for channels present in pretraining, highlighting reconstruction quality. We compare the performance of zero-shot VirTues and trained VirTues by evaluating reconstruction error in terms of MSE. We further benchmark VirTues (zero-shot and trained) on (b) downstream cellular- and tissue-level tasks (Fig. 5d,e), where we also benchmark against ResNet7 on tissue-level tasks.
Additionally, we evaluate the zero-shot ability of VirTues to reconstruct channels previously unseen during pretraining. In Fig 5j and Fig 5k, we demonstrate the reconstructed images for unseen markers. We distinguish between supported unseen markers, which have close neighboring markers in the ESM2 embedding space present in the training datasets, and isolated unseen markers, that have no close neighboring markers in the training datasets. Further, in Fig 5l, we plot the reconstruction error for supported and isolated markers for the three types of masking schemes: independent masking, marker masking, and niche masking. In all cases, we compare the reconstruction errors with VirTues containing Hoch et al. 19 in pretraining. For zero-shot inference on a new organ and disease, we use diabetic pancreas tissue data from Damond et al. 20. We pretrain VirTues on IMC images from all four cancer datasets for zero-shot inference and benchmark performance. Similar to Hoch et al. 19, we evaluate (a) image reconstruction error (Fig. 5f) and (b) performance on downstream cellular- and tissue-level tasks (Fig. 5g,h).
Scaling analysis.
To analyze the impact of the number of measured markers on both computational costs and prediction performance, we select nested subsets of 10, 20 and 40 markers from the original panel of 41, from the primary lung cancer tissue dataset, based on their presumed informativeness regarding general tissue morphology and cell type differentiation. This selection is guided by prior knowledge and domain expertise. However, we acknowledge that this process is inherently subjective, as a quantitative framework to objectively rank markers by informativeness does not exists. For a full list of markers per experiment, see Suppl. Table LABEL:table:subsets_marker_scaling. We train instances of VirTues and CA-MAE16 on these chosen subsets on the Cords et al. 18 dataset, and report the inference computational cost, number of parameters, and downstream performance upon scaling the number of channels (Fig 1e). We measure the computational cost , where is the memory utilized during forward pass of a batch of 16 images, and is the inference time for the batch. We allow 10 warmup runs to remove GPU startup effects, and report the average of 100 iterations. We further report the downstream accuracy, using ABMIL for cancer type classification, and linear probing for cell type (coarse) classification, on Cords et al. 18.
Model inspection and visualization
We investigate VirTues’ interpretability in learning meaningful signals by evaluating the attention scores from the marker and channel attention layers in the encoder. We begin by examining the attention weights learned by the first marker attention layer for an input image. We consider the post-softmax attention weights for all channels except the cell summary token, say when marker attends to marker for head and spatial position , and aggregate them across all heads and spatial positions. The final scores, termed as importance scores , can be written as
Visualization of spatial attention typically relies on a [CLS] token. Since the pretrained VirTues inherently does not have a [CLS] token, we augment VirTues with learnable channel summary tokens (one for each channel, including the cell summary token channel), which are spatially placed at the center of the input image. We finetune the augmented model on the cancer type prediction task on Cords et al. 18, using the encoded channel summary tokens of the cell summary layer to predict the cancer type. To visualize attention maps, we compute the attention scores directed from the channel summary token to the cell summary tokens in the penultimate spatial attention layer and display these as a heatmap over the spatial positions.
Computing hardware and software.
We used Python (v3.12.7), PyTorch (v2.5.1, CUDA 12.1), xformers 62 (v0.0.28) and scikit-learn (v1.5.2) for all experiments and analyses in the study. All experiments were conducted on a single NVIDIA A100 80 GB GPU.
Data availability
We will release all processed datasets upon publication of this work.
Code availability
All code was implemented in Python using PyTorch as the primary deep learning package. The source code and Supplementary Information for VirTues is available at http://github.com/bunnelab/virtues.
Acknowledgments
We thank Bernd Bodenmiller, Eric Lubeck, Zoe Piran, Benedikt von Querfurth, Lucas Pelkmans and Aviv Regev for discussions and for providing feedback on our manuscript. We acknowledge support from Lena Cords and Daniel Schulz with accessing and analyzing the datasets. We are very grateful for Andreas Krause’s support and hosting J.W., K.V. and C.B. during the initial phase of this study. Icons created using resources from Flaticon.com.
Author contributions.
G.G. and C.B. conceived the study; J.W., M.P., G.G. and C.B. devised the encoder-decoder architecture and its pretraining; J.W., K.V. and E.J. curated the datasets; J.W., E.J., K.V., G.G. and C.B. developed the evaluation framework and downstream tasks; J.W., E.J. and K.V. performed the experiments; J.W., E.J., A.W., G.G. and C.B. wrote the manuscript; A.W. and C.B. funded the study. All authors approved the final version of the manuscript.
Declaration of interests
The authors declare no competing financial interests. No patent applications have been filed on this work.