∎
66email: gabriel.moya@uib.es
Phone: +34971171399
77institutetext: P. Bibiloni 88institutetext: Balearic Islands Health Research Institute (IdISBa), 07010 Palma, Spain.
Geometric-Based Nail Segmentation for Clinical Measurements
Abstract
We present a robust segmentation algorithm that can be used to obtain measurements of toe nails. The presented method assists in a medical study to objectively quantify the incidence of a specific pathology. Towards such assessment, we require a segmentation of the nail, which locally appears to be very similar to skin. Several algorithms are used, each of them leveraging a different aspect of the toenail appearance. We use the Hough transform to locate the tip of the toe and to estimate the nail location and size. Then, we classify the image’s super-pixels based on their geometry and photometric information. Afterwards, the watershed transform delineates the border of the nail. The method has been validated with a 348-image medical dataset, achieving an accuracy of 0.993 and an F-measure of 0.925. The method is robust across samples unalike in nail shape, skin pigmentation, illumination conditions and, more importantly, under the appearance of regions affected by a medical condition.
Keywords:
toenail segmentation medical image machine vision machine learning1 Introduction
Human nails, mainly made of keratin, present a color very similar to that of the skin. Both regions have, typically, a somewhat flat texture. Although their shape tends to be circular, there is a wide diversity of them, regarding their eccentricity and shape of contours. Thus, very few assumptions can be made to reliably characterize nails in terms of their visual appearance.
The problem of toenail segmentation has not been widely studied in the literature.To our knowledge, there is not a single research project whose goal has been exclusively to segment the toenail.
However, this task is tightly related to segmenting the fingernails in images. Most of the existing research is focused on biometric systems and disease detection. See the work of Mente and Marulkar Mente and Marulkar (2017) for a review on various research works based on fingernail disease detection using image analysis. There is also a review on nail image processing for disease detection by Juna V. V. and Dinil Dhananjayan Juna and Dhananjayan (2019).
Most research focuses on segmenting the nail from images captured in environments with a controlled perspective and constant lighting. Under these settings, simple methods can be employed, such as considering color difference between the nail and the hand.
Fukunaka et al. segment fingernails in the HSV colorspace by thresholding using experimental values Yu Fukunaka and Sato (2012). Tolentino et al. Tolentino et al. (2018) uses the same approach.
Fujishima and Hoshino propose a fingernail detection method using the distribution density of nail and finger regions Fujishima and Hoshino (2012), and further improve their method’s accuracy by considering the color continuity Fujishima and Hoshino (2013).
Gauns Dessai and Borkar Gauns Dessai and Borkar (2018) segment the nail colors using L*a*b* color space and -means clustering. A similar approach is used by Marulkar and Mente in Marulkar and Mente (2018) where they applied -means clustering, L*a*b* colorspace and Marker-Controlled Watershed Segmentation for better accuracy and precision, although was only applied to a single image.
Wang et al. also perform hand segmentation and fingertip detection using color information Wang et al. (2013). They also design a color space for this specific task.In order to segment the fingernail, they use a pixel-wise classifier based on the different distribution of the channel in skin and fingernail regions.
The method proposed by Kumar et al. Kumar et al. (2014) first finds the nail ROI of the index, middle and ring fingers from the hand image. They then segment it by applying a fixed threshold in a grayscale image, and finally refine the grown nail plate with a Gabor filter.
Lee et al. propose Lee et al. (2016) an image preprocessing method to segment different parts of nail: the lunula and the nail plate. In order to maintain the nail image quality, this paper uses microscopic imagery.
Also working in a controlled scenario, Easwaramoorthy et al. Easwaramoorthy et al. (2016) identify the difficulty to segment the nail bed since the edges in the nail images are not continuous. They proposed an algorithm to extract a set of nail semantic points instead of segmenting the nail itself.
Other approaches allow more flexibility on the input images’ illumination, but still control the image perspective, typically because these are approaches designed to be used in biometrics.
To achieve illumination invariance, Barbosa et al. Barbosa et al. (2013) proposed a nail segmentation algorithm using an active shape model employing local binary pattern features. They also introduced a dataset with controlled captured conditions.
Kumuda et al. Kumuda and Dinesh (2015) used the watershed algorithm on a contrast-enhaced grayscale image to segment the distal region of the nail, the nail plate and the finger. Later on, the same authors Kumuda et al. (2016) considered an illumination correction stage and an iterative histogram-based thresholding in each component of the RGB color space to binarize the fingernail, whose shape based classified as either oval, round, or rectangular.
Kurniastuti presented a method that uses an active shape model Kurniastuti (2018). It consists of three steps: grayscaling; contrast stretching, to repair contrast in the image; and use of active shape model. The method, which segments the fingernail area, needs 45 minutes for every sample.
The solutions proposed in the state-of-the-art are designed for high controlled environments, where they can decide the light direction, its intensity. They can also control the image perspective and the cameras used to take the image.
In this paper, we present a robust toenail segmentation algorithm that can be used for measuring the area of the nail of the big toe in human patients to assist in a medical study towards the objective quantification of the incidence of a specific pathology. To ensure the correctness of the quantification, it is important to segment the toenail correctly from images taken from different cameras, angles and lighting conditions. Once the nail is segmented, its area is computed and the nail region can be further processed by researchers.
The importance of this method relies on providing a quantitative result that is free from the slight differences that practitioners might introduce if they perform this specific task.
In this study, made possible by a joint effort in which 348 samples were collected during the clinical practice, we aim at segmenting the toenail. This is a tedious and repetitive task, whose automation releases medical practitioners from this time-consuming effort.
Although it is a simple task for humans, automatically detecting nails in images of human toes is a challenging problem. Computer vision techniques can automate and standardize a well-defined task.
We emphasize that, as of today, the nail segmentation algorithm presented here is being used as a first step in an ongoing medical study.
The objectives initially proposed for such algorithm are:
-
1.
Design and implement an algorithm that, given a photograph of the big toe in a especially-designed template, is able to segment the nail region.
-
2.
Measure its performance compared to human-provided segmentation.
-
3.
Iterate over the previous steps to reach an algorithm whose results are comparable to human performance.
The algorithm presented here is proposed to assist in a medical study towards the objective quantification of the incidence of a specific pathology.
1.1 Structure of the paper
The structure of the rest of the paper is as follows. In Sect. 2 we introduce the method for segmenting nails. We cover all steps in detail: location of the fingertip and nail using the Hough transform; super-pixel creation with quickshift, based on color similarity; subsequent classification with gradient boosting; and a watershed-based refinement to provide the final nail mask. Sect. 3 exhibits the behaviour of our method, including an analysis of its performance measured with quantitative metrics. We conclude, in Sect. 4, by studying the strengths and shortcomings of our proposed method.
2 Toenail Segmentation Method
The nail segmentation method is composed of several steps: tip of the toe location, nail circle estimation, super-pixel classification and, finally, toenail pixel-wise segmentation. Each of these steps refines the result provided by the previous one. We start describing the characteristics of the images we employed which define, implicitly, the problem we are facing.
2.1 High-level Description of Toenails
As we stated in the introduction, toenails are part of the outer layer of the skin. They are located at the end of the toe and have a slightly different color from the skin due to its composition: a hardened or horny cutaneous structure formed of keratin. Nails are composed of two parts: the lunula, a lighter region from which the nail grows; the nail plate, which covers the central part of the nail; and the distal end, in which the nail is no longer attached to the finger or toe surface. Nails are usually circular, although there is a wide diversity in terms of shape, being some of them more similar to an ellipse or having squared corners.
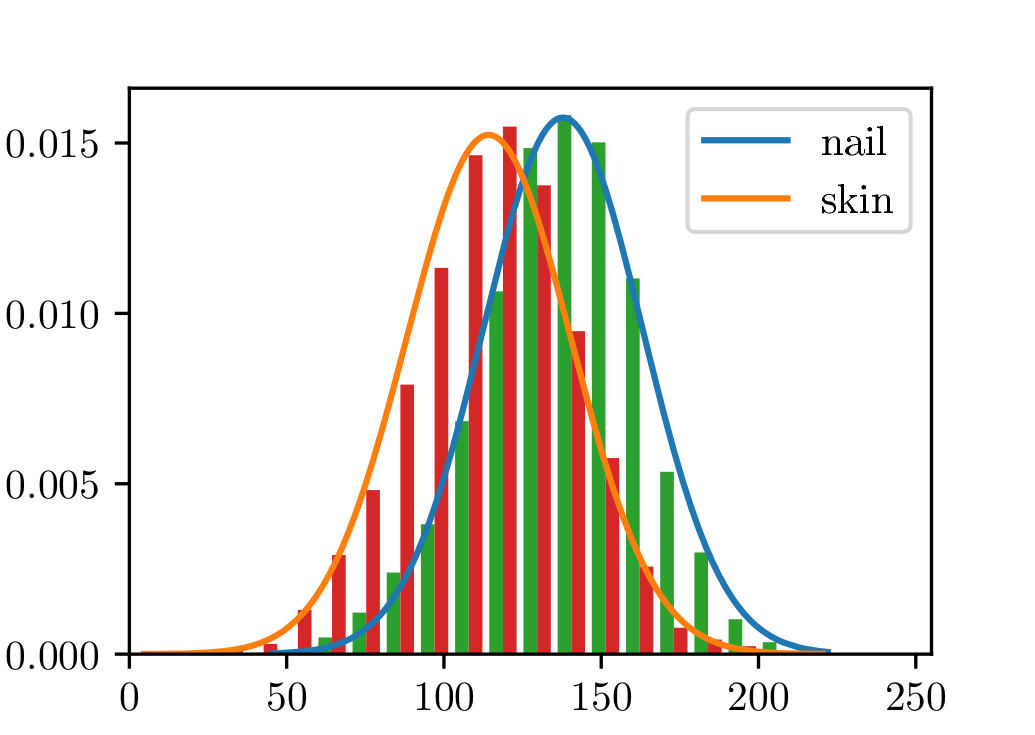
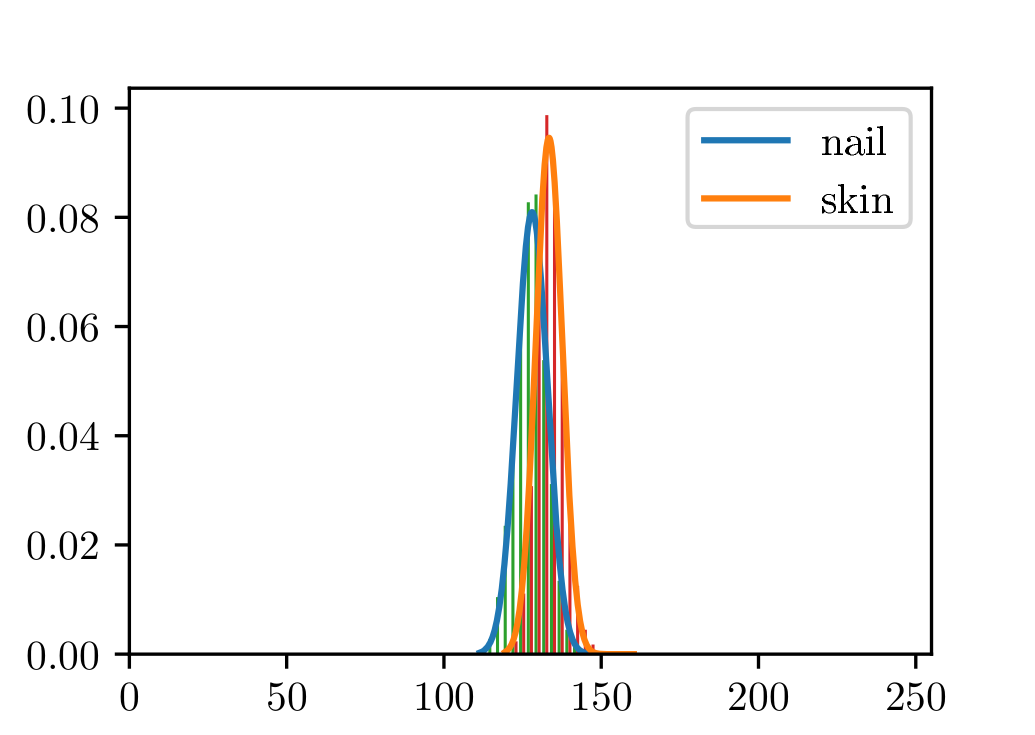
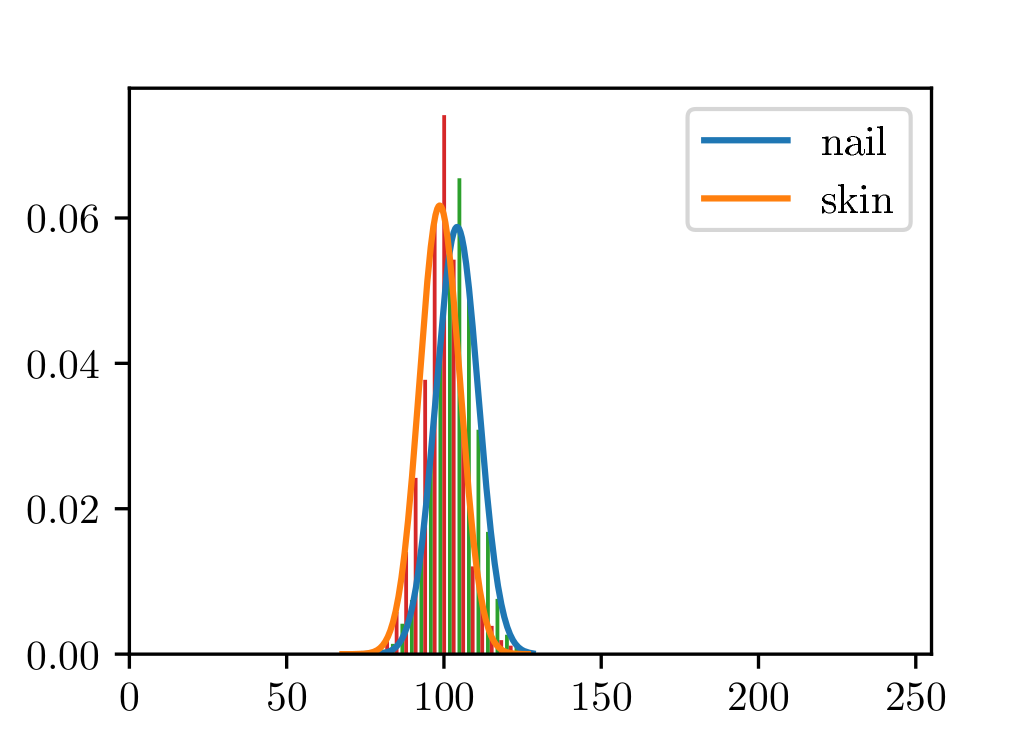
The photometric properties of nail pixels do not contain enough information to segment them from toe ones. In Fig. 1 we group pixels belonging to the nail region and the toe region, respectively. We observe that their distribution across different channels of the CIELAB color space is very similar. In fact, none of the channels, nor a combination of them, has proved to be enough to tell apart these pixels, especially when considering pictures taken under different illumination conditions. Thus, although nail and toe can be easily discriminated by a human observer, doing so based only on pixel-based local information poses as an arduous challenge.
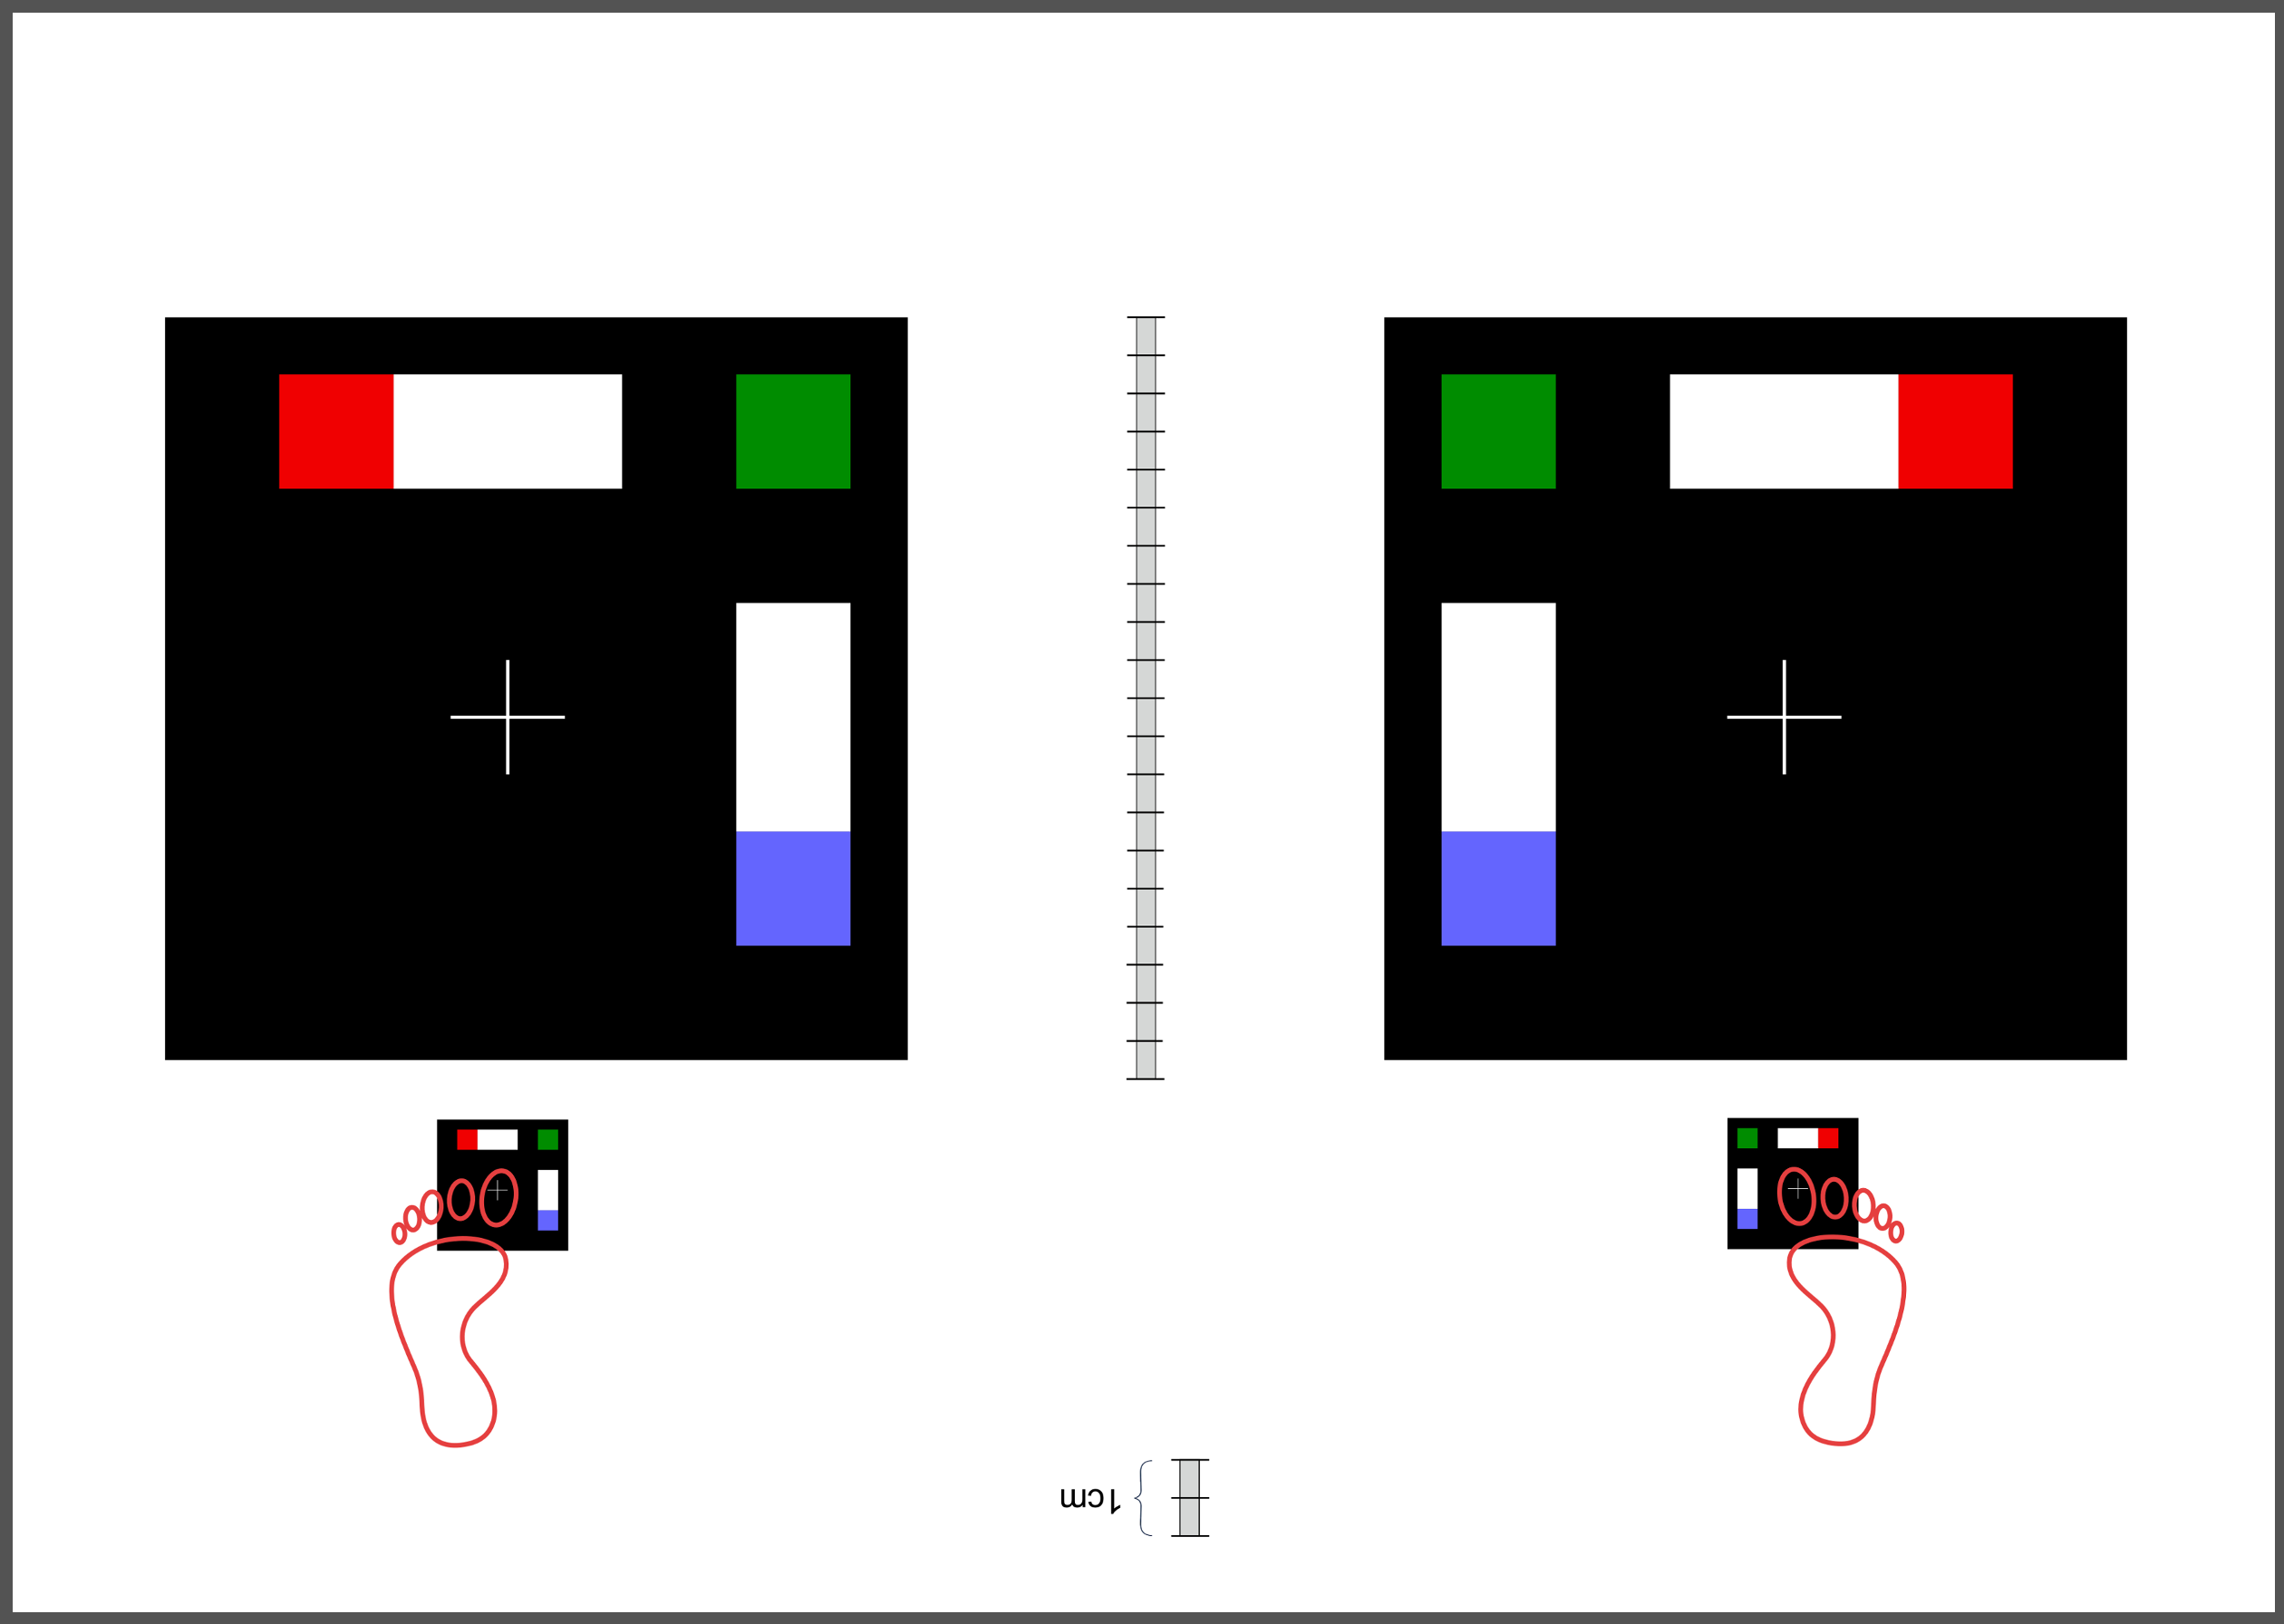
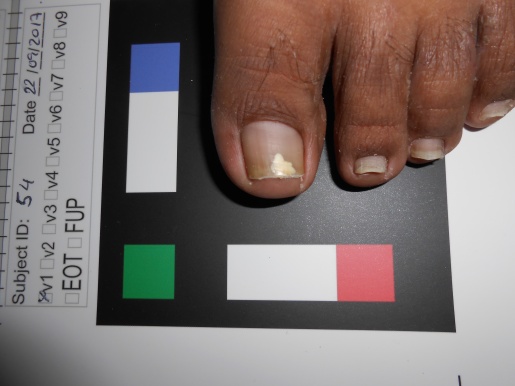
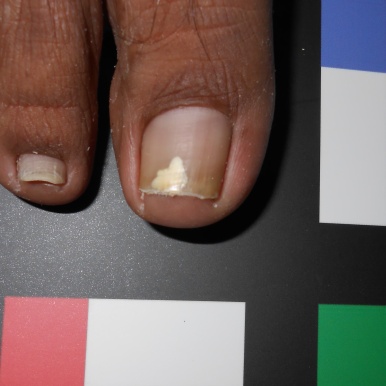
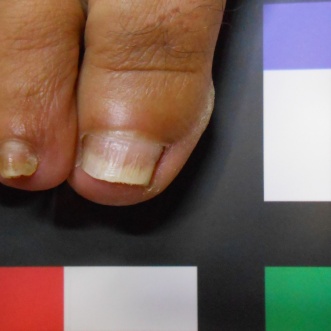
The dataset used in this study was taken in the clinical practice. Following the guidelines of a well-defined medical study, images were acquired in real conditions. All of them were captured in the doctor’s office with their smartphones’ embedded camera. To control some of the environmental conditions, we designed a template to use as the scene background (see Figure 2). During the acquisition process, however, we could not control some other environmental conditions, such as the capture viewpoint the camera setup or the illumination.
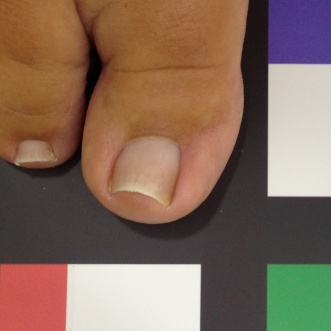
Before tackling the image segmentation problem, we perform an image normalization process based on the template’s known measures. It consists on transforming the input image, as seen in Fig. 3 (left), to an image with standard dimensions and orientation, Fig. 3 (right). To achieve our objective we detect the position of the template corners and geometrically transform the image with an affine mapping. As a result, all normalized images appear to had been taken under the same point of view. We remark that the three template colored squares are mapped to the top-right, bottom-right and bottom-left image corners. In particular, left foot images are mirrored. Normalized images are always set to measure pixels. Since the real region inside the template measures cm, a centimetre in the normalized image accounts for 300 pixels, which can be used to measure distances and areas.
In the following, we describe each step taken to deal with the task of segmenting the toenail from images like the one in Fig. 3 (right). In particular, Fig. 4 contains a flow diagram, along with the algorithm employed for each of them.

2.2 Tip of the toe and nail circle estimation
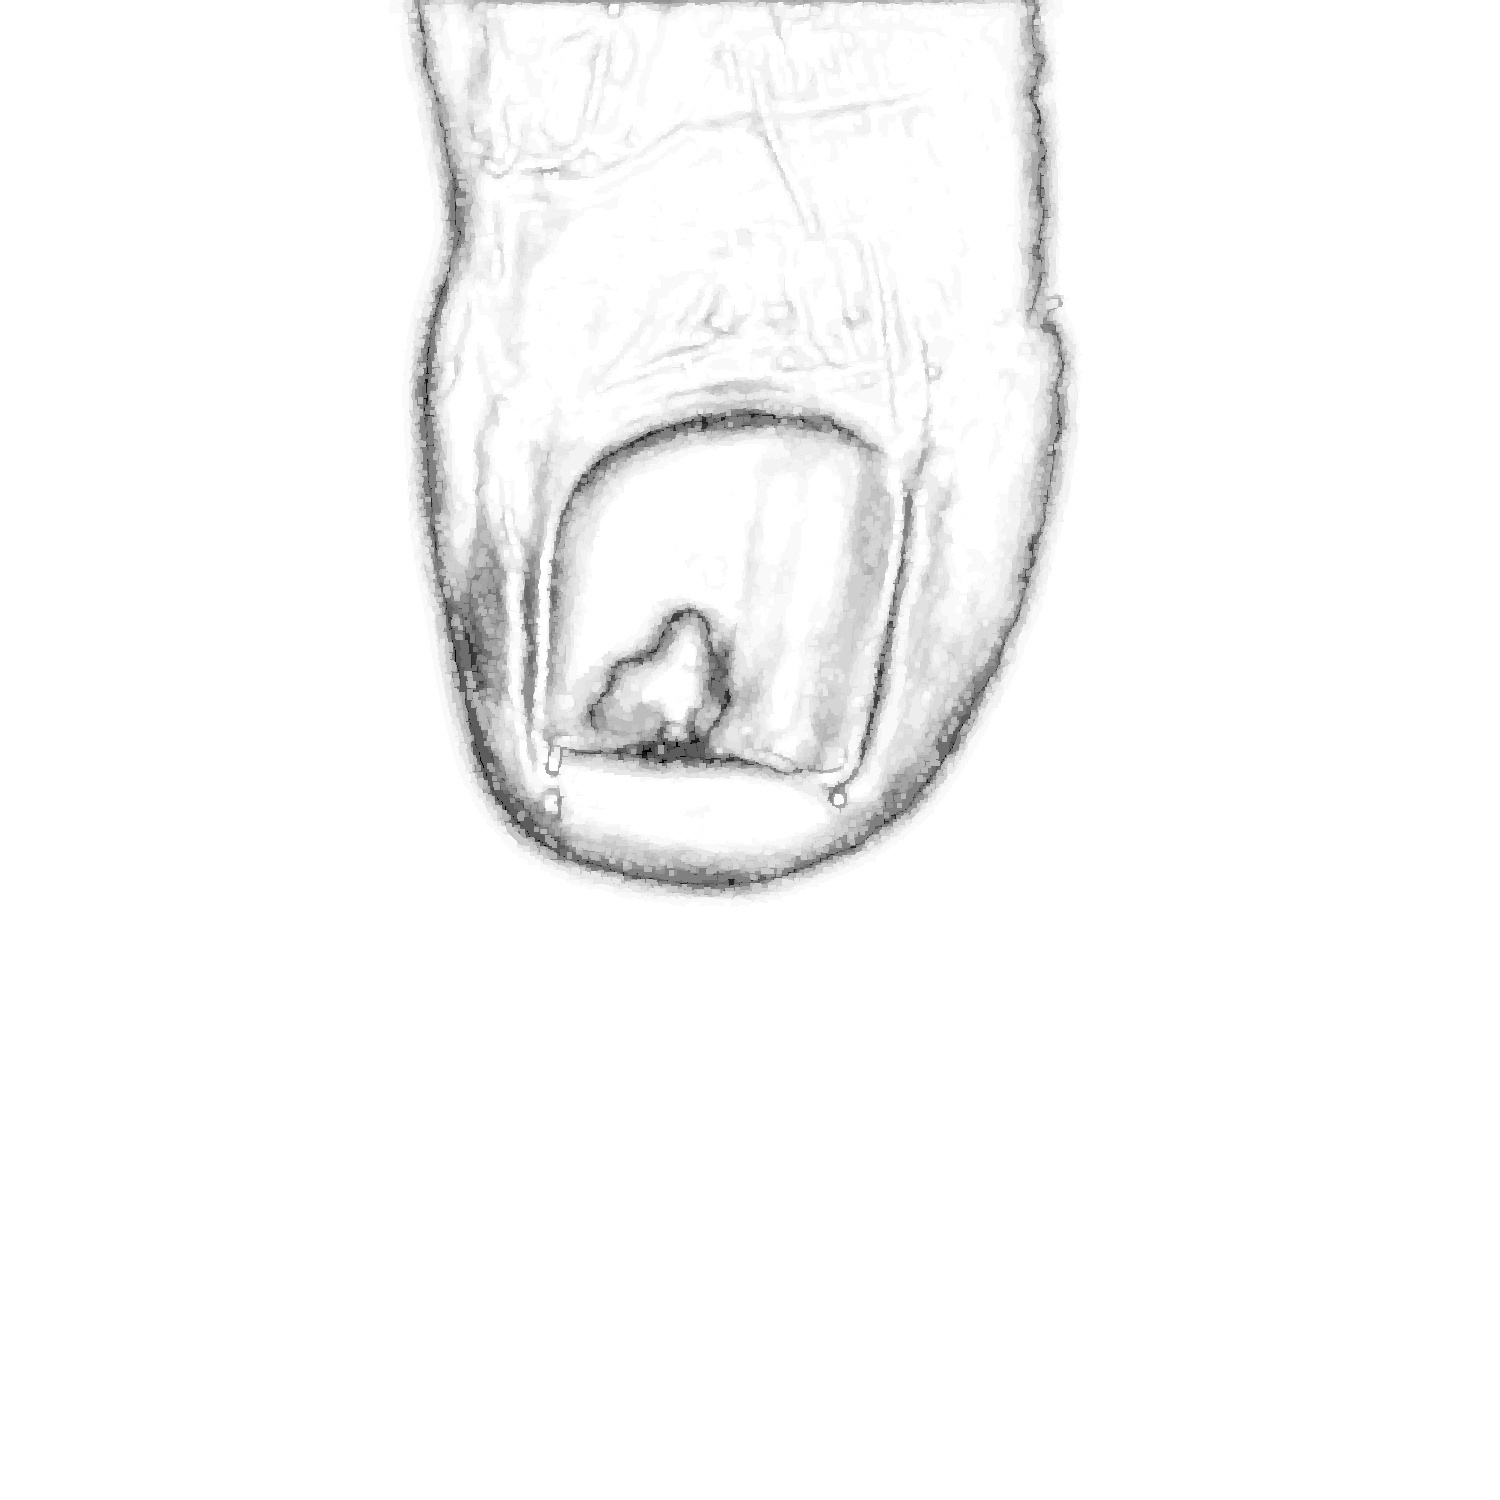
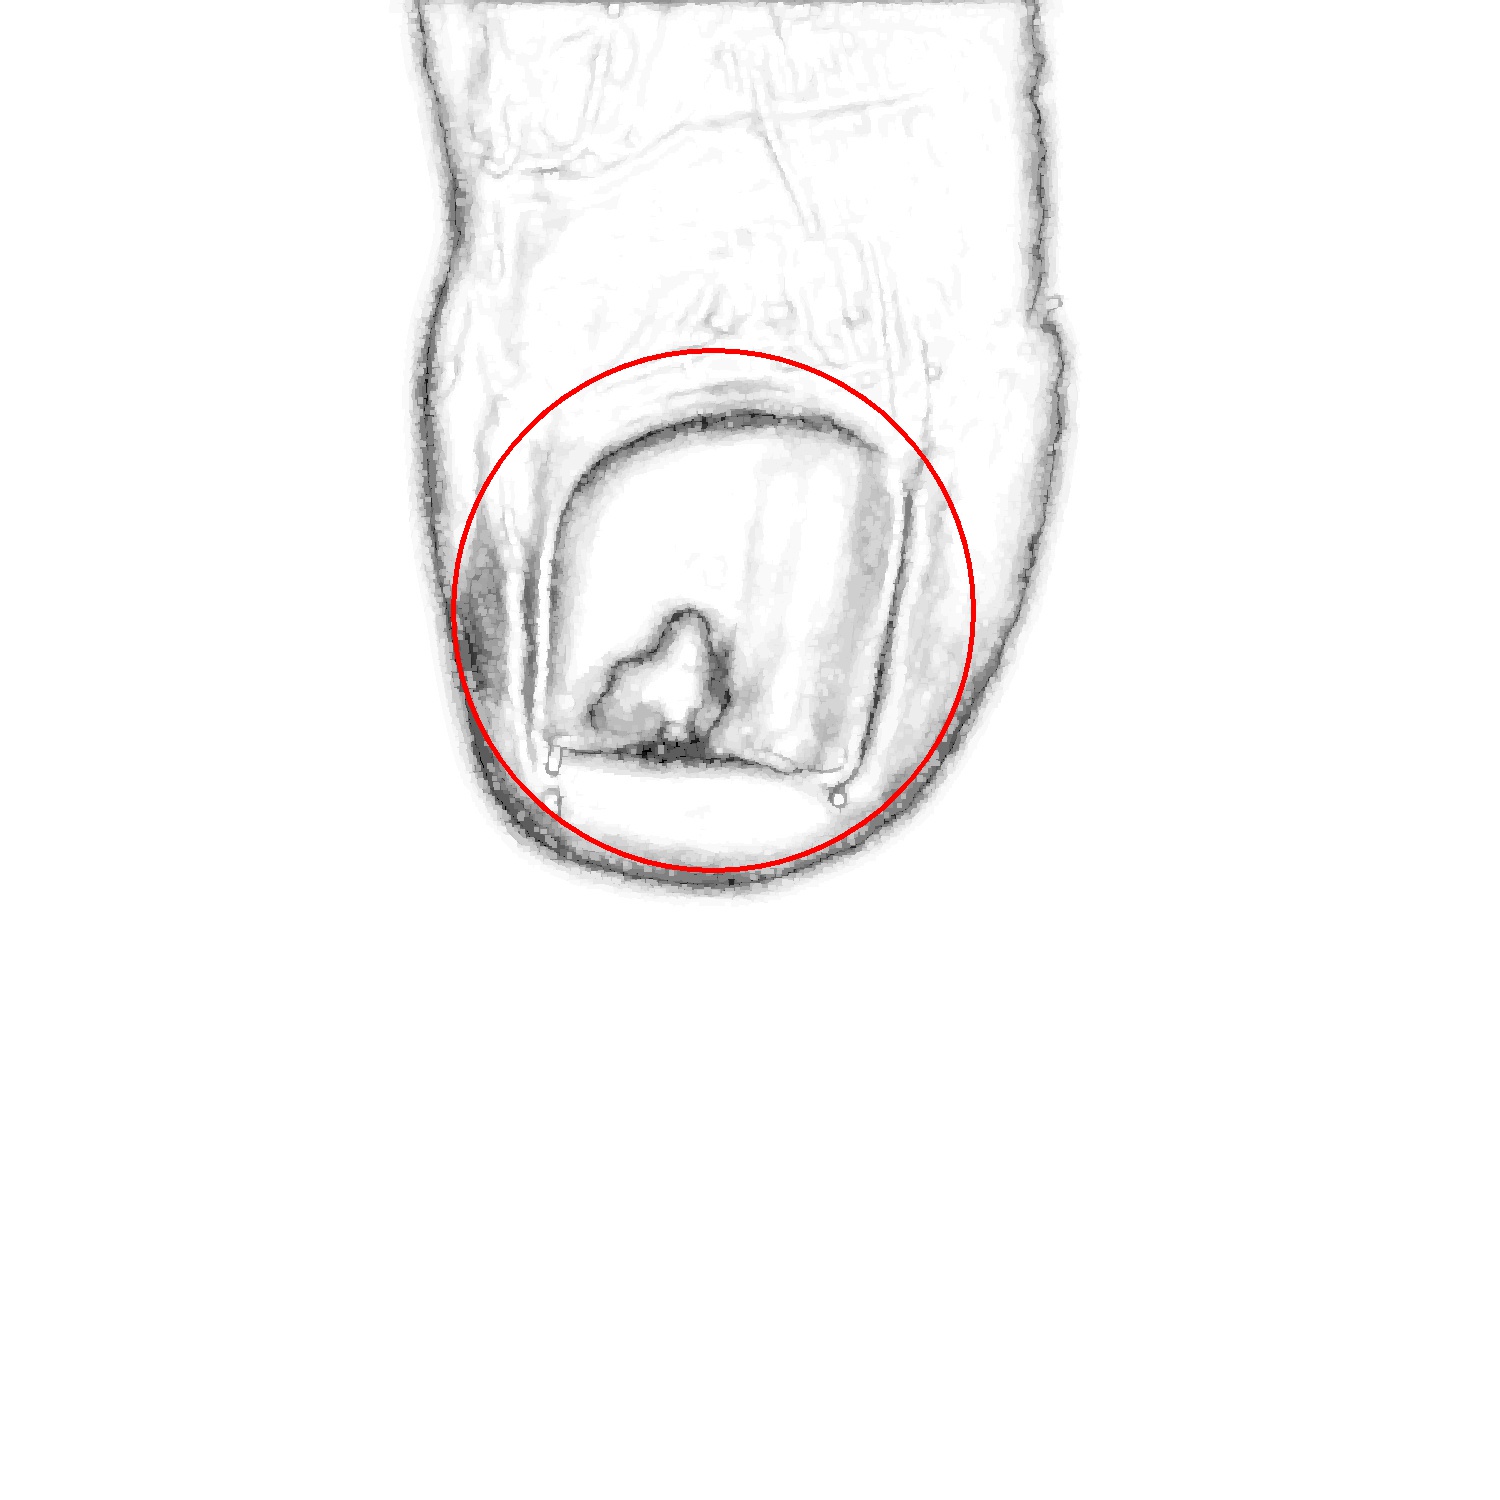
In order to select the tip of the toe, we segment the foot regions from the background template. Then, the Hough transform is used to detect a circle in the foot region, which corresponds to the tip of the toe. Next, the nail is found within the tip of the toe using a second Hough transform, that depends on the result of the first one. Specifically, this second Hough transform is computed taking into account only the edges that are in the tip of the toe circular estimation. In the following, we detail the transformations performed.
First, we identify the foot Region of Interest (in short, foot ROI). It is a mask that cover the part of the foot captured in the image, including both the skin and the nails. Given the contrast with the black background template, this can be easily obtained based on pixel colorimetry: discriminating pixels based on a fixed range in the color space. Specifically, we have used the skin color range given by Kovac et al. Kovac et al. (2003), and finally we select the biggest connected component as the foot ROI.
Next, we compute the edges on the foot ROI by employing several instances of the Canny edge detector Gonzalez and Woods (2009) using different values of the low threshold, ; the high threshold, ; and the standard deviation of the Gaussian filter, . We consider all the possible combinations of the following values.
By adding up each one of the Canny edge instances we obtain a cumulative contour image, shown in Fig. 5(a).
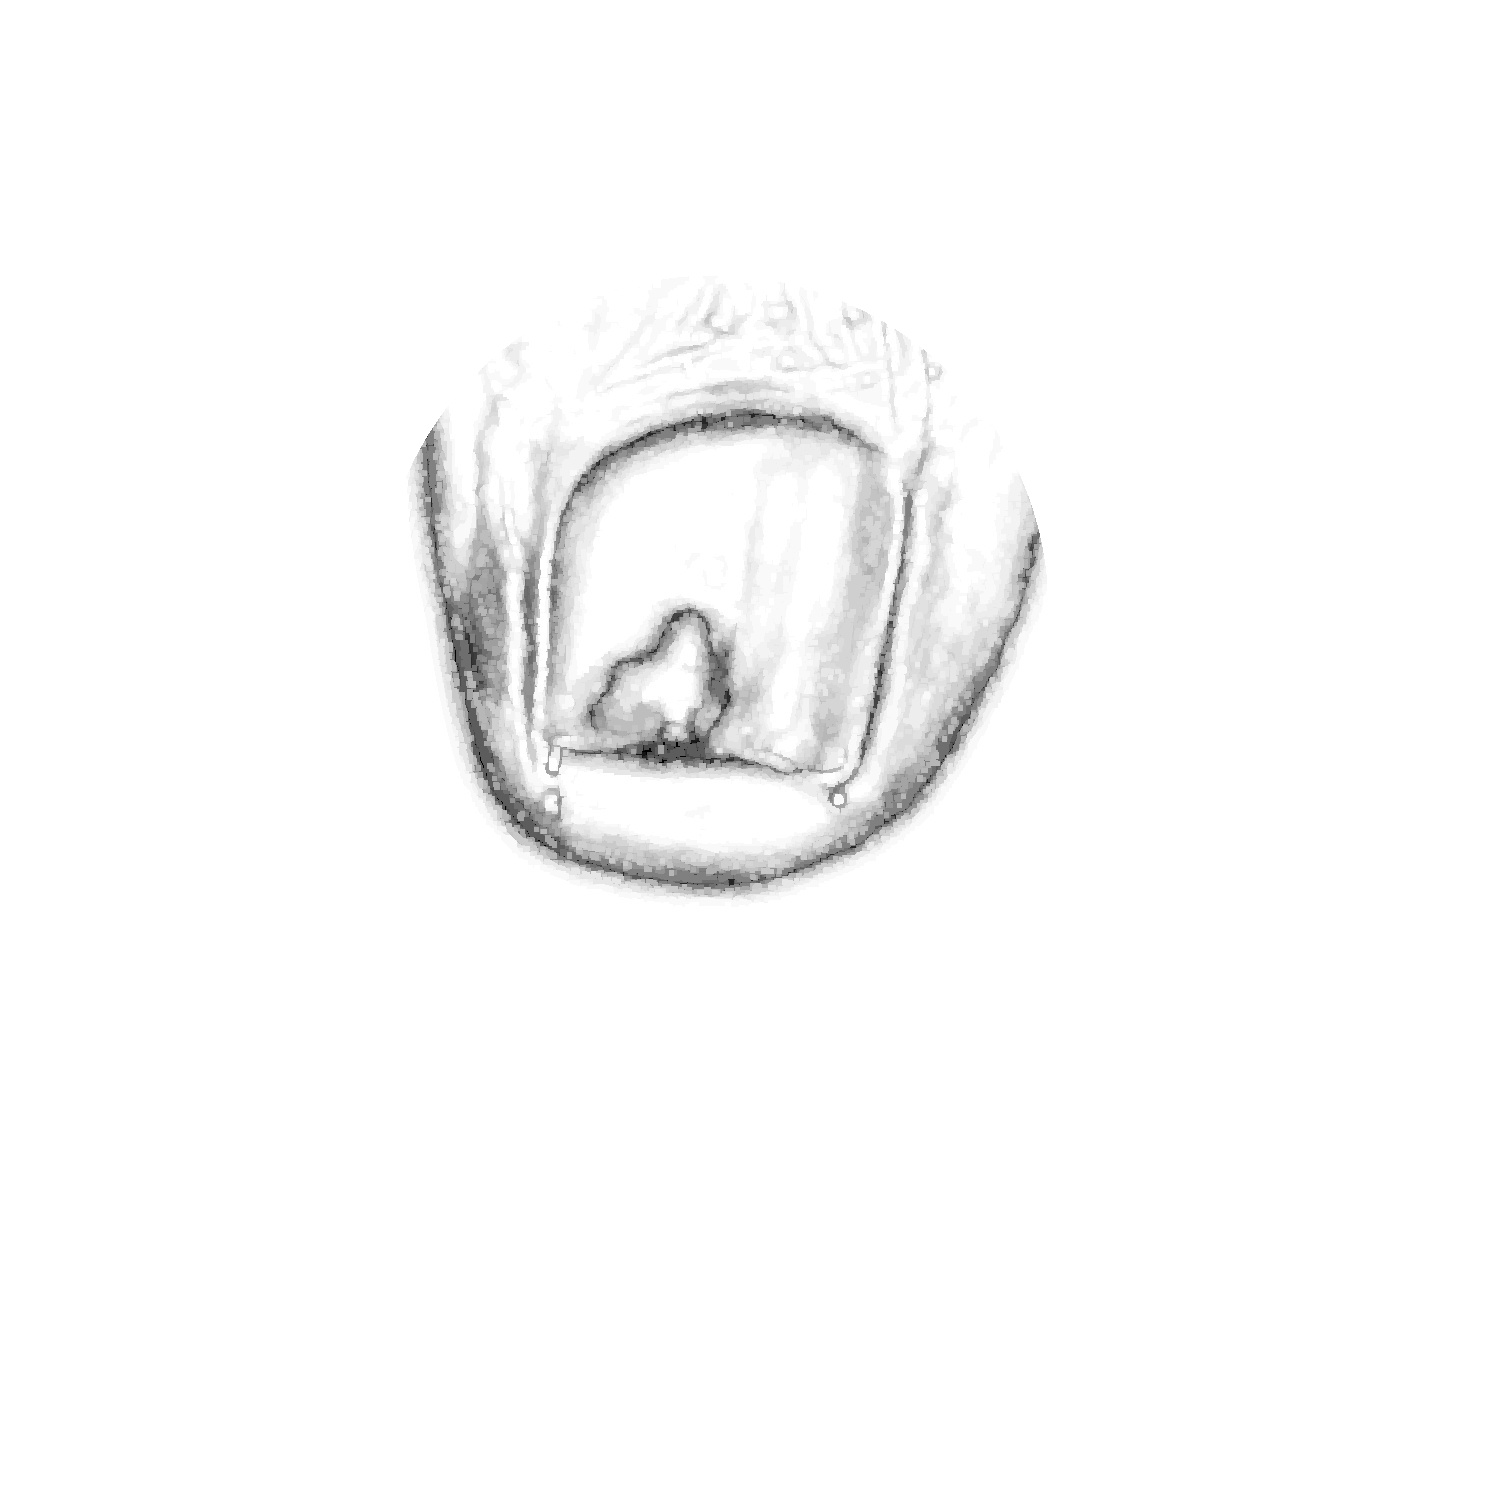
Onto that edge image, we apply the Hough transform to locate the tip of the toe. Due to its position and size, the area inside this pattern contains the nail. So, we apply the circular Hough transform on the edge image and we select the best candidate as the nearest circle to the template bottom right corner that has a predefined percentage of its area within the foot ROI (specifically, we choose a threshold of ). Also, the computed circles are limited to radius between 0.85 cm and 1.75 cm. The selected circle is shown in Fig. 5(b). We remark that this circular pattern captures the tip of the toe but does not locate the nail with acceptable accuracy.
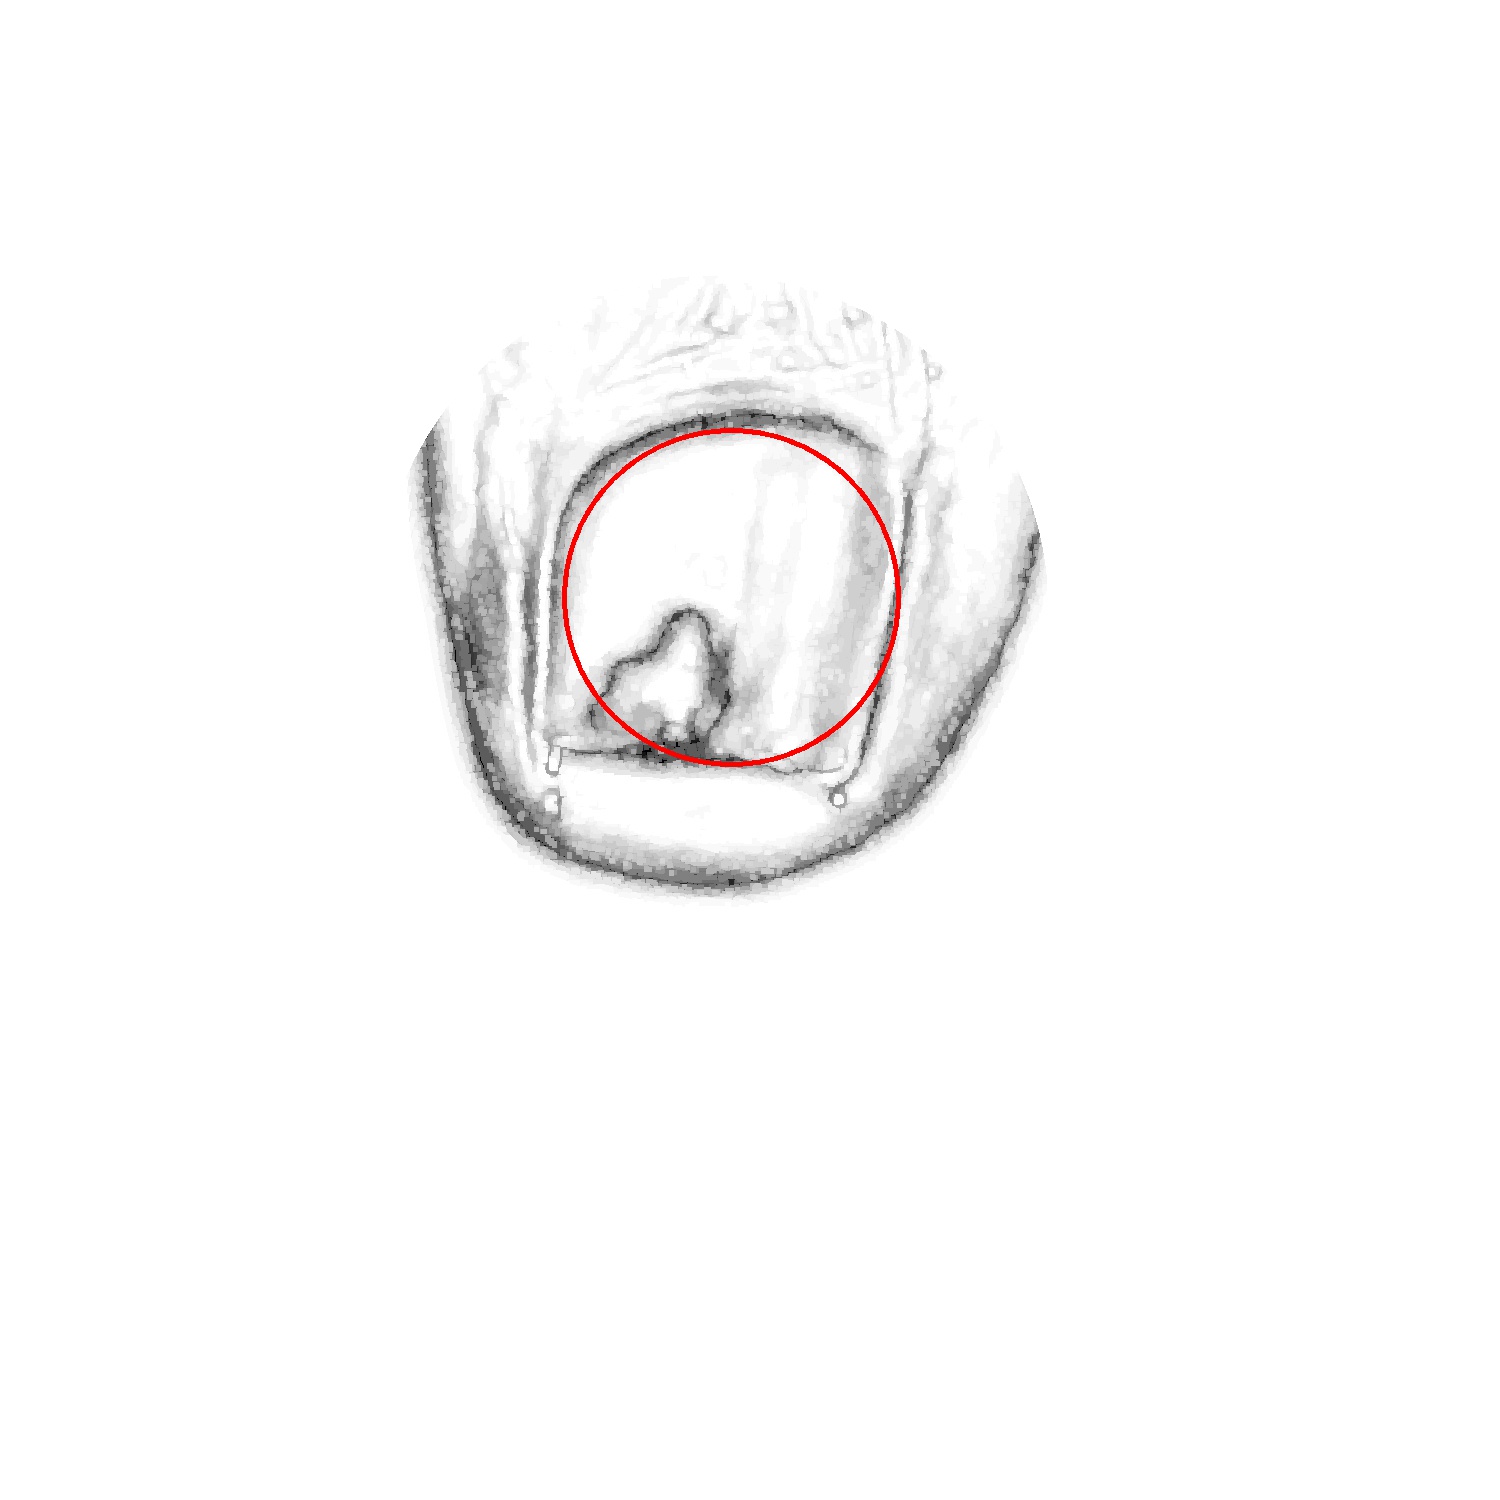
Finally, we detect the circle that better fits the nail using a second Hough transform. We discard the edges far from the tip of the toe circle (see Fig. 5(c)), so that we mainly keep the nail edges. Thus, this second Hough transform is prone to detect the circle that best fits the nail. Also, we constrain the radius of this circle according to the size of the tip of the toe. Specifically, we expect the nail radius to be smaller than the radius of the tip of the toe circle (see Fig. 5(b)) but bigger than half of its measure. The most prominent circle (see Fig. 5(d)) is the one selected as nail circle. Experimentally, the results of this process have proved to always find a location on the nail (the circle center) and a good estimation of the nail size (derived from the radius).
2.3 Super-Pixel Classification
The process explained above does not provide enough information to accurately segment the nail. A good approach for refining these results is to use machine learning methods. To overcome this, we identified groups of pixels with some common characteristics. Considering these groups as entities to classify, our problem is simplified but enough information is kept to ensure it is still attainable.
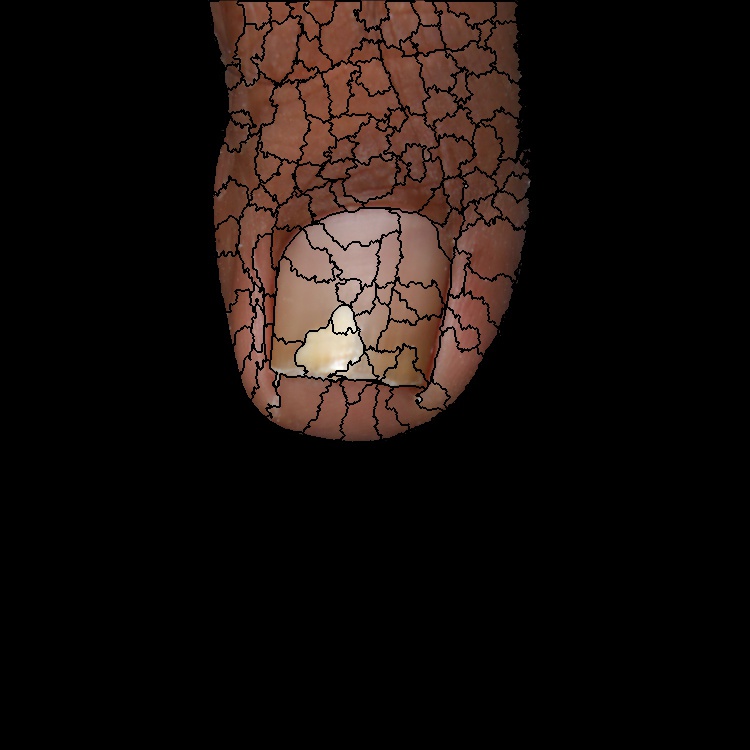
To group close and similar pixels we use the Quickshift algorithm Vedaldi and Soatto (2008). It divides the image in connected and uniform regions, the so-called super-pixels. However, as can be seen in Fig. 6, a set of connected super-pixels define the nail contour accurately.

2.3.1 Classifier Features
In this section, we introduce the features used to classify if a super-pixel is part of a nail or not. These features are of a different nature: some come from the tip of the toe detection step, leveraging the best-circle nail estimation and the foot ROI; others from the colorimetry of pixels; and we also consider other geometric attributes of the super-pixels as a region. For the sake of completeness Table 1 list all used features.
| Features based on | Description | Number of features | |
|---|---|---|---|
| Colorimetry |
|
9 | |
|
9 | ||
| Region information | Super-pixel area and perimeter. | 2 | |
| Position | Super-pixel centroid. | 2 | |
|
2 | ||
| Distance to circles. | 6 | ||
| Image circles data | Radius of two circles. | 2 |
We use channels of different color spaces as features. Visually, we can distinguish nail from the rest of the skin, and so we hypothesize that the colorimetry may provide some information about a super-pixel’s relevance. We use the following color spaces: RGB, HSV and CIELAB.
The size of the area occupied by the super-pixel region and its perimeter may also be useful. Also, we foresee that there may exist a correlation between these characteristics and the rest of them. For instance, their size may provide an indicator of how variable the colorimetry is in such a region.
We also consider features related with the centroid’s position of the super-pixel. Concretely, we consider the position in the and axis, the distance to the rightest skin pixel in the same row and the distance to the bottommost skin pixel in the same column, and the distances to both circle centers—the toe tip circle and the estimated nail circle.
We remark that the radius of these two circles are also included as features.
2.3.2 Classification
Different classifiers have been used with the previously mentioned features to classify the super-pixels. We have experimented with the following classifiers: SVM, random forest, gradient boosting and multi-layer perceptron.
2.3.3 Comparison of the classifiers
Table 2 summarize the results obtained with different classifiers, we used the literature recommended parameters for each classifier. The results are the average performance measure across test samples. The performance metrics are computed using the test set, previously unseen during the training stage.
| Classifier | Sensitivity | Specificity | Precision | Accuracy | -measure | Cohen’s |
|---|---|---|---|---|---|---|
| random forest | 0.983 | 0.896 | 0.888 | 0.971 | 0.892 | 0.875 |
| multi-layer perceptron | 0.984 | 0.898 | 0.893 | 0.972 | 0.896 | 0.880 |
| gradient boosting | 0.983 | 0.921 | 0.891 | 0.975 | 0.906 | 0.891 |
| SVM | 0.964 | 0.958 | 0.804 | 0.964 | 0.874 | 0.853 |
According to the results in Table 2, Gradient Boosting appears to be the best classifier. Let us emphasize the fact that each performance measure is affected differently by deviations to the ground truth. In particular, Sensitivity and Precision are only affected by false positives, and Specificity by false negatives. On the other hand, the rest of measures provide a more balanced insight of the overall performance of the method. We specifically rely on the -measure and the Cohen’s due to their robustness: they successfully handle both types of errors and class imbalance problems. Thus, gradient boosting is used as our default training model during the rest of the paper. We observe that the multi-layer perceptron, after an exhaustive hyper-parameter fine-tuning, could become a good alternative. However, we favour Gradient Boosting as the default training model due to its ease of deployment.
2.4 Toenail segmentation
A final step is presented here to refine the nail location using the watershed algorithm Meyer (1992). Implicitly, we leverage the fact that nails are very well defined by their frontier, much better than by their colorimetry, size or shape.
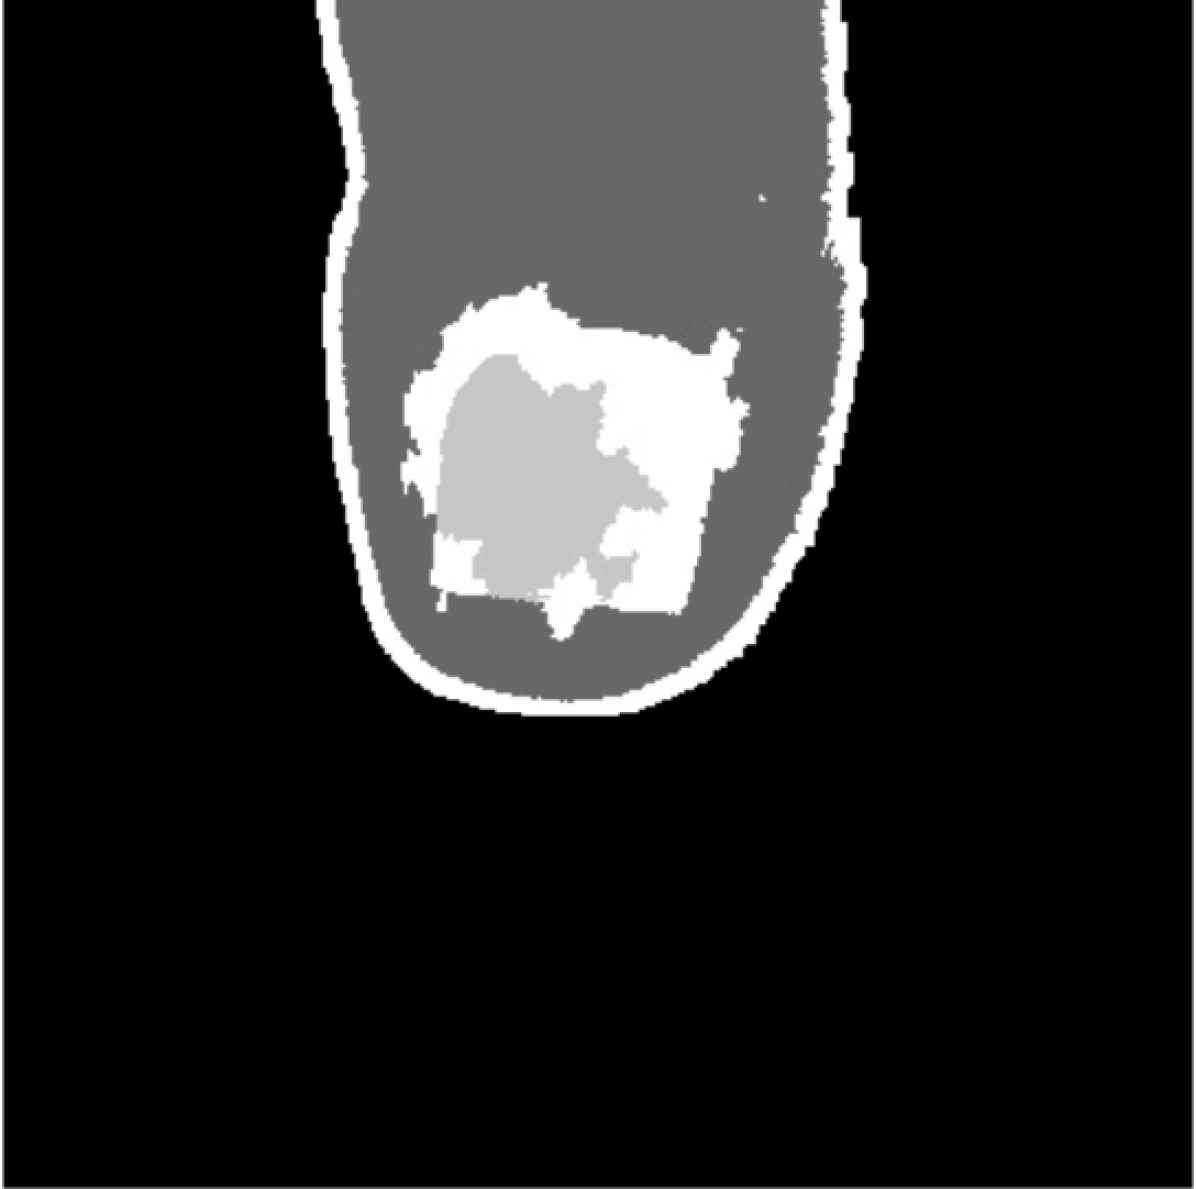
The watershed segmentation algorithm requires the definition of initial markers that grow until they fill a whole region. To initialize the algorithm, we use the probabilities of each super-pixel to belong to a class, given by the gradient boosting classifier. More specifically, we initialize some super-pixels as watershed initial markers as follows:
-
•
Marked as background. Super-pixels on the excluded region of the foot ROI mask, slightly eroded with kernel.
-
•
Marked as nail. Super-pixels whose estimated probability of being part of the nail is greater than 99.99%, to guarantee as much as possible the correctness of the initial marker.
-
•
Marked as skin. Super-pixels with a probability greater than 99.99% of being skin.
-
•
Unmarked. The rest of pixels are tagged by the watershed algorithm based on their closeness and similarity to the already marked pixels.
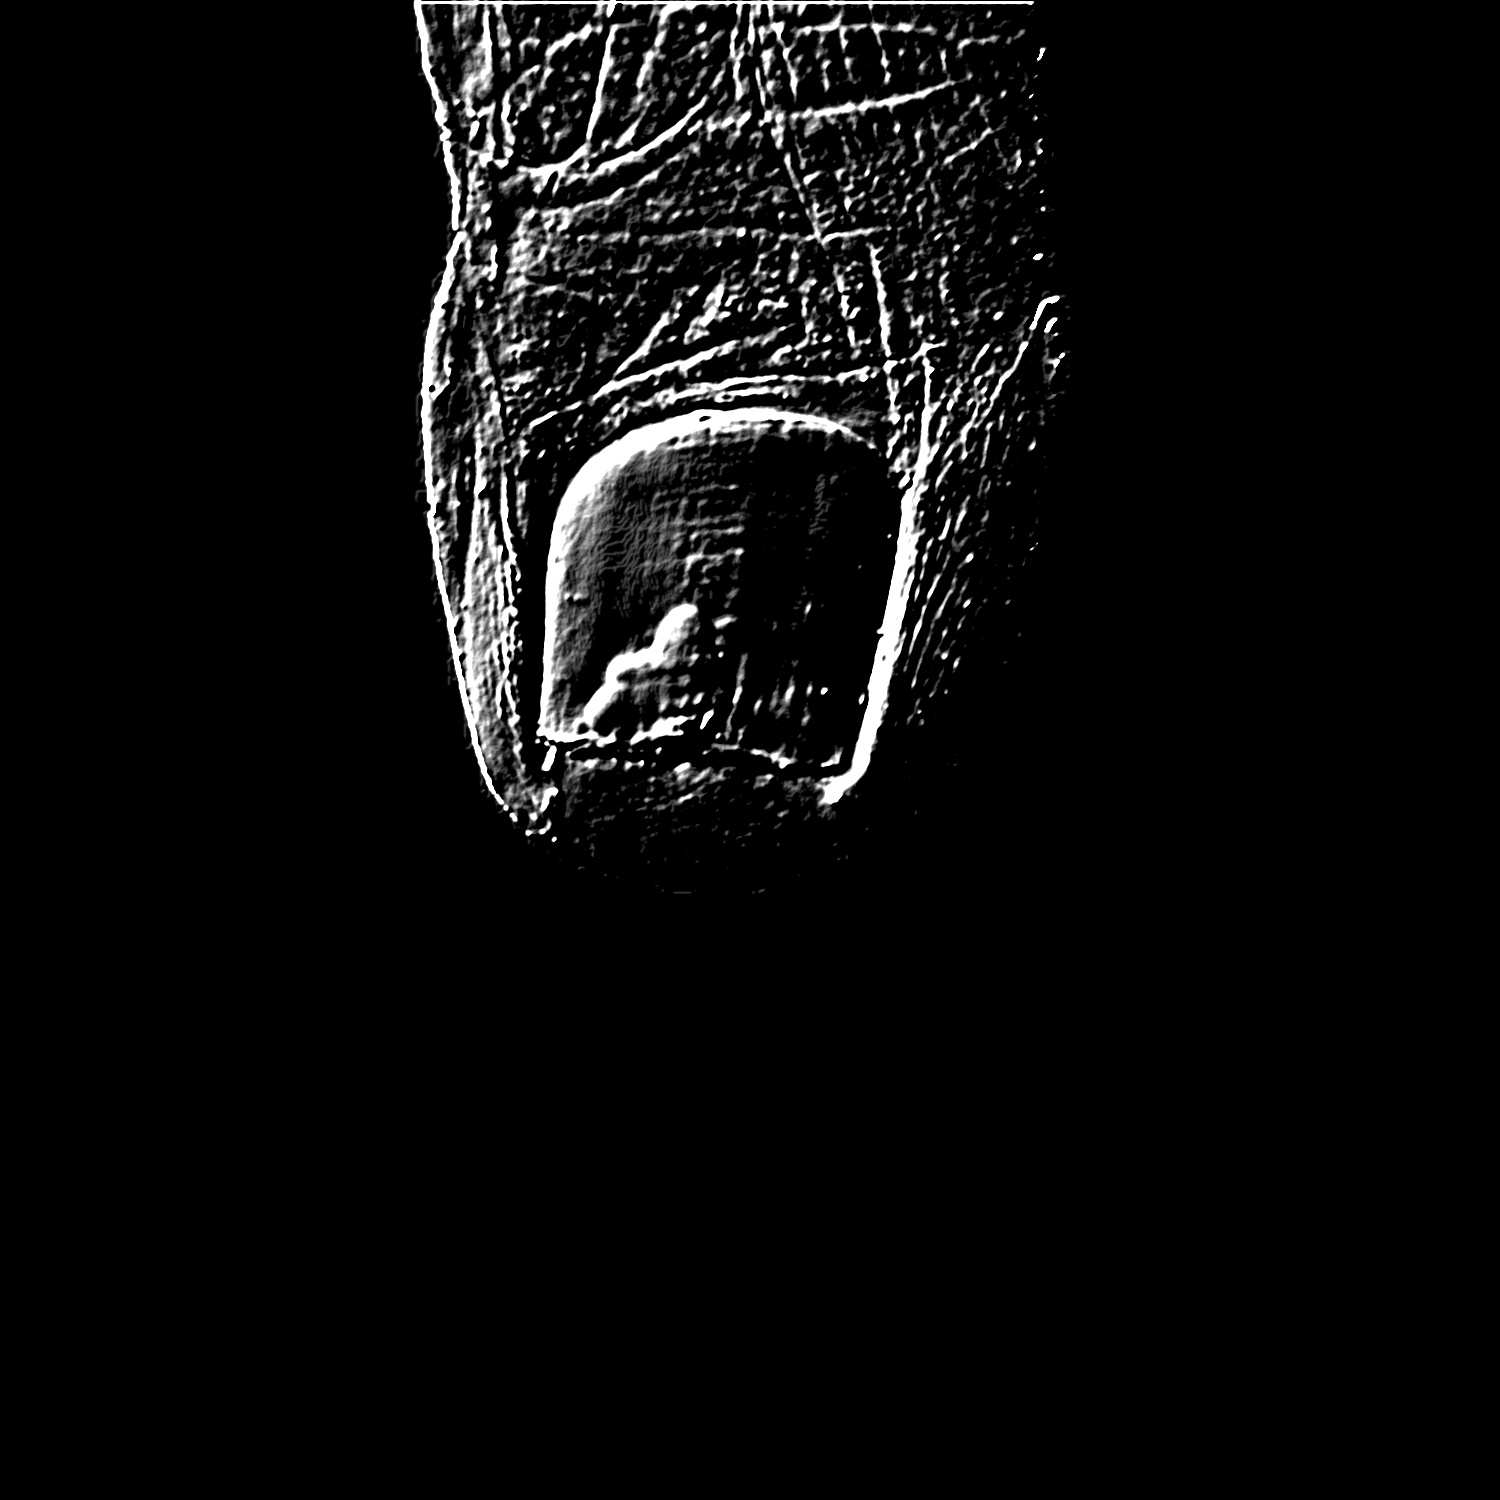
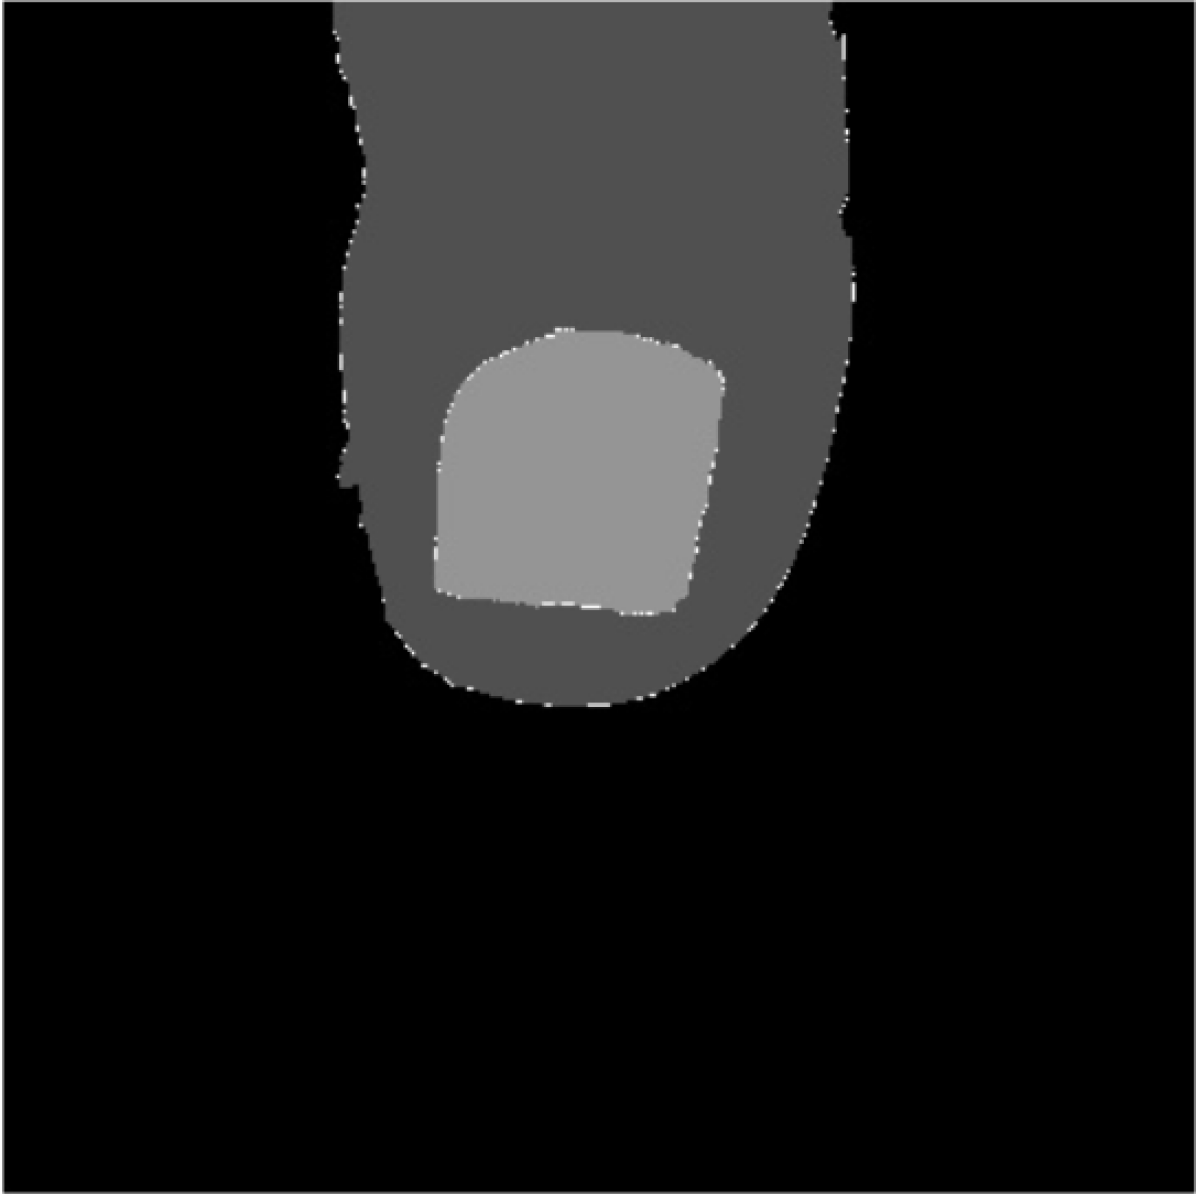
In Fig. 7(a), we can appreciate that the contours of the nail are sharp. Thus, provided the initial markers are corrected, the growth of the nail and skin regions would be prone to stop at these edges. This has been actually the case when processing images in practice, as shown in Fig. 7(d).
3 Experimentation and Results
In this section, we study the results provided by the algorithm and, when appropriate, discuss the design decisions taken during its development. We analyze which are the more informative features to distinguish between nail and toe regions, which proved to be the hardest problem in practice. Also, we introduce quantitative performance measures to provide objective indicators of how successful the proposed method is.
3.1 Experimental framework
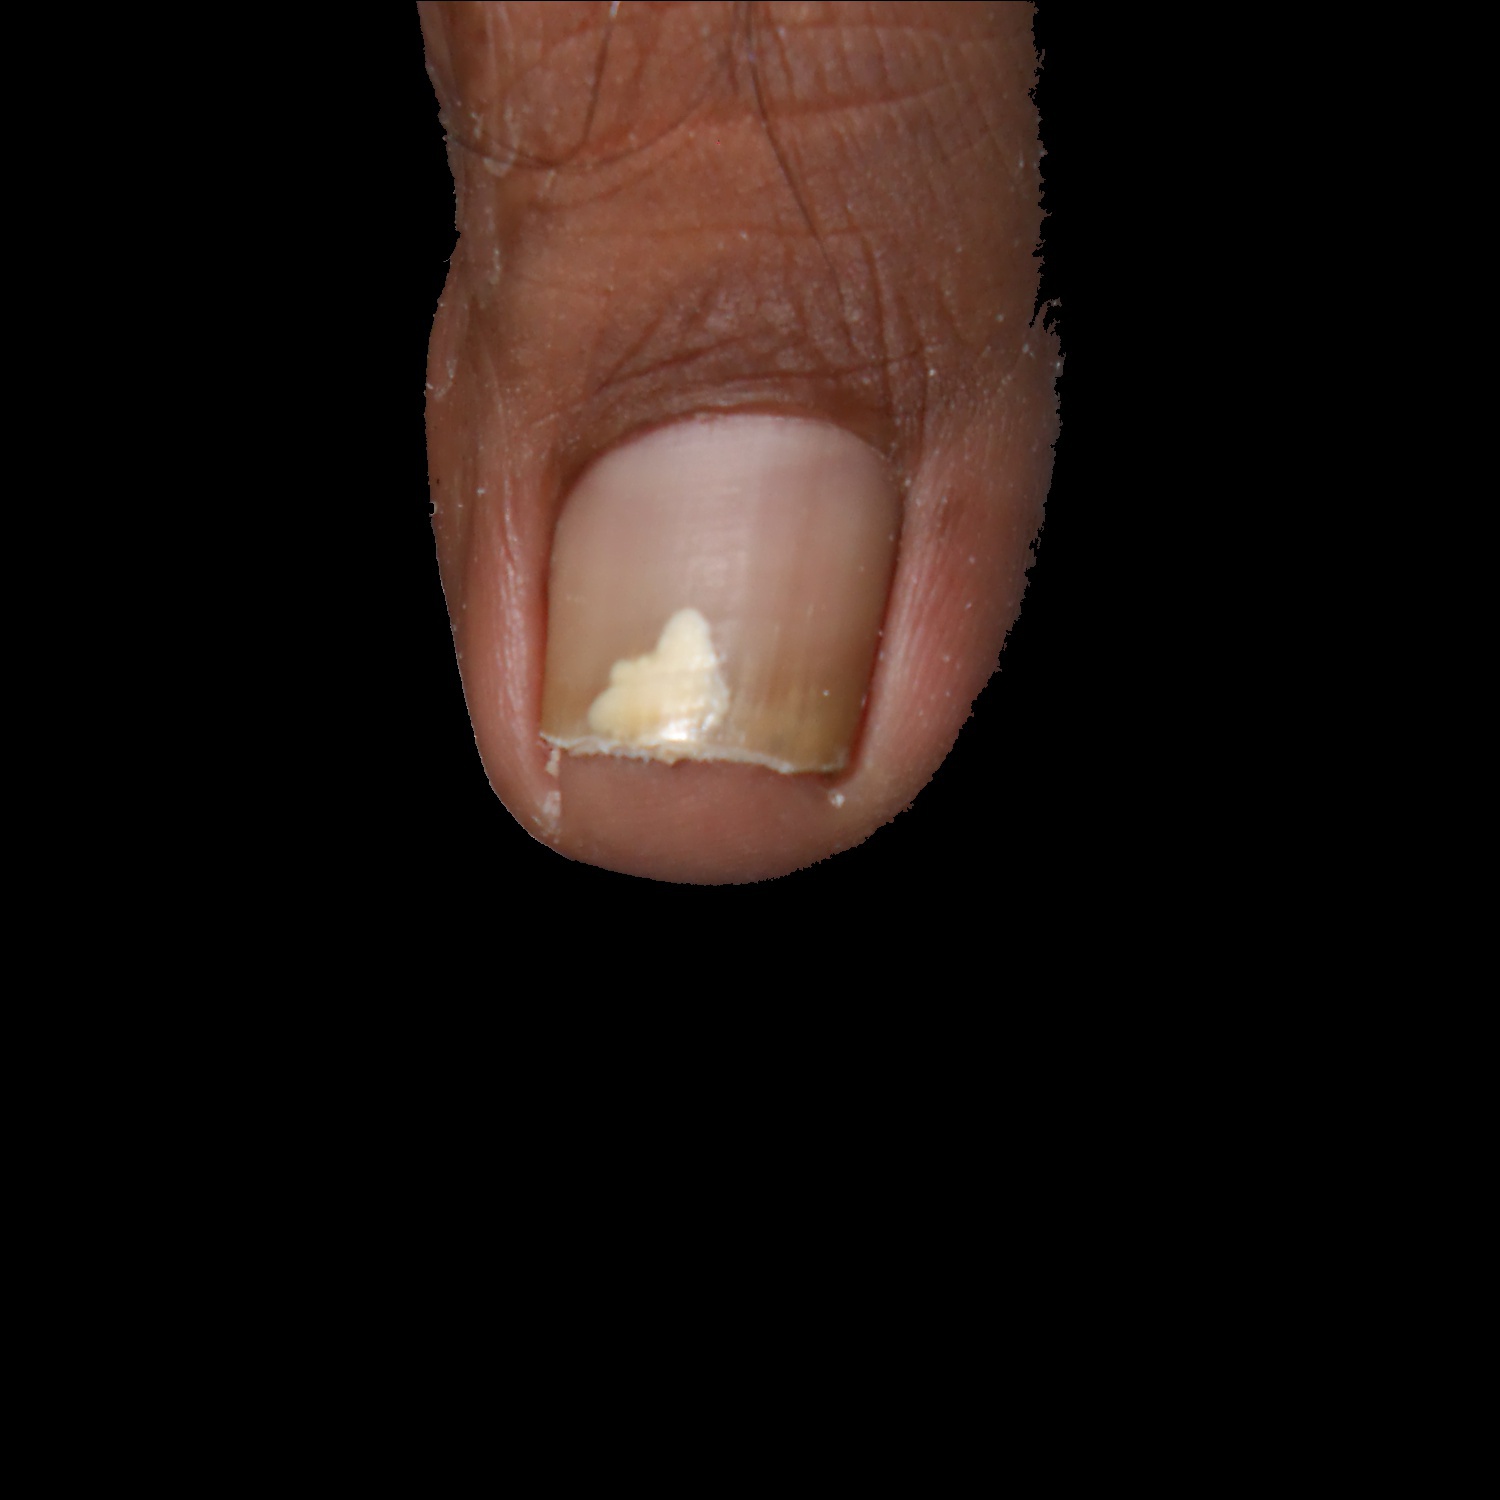
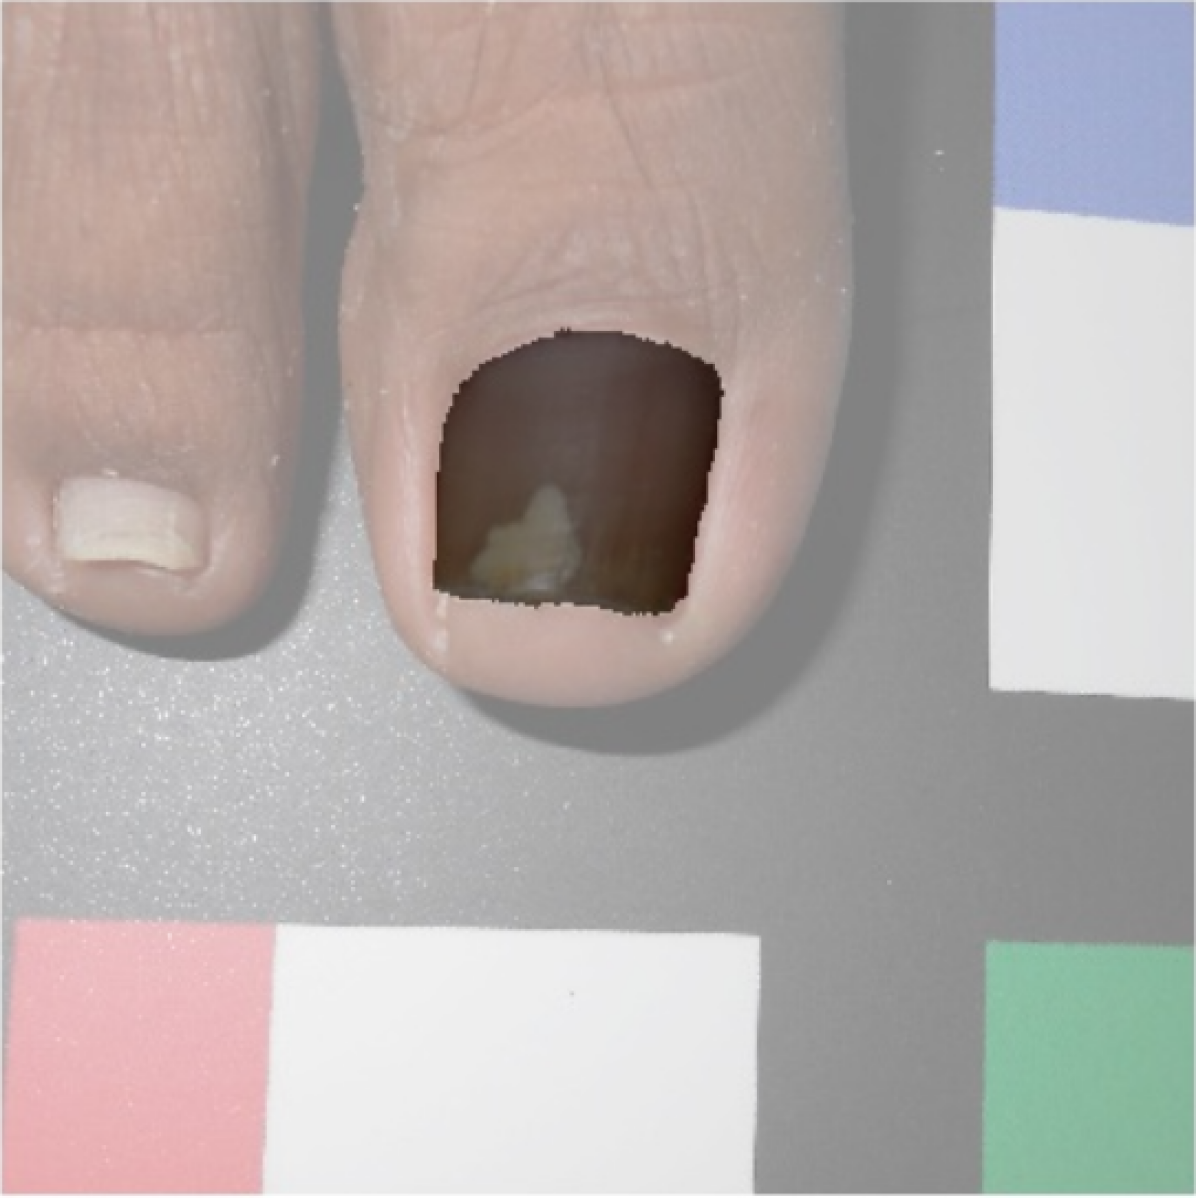
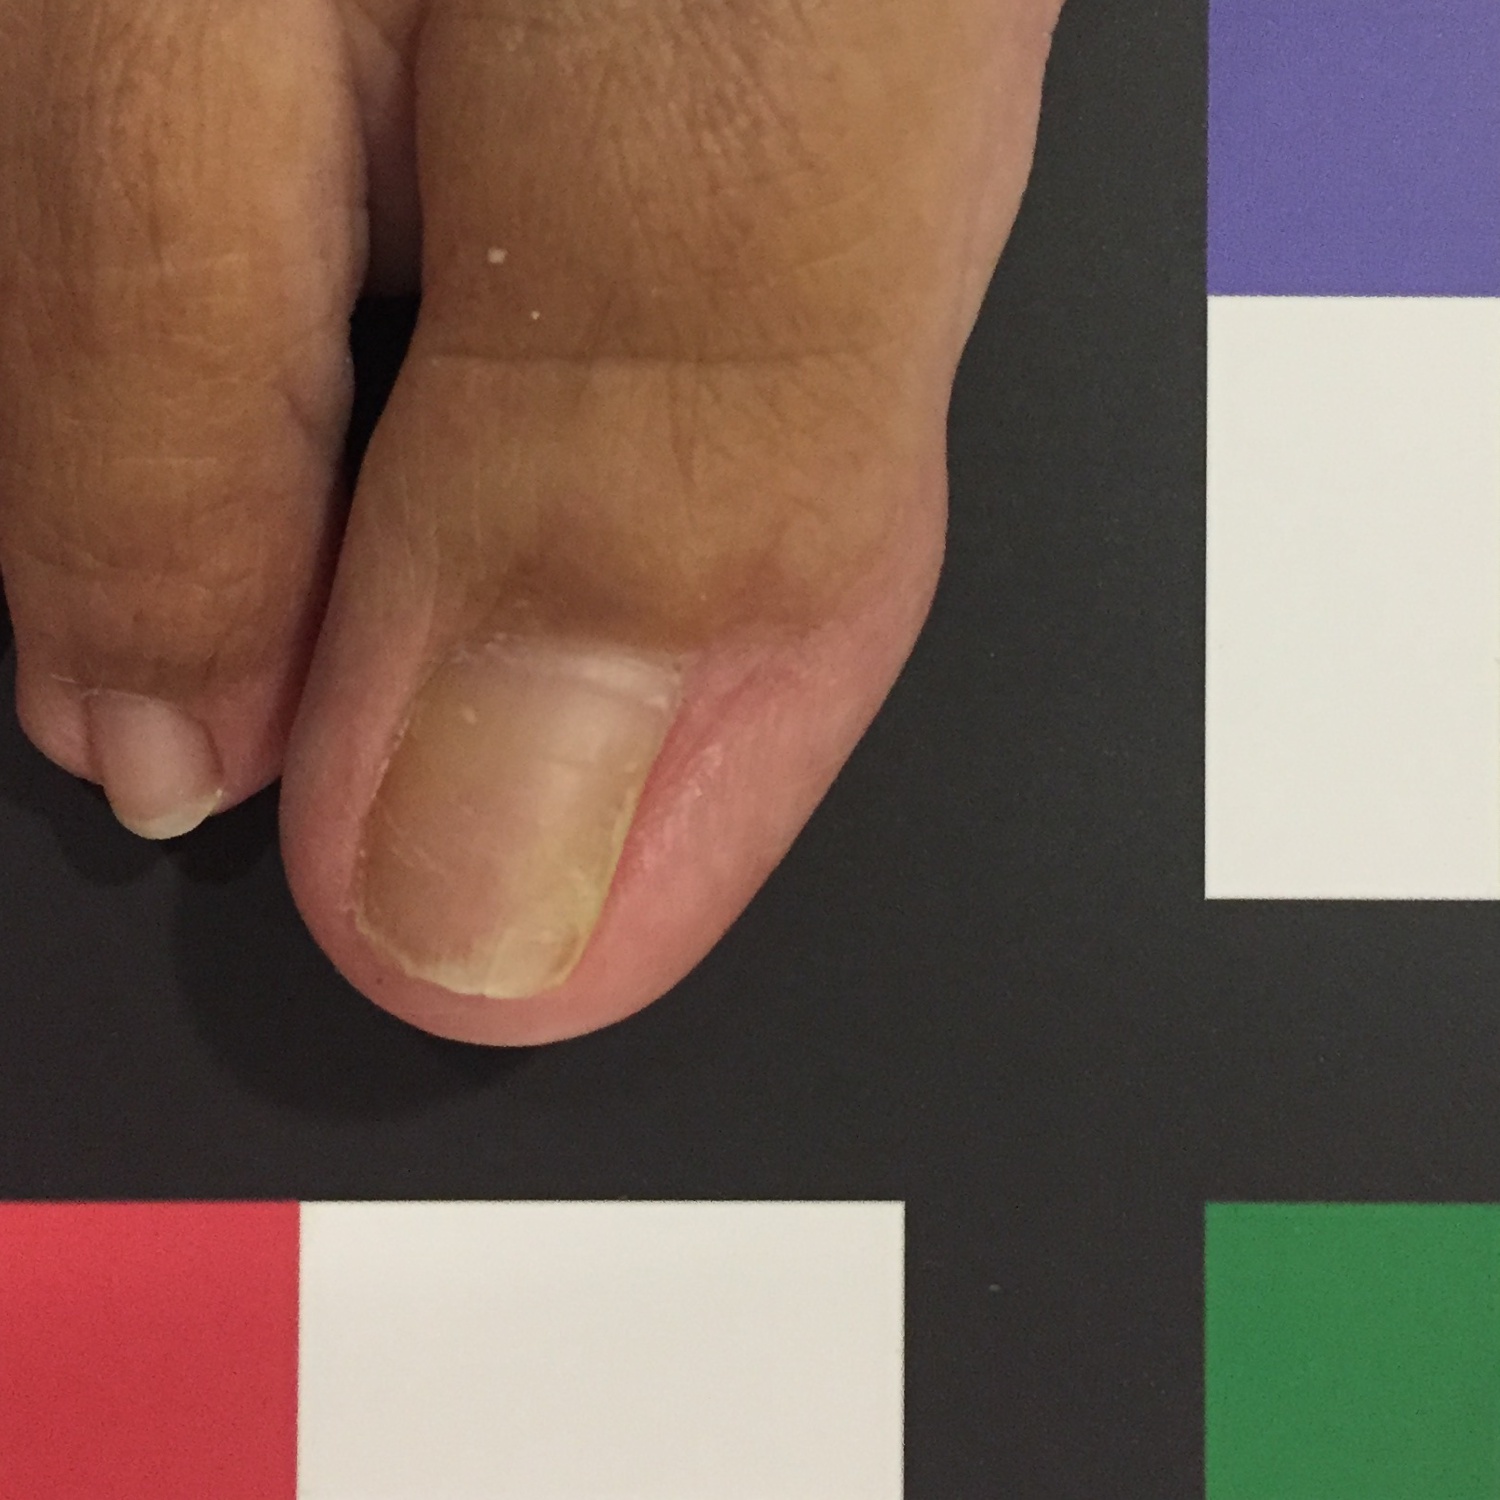
The dataset is composed of 348 images of human big toes acquired using the doctor’s cameras attached to off-the-shelf smartphones. A sample image is found in Fig. 8. As previously explained, during the image acquisition stage, some parameters could not be controlled, such as the illumination, the specific capture viewpoint and the camera specifications.
To accurate evaluate the method’s performance, we divide the images in two sets: 257 images for training and 91 for testing. All of them have a manually segmented ground truth which separates the classes of toe, nail and surrounding background (corresponding to the template employed).
Several performance metrics are used to quantify the results obtained. They complement the visual representations, such as the one in Fig. 7, since they exhibit the results over the whole dataset. Since we are dealing with a segmentation task, we employ pixel-wise measures. The performance measures used are sensitivity, specifity, accuracy, precision, F-measure and Cohen’s kappa. They complement each other: each of them captures distinctly different deviations from the expected result.
3.2 Method’s performance
In this section we expose and explain the results obtained after running the classification stage of the method.
To study the task at hand, we analyse the importance of each feature used to distinguish nail and toe regions. In Fig. 9, we can see the importance of the features in the gradient boosting classifier. Such feature importance is averaged over the trees that conform the gradient boosting ensemble. In individual trees, it is a measure of how well each variable splits the data at a specific node Hastie et al. (2009).
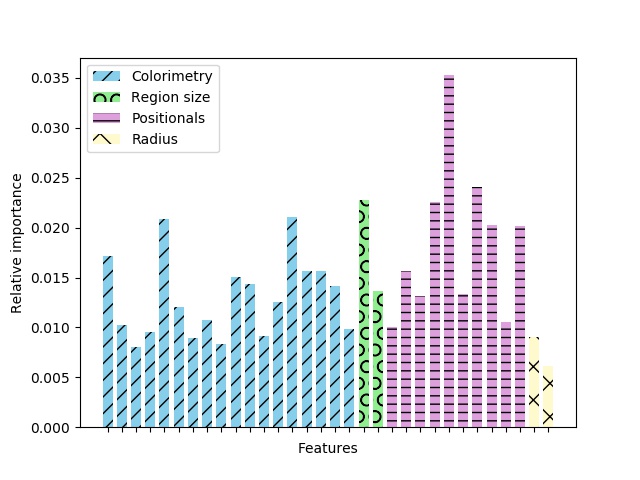
We observe that the most informative feature of the classifier is, however, a positional feature: the distance between a super-pixel centroid and the center of the estimated nail circle. Again in Fig. 9, we observe that the difference between this feature importance and the other ones is enormous in relative terms. This is because the regions identified as nail are the ones closer to the circle, and the distant ones can be straightforwardly discarded.
The colorimetry represents the larger group of features used by the training models. The two most informative ones in this group are the mean and the standard deviation of the a channel from the CIELAB color space.
Other features that give important information are the super-pixel area, and the distances in the Y axis to the nail circle and to the lowest skin pixel.
In Fig. 10, we can appreciate the evolution of the method accuracy when sequentially adding features to the gradient boosting classifier. The features are added in the order of importance already shown in Fig. 9.
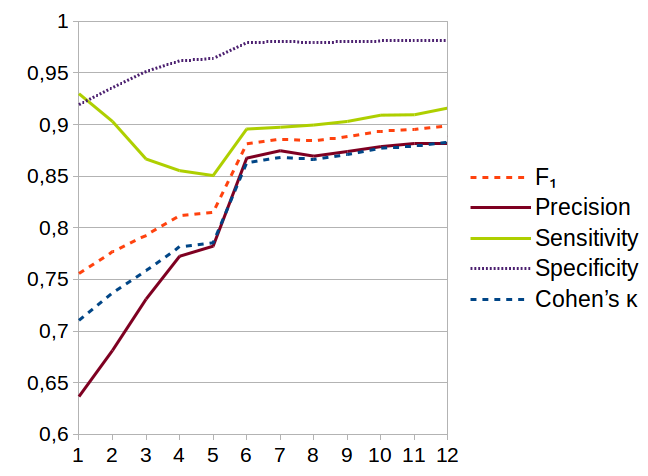
Table 3 presents the results obtained by evaluating the final mask—provided by the watershed algorithm—against a manually built ground truth. The results are evaluated according to different metrics. We remark the role of the -measure, the harmonic average of precision and recall; and the Cohen’s , which indicates the rate of agreement between the two classes. We consider both of them as being high, in particular when compared to other segmentation tasks.
| Dataset | Sensitivity (average) | Specificity (average) | Precision (average) | Accuracy (average) | -measure (average) | Cohen’s (average) |
|---|---|---|---|---|---|---|
| Train set | 0.955 | 0.998 | 0.957 | 0.996 | 0.955 | 0.953 |
| Test set | 0.925 | 0.997 | 0.936 | 0.993 | 0.925 | 0.922 |
4 Conclusions
This paper introduces a nail segmentation for the big toe, based on a series of image processing operators. Each of them is based on the information provided by the previous one. Far from amplifying the errors, subsequent steps are designed to correct possible deviations, refining the result provided by the previous step.
In the following, we discuss how different techniques exploit the different aspects of our task – segmenting nails from the rest of the skin. We end the paper with some remarks of the limitations and contributions that this work represents.
4.1 Qualitative analysis
In this section we discuss the rationale of how different steps take advantage of the problem characteristics.
Nail and skin can not be segmented using only color or local information. The pixel-wise colors of human nails are indistinguishable from those belonging to toes (see Sect. 2). This is specially important when dealing with different skin shades or illumination conditions. We can not, however, disregard photometric information (see Fig. 9).
Although nails present a diversity of shapes, they tend to fit well in a geometric circle. However, such circle does not necessarily delimit its actual edges. The Hough transform was successfully estimate the nail circle after removing the between toe and background.
Along the same line, the boundary between nail and toe is really sharp but hard to discriminate from spurious contours. Using the watershed algorithm, we leverage the fact that nails are very well defined by their contours, even better than by their colorimetry, size or shape. To use this boundary, we must know in advance a spatial location inside the nail and another one outside it.
4.2 Discussion
The algorithm introduced is designed to robustly segment the toenail from images taken from different cameras, angles and lighting conditions. It is being currently used in the clinical practice. In particular, it helps to measure the nail surface, easing the temporal analysis of patients suffering from a pathology that affects their toenail.
Two limitations must be mentioned. First, we only considered skin shades from Caucasian patients due to the locations where the project was being held. Second, a large contribution of the error is located in the lateral area of nails. These darker regions tend to be wrongly estimated as skin. However, this tends to have small effects on measurements of the nail area.
Despite such error-prone regions, we consider that our algorithm reliably segments nails from human toes, successfully addressing the task for which it was designed. We consider so based on the qualitative examination of several samples, its robustness across the whole set of images, and on the quantitative metrics obtained.
A good experimental framework also substantiates our previous claim. Performance measures have been obtained by considering disjoint training and test sets—although the test set was used to select the best classifier, which could have leaked some bits of information of the otherwise unseen test set. Also, the black background, much easier to segment, has not been taken into account to compute the metrics. As the data belongs to a pharmaceutical company the database used for this study must remain private.
Here, we want to remind that for trusting the behavior of intelligent systems, especially in medicine, they must be able to explain their decisions and actions to human users through techniques that produce more explainable models whilst maintaining high performance levels Adadi and Berrada (2018). For this reason, we analysed the importance of each feature used to distinguish nail and toe regions over the trees that conform the gradient boosting ensemble. Feature relevance techniques seem to be one of the most used scheme as a post-hoc explainability technique in the field of tree ensembles Arrieta et al. (2020). Then, we can conclude that the proposed method can be described as an explainable intelligent system.
Although the data acquisition was somewhat controlled with the use of a template, the photographs were captured with off-the-shelf smartphones, with uneven illumination and during clinical practice. The aforementioned robustness of the algorithm is a prerequisite to consider broadening its scope. In this direction, its use could also be proposed (i) in less controlled environments and (ii) to segment hand nails, since is a very similar task to toe nail segmentation.
Declarations
Funding
We acknowledge the Ministerio de Economía, Industria y Competitividad (MINECO), the Agencia Estatal de Investigación (AEI), and the European Regional Development Funds (ERDF) for its support for the projects TIN 2016-75404-P (AEI/FEDER, UE), TIN2016-81143-R (AEI/FEDER, UE), and EXPLAINING (PID2019-104829RA-I00 / AEI / 10.13039/501100011033).
We also acknowledge the Govern de les Illes Balears for its support for the project PROCOE/2/2017. P. Bibiloni also benefited from the fellowship FPI/1645/2014 under an operational program co-financed by the European Social Fund.
Conflicts of interest
The authors certify that they have NO affiliations with or involvement in any organization or entity with any financial interest (such as honoraria; educational grants; participation in speakers’ bureaus; membership, employment, consultancies, stock ownership, or other equity interest; and expert testimony or patent-licensing arrangements), or non financial interest (such as personal or professional relationships, affiliations, knowledge or beliefs) in the subject matter or materials discussed in this manuscript.
Availability of data and material
The images used in this article belong to the company that conducted the clinical study.
Code availability
The source code used in this article belongs to the company that conducted the clinical study.
Acknowledgments
We would also thank Syntax for Science, a company founded in Spain specialized in clinical research which provides biometrics-related services. APSL has been the technological provider of this project.
References
- Adadi and Berrada (2018) Adadi, A. and Berrada, M. (2018). Peeking inside the black-box: A survey on explainable artificial intelligence (xai). IEEE Access, 6:52138–52160.
- Arrieta et al. (2020) Arrieta, A. B., Díaz-Rodríguez, N., Del Ser, J., Bennetot, A., Tabik, S., Barbado, A., García, S., Gil-López, S., Molina, D., Benjamins, R., et al. (2020). Explainable artificial intelligence (xai): Concepts, taxonomies, opportunities and challenges toward responsible ai. Information Fusion, 58:82–115.
- Barbosa et al. (2013) Barbosa, I. B., Theoharis, T., Schellewald, C., and Athwal, C. (2013). Transient biometrics using finger nails. In 2013 IEEE Sixth International Conference on Biometrics: Theory, Applications and Systems (BTAS), pages 1–6. IEEE.
- Easwaramoorthy et al. (2016) Easwaramoorthy, S., Sophia, F., and Prathik, A. (2016). Biometric authentication using finger nails. In 2016 International Conference on Emerging Trends in Engineering, Technology and Science (ICETETS), pages 1–6.
- Fujishima and Hoshino (2012) Fujishima, N. and Hoshino, K. (2012). Fingernail detection in hand images using difference of nail-color pixels’ density between vicinity areas of fingernails and skin. In 2012 IEEE 1st Global Conference onConsumer Electronics (GCCE), pages 233–237. IEEE.
- Fujishima and Hoshino (2013) Fujishima, N. and Hoshino, K. (2013). Fingernail detection method from hand images including palm. In IAPR International conference onMachine Vision Applications, pages 117–120.
- Gauns Dessai and Borkar (2018) Gauns Dessai, S. N. and Borkar, S. (2018). Finger nail recognition system using neural network. In 2018 2nd International Conference on I-SMAC (IoT in Social, Mobile, Analytics and Cloud) (I-SMAC)I-SMAC (IoT in Social, Mobile, Analytics and Cloud) (I-SMAC), 2018 2nd International Conference on, pages 656–659.
- Gonzalez and Woods (2009) Gonzalez, R. C. and Woods, R. E. (2009). Image segmentation. In Digital Image Processing using Matlab (2nd Edition), pages 535–596. Gatesmark Publishing.
- Hastie et al. (2009) Hastie, T., Tibshirani, R., and Friedman, J. (2009). The elements of statistical learning: data mining, inference and prediction. Springer.
- Juna and Dhananjayan (2019) Juna, V. and Dhananjayan, D. (2019). A review on nail image processing for disease detection. Recent Trends in Analog Design and Digital Devices, 2(3).
- Kovac et al. (2003) Kovac, J., Peer, P., and Solina, F. (2003). Human skin color clustering for face detection. In The IEEE Region 8 EUROCON 2003. Computer as a Tool., volume 2, pages 144–148.
- Kumar et al. (2014) Kumar, A., Garg, S., and Hanmandlu, M. (2014). Biometric authentication using finger nail plates. Expert systems with applications, 41(2):373–386.
- Kumuda and Dinesh (2015) Kumuda, N. and Dinesh, M. (2015). Human fingernail segmentation. In Computer Science and Technology (ICERECT), 2015 International Conference on Emerging Research in Electronics, pages 270–275. IEEE.
- Kumuda et al. (2016) Kumuda, N., Dinesh, M., and Kumar, G. H. (2016). Characterization of human fingernails using iterative thresholding segmentation. In Proceedings of the Second International Conference on Computer and Communication Technologies, pages 259–270. Springer.
- Kurniastuti (2018) Kurniastuti, I. (2018). Active shape model in automatic segmentation of hand fingernail image. In PROCEEDING International Conference Technopreneur and Education 2018, volume 1.
- Lee et al. (2016) Lee, S.-H., Yang, C.-S., Hou, T.-W., and Yeh, C.-H. (2016). An image preprocessing method for fingernail segmentation in microscopy image. IEEE International Conference on Signal and Image Processing.
- Marulkar and Mente (2018) Marulkar, S. and Mente, R. (2018). Nail image segmentation for disease detection. In International Conference on Recent Trends in Image Processing and Pattern Recognition, pages 116–126. Springer.
- Mente and Marulkar (2017) Mente, R. and Marulkar, S. (2017). A review: Fingernail images for disease detection. International Journal Of Engineering And Computer Science, 6(11):22830–22835.
- Meyer (1992) Meyer, F. (1992). Color image segmentation. In International Conference on Image Processing and its Applications, 1992., pages 303–306. IET.
- Tolentino et al. (2018) Tolentino, L. K., Aragon, R. M., Tibayan, W. R., Alvisor, A., Palisoc, P. G., and Terte, G. (2018). Detection of circulatory diseases through fingernails using artificial neural network. Journal of Telecommunication, Electronic and Computer Engineering (JTEC), 10(1-4):181–188.
- Vedaldi and Soatto (2008) Vedaldi, A. and Soatto, S. (2008). Quick shift and kernel methods for mode seeking. In European Conference on Computer Vision, pages 705–718. Springer.
- Wang et al. (2013) Wang, Y., Chen, J., and Su, G. (2013). Efficient hand segmentation and fingertip detection using color features of skin and fingernail. IEICE Transactions on Information and Systems, 96(8):1894–1897.
- Yu Fukunaka and Sato (2012) Yu Fukunaka, Hiroshi Suzuki, S. C. and Sato, H. (2012). Recognition of fingernail. Nicograph International, 12(7):198–199.
![[Uncaptioned image]](/html/2501.06027/assets/images/authors/bernat.png)
Bernat Galmés Rubert is a PhD student at the Balearic Islands University (UIB). He obtained his Master’s degree in computer science in 2018 at the Open University of Catalonia.
![[Uncaptioned image]](/html/2501.06027/assets/images/authors/biel.png)
Gabriel Moyà Alcover obtained the Ph.D. in Computer Science in 2016. His main research interests are mainly about computer vision. He is researcher at the Computer Graphics and Vision and Artificial Intelligence Group.
![[Uncaptioned image]](/html/2501.06027/assets/images/authors/pedro-bibiloni.jpg)
Pedro Bibiloni is a lecturer at the University of the Balearic Islands. He received a Ph.D. at the University of the Balearic Islands (2018). His research interests are medical image processing and pattern recognition.
![[Uncaptioned image]](/html/2501.06027/assets/images/authors/xavi-varona.jpg)
Javier Varona Gómez PhD in Computer Science. He has participated in over 10 research funded projects (in 5 of them as principal investigator). Among his research interests are computer vision and artificial intelligence.
![[Uncaptioned image]](/html/2501.06027/assets/images/authors/toni-jaume.jpg)
Antoni Jaume-i-Capó: PhD in Computer Science. Among his research lines are computer vision, medical imaging processing. He is researcher at the Computer Graphics and Vision and Artificial Intelligence Group.