[1]\fnmChristian \surBauer
[1]\orgdivInstitute of Aerodynamics and Flow Technology, \orgnameGerman Aerospace Center, \orgaddress\streetBunsenstr. 10, \cityGöttingen, \postcode37073, \countryGermany
2]\orgdivTUM School of Engineering and Design, \orgnameTechnical University of Munich, \orgaddress\streetArcisstr. 21, \cityMunich, \postcode80333, \countryGermany
3]\orgdivInstitute for Water and Environment, \orgnameKarlsruhe Institute of Technology, \orgaddress\streetKaiserstr. 12, \cityKarlsruhe, \postcode76131, \countryGermany
How far does the influence of the free surface extend in turbulent open channel flow?
Abstract
Turbulent open channel flow is known to feature a multi-layer structure near the free surface. In the present work we employ direct numerical simulations considering Reynolds numbers up to and domain sizes large enough (, ) to faithfully capture the effect of very-large-scale motions in order to test the proposed scaling laws and ultimately answer the question: How far does the influence of the free surface extend? In the region near the free surface, where fluctuation intensities of velocity and vorticity become highly anisotropic, we observe the previously documented triple-layer structure, consisting of a wall-normal velocity damping layer that scales with the channel height , and two sublayers that scale with the near-surface viscous length scale and with the Kolmogorov length scale , respectively. The scaling laws previously proposed by Calmet and Magnaudet [J. Fluid. Mech. 474, 355–378 (2003)] are found to hold with the following exceptions. The thin layer, where the intensity of surface-parallel components of the vorticity rapidly decreases to zero, is here found to scale with the Kolmogorov length scale rather than with the near-surface viscous scale . In addition, we argue that the Kolmogorov length scale is the relevant scale for the mean velocity gradient near the free surface. Both the mean velocity gradient and the fluctuation intensity of the surface-parallel component of vorticity decay to zero in the Kolmogorov sublayer . On the other hand, the layer, where the wall-normal turbulence intensity decreases linearly to zero near the free surface, scales with rather than as suggested by Calmet and Magnaudet. The corresponding near-surface viscous sublayer measures . Importantly, the streamwise turbulence intensity profile for suggests that the influence of the free-slip boundary penetrates essentially all the way down to the solid wall through the appearance of enhanced very-large-scale motions (). In contrast, the layer where the surface-normal turbulence intensity is damped to zero is restricted to the free surface (). As a consequence, the partitioning of the surface-influenced region has to be expanded to a four-layer structure that spans the entire channel height .
keywords:
turbulent open channel flow, direct numerical simulation, free surface1 Introduction
Plane Poiseuille flow, also known as closed channel flow (CCF), is one of the most studied canonical flows by means of direct numerical simulations [DNSs, 22, 27, 15, 24, 33]. The numerical domain is defined by doubly-periodic boundaries in the stream- and spanwise directions, and impermeable no-slip walls at the bottom and the top. Conversely, less attention has been paid to open channel flow (OCF), where one of the no-slip walls is replaced by a free-slip plane, despite its direct relevance to environmental flows. As noted by Pinelli et al. [37], OCF is of particular interest when studying the mass transfer across gas-liquid interfaces in oceans or engineering applications. One of the defining characteristics of OCF is the transfer of kinetic energy from the vertical to the surface-parallel velocity components due to the damping effect of the free surface [39, 25, 17, 23, 35]. While the inter-component kinetic energy transfer is dominated by the small scales in the vicinity of the free surface, Pinelli et al. [37] showed that low-speed large- and very-large-scale motions ((V)LSMs) are much more correlated with the regions of small-scale vortices than high-speed (V)LSMs. Hence, the spatial distribution of the small scales in the vicinity of the free surface is modulated by the large scales. Most of the early OCF DNSs were restricted to small friction Reynolds numbers , based on friction velocity , channel height and kinematic viscosity , and/or small computational domains. Recently, Yao et al. [41] compared CCF and OCF by means of DNS data in computational domains of for Reynolds numbers up to . In agreement with experiments [9, 12] and previous DNSs [3], they reported that VLSMs—which are a common feature of wall-bounded turbulent flows—are more energetic and larger in OCF than in CCF. Generally, VLSMs become more energetic with increasing Reynolds number [3, 12, 41], leading to the failure of wall scaling of the streamwise intensity in CCF [15]. As resported by [15] for CCF, the streamwise turbulence intensity scales neither in wall nor in bulk units. To compare wall-attached motions between OCF and CCF, Gong et al. [13] performed DNSs in extremely large domains of length for and length for . They found that wall-attached motions contribute more to the turbulent intensity in OCF than in CCF. In Bauer et al. [7], the current authors carried out DNSs at friction Reynolds numbers up to in large computational domains up to and found that unlike CCF, the streamwise turbulence intensity in OCF scales with the bulk velocity for . The additional streamwise kinetic energy in OCF was attributed to larger and more intense VLSMs compared to CCF.
Aiming at the characterization of the multiple-layer structure in the vicinity of the free surface in OCF, Calmet and Magnaudet [8] —hereinafter referred to as CM03— derived scaling laws for turbulence statistics based on the rapid distortion theory, which was originally applied by Hunt and Graham [14] to the shear-free flow along a flat surface.
CM03 first deduced an integral length scale using the assumption of high-Reynolds-number equilibrium between kinetic energy transfer and dissipation rate, , (where and is the characteristic scale of the energetic eddies) and the relation which Hunt and Graham [14] found to be valid for homogeneous-isotropic turbulence. Subsequently, CM03 performed a large-eddy simulation (LES) of OCF at and compared their results to these scaling relations. Based on their data, CM03 estimated the thickness of the so-called “surface-influenced layer” as , in agreement with the rapid distortion theory of Hunt and Graham [14]. CM03 further categorized the surface-influenced layer into the following sublayers in the near-surface region: a viscous sublayer (of wall-normal extent ) which scales with , and a Kolmogorov sublayer (of extent ) which scales with . Note that is the turbulent Reynolds number evaluated at the bottom of the surface-influenced region (at a distance of from the free surface) The data of CM03 suggested that the wall-parallel vorticity magnitude decays to zero within the viscous sublayer, whereas the wall-normal velocity magnitude grows linearly within the Kolmogorov sublayer. Note that the LES of CM03 with a Reynolds number of was performed in a comparatively small computational domain (, ) that is too restrictive to accommodate VLSMs [7]. Moreover, uncertainties from their sub-grid scale model motivates a follow-up investigation by means of DNS.
In the present work we are addressing the research question ”How far does the influence of the free surface extend in turbulent open channel flow?” by revisiting the scaling predictions by CM03, whilst taking into account the latest findings regarding VLSMs and the bulk velocity scaling reported by Bauer et al. [7]. For this purpose we analyze the OCF DNS data published in Bauer et al. [6] in a Reynolds number regime where VLSMs begin to play a role (up to ) and in a computational domain large enough to capture them (, ) with a grid refinement towards the free surface sufficient to resolve the thin near-surface layers.
2 Numerical Method
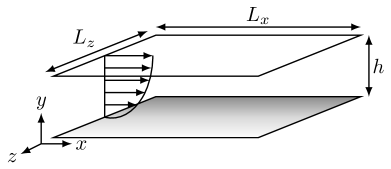
The numerical method is identical to the one employed by Kim et al. [22], where the incompressible Navier-Stokes equations are solved in their wall normal velocity-vorticity formulation. The flow variables are expanded in terms of Fourier series in the homogeneous stream- and spanwise directions, and Chebyshev polynomials in the wall normal direction, respectively. While this implies periodic boundary conditions in the stream- and the spanwise directions, a smooth no-slip wall at the bottom ( and a free-slip boundary condition at the top of the channel () are explicitly imposed in OCF as sketched n figure 1.
The numerical method has shown its validity in numerous CCF simulations [22, 27, 20, 10, 11]. Nevertheless, the introduction of a free-slip surface has to be regarded separately. A Chebyshev-Gauss-Lobatto grid, which is adopted in the surface-normal direction, provides a grid refinement both towards the wall and the free surface. The necessity of the grid refinement also in the vicinity of the free-slip boundary will become obvious in the following discussion section. Additional information regarding the grid refinement can be found in appendix A.
Our database features four different OCF and four different CCF simulation cases, summarized in table 1, where the Reynolds number and the computational domain length are varied. Statistics are either computed during runtime (turbulence intensities and spectral statistics) or from a series of instantaneous flow realizations (three-dimensional velocity correlations).
| case | |||||||||||
|---|---|---|---|---|---|---|---|---|---|---|---|
| O200 | 200 | 3170 | 768 | 129 | 512 | 9.8 | 4.9 | 2.5 | 8660 | ||
| O400 | 399 | 6969 | 1536 | 193 | 1024 | 9.8 | 4.9 | 3.3 | 1925 | ||
| O600 | 596 | 11047 | 1536 | 257 | 1536 | 14.6 | 4.8 | 3.7 | 1460 | ||
| O900 | 895 | 17512 | 3072 | 385 | 2048 | 11.0 | 5.5 | 3.7 | 1054 | ||
| C200 | 200 | 3170 | 768 | 129 | 512 | 9.8 | 4.9 | 4.9 | 8600 | ||
| C400 | 397 | 6969 | 1536 | 193 | 1024 | 9.8 | 4.9 | 6.5 | 3260 | ||
| C600 | 593 | 11047 | 1536 | 257 | 1536 | 14.6 | 4.8 | 7.3 | 1757 | ||
| C900 | 889 | 17512 | 3072 | 385 | 2048 | 11.0 | 5.5 | 7.3 | 1013 |
Hereinafter, angular brackets denote averaging over both homogeneous directions and time. Normalization in viscous or “wall units” is indicated by a superscript. Corresponding scales are the friction velocity and the viscous length scale . Characteristic scales for normalization in “bulk units” on the other hand are the bulk velocity and the channel height . Hence, the bulk Reynolds number is defined as .
3 Results
As stated in section 1, CM03 defined the near-surface length scales based on a turbulent Reynolds number which characterizes the “turbulence below the surface-influenced region” (CM03). However, since in channel flow is closely linked to the bulk Reynolds number , herein we define the near-surface length scales based on and on the channel height , which are readily accessible parameters in wall-bounded turbulence. Henceforth we use the following definitions:
| (1) | |||
| (2) |
as characteristic length scales for the wall-normal extent of the near-surface viscous and Kolmogorov sublayers, respectively.
3.1 Mean velocity scaling
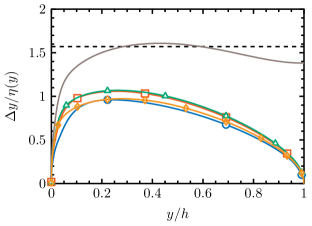
In order to adapt to the free-slip boundary condition the surface-normal derivatives of the surface-parallel velocities decay to zero when approaching the free surface. [18] suggested that the mean velocity gradient remains approximately zero within a thin viscous sublayer near the free surface. Nevertheless, to the knowledge of the present authors, the scaling of the mean velocity gradient near the free surface has not been investigated to date. Therefore, we present the profile of the surface-normal derivative of the mean streamwise velocity in OCF in figure 2.
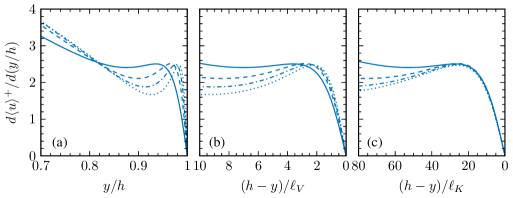
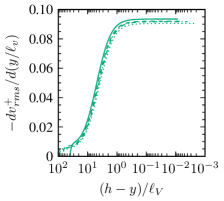
Here, the distance from the free surface is normalized with different length scales, i.e. the channel height (figure 2a), the near-surface viscous length scale (figure 2b), and the near-surface Kolmogorov length scale (figure 2c). It can be seen that the streamwise velocity derivative profiles in the immediate vicinity of the free surface collapse well when the surface-normal coordinate is normalized with the near-surface Kolmogorov length scale (figure 2c). Moreover, the layer thickness where the mean velocity derivative rapidly decays to zero measures approximately . Note that unlike anticipated by [18], a region where stays approximately zero when moving away from free surface does not exist. Finally, the observed scaling clearly shows a necessity for fine grid resolutions near the free surface when performing OCF DNSs. We will return to this topic in section 3.5
3.2 Turbulence intensity scaling
The extent of the surface-influenced layer can be estimated by comparing turbulence intensities from OCF with their closed channel counterpart, as presented in figure 3.
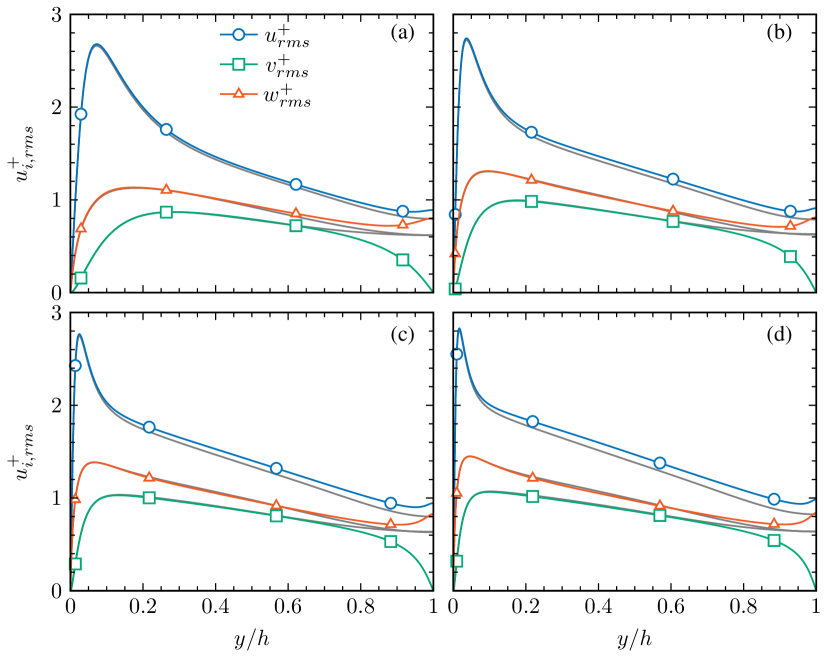
Note that the OCF domain upper limit at =1 corresponds to the channel centerline of the closed channel configuration. The spanwise and wall-normal profiles collapse fairly well with CCF results in the vicinity of the (no-slip) wall and throughout most of the flow domain. There is, however, a noticeable discrepancy between the profiles for (corresponding to the centerline in CCF and to the free-surface in OCF), which is caused by the impermeable boundary in the latter case. The impermeability condition in OCF enforces the vertical component of the fluctuating velocity to drop to zero for , while its energy is transferred to the surface-parallel components. It can be seen from figure 3 that the majority of the turbulence intensity is redistributed to the spanwise direction, whereas the streamwise component increases less significantly. This is in agreement with results obtained from numerical studies of low Reynolds number OCF [39, 23, 5, 29, 30, 31]. In Handler et al. [17] it was found that the pressure-strain correlation term is the key contributor to the inter-component energy transfer below the free surface. Correspondingly, we have confirmed the role of the pressure-strain correlation for the present data (figure omitted).
As already discussed above, previous authors have defined a “surface-influenced layer” as the region where the mean-velocity profiles in OCF deviate from their CCF counterparts (CM03). Figure 3 confirms that the thickness of this layer scales with the channel height , and that its extent can be quantified as . Note that we deliberately use the new symbol (for “normal velocity damping layer”) instead of the denomination “surface-influenced layer” used by others, as the latter region will be shown to extend much further than previously assumed. As a consequence the commonly invoked three-layer structure of OCF will be extended to a four-layer structure.
We further observe in figure3 that the streamwise turbulence intensity in OCF shifts towards higher values for and when compared with CCF values. The increase of streamwise turbulence intensity throughout most of the flow domain is presumably caused by VLSMs appearing at Reynolds number as low as 400 in OCF. VLSMs are visible in the instantaneous streamwise velocity component for OCF and CCF, as depicted in figure 4 for .
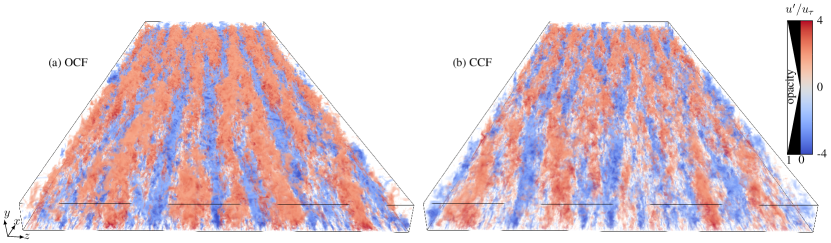
Figure 4 shows that VLSMs in OCF are more intense and longer in the -direction than corresponding CCF structures. This instantaneous observation is supported by the comparison of the statistical footprint of VLSMs between OCF and CCF in appendix B.
In order to quantify the increase in the OCF streamwise turbulence intensity observed in figure3, the integrated difference between the OCF and CCF turbulence intensity profiles is computed as follows,
| (3) |
where and denote the -component of the OCF and CCF turbulence intensity, respectively, and are the OCF and CCF friction velocities (see figure 1 for the definitions of ). Figure 5 displays the evolution of the integral quantity as a function of the friction Reynolds number.
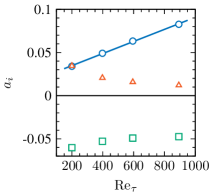
While the streamwise component increases monotonically for the range of Reynolds numbers considered, the wall-normal and spanwise components (, ) appear to settle at constant values for higher Reynolds numbers. As shown in figure 5, the following linear fit,
| (4) |
describes the data corresponding to the streamwise component reasonably well.
From figure 3 it was obvious that differences between OCF and CCF regarding the cross-stream velocity components are restricted to a layer near , whereas the streamwise turbulence intensity differs throughout most of the channel height (for ). The latter observation leads to a different scaling behavior of the turbulence intensities as presented in figure 6.
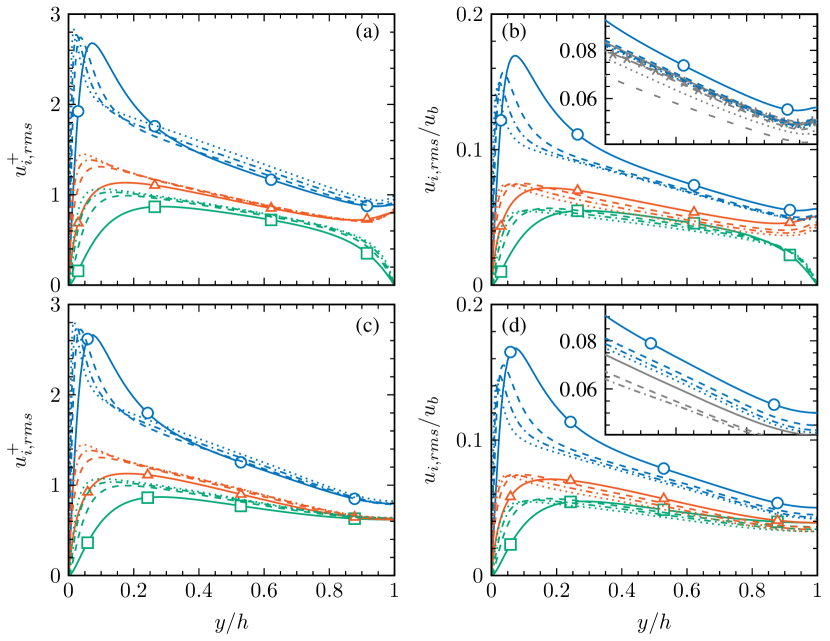
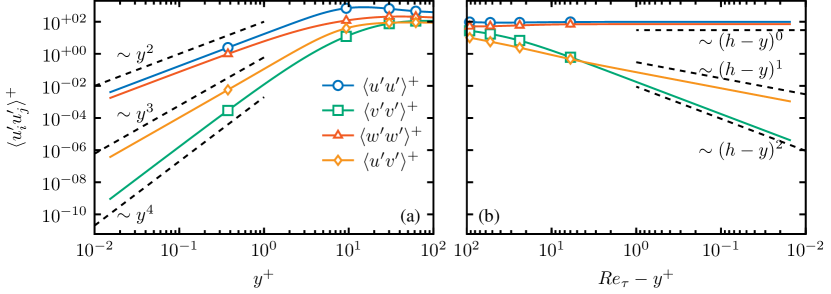
While the spanwise and wall-normal contributions to the turbulence intensity scale with the friction velocity in the bulk region of the flow for for both flow configurations (figure 6a,c), the streamwise contribution differs. Figure 6(b) shows that the streamwise turbulence intensity in open channel flow appears to scale with the bulk velocity for and , whereas in the closed channel case it neither scales with nor with (figure 6c,d), as reported in Bauer et al. [7]. Note that the described scaling behavior is only observed for domain sizes [7]. This explains why data at high Reynolds number computed in short computational domains [e.g. 38, cf. their figure 5] does not exhibit the scaling of with observed here.
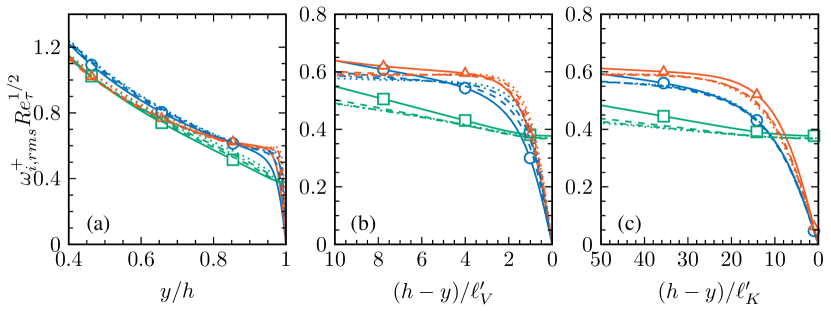
Next we turn to the scaling of the turbulence intensities in the different surface layers in OCF. Figure 7 shows turbulence intensity profiles normalized in wall units, plotted as a function of the distance from the free surface normalized with various characteristic length scales (, , ).
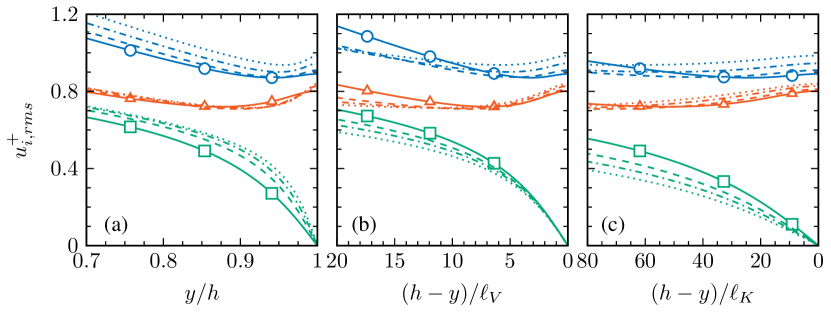
It can be seen that scaling with provides the best collapse of the wall-normal component which features a steep drop to zero within the thin viscous sublayer. The surface-normal derivative of the surface normal turbulence intensity is presented in figure 8. In the immediate vicinity of the free surface () the wall-normal velocity grows linearly when moving away from the free surface, with a slope of approximately 0.09. Therefore, the viscous sublayer is estimated as .
3.3 Vorticity scaling
We observe that the intensity of vorticity fluctuations, (no summation over Greek indices), in OCF collapses well with corresponding closed channel flow profiles over most of the channel height, except for the region very close to the free surface (figure omitted). The profile of the wall-normal vorticity component in OCF already starts to deviate from the CCF profile approximately at the bottom of the normal velocity damping layer .
In the vicinity of the free surface, impermeability and free-slip boundary conditions influence all vorticity components, and for the vorticity vector simplifies as follows
| (5) |
while in the closed channel flow case the components show almost purely isotropic behavior at the channel center, i.e. . Note that this equality among the fluctuation intensity of the vorticity components at the channel center in CCF is progressively approached with the Reynolds number (figure omitted).
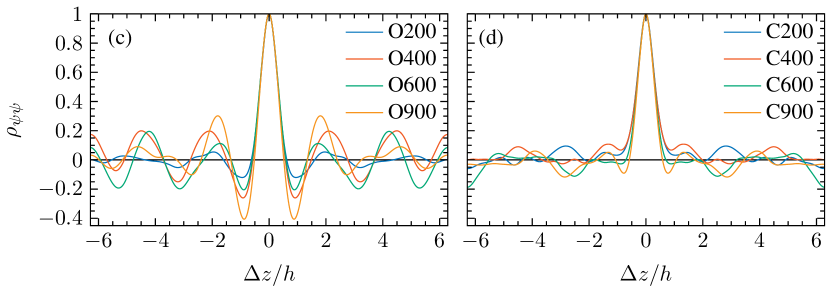
In Antonia et al. [2] and Panton [34] it was shown that the vorticity fluctuation intensity in the outer layer of wall-bounded turbulent flows scales with the Kolmogorov time scale, (assuming that the dissipation rate scales with and ), leading to . CM03 found the same scaling to be true for the vorticity fluctuation intensity in open channel flow up to the free surface and, thus, suggested to multiply the vorticity fluctuation intensity with after being normalized in wall units in order to collapse data at different Reynolds numbers. Applying the above normalization in the upper part of the channel domain, we indeed achieve a satisfactory collapse of the different Reynolds number profiles away from the wall, as shown in figure 9. It can be seen that the channel height is the characteristic length scale away both from the wall and the free surface (cf. figure 9a).
Contrarily, the Kolmogorov scale is the relevant scale in the direct vicinity of the free surface, where the surface-parallel vorticity components decay to zero, as shown in figure 9(c). In agreement with observations from the surface-normal derivative of the mean streamwise velocity (see section 3.1), the surface-parallel vorticity damping layer, where the vorticity fluctuation intensity becomes highly anisotropic as the wall-parallel vorticities rapidly decrease to zero, exhibits a thickness of approximately 20 (figure 9c), which is consistent with the thickness of the Kolmogorov sublayer . This finding is in disagreement with CM03, who argued that this layer scales with which provides an arguably less convincing collapse of our data (compare figure 9b and 9c).
It should be recalled that CM03 did not have access to fully resolved DNS of open channel flow up to . Their study was limited to the comparison of LES data at with only one low Reynolds number DNS at from Handler et al. [17], both of them obtained in small computational boxes and rather coarse resolutions. A further source of uncertainty in the CM03 study is the use of a subgrid-stress model in the context of LES.
As pointed out by Pinelli et al. [37], the spatial distribution of small-scale vortices in the vicinity of the free-slip boundary is influenced by large-scale motions in the form of large-scale velocity streaks. Figure 10 presents the vorticity fluctuation intensities near the free-slip boundary, conditionally averaged with respect to being located within high-speed () or low-speed regions ().
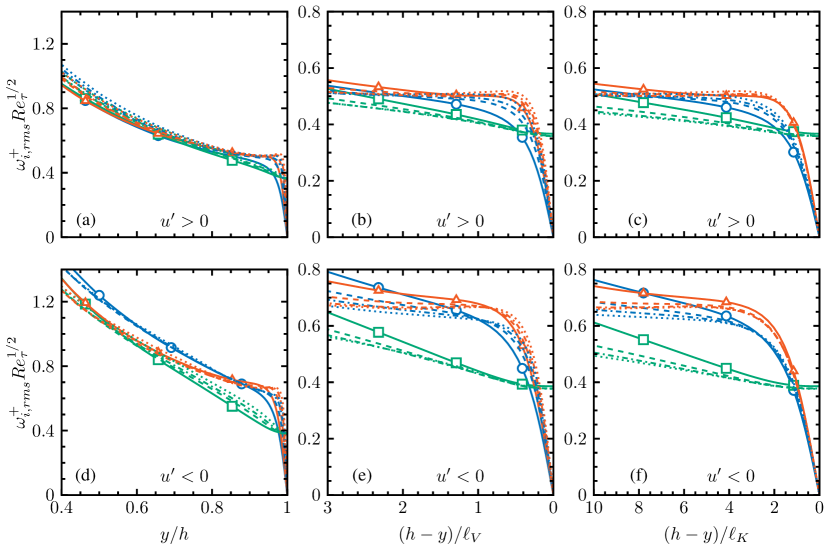
In agreement with Pinelli et al. [37]—who found the majority of small-scale vortices in the vicinity of the free-slip boundary to be located within large-scale low-speed streaks—the vorticity fluctuation intensity is larger in low-speed regions (figure 10d,e,f) than in high-speed regions (figure 10a,b,c). In the bulk flow region the intensity of the streamwise vorticity within low-speed structures appears to be slightly larger than that of the other two components (figure 10d), whereas the intensity of vorticity fluctuations within high-speed structures is approximately isotropic (figure 10a).
3.4 Super-streamwise vortices (SSV)
Previous investigations have shown that large-scale motion in OCF features elongated streamwise vortices associated to the above-mentioned velocity streaks [42, 12, 40]. The former structures span the entire channel height and are sometimes termed “super-streamwise vortices” (SSV). While small-scale vortices are directly detectable in both instantaneous visualizations and statistical quantities (i.e. of the vorticity field itself or through the -criterion), super-streamwise vortices are not directly accessible, since they are superimposed by a wide range of smaller scale turbulent motions with higher intensity, and according to Zhong et al. [42] statistical evidence of their existence has been scarce.
In order to extract SSVs from the DNS data, we compute the streamfunction of the streamwise-averaged crossflow velocity components, defined as follows:
| (6) |
Figure 11 presents instantaneous realizations of the streamfunction for both OCF and CCF at arbitrary times.
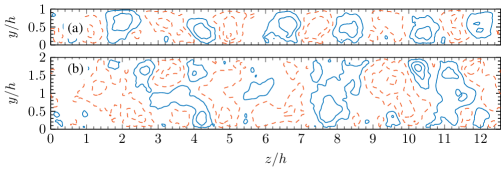
The iso-contours of the streamfunction in both configurations exhibit vortical structures with a diameter of the order of which can be associated to SSV. In addition, CCF features low-intensity structures spanning the entire channel height (figure 11b). Compared to CCF the structure of the streamfunction in OCF appears to be more coherent with more regularly spanwise-alternating vortices. In order to compare the structure of the streamfunction quantitatively between OCF and CCF, the two-point correlation of the streamfunction,
| (7) |
where represents averaging in -direction as well as over snapshots, is presented in figure 12(a,b) for . In addition, the spanwise correlation coefficient of the latter quantity,
| (8) |
is displayed in figure 12(c,d) for the range of Reynolds numbers considered here and for a reference point located at .
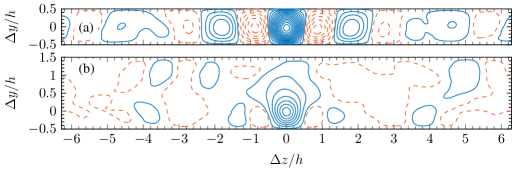
Iso-contours of the streamfunction two-point correlation in OCF (figure 12a) clearly reflect the structure of SSVs in terms of alternating streamwise vortices with a radius of over the full channel width. For the iso-contours in CCF shown in figure 12(b), on the other hand, the correlation decays at smaller spanwise separation length and the structure is less clear than in OCF. This behavior can be even more precisely quantified with the aid of the corresponding spanwise correlation coefficient (figure 12c,d). While in OCF exhibits a regular alternating patterning at all Reynolds numbers (figure 12c), the spanwise correlation coefficient in CCF hardly features significant secondary minima when the spanwise separation length increases (figure 12d). Furthermore, the iso-contours of the streamfunction two-point correlation when normalized with a global reference value (figure 12b) indicate that the structures in CCF are less intense than their open channel counterparts (figure 12a). Both higher correlation values of the streamfunction as well as the spanwise organization of the correlation in OCF can be explained by the free-slip boundary condition, which locks the SSVs in vertical position. In CCF, on the other hand, these structures are less constrained and they can propagate (as well as span) across the channel centerline. Thus, they cancel each other out when averaged and their statistical footprint is less significant than the footprint of corresponding OCF structures. Note that Gong et al. [13] reported a similar effect on wall-attached motions, which in OCF are restricted to a region closer to the solid wall than in CCF.
3.5 Updated surface-influenced layer
The comparison of the streamwise turbulence intensity between OCF and CCF in section 3.2 and SSV in section 3.4 revealed that the influence of the free-slip boundary condition reaches much further towards the solid wall than previously assumed. In order to account for this new evidence, we separate the “surface-influenced layer” from a new “normal-velocity-damping layer”, thereby expanding the previous three-layer structure to four layers, as sketched in figure 13. The thickness of the former layer is found to extend essentially across the entire channel, hence we propose . The thickness of the latter layer, where the surface-normal turbulence intensity profile in OCF differs from CCF, is quantified by , similar to previous studies [e.g. 29, 12]. On the other hand, the near-surface viscous sublayer, where the surface-normal velocity grows linearly when moving away from the free surface, measures , and the Kolmogorov sublayer, where the surface-normal gradient of the mean velocity as well as the intensities of the fluctuations of the surface-parallel vorticity components are damped to zero, is estimated as .

Numerical values for the widths of these four layers as presently defined are given in table 2 for the different OCF cases.
| case | |||||||
|---|---|---|---|---|---|---|---|
| O200 | 200 | 1 | 0.3 | 0.0178 | 0.048 | 10.7 | 14.2 |
| O400 | 399 | 1 | 0.3 | 0.0120 | 0.026 | 14.3 | 15.7 |
| O600 | 596 | 1 | 0.3 | 0.0095 | 0.018 | 17.1 | 16.6 |
| O900 | 895 | 1 | 0.3 | 0.0076 | 0.014 | 20.3 | 17.6 |
Note that in the present range of Reynolds numbers, while Reynolds numbers are necessary for . Hence the relative widths of and sketched in figure 13 apply to high-Reynolds number OCF.
The Kolmogorov layer width, which varies only little when normalized in wall units for the range of Reynolds numbers considered (), is of the same order of magnitude as the wall-normal extent of the viscous sublayer adjacent to the no-slip wall. This highlights a numerical resolution requirement for the free-slip boundary similar to the one near the no-slip wall. DNSs of OCF often use one-sided grid refinement only, which leads to acceptable one-point turbulence statistics near the solid wall. However, the non-linear interactions between the small scales, which are located in the near-surface region, and larger scales of motions might not be captured correctly without additional grid refinement towards the free-slip boundary.
4 Conclusion
In turbulent open channel flow the free surface is typically modelled as a free-slip boundary when it can be expected to undergo only small deformations. As a consequence the statistics generally differ from the counterpart in closed channel flow. For a long time the differences in these two configurations were believed to be restricted to the vicinity of the free surface. The most prominent effect of the free-slip boundary condition is on the structure of the Reynolds stress tensor, which has been widely discussed in the literature [39, 17, 35, 32, 29, 16, 8, 30, 31]. In this work, the scaling of turbulence statistics in the vicinity of a free-slip boundary in open channel flow has been analyzed with the aid of data from DNS in computational domains large enough to capture the largest turbulence scales while providing sufficient grid refinement near the free-slip boundary. For up to 900, the triple surface layer proposed by CM03 has been observed for the spanwise and wall-normal Reynolds stress components as well as for the vorticity fluctuation intensities. In accordance with CM03 we found the channel height , the viscous length , and the Kolmogorov length to be the relevant length scales for the near-surface layers. Unlike CM03, however, the sublayer where the wall-normal velocity decreases linearly towards the surface is found to scale with the near-surface viscous length scale (instead of ), and the thin near-surface vorticity layer is found to scale with the Kolmogorov length scale (instead of ). Regarding their intensity, spanwise and wall-normal velocity fluctuations do scale in wall units, while the streamwise component tends to increase under that scaling when increasing the Reynolds number. This failure of wall-scaling is well known for closed channel flow and it is related to VLSMs that contribute to the streamwise Reynolds stress component for higher Reynolds numbers. For open channel flows this effect appears already at lower Reynolds numbers and leads—unlike for closed channel flows—to a collapse of the streamwise turbulent intensity profiles normalized with the bulk velocity in the region between and , which is already visible for . Since the footprint of the enhanced VLSMs can be found in energy spectra very close to the solid wall, the so-called surface-influenced layer , described by CM03 and others, has to be extended essentially all the way to the solid boundary for OCF. As a consequence, turbulence in the vicinity of a free-slip boundary in OCF has effectively to be characterized by four layers: The Kolmogorov sublayer —where surface-parallel vorticities are damped to zero—, the viscous sublayer —where the surface-normal velocity component decreases linearly to zero—, the normal velocity damping layer —where the surface-normal velocity profile deviates from the CCF profile— and the surface-influenced layer spanning the entire channel height —where the streamwise turbulence intensity profile deviates from the CCF profile.
Note that the above mentioned effect on the streamwise velocity profile cannot be faithfully observed in numerical simulations of turbulent open channel flow either at low Reynolds number—where VLSM are not present— or in small computational domains—where VLSM are artificially suppressed.
Acknowledgements Many fruitful discussions with Genta Kawahara throughout this work are gratefully acknowledged. The simulations were carried out at the HPC clusters UC2 and CARA. Thus, the authors gratefully acknowledge the scientific support and HPC resources provided by the SCC Karlstuhe, the German Aerospace Center (DLR), and the state of Baden-Wuerttemberg through bwHPC. The HPC system CARA is partially funded by ”Saxon State Ministry for Economic Affairs, Labour and Transport” and ”Federal Ministry for Economic Affairs and Climate Action”. The authors acknowledge funding by DFG through grant UH 242/3-1.
Appendix A Grid refinement towards the boundaries
As mentioned above, DNSs of turbulent open channel flow often lack grid refinement towards the free-slip boundary. However, the thin velocity and vorticity damping layer near the free-slip boundary, as well as the underlying small-scale coherent motions, make a grid refinement towards the free-slip surface desirable. Figure 14 shows that the vertical spacing is kept below the value of the Kolmogorov length scale throughout most of the flow domain.
In order to evaluate whether the boundary conditions near the no-slip and the free-slip boundary are fulfilled, the wall-normal asymptotics of the Reynolds stress components—which can be obtained from a Taylor series expansion and making use of the boundary conditions as well as of the continuity equation—are taken into account. Figure 15 shows that the expected asymptotic behavior is well established both near the solid wall and near the free-slip surface.
Therefore, the sufficiency of the near-boundary grid resolution is validated in this context.
Appendix B Very-large-scale motions
Statistically, VLSMs can be extracted from three-dimensional two-point velocity correlations of the streamwise velocity component with a reference point at for O900 and C900, as displayed in figure 16.
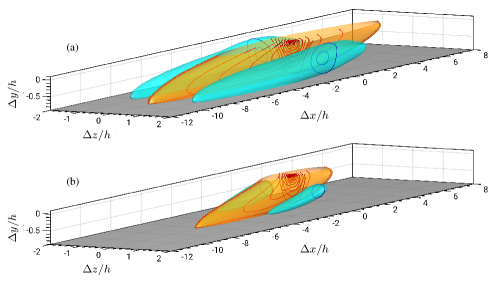
In agreement with Duan et al. [9, 12], the iso-surface of the streamwise velocity correlation () indicates, that large-scale coherent structures in OCF are longer and wider than their closed channel counterpart. More detailed information is obtained through the analysis of pre-multiplied energy spectra of the different Reynolds number cases for OCF and CCF. The analysis of pre-multiplied energy spectra to estimate the spatial extent of coherent structures has been performed in various CCF studies [19, 10, 1, 28, 26] as well as recent OCF studies by Duan et al. [9, 12]. The location of the peak in a pre-multiplied energy spectrum corresponds to the wavelength of the most energetic motions [36]. In figure 17 two-dimensional pre-multiplied spectra of the streamwise velocity fluctuation below the free-slip boundary () are compared to the corresponding closed channel data.
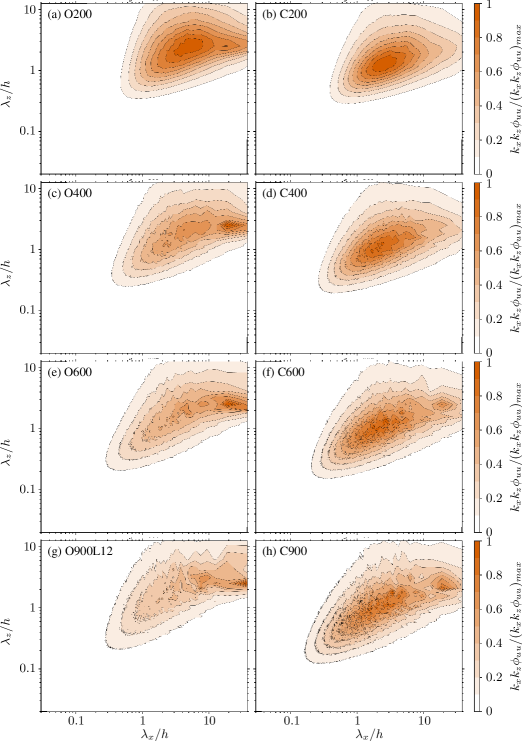
As mentioned by Duan et al. [9, 12], the location of the outer spectral peak indicates that large-scale coherent structures in OCF are longer and wider than their closed channel counterpart. In general, energetic coherent structures in the vicinity of the free-slip boundary in OCF appear at spanwise wavelengths that are about a factor of two larger than those related to coherent structures in CCF. Furthermore, in agreement with Pinelli et al. [37], the outer spectral peak related to VLSM in OCF is visible for Reynolds numbers as low as 400 (figure 17c), whereas in comparable CCF configurations the outer spectral peak occurs for (figure 17f). In Duan et al. [12] it was noted that VLSMs contribute more to the wall-shear stress in OCF than in CCF, while LSMs contribute less to wall-shear stress in OCF than in CCF. The two-dimensional energy spectra in figure 17 support this finding, since in CCF the spectral energy peak related to large-scale motions visible at length scales appears to be of higher amplitude than the one related to VLSM (figure 17f,h). In OCF, on the contrary, the VLSM peak clearly dominates the spectra (figure 17c,e,g).
References
- \bibcommenthead
- Abe et al. [2004] Abe, H., Kawamura, H., Choi, H.: Very large-scale structures and their effects on the wall shear-stress fluctuations in a turbulent channel flow up to Re=640. Journal of Fluids Engineering 126(5), 835–843 (2004) https://doi.org/10.1115/1.1789528
- Antonia et al. [1996] Antonia, R.A., Rajagopalan, S., Zhu, Y.: Scaling of mean square vorticity in turbulent flows. Experiments in Fluids 20(5), 393–394 (1996) https://doi.org/10.1007/BF00191021
- Bauer [2015] Bauer, C.: Direct numerical simulation of turbulent open channel flow. Master’s thesis, Karlsruher Institut für Technologie (2015)
- Brumley and Jirka [1988] Brumley, B.H., Jirka, G.H.: Air-water transfer of slightly soluble gases: Turbulence, interfacial processes and conceptual models. Physicochemical hydrodynamics 10(3), 295–319 (1988)
- Borue et al. [1995] Borue, V., Orszag, S.A., Staroselsky, I.: Interaction of surface waves with turbulence: Direct numerical simulations of turbulent open-channel flow. Journal of Fluid Mechanics 286, 1–23 (1995)
- Bauer et al. [2023] Bauer, C., Sakai, Y., Uhlmann, M.: Data Underlying the Publication: Direct Numerical Simulation of Turbulent Open Channel Flow, https://doi.org/10.4121/88678f02-2a34-4452-8534-6361fc34d06b. 4TU.ResearchData (2023). https://doi.org/10.4121/88678f02-2a34-4452-8534-6361fc34d06b
- Bauer et al. [2024] Bauer, C., Sakai, Y., Uhlmann, M.: Direct numerical simulation of turbulent open channel flow: Streamwise turbulence intensity scaling and its relation to large-scale coherent motions. In: Örlü, R., Talamelli, A., Peinke, J., Oberlack, M. (eds.) Progress in Turbulence X, pp. 311–317. Springer, Cham (2024). https://doi.org/10.1007/978-3-031-55924-2_42
- Calmet and Magnaudet [2003] Calmet, I., Magnaudet, J.: Statistical structure of high-Reynolds-number turbulence close to the free surface of an open-channel flow. Journal of Fluid Mechanics 474, 355–378 (2003) https://doi.org/10.1017/S0022112002002793
- Duan et al. [2020] Duan, Y., Chen, Q., Li, D., Zhong, Q.: Contributions of very large-scale motions to turbulence statistics in open channel flows. Journal of Fluid Mechanics 892, 3 (2020) https://doi.org/10.1017/jfm.2020.174
- del Álamo and Jiménez [2003] del Álamo, J.C., Jiménez, J.: Spectra of the very large anisotropic scales in turbulent channels. Physics of Fluids 15(6), 41–44 (2003) https://doi.org/10.1063/1.1570830
- del Álamo et al. [2004] del Álamo, J.C., Jiménez, J., Zandonade, P., Moser, R.D.: Scaling of the energy spectra of turbulent channels. Journal of Fluid Mechanics 500, 135–144 (2004) https://doi.org/10.1017/S002211200300733X
- Duan et al. [2021] Duan, Y., Zhong, Q., Wang, G., Zhang, P., Li, D.: Contributions of different scales of turbulent motions to the mean wall-shear stress in open channel flows at low-to-moderate Reynolds numbers. Journal of Fluid Mechanics 918, 40 (2021) https://doi.org/10.1017/jfm.2021.236
- Gong et al. [2023] Gong, Z., Duan, Y., Chen, X., Li, D., Fu, X.: Statistical behavior of wall-attached motions in open- and closed-channel flows via direct numerical simulation. Physics of Fluids 35(4), 045138 (2023) https://doi.org/10.1063/5.0144392
- Hunt and Graham [1978] Hunt, J.C.R., Graham, J.M.R.: Free-stream turbulence near plane boundaries. Journal of Fluid Mechanics 84(02), 209–235 (1978) https://doi.org/10.1017/S0022112078000130
- Hoyas and Jiménez [2006] Hoyas, S., Jiménez, J.: Scaling of the velocity fluctuations in turbulent channels up to Re=2003. Physics of Fluids 18(1), 11702 (2006) https://doi.org/10.1063/1.2162185
- Handler et al. [1999] Handler, R.A., Saylor, J.R., Leighton, R.I., Rovelstad, A.L.: Transport of a passive scalar at a shear-free boundary in fully developed turbulent open channel flow. Physics of Fluids (1994-present) 11(9), 2607–2625 (1999) https://doi.org/10.1063/1.870123
- Handler et al. [1993] Handler, R.A., Swean, T.F., Leighton, R.I., Swearingen, J.D.: Length scales and the energy balance for turbulence near a free surface. AIAA Journal 31(11), 1998–2007 (1993) https://doi.org/10.2514/3.11883
- Hunt [1984] Hunt, J.C.R.: In: Brutsaert, W., Jirka, G.H. (eds.) Turbulence Structure and Turbulent Diffusion Near Gas-Liquid Interfaces, pp. 67–82. Springer, Dordrecht (1984). https://doi.org/10.1007/978-94-017-1660-4_7
- Jiménez [1998] Jiménez, J.: The largest scales of turbulent wall flows. Technical report, CTR Annual Research Briefs (1998)
- Jiménez and Pinelli [1999] Jiménez, J., Pinelli, A.: The autonomous cycle of near-wall turbulence. Journal of Fluid Mechanics 389, 335–359 (1999) https://doi.org/10.1017/S0022112099005066
- Jiménez et al. [1993] Jiménez, J., Wray, A.A., Saffman, P.G., Rogallo, R.S.: The structure of intense vorticity in isotropic turbulence. Journal of Fluid Mechanics 255, 65–90 (1993) https://doi.org/10.1017/S0022112093002393
- Kim et al. [1987] Kim, J., Moin, P., Moser, R.: Turbulence statistics in fully developed channel flow at low Reynolds number. Journal of Fluid Mechanics 177, 133–166 (1987) https://doi.org/10.1017/S0022112087000892
- Komori et al. [1993] Komori, S., Nagaosa, R., Murakami, Y., Chiba, S., Ishii, K., Kuwahara, K.: Direct numerical simulation of three-dimensional open-channel flow with zero-shear gas–liquid interface. Physics of Fluids A: Fluid Dynamics 5(1), 115–125 (1993) https://doi.org/10.1063/1.858797
- Lee and Moser [2015] Lee, M., Moser, R.D.: Direct numerical simulation of turbulent channel flow up to Re=5200. Journal of Fluid Mechanics 774, 395–415 (2015) https://doi.org/10.1017/jfm.2015.268
- Leighton et al. [1991] Leighton, R.I., Swean Jr, T.F., Handler, R.A., Swearingen, J.D.: Interaction of vorticity with a free surface in turbulent open channel flow. In: 29th AIAA Aerospace Sciences Meeting, vol. 1 (1991)
- Monty et al. [2009] Monty, J.P., Hutchins, N., Ng, H.C.H., Marusic, I., Chong, M.S.: A comparison of turbulent pipe, channel and boundary layer flows. Journal of Fluid Mechanics 632, 431–442 (2009) https://doi.org/10.1017/S0022112009007423
- Moser et al. [1999] Moser, R.D., Kim, J., Mansour, N.N.: Direct numerical simulation of turbulent channel flow up to Re=590. Physics of Fluids 11(4), 943–945 (1999) https://doi.org/10.1063/1.869966
- Monty et al. [2007] Monty, J.P., Stewart, J.A., Williams, R.C., Chong, M.S.: Large-scale features in turbulent pipe and channel flows. Journal of Fluid Mechanics 589, 147–156 (2007)
- Nagaosa [1999] Nagaosa, R.: Direct numerical simulation of vortex structures and turbulent scalar transfer across a free surface in a fully developed turbulence. Physics of Fluids 11(6), 1581–1595 (1999) https://doi.org/10.1063/1.870020
- Nagaosa and Handler [2003] Nagaosa, R., Handler, R.A.: Statistical analysis of coherent vortices near a free surface in a fully developed turbulence. Physics of Fluids 15(2), 375–394 (2003) https://doi.org/10.1063/1.1533071
- Nagaosa and Handler [2012] Nagaosa, R., Handler, R.A.: Characteristic time scales for predicting the scalar flux at a free surface in turbulent open-channel flows. AIChE Journal 58(12), 3867–3877 (2012) https://doi.org/10.1002/aic.13773
- Nagaosa and Saito [1997] Nagaosa, R., Saito, T.: Turbulence structure and scalar transfer in stratified free-surface flows. AIChE Journal 43(10), 2393–2404 (1997) https://doi.org/10.1002/aic.690431003
- Oberlack et al. [2022] Oberlack, M., Hoyas, S., Kraheberger, S.V., Alcántara-Ávila, F., Laux, J.: Turbulence Statistics of Arbitrary Moments of Wall-Bounded Shear Flows: A Symmetry Approach. Physical Review Letters 128(2), 024502 (2022) https://doi.org/10.1103/PhysRevLett.128.024502
- Panton [2009] Panton, R.L.: Scaling and correlation of vorticity fluctuations in turbulent channels. Physics of Fluids 21(11), 115104 (2009) https://doi.org/%****␣sn-article.bbl␣Line␣575␣****10.1063/1.3249753
- Pan and Banerjee [1995] Pan, Y., Banerjee, S.: A numerical study of free-surface turbulence in channel flow. Physics of Fluids 7(7), 1649–1664 (1995) https://doi.org/10.1063/1.868483
- Perry et al. [1986] Perry, a.E., Henbest, S., Chong, M.S.: A theoretical and experimental study of wall turbulence. Journal of Fluid Mechanics 165, 163–199 (1986) https://doi.org/10.1017/S002211208600304X
- Pinelli et al. [2022] Pinelli, M., Herlina, H., Wissink, J.G., Uhlmann, M.: Direct numerical simulation of turbulent mass transfer at the surface of an open channel flow. Journal of Fluid Mechanics 933, 49 (2022) https://doi.org/10.1017/jfm.2021.1080
- Pirozzoli [2023] Pirozzoli, S.: Searching for the log law in open channel flow. Journal of Fluid Mechanics 971, 15 (2023) https://doi.org/10.1017/jfm.2023.616
- Swean et al. [1991] Swean, T.F., Leighton, R.I., Handler, R.A.: Turbulence Modeling Near the Free Surface in an Open Channel Flow. In: 29th AIAA Aerospace Sciences Meeting (1991)
- Scherer et al. [2022] Scherer, M., Uhlmann, M., Kidanemariam, A.G., Krayer, M.: On the role of turbulent streaks in generating sediment ridges. J. Fluid Mech. 930, 11 (2022) https://doi.org/10.1017/jfm.2021.891 2110.00815
- Yao et al. [2022] Yao, J., Chen, X., Hussain, F.: Direct numerical simulation of turbulent open channel flows at moderately high Reynolds numbers. Journal of Fluid Mechanics 953, 19 (2022) https://doi.org/10.1017/jfm.2022.942
- Zhong et al. [2016] Zhong, Q., Chen, Q., Wang, H., Li, D., Wang, X.: Statistical analysis of turbulent super-streamwise vortices based on observations of streaky structures near the free surface in the smooth open channel flow. Water Resources Research 52(5), 3563–3578 (2016) https://doi.org/10.1002/2015WR017728