Another piece to the puzzle: radio detection of a JWST discovered AGN candidate
Abstract
Radio observations can provide crucial insight into the nature of a new abundant and mysterious population of dust-reddened active galactic nuclei (AGN) candidates discovered by the James Webb Space Telescope (JWST), including “Little Red Dots” (LRDs). In this study, we search for radio bright sources in a large sample of 700 JWST discovered AGN candidates () in the GHz frequency range, utilizing deep radio imaging in COSMOS, GOODS-N, and GOODS-S. Only one source is significantly detected in our radio surveys, which is PRIMER-COS 3866 at . Its radio properties are consistent with both an AGN and star formation origin with a spectral index of and a radio-loudness of . The derived brightness temperature limit of PRIMER-COS 3866 of K is too low to confirm its AGN nature. Our stacking results yield non-detections in all fields with the most constraining 3 limit erg s-1 (rms of 0.15 Jy beam-1 at ) obtained for photometrically selected AGN candidates in the COSMOS field. This result is still consistent with expectations from the empirical and correlations established for local AGN. We conclude that current radio observations have insufficient depth to claim JWST discovered AGN candidates are radio-weak. We project that future surveys carried out by the SKA and ngVLA should be able to obtain significant detections within a few hours, providing crucial measurements of their brightness temperature, which would allow for distinguishing between AGN and starburst-driven origins of this new abundant population.
1 Introduction
The first years of JWST observations have led to the discovery of an abundant population of faint high- AGN candidates. This includes the so-called “Little Red Dots”: a puzzling population of faint sources at high- with broad emission lines, compact morphology, and extremely red color (LRDs; Kocevski et al. 2023; Harikane et al. 2023; Labbe et al. 2023; Matthee et al. 2024). Surprisingly, some studies suggest that the number densities of these AGN candidates are more than an order of magnitude higher than expected from extrapolating quasar luminosity functions (e.g. Kokorev et al. 2024; Pizzati et al. 2024; Kocevski et al. 2024) and their supermassive black hole (SMBH) masses are high compared to estimated host galaxy masses, suggesting extreme black hole growth (e.g. Kokorev et al. 2023; Maiolino et al. 2023; Greene et al. 2024). In addition, a lack of hot torus emission expected from AGN has been reported (e.g. Williams et al. 2024; Wang et al. 2024). Furthermore, Inayoshi & Ichikawa (2024) argue that their radiative efficiency is expected to be as high as 20%, which would imply high BH spin and ideal conditions for radio jet formation. These sources might therefore prove to be a crucial phase in early black hole and galaxy formation.
Alternatively, it has been argued that the newly discovered sources could instead be compact massive galaxies with extreme starburst activity (e.g. Baggen et al. 2024; Pérez-González et al. 2024) and ionized outflows have been detected which could play a role in emission line broadening (e.g. Wang et al. 2024). To investigate different physical processes this new population has been studied at many different wavelengths. A recent study by Yue et al. (2024) obtained a tentative detection at X-ray wavelengths, further strengthening the case for their AGN nature. However, their X-ray emission is 1 dex lower than expected from the relation, which suggests that these are different from previously observed type-I AGN (see also Maiolino et al. 2024). Lambrides et al. (2024) found in addition to significantly weaker than expected X-ray emission, a lack of high-ionization rest-UV lines in a sample JWST broad line AGN at . In the ALMA sub-mm regime, none of these sources have been detected individually nor in a stack, providing strong limits on the contribution of obscured star formation (Labbe et al., 2023; Akins et al., 2024).
Radio observations are a powerful tool to help determine their nature. Both star formation and AGN can contribute to synchrotron radio emission (see e.g. Best et al. 2023), however, properties such as radio-loudness (e.g. Macfarlane et al. 2021), brightness temperature (e.g. Morabito et al. 2022), and the radio spectral index (e.g. Randall et al. 2012) can provide crucial evidence to distinguish between an AGN or stellar origin. Recent work has investigated the radio properties of JWST discovered AGN candidates (e.g. Akins et al. 2024; Mazzolari et al. 2024; Perger et al. 2024). However, all of them reported non-detections from both individual sources and image stacking analysis. In this work, we extend this search to multiple well-studied fields and multiple radio facilities including the Low Frequency Array (LOFAR; van Haarlem et al. 2013), MeerKAT (Jonas & MeerKAT Team, 2016), and the Very Large Array (VLA; Thompson et al. 1980). Furthermore, we present the expected potential detections by future radio surveys. Throughout this paper, we assume a -CDM cosmology with = 70 km s-1 Mpc-1, = 0.3, and = 0.7.
2 Data
| COSMOS | ||
|---|---|---|
| Kocevski et al. (2024) | 81∗ | |
| Akins et al. (2024) | 434∗ | |
| Kokorev et al. (2024) | 78∗ | |
| GOODS-N | ||
| Matthee et al. (2024) | 7 | |
| Maiolino et al. (2023) | 10 | |
| GOODS-S | ||
| Matthee et al. (2024) | 1 | |
| Maiolino et al. (2023) | 2 | |
| Kocevski et al. (2024) | 56∗ | |
| Kokorev et al. (2024) | 27∗ |
Notes. ∗The majority of AGN candidates in the sample are not spectroscopically confirmed
| Field | # sources | Telescope | Survey | Freq. | Resolution | rms depth | |
| (GHz) | (″) | (Jy beam-1) | (Jy beam-1) | ||||
| COSMOS | 593 | LOFAR | COSMOS-LOFAR | 0.144 | 6 12 | 150 | |
| MeerKAT | MIGHTEE DR1 | 1.3 | 8.9 | 3.5 | |||
| VLA | VLA-COSMOS 3 GHz LP | 3 | 0.75 | 2.3 | |||
| GOODS-N | 17 | LOFAR | LoTSS-DR2 | 0.144 | 6 | 70 | |
| VLA | GOODS-N VLA | 1.4 | 1.7 | 4 | |||
| GOODS-S | 86 | MeerKAT | MIGHTEE DR1 | 1.3 | 5.5 | 1.9 |
Notes. ∗This column gives the 3 flux density limits derived from the stacks.
The fields studied in this work are selected based on availability of deep (public) radio data and JWST discovered AGN candidates. Based on this, we choose to study the radio properties of AGN candidates in three well-known fields: Cosmic Evolution Survey (COSMOS), Great Observatories Origins Deep Survey North (GOODS-N) and South (GOODS-S). The GOODS-S field is embedded within the Chandra Deep Field South (CDFS) field and therefore we utilize multi-wavelength data from both fields.
2.1 AGN candidate sample
This work focuses on five samples of AGN candidates in COSMOS, GOODS-N, and GOODS-S discovered by Maiolino et al. (2023), Matthee et al. (2024), Kocevski et al. (2024), Akins et al. (2024), and Kokorev et al. (2024). A summary of the fields and samples is given in Table 1. The sample of Maiolino et al. (2023) contains 10 sources in GOODS-N and 2 sources in GOODS-S, which have been obtained from the JADES survey (Eisenstein et al., 2023) with spectroscopic redshifts ranging from 4.1-6.8. We note that only 20% of these sources would be photometrically selected as LRD from their colors. The samples of Matthee et al. (2024) have been obtained from the EIGER (Kashino et al., 2023) and FRESCO (Oesch et al., 2023) surveys in multiple fields including GOODS-N and -S. In their work, they present the discovery of 20 new AGN candidates at , including 7 in GOODS-N and 2 in GOODS-S. The AGN candidate samples of Kocevski et al. (2024) have been obtained from the PRIMER NIRCam survey in COSMOS and the JADES and NGDEEP survey (Bagley et al., 2024) in GOODS-S. The sample of Kocevski et al. (2024) contains 81 sources in COSMOS and 56 in GOODS-S, however, only 1 of these sources is spectroscopically confirmed in each field. The vast majority of sources in their sample therefore only have photometric redshifts, ranging from 2.4-11.9 (with a median ). The sample of Akins et al. (2024) contains 434 candidate AGN that have been photometrically selected from the COSMOS-Web survey (Casey et al., 2023) with photometric redshift ranging from 4.5-9.4 (median 6.3). Finally, we include 27 and 78 AGN candidates from Kokorev et al. (2024) in the GOODS-S and COSMOS fields, respectively. These have also been photometrically selected using data from multiple JWST programs: PRIMER (in COSMOS), FRESCO, JADES, and JEMS (Williams et al. 2023, in GOODS-S).
It is important to note that these photometric selected samples not only have uncertain redshifts, but also no confirmed broad Balmer emission lines. Therefore, in this work we refer to the sources in our sample as JWST discovered AGN candidates.
2.2 Radio data
Table 2 presents the radio surveys used in this work, including observations from LOFAR, MeerKAT, and VLA. The LOFAR observations at 144 MHz consist of data from the LOFAR Two Metre Sky Survey Data Release 2 (LoTSS-DR2; Shimwell et al. 2022) and the COSMOS-LOFAR survey (DDT19_002, PI: Vardoulaki, Vardoulaki et al. in prep.). The LoTSS-DR2 images are obtained with 8 hours of observations per pointing with an rms depth of 70 Jy beam-1 in the GOODS-N field. The COSMOS map has been imaged using 48 hours of observations, however, due to the low declination the rms depth is lower than GOODS-N with 150 Jy beam-1.
The first data release of the MeerKAT International Gigahertz Tiered Extragalactic Explorations (MIGHTEE; Jarvis et al. 2016) continuum survey contains deep imaging in COSMOS and GOODS-S at 1.3 GHz (see Hale et al. (2024) for details). The radio images are provided in two resolutions for each field111See https://archive-gw-1.kat.ac.za/public/repository/10.48479/7msw-r692/index.html. In this work, we utilize the high-resolution images (5-9″), which are not confusion limited and provide the deepest images in this particular case.
VLA data is publicly available in the COSMOS and GOODS-N fields at 3 and 1.4 GHz, respectively. The VLA-COSMOS 3 GHz Large Project (Smolčić et al., 2017) reaches a depth of 2.3 Jy beam-1 (from 384 hours of observations) with a high resolution of 0.75″. The GOODS-N VLA map includes 165 hours of observations and reaches 4 Jy beam-1 noise level at 1.4 GHz with a resolution of 1.7″ (Morrison et al., 2010).
All sources in our samples are covered by these radio surveys and together they cover a broad range of radio frequencies. To determine if any AGN candidates are detected in these surveys, we measure the SNR at the location of each source by dividing the peak flux density by the local rms (within 60″). This process yields multiple detections in each of the fields (1 in GOODS-N, 5 in GOODS-S, 36 in COSMOS), however, upon visual inspection the vast majority of these radio sources do not seem to be associated with the AGN candidate, but with a bright galaxy in the vicinity (a few to tens of arcseconds away; see Appendix A). We identify one source with associated radio emission in the COSMOS field, namely PRIMER-COS 3866 at . We extract its radio flux density using the Python Blob Detector and Source Finder (PyBDSF; Mohan & Rafferty 2015). The radio properties of this source are discussed next.
3 Radio detection of PRIMER-COS 3866
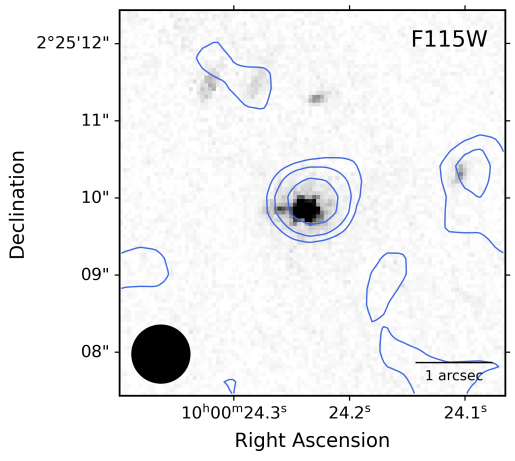
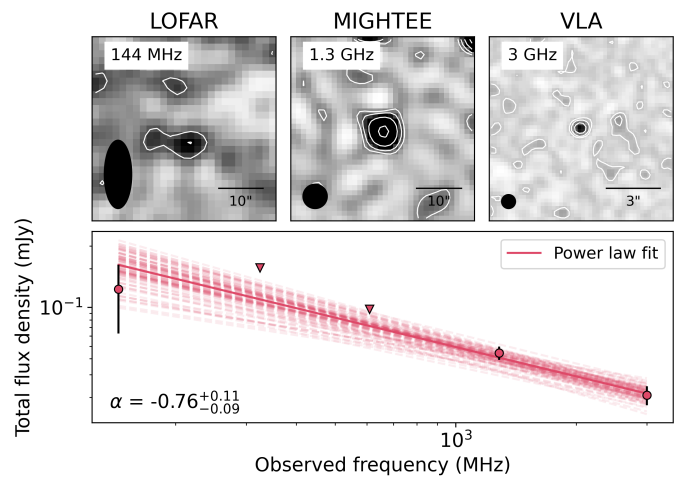
PRIMER-COS 3866 has been identified as an X-ray source in the Chandra COSMOS Survey (Elvis et al., 2009) as CXOC100024.2+022510. A few years later it was spectroscopically confirmed at by Civano et al. (2011) and its SED is in agreement with the source harboring an AGN (Kocevski et al., 2024). We confidently detect this source in the radio in MIGHTEE DR1 (S/N8) and VLA-COSMOS (S/N6). It is only tentatively detected with LOFAR (S/N2). The radio images, optical overlay, and flux density measurements are shown in Fig. 1. Its radio spectrum includes 3 upper limits on the flux density at 325 and 610 MHz obtained using the Giant Metrewave Radio Telescope (GMRT; Swarup 1991) with a local rms of 68 and 32 Jy beam-1, respectively (see Tisanić et al. 2019 for details). To constrain its spectral index we fit a simple power law222Defined as Sν = c , with the frequency and the spectral index., which is expected to be produced by non-thermal synchrotron emission. For the fitting process, we apply an invariant Markov Chain Monte Carlo (MCMC) method, utilizing the emcee python package (Foreman-Mackey et al., 2013). The best-fit parameters are determined by calculating the 50th percentile after 5,000 iterations, with the uncertainties estimated from the 16th and 84th percentiles. This yields a radio spectral index , which is close in value to the typical extragalactic source radio spectral index of (e.g. Hardcastle et al. 2016; Smolčić et al. 2017). As seen in Fig. 1 the radio spectrum of PRIMER-COS 3866 shows a possible curve, which could be caused by synchrotron self-absorption or free-free absorption. Similarly, previous work by Tisanić et al. (2020) found that the average radio SED of AGN in COSMOS are best fit by a broken power law model, indicating that the SED shape is affected by ageing or absorption. However, in our case, more data points are necessary to test this hypothesis properly.
Next, we determine the radio luminosity of PRIMER-COS 3866 using
| (1) |
with the total flux density at observed frequency , the luminosity distance, and the measured radio spectral index. This yields a rest-frame radio luminosity of of 31024 W Hz-1 or 91040 erg s-1.
Finally, we determine the radio-loudness of PRIMER-COS 3866, which we define as with the flux values determined at rest-frame. To obtain , we utilize the available JWST photometry333https://dawn-cph.github.io/dja (in the filters F115W, F150W, F200W, F277W, F356W, F444W) and interpolate between these flux values in log space for both the wavelength and flux. Finally, we fold in a (1+) correction to convert to rest-frame, which yields Jy 444Kocevski et al. (2024) extrapolate their best fit to the blue continuum to determine the rest-frame 1450Å magnitude of PRIMER-COS 3866, which results in lower flux values due to their flat UV slope of .. Together with its radio flux density converted to 5 GHz rest-frame of Jy, this results in a radio-loudness of , which is far below the radio-loudness limit of , classifying it as radio-quiet. This value is quite low compared to most radio detected high- AGN with typical measured radio-loudness values of (e.g. Bañados et al. 2015; Gloudemans et al. 2021). However, this could be due to the limited sensitivity of large sky radio surveys and rareness of known high- AGN. Compared with the radio-loudness distribution derived by Macfarlane et al. (2021) for quasars from the Sloan Digital Sky Survey (SDSS; York et al. 2000) at low-, PRIMER-COS 3866 falls in a region occupied by both AGN and star formation dominated sources.
The question is whether this radio emission could also be generated from star formation. The observed radio spectral index does not distinguish between star formation and AGN activity (see e.g. Hardcastle et al. 2016; An et al. 2021). One of the ways to unambiguously identify AGN activity from star formation is via the brightness temperature. The brightness temperature Tb can be determined using
| (2) |
with the total flux density, the observed frequency, and and the fitted minor and major axis of a 2D Gaussian (see e.g. Morabito et al. 2022). Since PRIMER-COS 3866 is not resolved in the radio images, this measurements only provides a lower limit. The LOFAR flux measurements provides the most constraining measurement of K. This value is below the AGN limit of K and therefore this does not prove the AGN nature of PRIMER-COS 3866. If the radio emission is generated purely by star formation, we expect an SFR of 820 M⊙ yr-1 from the observed radio luminosity - star formation rate correlation at 150 MHz (Smith et al., 2021). Even though its radio luminosity could be explained by star formation, its high X-ray luminosity of L erg s-1 (Kocevski et al., 2024) implies an extreme SFR of 105 M⊙ yr-1 (using Mineo et al. 2014), making an AGN origin more plausible.
PRIMER-COS 3866 does not have a JWST spectrum and therefore does not have an H emission line detection or reliable black hole mass estimate. Kocevski et al. (2024) estimated it has a black hole mass to be M⊙ from its X-ray luminosity and SED modeling, which is higher than most other spectroscopically confirmed AGN candidates (see Sect. 5).
4 Radio stacking
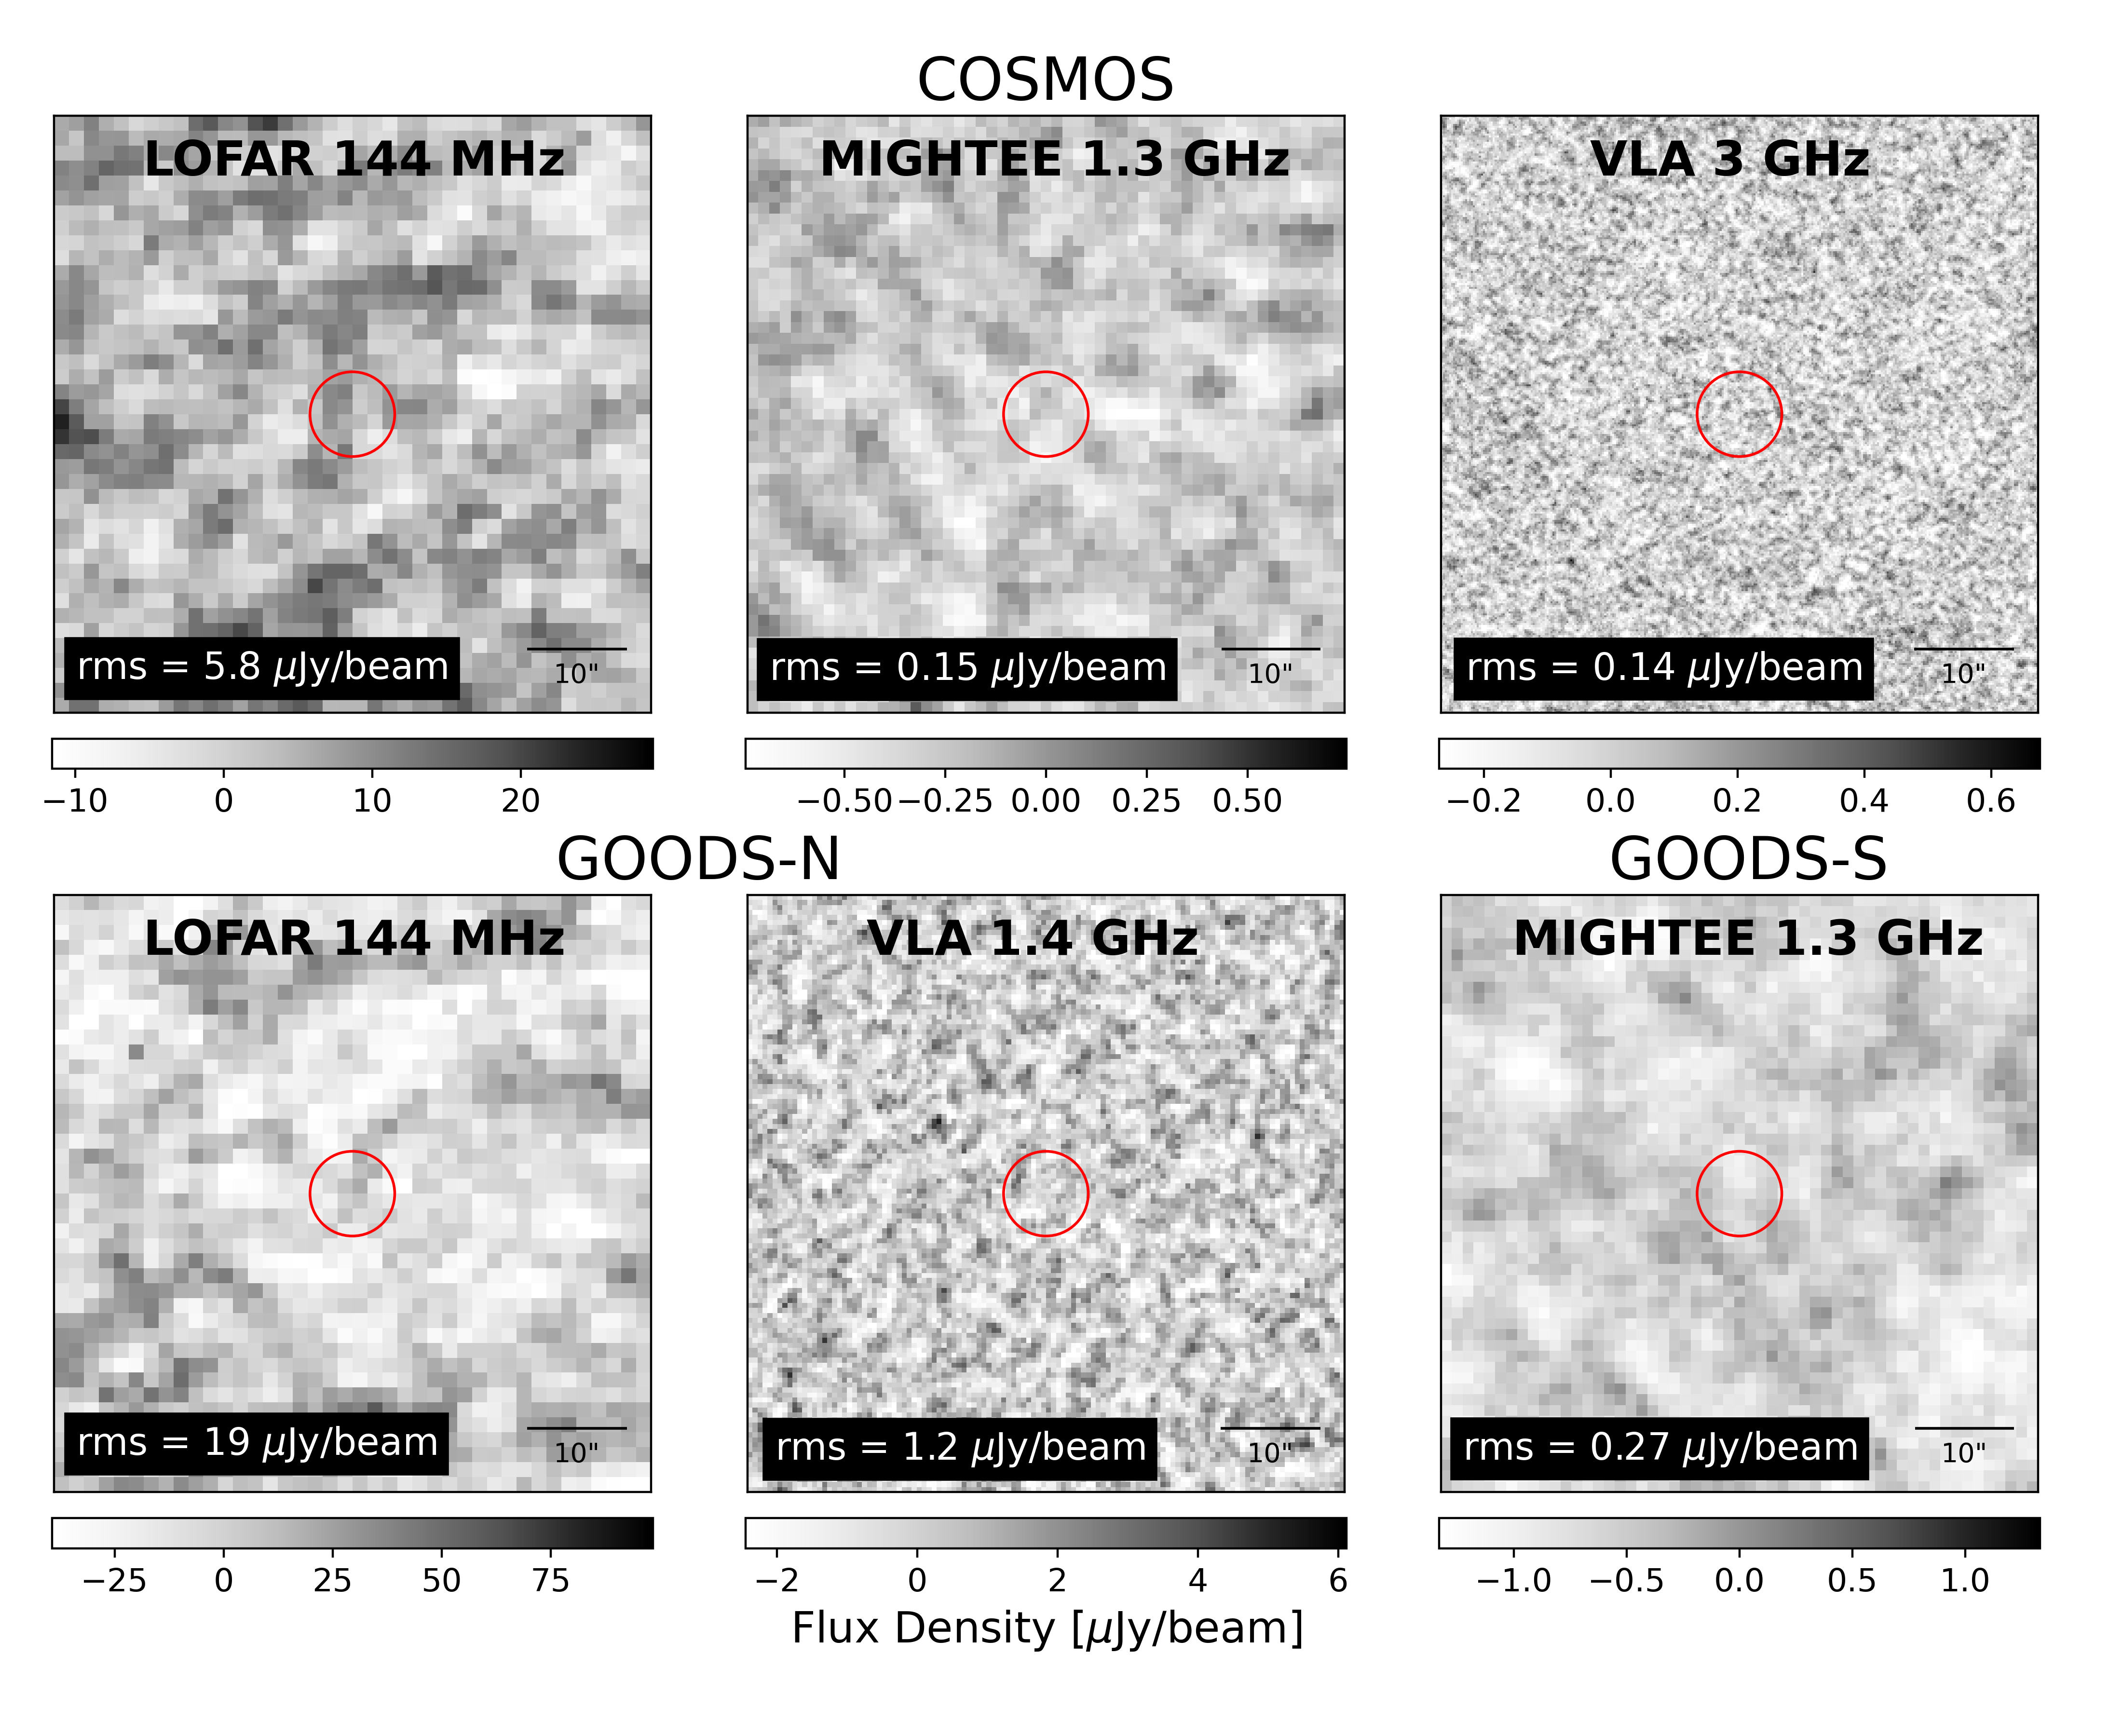
To determine the average radio properties of the JWST discovered AGN candidate population, we perform radio stacking in each of the fields and surveys listed in Table 2. We make 60″ 60″ cutouts at all optical source positions and median stack them separately for each survey. We assume the sources are unresolved and obtain the median flux density from the peak pixels at the source location. None of the stacks result in a radio detection with all peak flux density measurements below significance. The 3 limits on the flux density are given in the final column of Table 2. All stacks are shown in Fig. 2. The stacks in the COSMOS field provide the deepest constraints with an rms of 0.15 and 0.14 Jy beam-1 at 1.3 and 3 GHz, respectively, which yield 3 upper limits on the radio luminosity of erg s-1 and erg s-1, respectively. However, since only 1 source (PRIMER-COS 3866; see Sect. 3) has been spectroscopically confirmed, these limits are uncertain. The stacked radio images in GOODS-N, consisting of only spectroscopically confirmed AGN candidates, resulted in an average rms noise levels of 19 and 1.2 Jy beam-1 at 144 MHz and 1.4 GHz, respectively. This yields a 3 upper limit on the radio luminosity of 8.61039 erg s-1 at 1.4 GHz.
Furthermore, we determine an upper limit on the radio-loudness using the rest-frame optical flux at 4400Å and limit on the radio flux density at 5 GHz rest-frame. Similar to PRIMER-COS 3866, we obtain values by interpolating (extrapolating for ) in log space between the measured JWST flux values and correcting them to rest-frame by a factor (1+). For the sample of Akins et al. (2024), we use their provided flux measurements in filters F115W, F150W, F277W, F444W. For 4 sources in the sample of Matthee et al. (2024) we instead extrapolate their derived value to 4400 Å due to a lack of available photometry, assuming a K-correction of and their published values. In each field we determine the median value of all sources. For the radio spectral index, we assume . This yields a 3 upper limit on the radio-loudness of in GOODS-N and in COSMOS. We note that the radio luminosity and radio-loudness measurements depend strongly on the assumed spectral index. For example, our radio-loudness limit in the COSMOS field changes from to when assuming and , respectively. These radio-loudness limits in COSMOS are below the limit of , however, these values are still similar to the radio-loudness found for quasars at (e.g. Bañados et al. 2015; Gloudemans et al. 2021) and consistent with both AGN and star-formation dominated quasars from Macfarlane et al. (2021).
5 Discussion
5.1 Is a radio non-detection consistent with expectations?
The stacking procedure presented above leads to a non-detection of the sources in all three fields. To estimate the radio luminosity that we would expect for the AGN candidates, we utilise the empirical correlations between radio () and X-ray luminosity () and X-ray and H line luminosity () established for local AGN. The observed correlation between and from Saikia et al. (2015) is given by
| (3) |
Furthermore, we adopt the correlation between and from Jin et al. (2012), which is given by
| (4) |
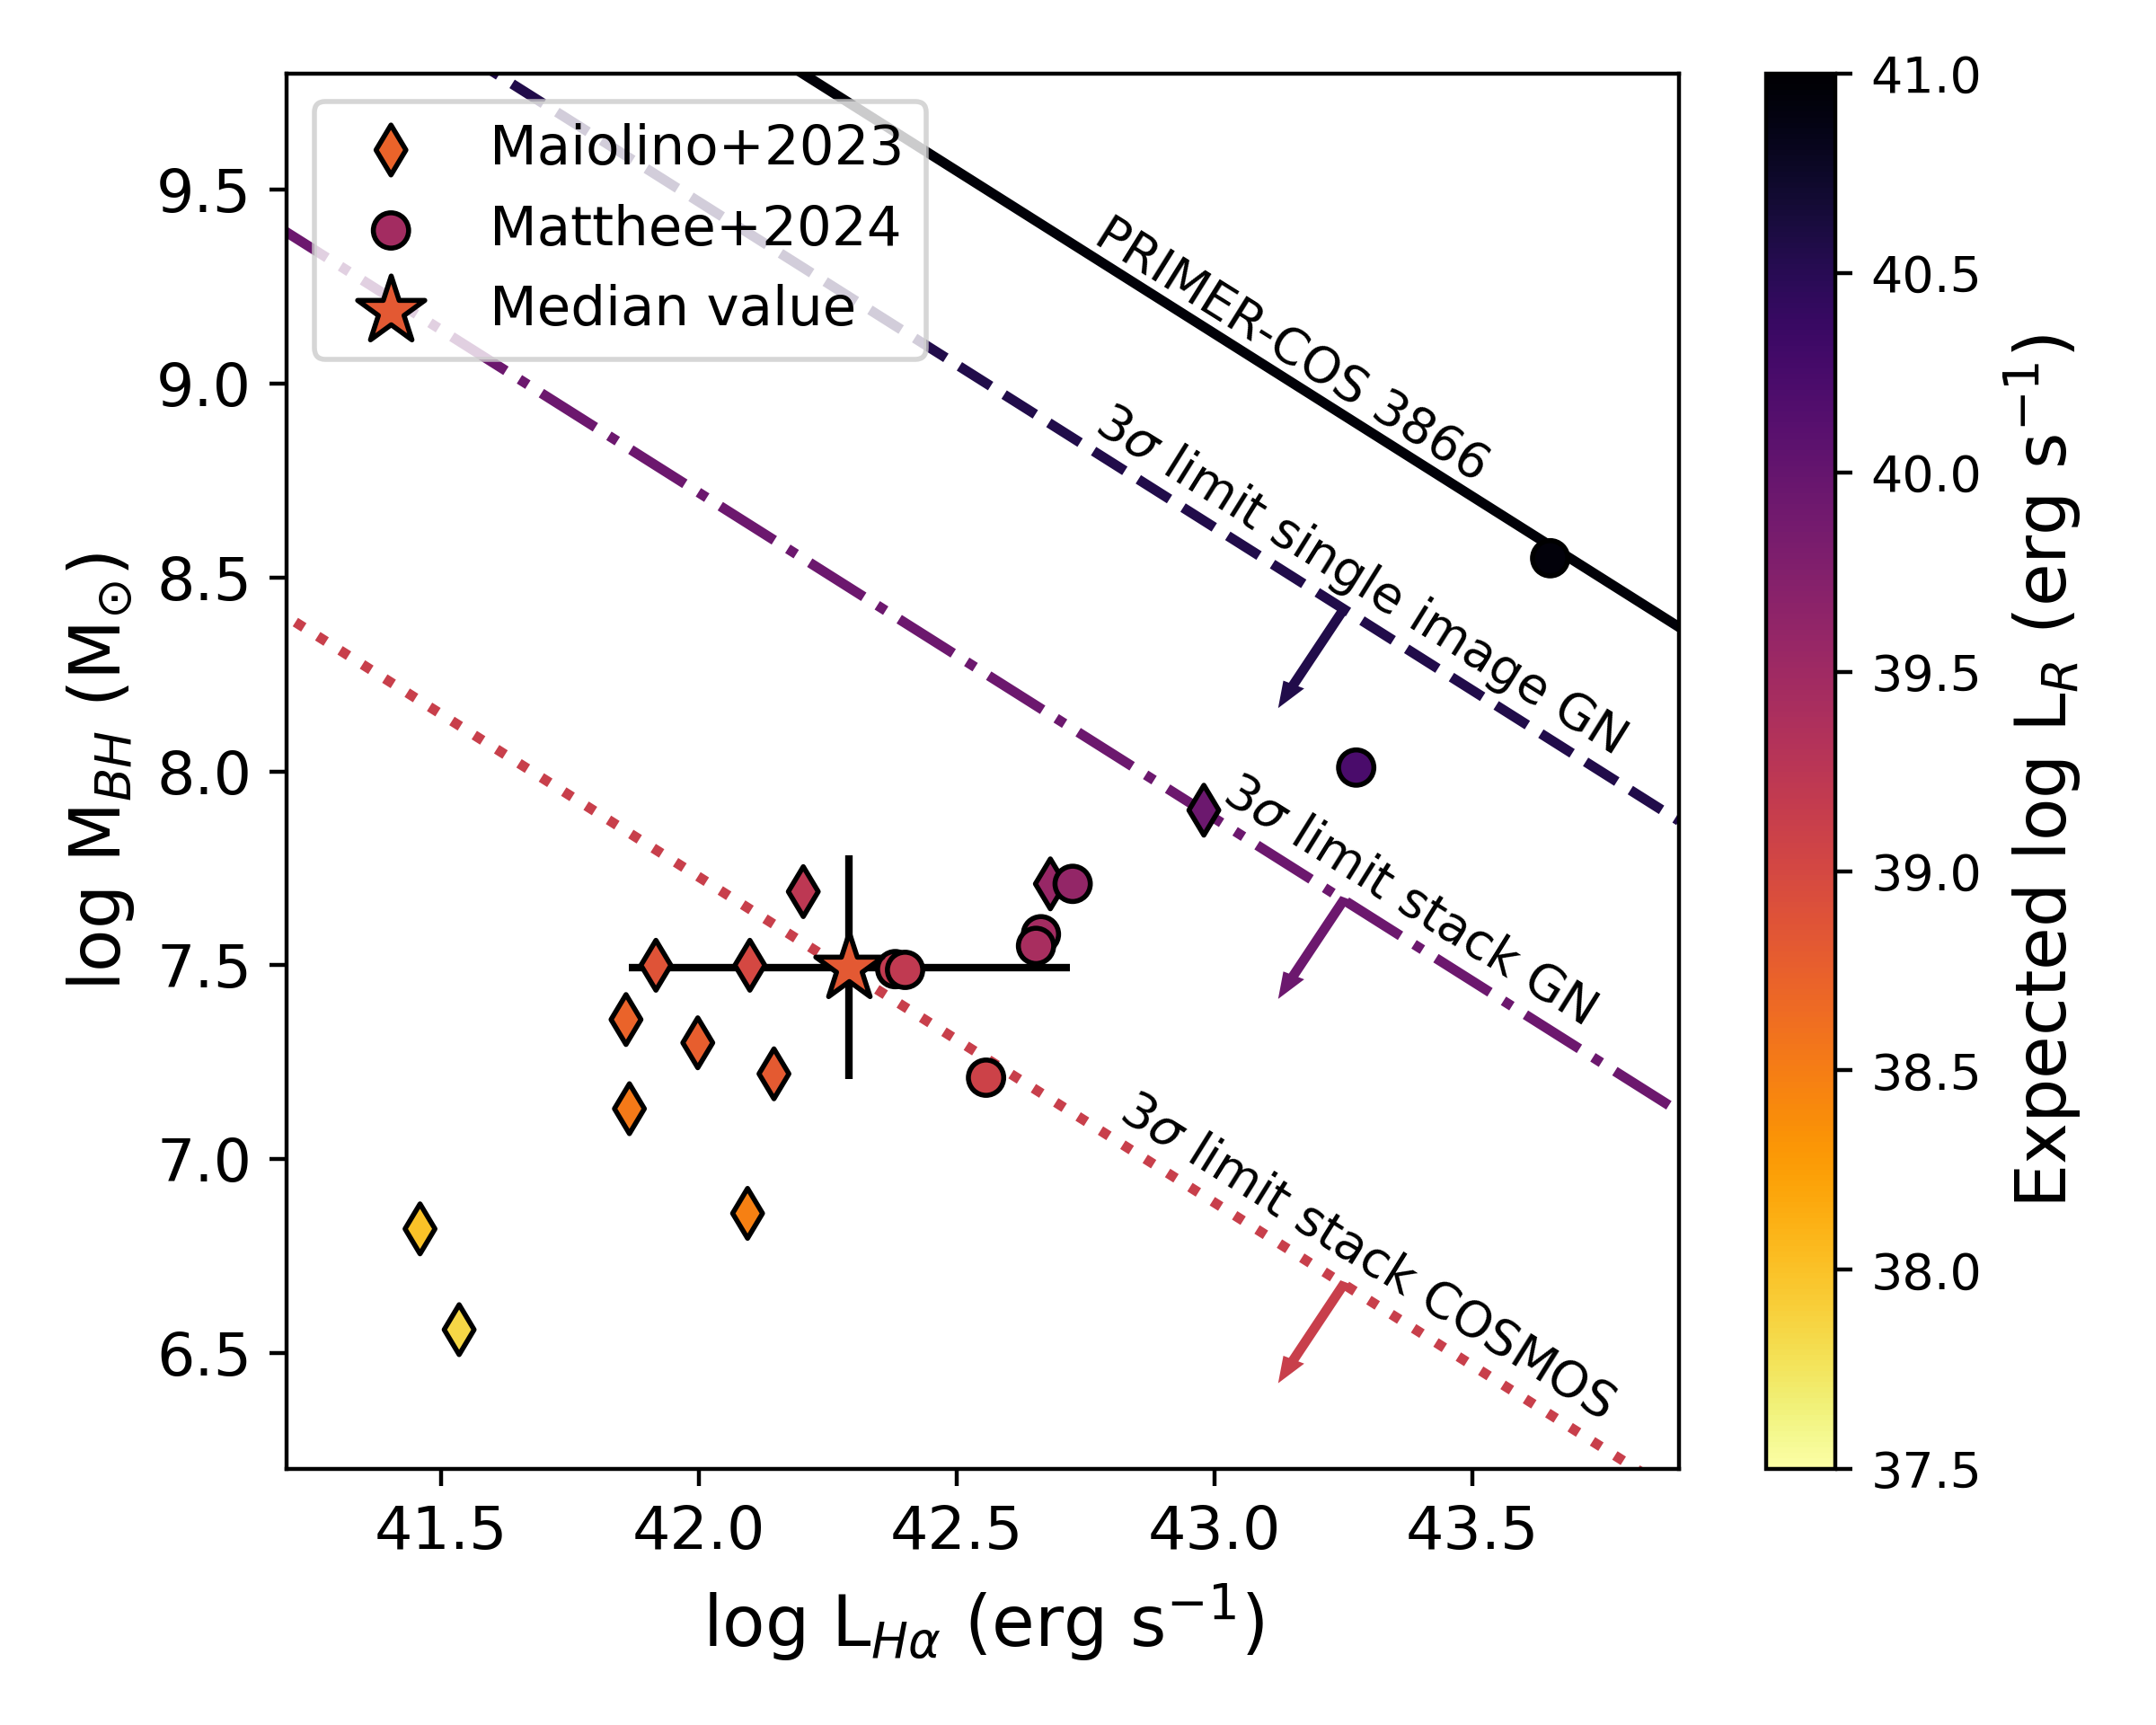
with a 0.3 dex scatter. Combining these two equations gives a relation between , , and . We use the black hole masses and 555Three sources require two broad components to fit the H line (see Maiolino et al. 2023). For these sources, we sum the fluxes of both components to obtain the H luminosity. of the sources in GOODS-N and GOODS-S and estimate the expected radio luminosity in Fig. 3. The resulting predicted radio luminosities range between erg s-1 with a median value of erg s-1. We compare this to the 3 radio flux limits derived from single and stacked VLA images in GOODS-N, which provide the deepest radio limit from spectroscopically confirmed AGN candidates. As can be seen in Fig. 3, there is only 1 source (GOODS-N-9771; Matthee et al. 2024) above the 3 limit of the single images, due to its high BH mass of 108.55 M⊙. GOODS-N-9771 is however not detected in any of the radio images. The expected 3 limit of the stack in GOODS-N is higher than the median BH mass and H luminosity value, and therefore the non-detection of these AGN candidates by stacking is as expected from these relations. We could not include the AGN candidates from Kocevski et al. (2024), Akins et al. (2024), and Kokorev et al. (2024) in this figure, since these do not have spectral measurements. For PRIMER-COS 3866 we include expected possible values derived from its radio luminosity, which are shown by the black solid line.
The MIGHTEE COSMOS and VLA-COSMOS data yield the deepest radio limits with 3 limits of 0.45 and 0.41 Jy at 1.3 GHz and 3 GHz, respectively, or 1.3 and 2.8 erg s-1 when assuming and . This 3 limit on the MIGHTEE stack is almost the same as the expected radio luminosity derived from the median H luminosity (of erg s-1). However, this stack includes spectroscopically unconfirmed sources and with the uncertainties in relations, we conclude that this limit is not constraining enough to claim these JWST discovered AGN candidates are radio-weaker than expected. Directly from the limit on their X-ray luminosity of erg s-1 (e.g. Yue et al. 2024; Maiolino et al. 2024; Inayoshi et al. 2024), the relation in Eq. 3 yields an expected erg s-1, which is also in line with a radio non-detection. Therefore, deeper radio surveys are necessary to obtain a detection or a meaningful upper limit.
In addition to PRIMER-COS 3866, there is another X-ray detected JWST discovered AGN candidate, JADES 21925 at in GOODS-S (see Kocevski et al. 2024). This source is however not detected in MIGHTEE with a 3 flux density upper limit of 5.7 Jy beam-1 and radio luminosity limit of 41039 erg s-1 at 1.3 GHz. Comparing this to its rest-frame optical magnitude at 4400 Å suggests a radio-loudness limit of . From its X-ray luminosity of / erg s-1) = 43.730.06 and black hole mass of 8.5106 M⊙, we would expect a radio luminosity of 1038.9 erg s-1 (see eq. 3), which is 5 lower than the derived upper limit. Therefore the radio non-detection is again as expected.
5.2 Literature comparison
This study was conducted in parallel to the analysis of Mazzolari et al. (2024). In their study of the GOODS-N field, they find a similar 3 upper limit on the radio luminosity of L erg s-1. By considering local scaling relations, they suggest that the JWST detected broad line AGN might show radio-weak behavior. Furthermore, Akins et al. (2024) also find their radio-loudness limit (using ) to be below the limit. Finally, Perger et al. (2024) also find a non-detection of LRDs down to a 3 noise levels of 11 Jy beam-1 and conclude that LRDs host weaker (sub-dominant) or no radio AGN.
While these JWST discovered AGN candidates might indeed be radio-weak, this work suggests that current radio observations are not constraining enough to confirm the possible radio-weakness of the JWST discovered AGN candidates and deeper radio observations are necessary (see Fig. 3 and Sect. 5.1). The radio properties of PRIMER-COS 3866 studied in this work highlight the possible similarity to known radio detected AGN. We furthermore speculate that any radio signal in the stack could be diminished by the inclusion of very faint sources and contaminants in the sample, which again highlights the need for further investigation.
5.3 Future surveys
This work demonstrates that deeper radio observations are necessary to detect the general population of JWST discovered AGN candidates (including LRDs). With our calculation in Sect. 5.1, we expect these sources to have a median radio luminosity of erg s-1 at 1.4 GHz (equal to 0.5 Jy at ). This sensitivity regime will be accessible by future radio telescopes such as the Square Kilometer Array (SKA; Dewdney et al. 2009) and the Next Generation Very Large Array (ngVLA; McKinnon et al. 2019).
The SKA is expected to have a weighted continuum sensitivity of 1.2-17 Jy beam-1 hr-1 at 1.3 GHz in the AA∗ configuration666https://sensitivity-calculator.skao.int/. This large range is caused by the choice of image weighting (e.g. natural versus uniform) and the sensitivity will depend strongly on the observing band, subarray configuration, and sky position. However, this example demonstrates that a sensitivity of 1 Jy beam-1 can easily be reached, which would allow for the detection of stacked AGN candidates from our predictions in Sect. 5.1.
The ngVLA is expected to reach a continuum rms of 0.24 Jy beam-1 hr-1 at 2.4 GHz using natural image weights and all baselines777See https://ngvla.nrao.edu/page/performance. At this sensitivity we can expect to detect individual sources as well as obtain a solid 5 detection of the general population by stacking sources. Constraining their brightness temperature, radio-loudness, and radio spectral index will enable to break the SF/AGN degeneracy.
Our understanding will furthermore be improved by the discovery of larger samples of AGN candidates including the spectroscopic confirmation of candidate samples (e.g. Kocevski et al. 2024; Akins et al. 2024; Kokorev et al. 2024). Ultimately, a combination of spectroscopic follow-up (e.g. large grism surveys such as Kakiichi et al. 2024) and multi-wavelength characterization (including X-ray, IR, and radio) will be necessary to determine the true nature of these compact red sources. Another future prospect is using strong gravitational lensing to obtain more radio detections (e.g. McCarty & Connor 2024).
6 Summary
We studied the radio properties of three samples of JWST discovered AGN candidates in COSMOS, GOODS-N, and GOODS-S using LOFAR, MeerKAT, and VLA in the frequency range of GHz. Our main findings are as follows:
-
•
The spectroscopically confirmed AGN candidate PRIMER-COS 3866 at is the only source that is detected in our radio surveys. Its radio spectrum yields a spectral index of . The spectrum shows a possible curvature caused by absorption, however, more data points are necessary to constrain this. Its radio-loudness of classifies it as radio-quiet, but is still consistent with other known AGN. The derived lower limit on the brightness temperature of K is too low to confirm its AGN nature.
-
•
None of our stacks resulted in a radio detection with peak flux density measurements below 2 significance. The 3 upper limits on the radio-loudness constrain the JWST discovered AGN candidate population to in GOODS-N (spectroscopically confirmed sample) and in COSMOS (photometrically selected sample), respectively. However, these constraints still depend on their radio spectral indices and true redshifts in the case of the photometrically selected sources.
-
•
The radio non-detections are still consistent with expectations from empirical and correlations. From their BH masses and H luminosities, we determined an expected radio luminosity of 1039 erg s-1 at 1.4 GHz of the population if these empirical relations hold. Note, however, that previous X-ray observations suggest that these are not regular type I AGN. We conclude that our current constraints from radio observations are not deep enough to determine if these JWST discovered AGN candidates are radio-weak.
-
•
Future radio telescopes, such as SKA and ngVLA, are expected to be able to reach these sensitivity limits easily within a few hours of observations. Especially, a measurement of the temperature brightness of this population will be crucial for confirming their AGN nature.
Acknowledgments
K.J.D. acknowledges funding from the STFC through an Ernest Rutherford Fellowship (grant number ST/W003120/1). E.P.F. is supported by the international Gemini Observatory, a program of NSF NOIRLab, which is managed by the Association of Universities for Research in Astronomy (AURA) under a cooperative agreement with the U.S. National Science Foundation, on behalf of the Gemini partnership of Argentina, Brazil, Canada, Chile, the Republic of Korea, and the United States of America. K. I. acknowledges support from the National Natural Science Foundation of China (12073003, 12003003, 11721303, 11991052, 11950410493), and the China Manned Space Project (CMSCSST-2021-A04 and CMS-CSST-2021-A06).
The research leading to these results has received funding from the European Union’s Horizon 2020 research and innovation programme under grant agreement No 101004719 [ORP].
This paper is based on data obtained with the LOFAR telescope (LOFAR-ERIC). LOFAR (van Haarlem et al. 2013) is the Low Frequency Array designed and constructed by ASTRON. It has observing, data processing, and data storage facilities in several countries, that are owned by various parties (each with their own funding sources), and that are collectively operated by the LOFAR European Research Infrastructure Consortium (LOFAR-ERIC) under a joint scientific policy. The LOFAR-ERIC resources have benefited from the following recent major funding sources: CNRS-INSU, Observatoire de Paris and Université d’Orléans, France; BMBF, MIWF-NRW, MPG, Germany; Science Foundation Ireland (SFI), Department of Business, Enterprise and Innovation (DBEI), Ireland; NWO, The Netherlands; The Science and Technology Facilities Council, UK; Ministry of Science and Higher Education, Poland.
Appendix A False radio detections
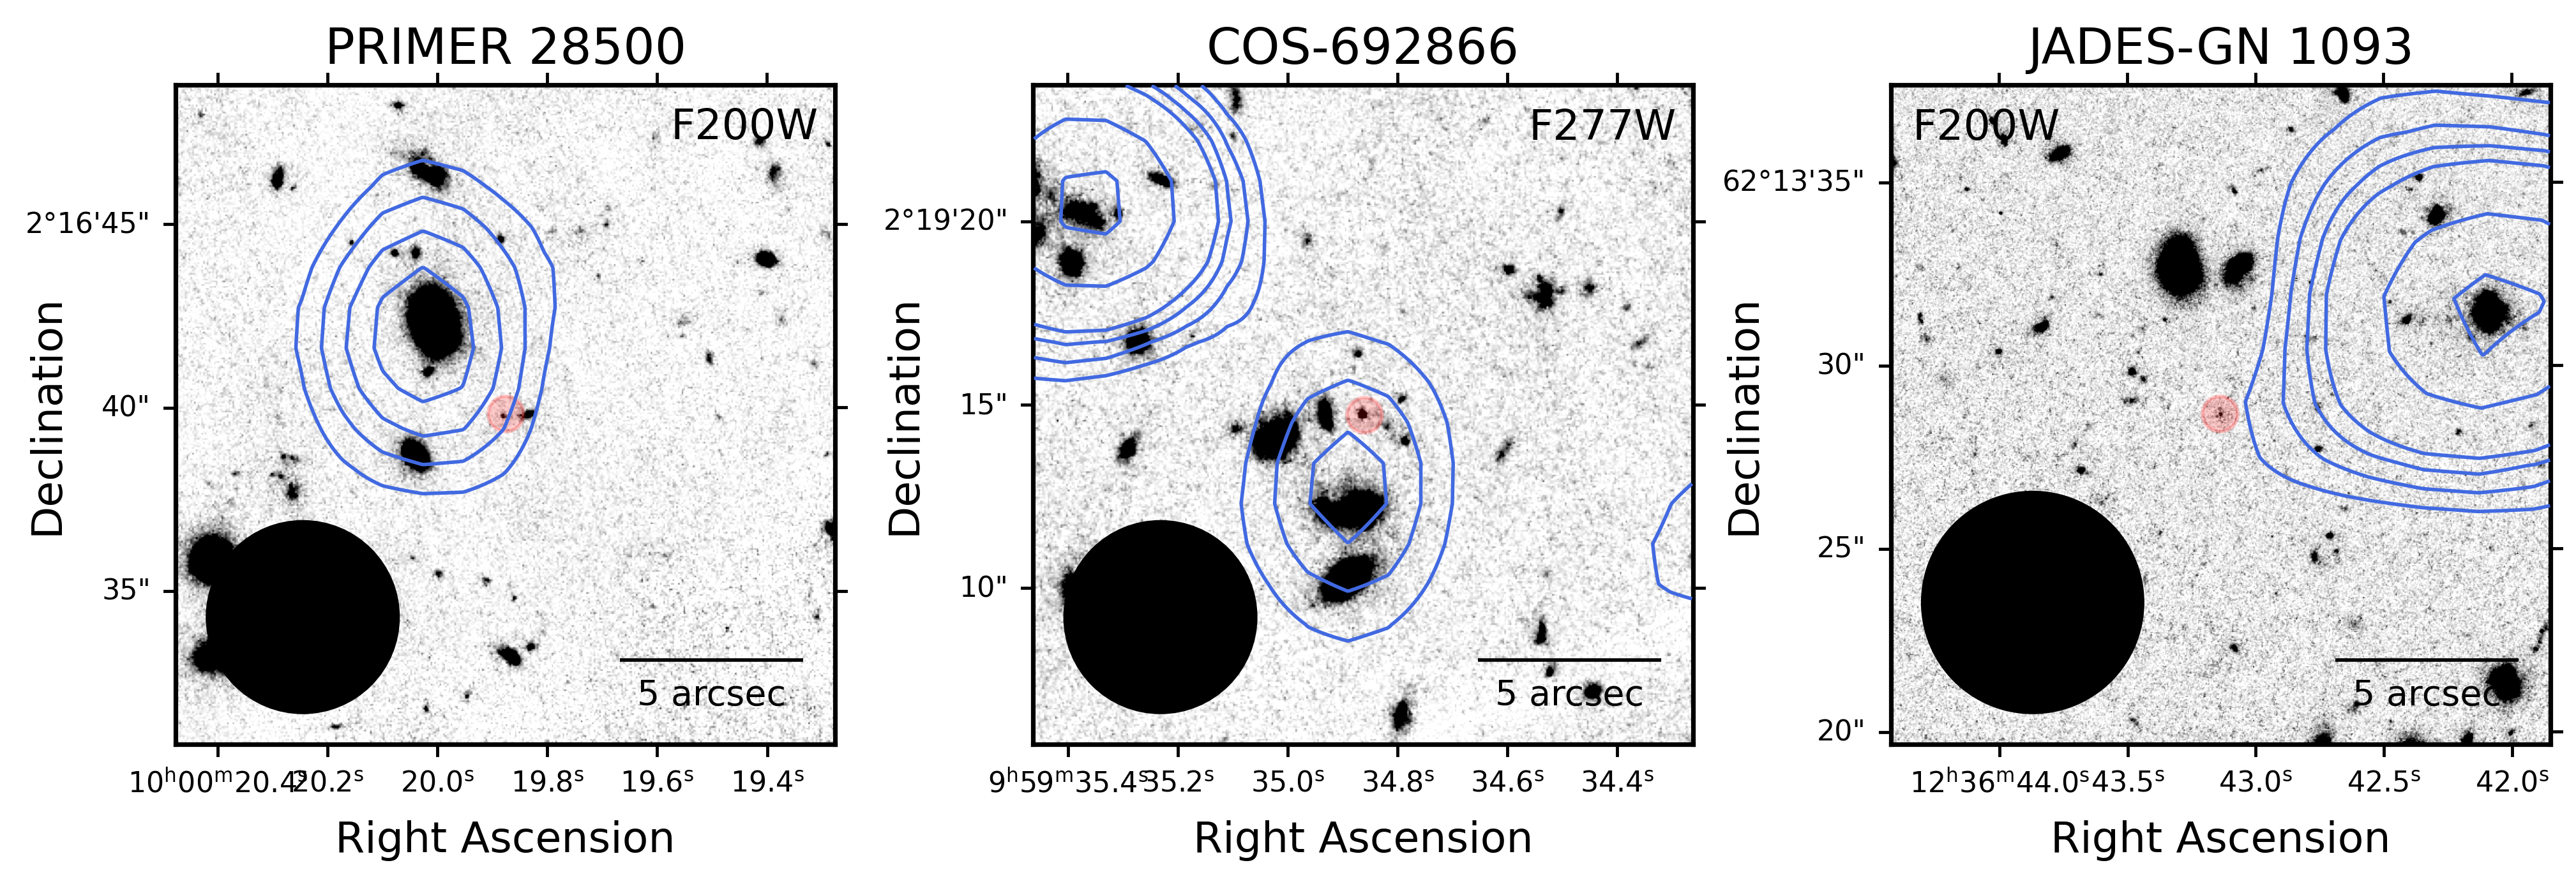
Figure 4 shows a few examples of false radio detections of our AGN candidates, where the radio source, in reality, is associated with a bright galaxy in the vicinity. Sometimes these bright galaxies are within the beam causing the confusion, but often it’s diffuse extended emission that is causing the false radio detection. Especially in the case of low-resolution radio observations and highly crowded fields, it is crucial to visually inspect any radio detection or perform likelihood association calculations.
References
- Akins et al. (2024) Akins, H. B., Casey, C. M., Lambrides, E., et al. 2024, arXiv e-prints, arXiv:2406.10341, doi: 10.48550/arXiv.2406.10341
- An et al. (2021) An, F., Vaccari, M., Smail, I., et al. 2021, MNRAS, 507, 2643, doi: 10.1093/mnras/stab2290
- Bañados et al. (2015) Bañados, E., Venemans, B. P., Morganson, E., et al. 2015, ApJ, 804, 118, doi: 10.1088/0004-637X/804/2/118
- Baggen et al. (2024) Baggen, J. F. W., van Dokkum, P., Brammer, G., et al. 2024, arXiv e-prints, arXiv:2408.07745, doi: 10.48550/arXiv.2408.07745
- Bagley et al. (2024) Bagley, M. B., Pirzkal, N., Finkelstein, S. L., et al. 2024, ApJ, 965, L6, doi: 10.3847/2041-8213/ad2f31
- Best et al. (2023) Best, P. N., Kondapally, R., Williams, W. L., et al. 2023, arXiv e-prints, arXiv:2305.05782, doi: 10.48550/arXiv.2305.05782
- Casey et al. (2023) Casey, C. M., Kartaltepe, J. S., Drakos, N. E., et al. 2023, ApJ, 954, 31, doi: 10.3847/1538-4357/acc2bc
- Civano et al. (2011) Civano, F., Brusa, M., Comastri, A., et al. 2011, ApJ, 741, 91, doi: 10.1088/0004-637X/741/2/91
- Dewdney et al. (2009) Dewdney, P. E., Hall, P. J., Schilizzi, R. T., & Lazio, T. J. L. W. 2009, IEEE Proceedings, 97, 1482, doi: 10.1109/JPROC.2009.2021005
- Eisenstein et al. (2023) Eisenstein, D. J., Willott, C., Alberts, S., et al. 2023, arXiv e-prints, arXiv:2306.02465, doi: 10.48550/arXiv.2306.02465
- Elvis et al. (2009) Elvis, M., Civano, F., Vignali, C., et al. 2009, ApJS, 184, 158, doi: 10.1088/0067-0049/184/1/158
- Foreman-Mackey et al. (2013) Foreman-Mackey, D., Hogg, D. W., Lang, D., & Goodman, J. 2013, PASP, 125, 306, doi: 10.1086/670067
- Gloudemans et al. (2021) Gloudemans, A. J., Duncan, K. J., Röttgering, H. J. A., et al. 2021, A&A, 656, A137, doi: 10.1051/0004-6361/202141722
- Greene et al. (2024) Greene, J. E., Labbe, I., Goulding, A. D., et al. 2024, ApJ, 964, 39, doi: 10.3847/1538-4357/ad1e5f
- Hale et al. (2024) Hale, C. L., Heywood, I., Jarvis, M. J., et al. 2024, arXiv e-prints, arXiv:2411.04958, doi: 10.48550/arXiv.2411.04958
- Hardcastle et al. (2016) Hardcastle, M. J., Gürkan, G., van Weeren, R. J., et al. 2016, MNRAS, 462, 1910, doi: 10.1093/mnras/stw1763
- Harikane et al. (2023) Harikane, Y., Zhang, Y., Nakajima, K., et al. 2023, ApJ, 959, 39, doi: 10.3847/1538-4357/ad029e
- Inayoshi & Ichikawa (2024) Inayoshi, K., & Ichikawa, K. 2024, ApJ, 973, L49, doi: 10.3847/2041-8213/ad74e2
- Inayoshi et al. (2024) Inayoshi, K., Kimura, S., & Noda, H. 2024, arXiv e-prints, arXiv:2412.03653, doi: 10.48550/arXiv.2412.03653
- Jarvis et al. (2016) Jarvis, M., Taylor, R., Agudo, I., et al. 2016, in MeerKAT Science: On the Pathway to the SKA, 6, doi: 10.22323/1.277.0006
- Jin et al. (2012) Jin, C., Ward, M., & Done, C. 2012, MNRAS, 422, 3268, doi: 10.1111/j.1365-2966.2012.20847.x
- Jonas & MeerKAT Team (2016) Jonas, J., & MeerKAT Team. 2016, in MeerKAT Science: On the Pathway to the SKA, 1, doi: 10.22323/1.277.0001
- Kakiichi et al. (2024) Kakiichi, K., Egami, E., Fan, X., et al. 2024, COSMOS-3D: A Legacy Spectroscopic/Imaging Survey of the Early Universe, JWST Proposal. Cycle 3, ID. #5893
- Kashino et al. (2023) Kashino, D., Lilly, S. J., Matthee, J., et al. 2023, ApJ, 950, 66, doi: 10.3847/1538-4357/acc588
- Kocevski et al. (2023) Kocevski, D. D., Onoue, M., Inayoshi, K., et al. 2023, ApJ, 954, L4, doi: 10.3847/2041-8213/ace5a0
- Kocevski et al. (2024) Kocevski, D. D., Finkelstein, S. L., Barro, G., et al. 2024, arXiv e-prints, arXiv:2404.03576, doi: 10.48550/arXiv.2404.03576
- Kokorev et al. (2023) Kokorev, V., Fujimoto, S., Labbe, I., et al. 2023, ApJ, 957, L7, doi: 10.3847/2041-8213/ad037a
- Kokorev et al. (2024) Kokorev, V., Caputi, K. I., Greene, J. E., et al. 2024, ApJ, 968, 38, doi: 10.3847/1538-4357/ad4265
- Labbe et al. (2023) Labbe, I., Greene, J. E., Bezanson, R., et al. 2023, arXiv e-prints, arXiv:2306.07320, doi: 10.48550/arXiv.2306.07320
- Lambrides et al. (2024) Lambrides, E., Garofali, K., Larson, R., et al. 2024, arXiv e-prints, arXiv:2409.13047, doi: 10.48550/arXiv.2409.13047
- Macfarlane et al. (2021) Macfarlane, C., Best, P. N., Sabater, J., et al. 2021, MNRAS, 506, 5888, doi: 10.1093/mnras/stab1998
- Maiolino et al. (2023) Maiolino, R., Scholtz, J., Curtis-Lake, E., et al. 2023, arXiv e-prints, arXiv:2308.01230, doi: 10.48550/arXiv.2308.01230
- Maiolino et al. (2024) Maiolino, R., Risaliti, G., Signorini, M., et al. 2024, arXiv e-prints, arXiv:2405.00504, doi: 10.48550/arXiv.2405.00504
- Matthee et al. (2024) Matthee, J., Naidu, R. P., Brammer, G., et al. 2024, ApJ, 963, 129, doi: 10.3847/1538-4357/ad2345
- Mazzolari et al. (2024) Mazzolari, G., Gilli, R., Maiolino, R., et al. 2024, arXiv e-prints, arXiv:2412.04224, doi: 10.48550/arXiv.2412.04224
- McCarty & Connor (2024) McCarty, S., & Connor, L. 2024, arXiv e-prints, arXiv:2412.01746, doi: 10.48550/arXiv.2412.01746
- McKinnon et al. (2019) McKinnon, M., Beasley, A., Murphy, E., et al. 2019, in Bulletin of the American Astronomical Society, Vol. 51, 81
- Mineo et al. (2014) Mineo, S., Gilfanov, M., Lehmer, B. D., Morrison, G. E., & Sunyaev, R. 2014, MNRAS, 437, 1698, doi: 10.1093/mnras/stt1999
- Mohan & Rafferty (2015) Mohan, N., & Rafferty, D. 2015, PyBDSF: Python Blob Detection and Source Finder, Astrophysics Source Code Library, record ascl:1502.007. http://ascl.net/1502.007
- Morabito et al. (2022) Morabito, L. K., Sweijen, F., Radcliffe, J. F., et al. 2022, MNRAS, 515, 5758, doi: 10.1093/mnras/stac2129
- Morrison et al. (2010) Morrison, G. E., Owen, F. N., Dickinson, M., Ivison, R. J., & Ibar, E. 2010, ApJS, 188, 178, doi: 10.1088/0067-0049/188/1/178
- Oesch et al. (2023) Oesch, P. A., Brammer, G., Naidu, R. P., et al. 2023, MNRAS, 525, 2864, doi: 10.1093/mnras/stad2411
- Pérez-González et al. (2024) Pérez-González, P. G., Barro, G., Rieke, G. H., et al. 2024, ApJ, 968, 4, doi: 10.3847/1538-4357/ad38bb
- Perger et al. (2024) Perger, K., Fogasy, J., Frey, S., & Gabányi, K. É. 2024, arXiv e-prints, arXiv:2411.19518, doi: 10.48550/arXiv.2411.19518
- Pizzati et al. (2024) Pizzati, E., Hennawi, J. F., Schaye, J., et al. 2024, arXiv e-prints, arXiv:2409.18208, doi: 10.48550/arXiv.2409.18208
- Randall et al. (2012) Randall, K. E., Hopkins, A. M., Norris, R. P., et al. 2012, MNRAS, 421, 1644, doi: 10.1111/j.1365-2966.2012.20422.x
- Saikia et al. (2015) Saikia, P., Körding, E., & Falcke, H. 2015, MNRAS, 450, 2317, doi: 10.1093/mnras/stv731
- Shimwell et al. (2022) Shimwell, T. W., Hardcastle, M. J., Tasse, C., et al. 2022, A&A, 659, A1, doi: 10.1051/0004-6361/202142484
- Smith et al. (2021) Smith, D. J. B., Haskell, P., Gürkan, G., et al. 2021, A&A, 648, A6, doi: 10.1051/0004-6361/202039343
- Smolčić et al. (2017) Smolčić, V., Novak, M., Delvecchio, I., et al. 2017, A&A, 602, A6, doi: 10.1051/0004-6361/201730685
- Swarup (1991) Swarup, G. 1991, in Astronomical Society of the Pacific Conference Series, Vol. 19, IAU Colloq. 131: Radio Interferometry. Theory, Techniques, and Applications, ed. T. J. Cornwell & R. A. Perley, 376–380
- Thompson et al. (1980) Thompson, A. R., Clark, B. G., Wade, C. M., & Napier, P. J. 1980, ApJS, 44, 151, doi: 10.1086/190688
- Tisanić et al. (2020) Tisanić, K., Smolčić, V., Imbrišak, M., et al. 2020, A&A, 643, A51, doi: 10.1051/0004-6361/201937114
- Tisanić et al. (2019) Tisanić, K., Smolčić, V., Delhaize, J., et al. 2019, A&A, 621, A139, doi: 10.1051/0004-6361/201834002
- van Haarlem et al. (2013) van Haarlem, M. P., Wise, M. W., Gunst, A. W., et al. 2013, A&A, 556, A2, doi: 10.1051/0004-6361/201220873
- Wang et al. (2024) Wang, B., de Graaff, A., Davies, R. L., et al. 2024, arXiv e-prints, arXiv:2403.02304, doi: 10.48550/arXiv.2403.02304
- Williams et al. (2023) Williams, C. C., Tacchella, S., Maseda, M. V., et al. 2023, ApJS, 268, 64, doi: 10.3847/1538-4365/acf130
- Williams et al. (2024) Williams, C. C., Alberts, S., Ji, Z., et al. 2024, ApJ, 968, 34, doi: 10.3847/1538-4357/ad3f17
- York et al. (2000) York, D. G., Adelman, J., Anderson, John E., J., et al. 2000, AJ, 120, 1579, doi: 10.1086/301513
- Yue et al. (2024) Yue, M., Eilers, A.-C., Ananna, T. T., et al. 2024, ApJ, 974, L26, doi: 10.3847/2041-8213/ad7eba