Direct measurement of the longitudinal exciton dispersion in -BN by resonant inelastic x-ray scattering
Abstract
We report resonant inelastic X-ray scattering (RIXS) measurements on the prototypical hexagonal boron nitride (-BN) layered compound. The RIXS results at the B and N K edges have been combined with electron energy loss spectroscopy (EELS) experiments and ab initio calculations within the framework of the Bethe-Salpeter equation of many-body perturbation theory. By means of this tight interplay of different spectroscopies, the lowest longitudinal exciton of -BN has been identified. Moreover, its qualitatively different dispersions along the K and the M directions of the Brillouin zone have been determined. Our study advocates soft x-ray RIXS and EELS to be a promising combination to investigate electronic excitations in materials.
I Introduction
Resonant inelastic X-ray scattering (RIXS) is a powerful spectroscopy to characterize neutral low-energy excitations in materials Schülke (2007); Kotani and Shin (2001); Rueff and Shukla (2010); Ament et al. (2011). The process of X-ray photon scattering can be understood as the coherent combination of X-ray absorption and X-ray emission. In the simplest situation, a core electron is promoted into an empty conduction state by absorbing a photon, while the core hole is filled by the decay of a valence electron that emits a photon of lower energy. The energy lost by the photon matches the energy difference between the ground state and an excited state with an electron in a conduction state and a hole in a valence state. The resonant character is due to the fact that the incoming photon energy is close to the energy of an X-ray absorption edge. Being a photon-in photon-out technique, RIXS can be considered as a bulk probe, while its resonant nature makes it element and orbital selective. These favorable features, together with the impressive improvements in energy resolution obtained in the recent yearsRueff and Shukla (2010); Ament et al. (2011), have made RIXS a very appealing technique. Indeed, RIXS has been applied to succesfully investigate the elementary excitations of the various degrees of freedom (charge, orbital, spin and lattice) in a wide range of materials, notably transition metal compounds Hepting et al. (2018); Gretarsson et al. (2019); Braicovich et al. (2009); Le Tacon et al. (2011); Schlappa et al. (2012); Hill et al. (2008); Braicovich et al. (2010); Lee et al. (2013, 2014); Moser et al. (2015); Rossi et al. (2019); Ruotsalainen et al. (2021a).
However, the richness of RIXS spectra also comes at the price of the difficulty of its theoretical interpretation, which is largely due to the inherently complicated nature of the scattering process, of second order in the photon-matter interaction. An accurate description of the scattering requires the Kramers-Heisenberg formula Schülke (2007); Kotani and Shin (2001); Rueff and Shukla (2010); Ament et al. (2011) for the double differential cross section that describes RIXS spectra as a function of the energies, wavevectors, and polarizations of the incoming and outgoing photons111Atomic units are used throughout the paper if not otherwise stated., respectively. The ab initio calculation of RIXS spectra using Green’s function theory, within the framework of the Bethe-Salpeter equationOnida et al. (2002) (BSE) in the GW approximationHedin (1965) (GWA), has been pioneered by Shirley and coworkers Shirley (1998); Carlisle et al. (1999a, b); Shirley (2000a, b) in the late nineties. Despite recent progressGilmore et al. (2015); Vinson et al. (2017); Gilmore et al. (2021); Dashwood et al. (2021); Vorwerk et al. (2020); de Groot et al. (2021), its use remains limited. The main reason is the inadequacy of the first-order perturbative GWA and static BSE standard implementations for transition metal compounds Faleev et al. (2004); Bruneval and Gatti (2014); Cudazzo and Reining (2020). Instead, the state-of-the-art theoretical simulation of RIXS is nowadays mostly grounded on finite cluster models within multiplet ligand-field theory De Groot and Kotani (2008); Haverkort et al. (2012); Josefsson et al. (2012); Zimmermann et al. (2018); de Groot et al. (2021). These theoretical methods have repeatedly demonstrated to be very efficient in the description of measured spectra, and have also fixed the current terminology for transition metal compounds Zaanen et al. (1985). However, these model approaches are not parameter free, treat solid state effects with drastic approximations
and are limited by their high computational cost to deal explicitly only with few degrees of freedom. Therefore, progress in the interpretation of RIXS spectra still remains a pressing need in order to realise entirely the potential of such a powerful technique.
A promising strategy to improve our understanding is to establish a careful connection of RIXS with alternative spectroscopy techniques that also measure neutral excitations in materialsHuotari (2012), such as optical absorption, electron energy loss spectroscopy Fink et al. (2001); García de Abajo (2010); Egerton (2011) (EELS), and non-resonant inelastic X-ray scattering Schülke (2007) (NRIXS). The electronic excitation spectra measured by these complementary methods can be all directly expressed in terms of the macroscoscopic dielectric functionOnida et al. (2002) . While absorption spectra are described by , both EELS and NRIXS give access to the loss function . Optical spectroscopies often have an excellent energy resolution, but probe the long-wavelength limit only. Conversely, EELS and NRIXS can measure the momentum dependence of different excitations in solidsSchülke (2007); Waidmann et al. (2000); Galambosi et al. (2005); Cai et al. (2006); Larson et al. (2007); Abbamonte et al. (2008); Huotari et al. (2009, 2010, 2011), typically in the low ( Å-1) and high ( Å-1) momentum ranges, respectivelyHuotari et al. (2011).
When performed within a transmission electron microscope, EELS provides an excellent spatial resolution, down to the atomic scale when looking at core excitations, allowing one to correlate structure and spectroscopic response over a wide energy domain. On the other hand, since it makes use of hard X-rays, NRIXS is compatible with complex sample environments such as high-pressure cells, enabling pressure-dependent studies of electronic excitations.Rueff and Shukla (2010); Mao et al. (2011) Being first-order in the probe-matter interaction, the theoretical interpretation of these spectroscopies is simpler than for RIXS. The ab initio GW-BSE represents the state-of-the-art approach to characterise excitonsKnox (1963) (i.e., bound electron-hole pairs) in the absorption spectra of solidsOnida et al. (2002); Bechstedt (2014); Martin et al. (2016). Similarly, the GW-BSE and the computationally more efficient approximations of time-dependent density functional theoryOnida et al. (2002); Runge and Gross (1984); Ullrich (2012) have been successfully employed to describe electronic excitations such as plasmonsPines (1963) (i.e., collective excitations of the electronic charge) in the loss functions of a large variety of materialsQuong and Eguiluz (1993); Aryasetiawan and Karlsson (1994); Larson et al. (1996); Marinopoulos et al. (2002); Gurtubay et al. (2005); Weissker et al. (2006); Hambach et al. (2008); Cazzaniga et al. (2011); Echeverry et al. (2012); Zubizarreta et al. (2014); Seidu et al. (2018); Iori et al. (2012); Rödl et al. (2017); Ruotsalainen et al. (2021b); Caliebe et al. (2000); Soininen and Shirley (2000); Olevano and Reining (2001); Gatti and Sottile (2013).
Here we show how RIXS is a powerful technique for probing the intriguing exciton physics of a prototypical wide-gap layered compound, hexagonal boron nitride (-BN). -BN is the ionic analogue of graphiteBassani and Parravicini (1975). It is formed by weakly interacting two-dimensional hexagonal BN sheets that are stacked along the crystallographic axis. Being a material presenting a very strong luminescence in the deep ultravioletWatanabe et al. (2004); Watanabe and Taniguchi (2009); Gil et al. (2020); Moon et al. , the electronic and optical properties of -BN have been extensively studied with different experimental techniques, including RIXSO’Brien et al. (1993); Jia et al. (1996); Carlisle et al. (1999a); Yanagihara et al. (1997); Miyata et al. (2002); MacNaughton et al. (2005); Vinson et al. (2017); Pelliciari et al. (2024), optical spectroscopies (ellipsometry, reflectivity, photoluminescence or cathodoluminescence) Mamy, R. et al. (1981); Artús et al. (2021); Watanabe et al. (2004); Watanabe and Taniguchi (2009); Museur et al. (2011); Bourrellier et al. (2014); Cassabois et al. (2016); Schué et al. (2016); Elias et al. (2021); Schué et al. (2019), EELSBüchner (1977); Tarrio and Schnatterly (1989); Fossard et al. (2017); Schuster et al. (2018) and NRIXSGalambosi et al. (2011); Fugallo et al. (2015). Due to the important role played by defects within the band gapTran et al. (2016); Caldwell et al. (2019), the availability of high quality -BN samplesTaniguchi and Watanabe (2007) has been of utmost importance in order to obtain reliable results in those experiments. On the other side, ab initio calculations have demonstrated that -BN has an indirect band gap and a large exciton binding energy Catellani et al. (1987); Blase et al. (1995); Cappellini et al. (2001); Arnaud et al. (2006); Wirtz et al. (2005, 2006). Its simple band structure can be also accurately parametrised by tight-binding approachesDoni and Parravicini (1969); Bassani and Parravicini (1975); Galvani et al. (2016); Paleari et al. (2018). Because of the large electronegativity difference between boron and nitrogen, the BN covalent bond is polar. The electronic states can be classified according to the even () and odd () parity with respect to the BN layer. The occupied states are mainly localised on N atoms, while the unoccupied mostly on the B ones. The lowest energy electronic excitations are determined by - transitions that in optical spectra are visible mainly for in-plane polarization.
In the present work, we have measured by RIXS the neutral electronic excitations in a -BN single crystal in the small range 0.1 Å-1. With respect to previous RIXS experimentsJia et al. (1996); Carlisle et al. (1999a) that focused mostly on band properties scanning the excitation energy in a wide range across and resonances, here, by performing RIXS at the B K edge, we have been able to identify the lowest energy exciton of -BN and to track its dispersion. Moreover, we have combined RIXS with EELS and ab initio BSE calculations, together with recent ellipsometry data from Ref. Artús et al., 2021, to establish a firm connection between the different spectroscopies, which has a general validity well beyond the specific case of -BN.
The paper is organised as follows. Sec. II summarizes the experimental and computational details, along with the key definitions of the spectral quantities that are measured and analysed in the rest of the paper. Secs. III.1 and III.2 give an overview of the XAS and RIXS spectra measured at the B and N K edges. Sec. III.3 compares RIXS spectra with EELS and absorption, also supported by ab initio calculations, defining the relation between the different techniques. Sec. III.4 focuses on the exciton dispersion as a function of the wavevector , while Sec. IV.1 suggests an analogy with orbital excitations in transition metal oxides. Finally, conclusions are drawn in Sec. V.
II Experimental and computational details
II.1 RIXS at the B and N K edges
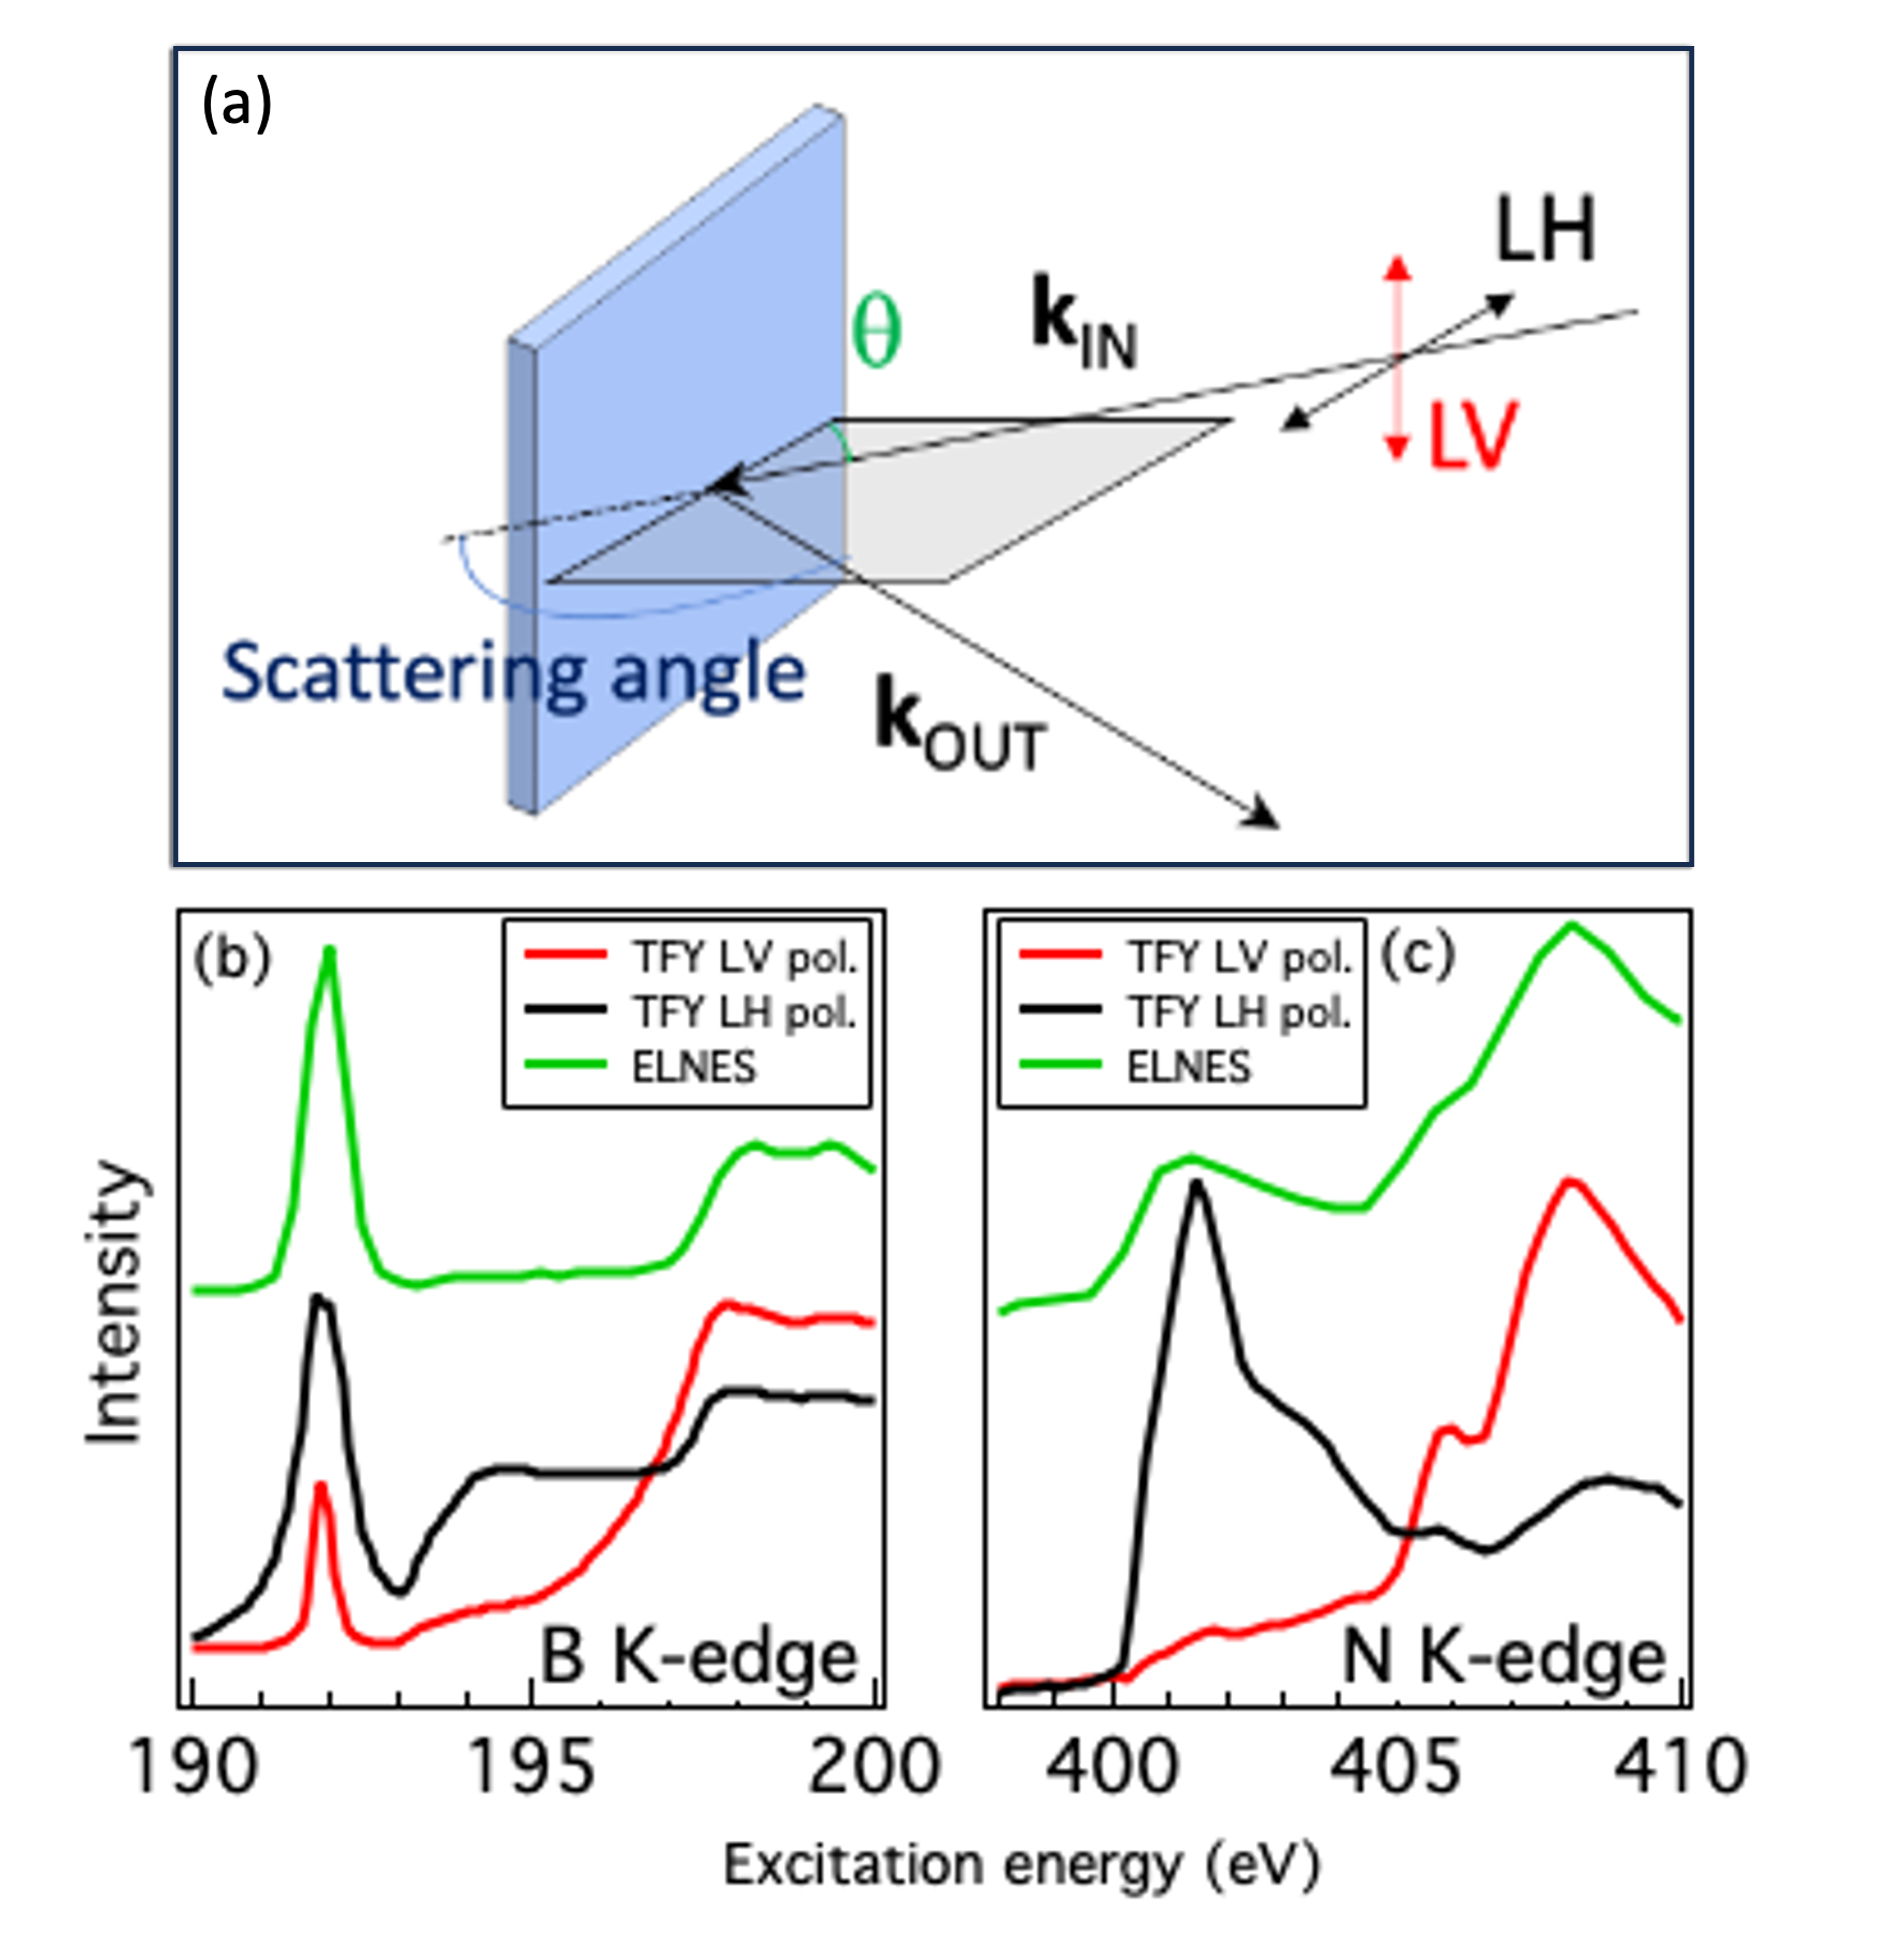
RIXS experiments were performed at the SEXTANTS beamline of the synchrotron SOLEIL Sacchi et al. (2013) employing the AERHA spectrometer Chiuzbăian et al. (2014) at a scattering angle of 85∘. High-quality colorless and transparent single crystals of -BN were produced by a high-pressure and high-temperature method using a barium-related solvent system as reported in Taniguchi and Watanabe (2007). Samples were cleaved in air by means of scotch tape under an optical microscope. They were introduced in the load lock a few minutes after cleaving. Two different single crystals were mounted with the K and K directions contained in the scattering plane for the measure of the exciton dispersion. The q resolution of RIXS measurements was better than 0.002 Å-1, while the overall energy resolution of RIXS spectra at B and N K edges was 80 and 110 meV full-width-at-half-maximum (FWHM) respectively. XAS spectra and RIXS maps were done at room temperature, while the exciton dispersion was studied at 23 K. The experimental geometry is presented in figure 1(a).
II.2 EELS measurements
The same type of high-quality -BN single crystals used for RIXS were employed for EELS experiments. Microscopy samples were prepared by chemical exfoliation in ethanol of macroscopic -BN crystals, later deposited onto a lacey carbon copper TEM grid to be analyzed. Monochromated low-loss EELS was performed on a modified Nion HERMES-S200 STEM microscope operated at 60 keV with the electron beam monochromated to an FWHM of 30 meV. Both a convergence and collecting semiangle of 5 mrad were used, resulting in a probe size of approximately 1 nm. This corresponds to an integrated momentum transfer of about 0.6 Å-1 which is about the half of the -BN first Brillouin zone. The sample was cooled at 100 K and carefully aligned with the [001] crystallographic axis oriented along the electron beam propagation direction. ELNES measurements were performed with a non-monochromated electron beam.
II.3 Theory
In the GWA with a statically screened Coulomb interaction , the BSE can be cast into an excitonic hamiltonianOnida et al. (2002); Bechstedt (2014); Martin et al. (2016):
| (1) |
where and describe the hole and electron independent propagation, respectively, whereas is the repulsive electron-hole exchange interaction due to the Coulomb interaction and is the attractive electron-hole direct interaction due to the screened Coulomb interaction. While the latter is responsible for the formation of bound excitons, takes into account local-field effects due to electronic inhomogeneitiesAdler (1962); Wiser (1963). Moreover, its long-range component is at the origin of plasmonsPines (1963).
RIXS spectra are described by the Kramers Heisenberg equationSchülke (2007); Kotani and Shin (2001); Rueff and Shukla (2010); Ament et al. (2011), which expresses the second-order perturbative contribution of the electron-photon interaction , i.e., the product between the vector potential of the electromagnetic field and the electron momentum . When the incident photon energy is tuned to the vicinity of an absorption edge, it reads:
| (2) |
where , and of energies , , and (and lifetime ), denote, respectively, the ground state, the final state, and an intermediate state of the system of N interacting electrons (located at positions ). Being the emitted photon energy that is measured in the experiment, the energy conservation implies that the energy loss is equal to the excitation energy of the electronic system.
Instead, NRIXS spectra, arising from the electron-photon perturbation at the first order, measure the dynamical structure factor, defined asSchülke (2007); Rueff and Shukla (2010):
| (3) |
where the momentum transfer . The dynamical structure factor is proportional to the loss functionSchülke (2007): , where
| (4) |
The loss function is also directly measured in EELS Fink et al. (2001); Egerton (2011):
| (5) |
Peaks in the loss function are at higher energies than peaks in the corresponding absorption spectrum , since the difference between the two quantities is due to the repulsive long-range component of the Coulomb interactionOnida et al. (2002); Sottile et al. (2005). In particular, in the loss function collective excitations such as plasmons correspond to zeroes of where is not too large.
For core levels, absorption, EELS and NRIXS take different namesHuotari (2012), being called: X-ray absorption spectroscopy (XAS), energy loss near edge structure (ELNES), and X-ray Raman scattering (XRS), respectively. When the photon energy is near an absorption threshold, XAS is also known as X-ray absorption near edge structure (XANES) or near edge X-ray absorption fine structure (NEXAFS). In this regime, where the electronic excitations are localised around the atomic sites and the long-range component of becomes negligible, : the weaker spectrum measured by XAS becomes equal to the loss function measured by ELNES and XRS in the limit.
II.4 Computational details
In the present work, BSE calculations followed the computational scheme already successfully employed in previous worksFugallo et al. (2015); Koskelo et al. (2017) on -BN. We have used Troullier-Martins norm-conserving pseudopotentialsTroullier and Martins (1991). Ground-state calculations in the local density approximation, adopting the experimental crystal structureSolozhenko et al. (1995), converged with 30 Hartree cutoff energy. The calculation of the screened Coulomb interaction included 300 bands. We have used a scissor correction of 2.35 eV and a valence band stretching of 5% to mimic the difference between LDA and GW band structuresArtús et al. (2021). BSE calculations included 8 occupied and 12 empty bands in a 24246 grid of points (amounting to 3456 inequivalent points in the Brillouin zone) and with a cutoff of 8.3 Hartree for the e-h interactions. Confirming the conclusions of Ref. Olevano and Reining, 2001, we have found that the inclusion of the contribution from antiresonant transitions is necessary to obtain an accurate loss function, while the coupling between resonant and antiresonant transition has negligible effects. We have used Abinit Gonze et al. (2016) for the ground-state calculations and Exc EXC for the BSE simulations of loss spectra.
III Results and analysis
III.1 XAS and ELNES spectra
Fig. 1(b) shows the ELNES and XAS spectra at the B K edge measured from total fluorescece yield (TFY) in both linear vertical (LV) and linear horizontal (LH) polarizations. They are consistent with available XAS, XRS, and ELNES results Brown et al. (1976); Davies et al. (1981); Chaiken et al. (1993); Jiménez et al. (1996); Franke et al. (1997); Carlisle et al. (1999a); MacNaughton et al. (2005); Hua Li et al. (2012); Watanabe et al. (1996); Feng et al. (2008); Leapman and Silcox (1979); Arenal et al. (2007); Fossard et al. (2017). XAS spectra have a strong polarization dependence, which is related to the crystal anisotropy of -BN. The LV polarization selects orbitals lying within the BN layers. Since the incident angle is 30∘ grazing, i.e, 60∘ with respect to the axis, the LH polarization instead selects orbitals oriented both within the BN layers and perpendicular to it. The sharp exciton peakCarlisle et al. (1999a); Feng et al. (2008); Karsai et al. (2018) at 192 eV, which is more intense for LH polarization, indeed corresponds to a transition into states that have distinct character (i.e., orthogonal to the BN layers), whereas spectral features above 198 eV are excitations into states. The fact that the peak at 192 eV is not completely suppressed in LV polarization is likely due to the fact that the surface of the sample is not completely flat and/or slightly tilted so that its normal is not exactly lying in the scattering plane. In any case, the absence of additional structures in the spectra and the strong dip after the peak are an indication of the very good quality of the sampleCaretti and Jiménez (2011); Niibe et al. (2010); McDougall et al. (2017).
The N K edge ELNES and XAS spectra, which also agree with results from literature Chaiken et al. (1993); Franke et al. (1997); MacNaughton et al. (2005); Miyata et al. (2002); Vinson et al. (2017); Watanabe et al. (1996); Arenal et al. (2007), are displayed in Fig. 1(c). As for the B K edge, also the XAS spectra remain strongly polarization dependent. Their interpretation is analogous to the B K edge. The first prominent peak at 401 eV, which is visible mainly for LH polarization, is due to an excitation into states. Excitations into states are responsible for the peaks at energies above 408 eV.
As expected (see the end of Sec. II.3), at both edges ELNES and XAS results are characterised by the same spectral features. The remarkable agreement between the spectra obtained with the two techniques in Fig. 1 additionally demonstrates that the energy calibration in the two measurements is fully consistent. The access to anisotropy effects is more difficult with ELNES than with XAS. In fact, the field responsible for electronic excitations is parallel to the direction of momentum transfer and, therefore, at zero scattering angle, parallel to the direction of electron propagation. Therefore, ELNES spectra obtained for electron-beam incidence parallel or orthogonal to the -BN planes could be in principle compared with equivalent XAS measurements performed in vertical or horizontal polarisation, respectively. However, EELS is generally performed with focused electron probes and it integrates a finite-momentum range resulting in contributions for both in-plane and out-of-plane excitations.
III.2 Resonant inelastic x-ray scattering spectra
In an ionic solid like -BN, valence and conduction states are localised mainly on different atomic sites. As a result, in XAS spectra, in which the conduction level is filled by the excited core electron, core excitons are generally more strongly bound at cation sites than at anion sites Pantelides (1975). The RIXS process instead involves both conduction states (in the photon absorption) and valence states (in the photon emission). Therefore, the question that naturally arises is whether it is more convenient to measure the RIXS spectra at the B or N K edge in order to characterise the main neutral electronic excitations in -BN.
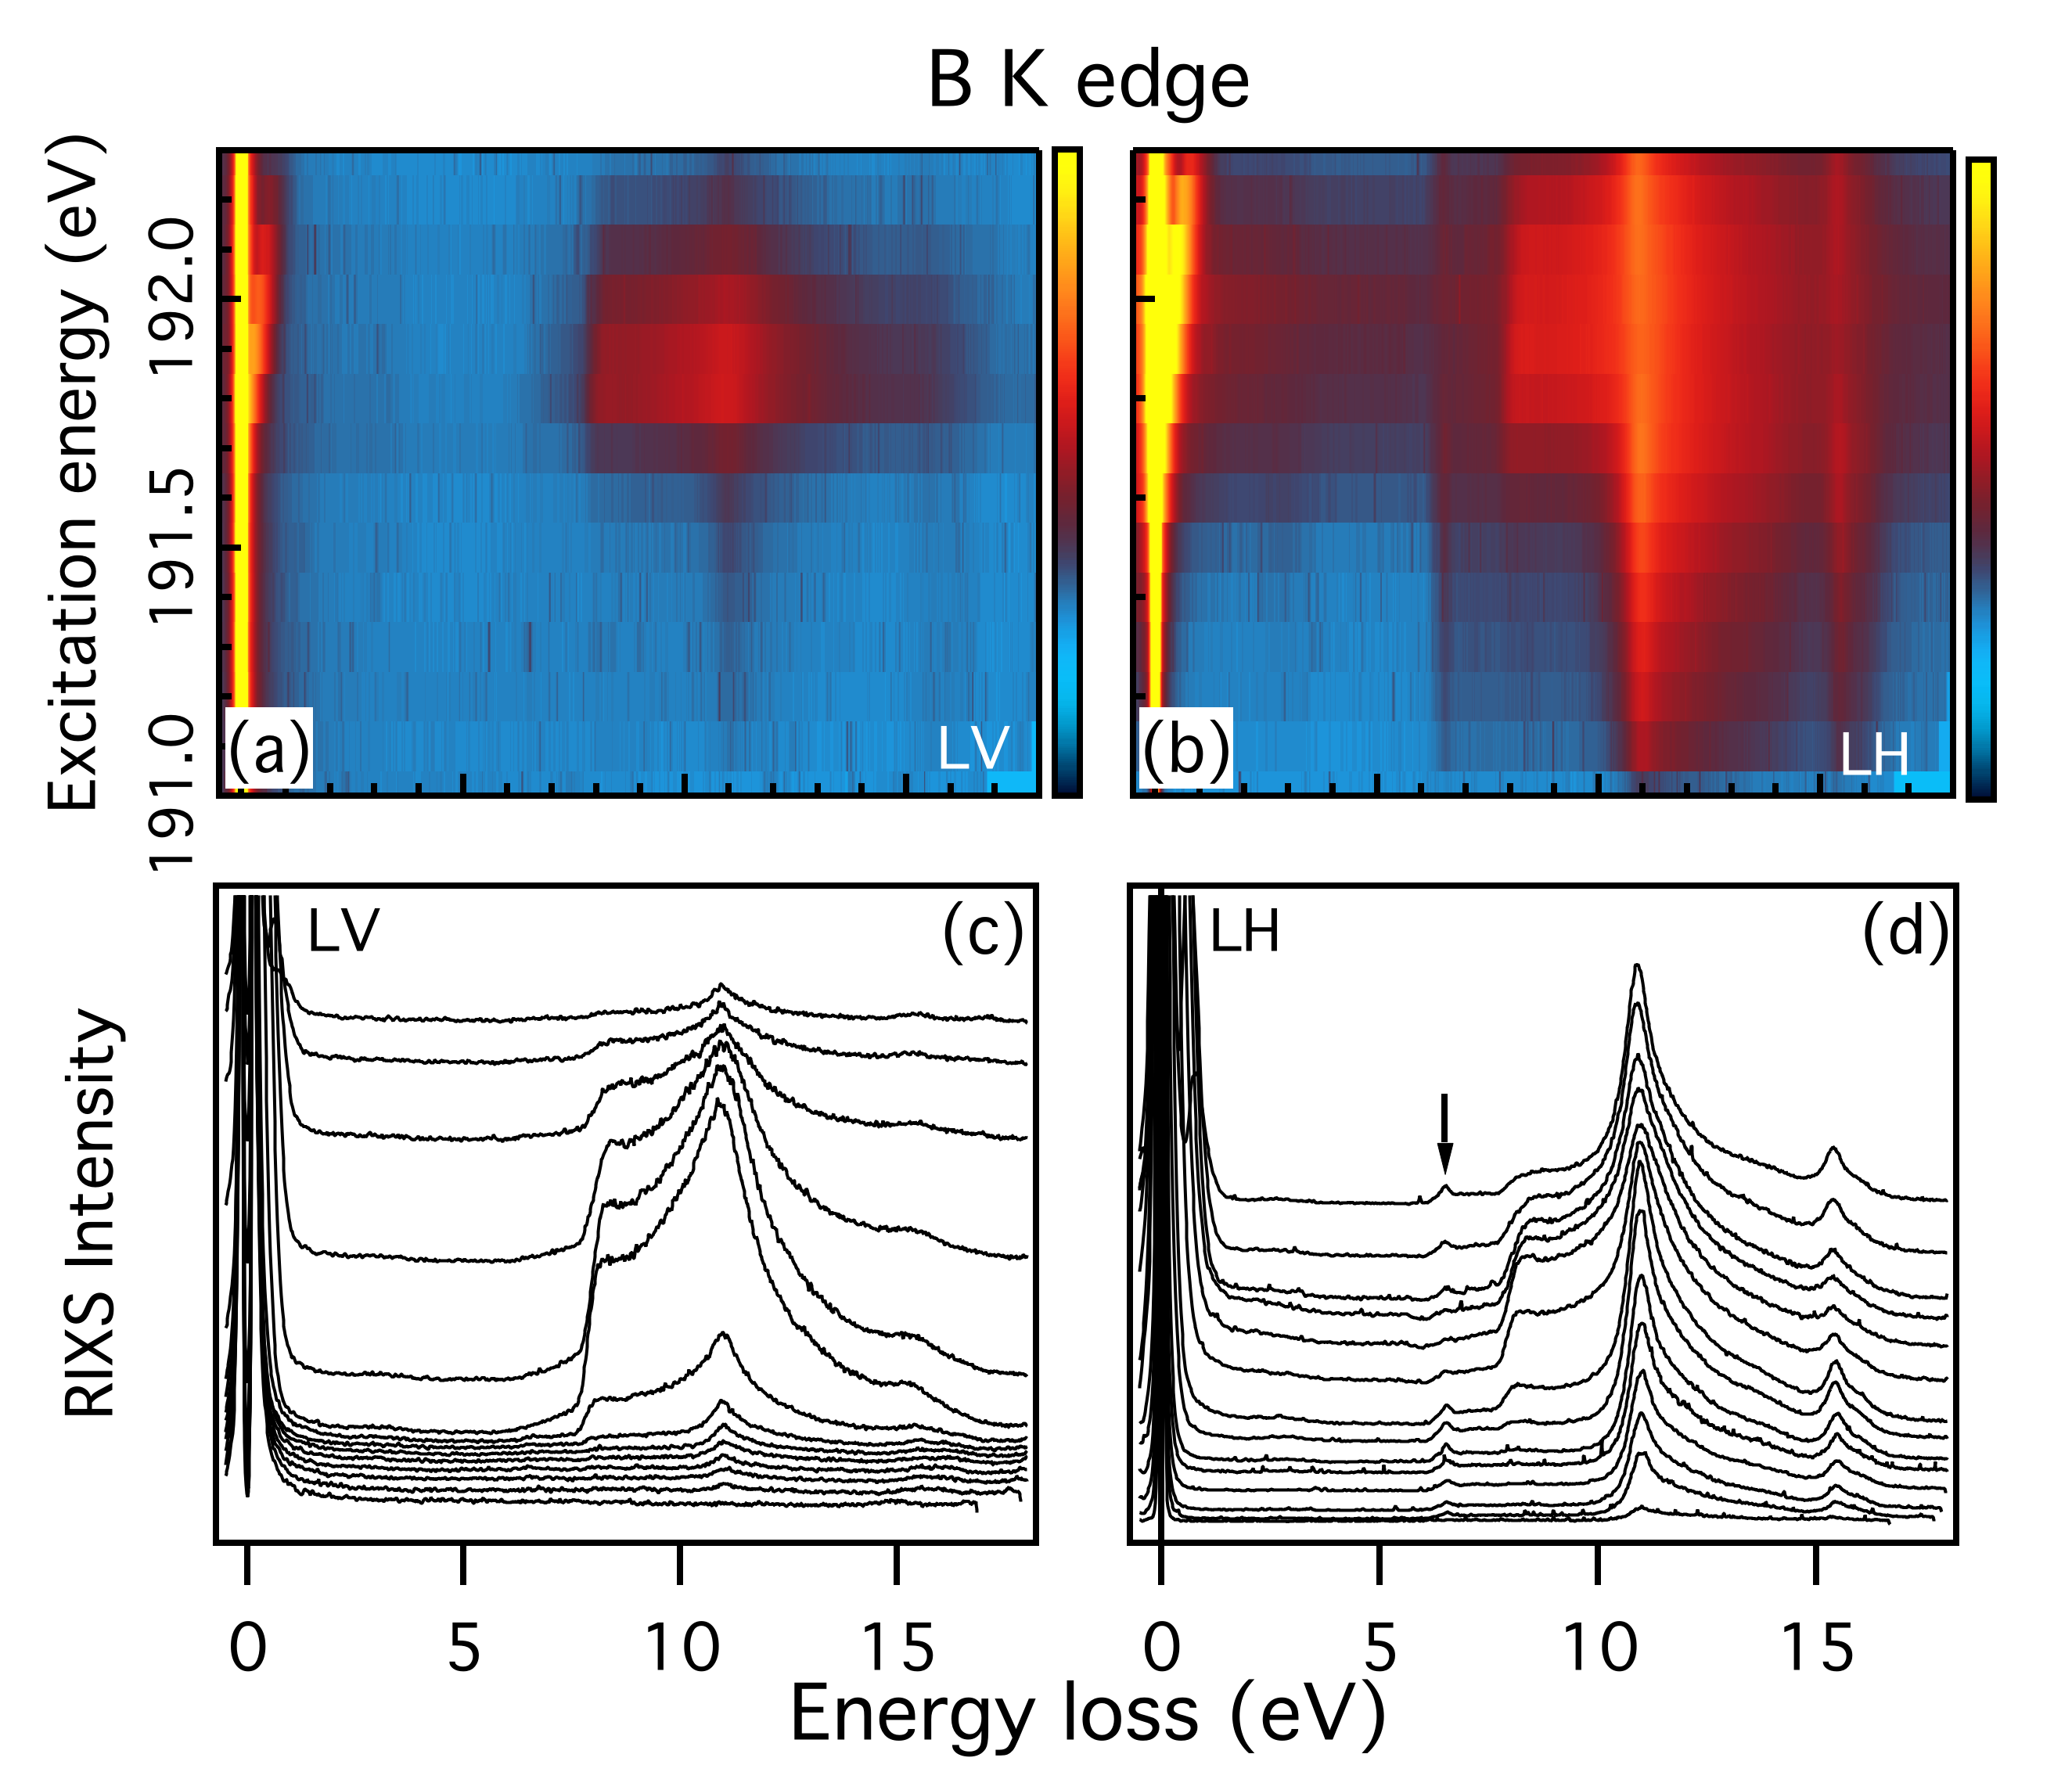
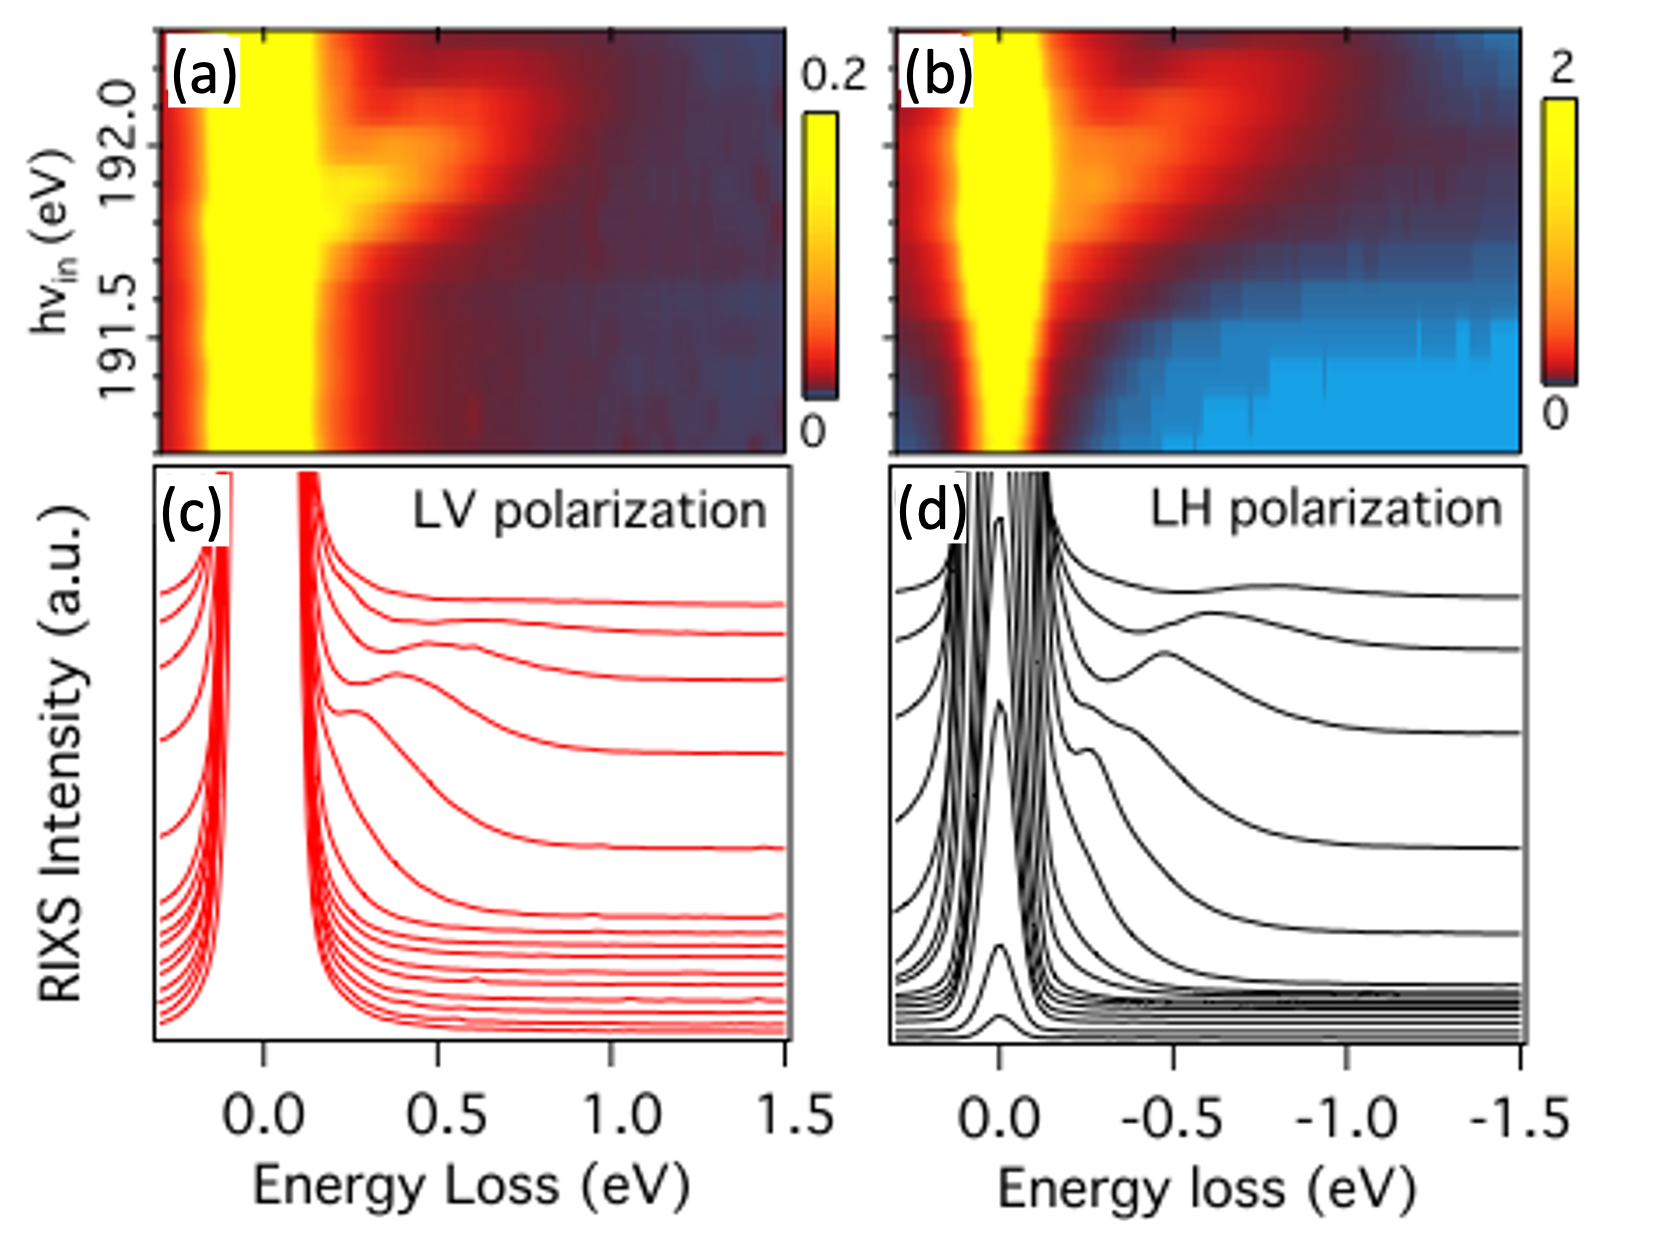
The top panels (a) and (b) of Fig. 2 display the RIXS maps acquired at B K edge in both LV and LH polarizations. The maps are represented as a function of the excitation energy (vertical axis) and energy loss (horizontal axis). The corresponding individual spectra are shown in Fig. 2 (c) and (d). The chosen excitation energies , between 191 eV and 192.3 eV, scan across the first exciton peak in XAS [see Fig. 1(a)]. We note that this resonance is very strong: the elastic line (at 0 eV energy loss) increases by a factor 200 between an incident photon energy of 191 eV and the excitation at 192 eV.
In RIXS the spectral features that are located at the same energy loss independently of the excitation energy are called Raman losses and correspond to neutral excitations of the system. In both polarizations, the spectra show three main Raman features: a sharp step at 8 eV, a main peak at 11.5 eV and a second peak at 16 eV. These high-energy excitations have been interpreted as different - and - interband transitions Jia et al. (1996); Carlisle et al. (1999a); MacNaughton et al. (2005); Fugallo et al. (2015).
Most importantly, in LH polarization here we discover (see black arrow) an additional Raman excitation peaking at 6.4 eV energy loss that was missed in the previous RIXS studies on -BN (probably, for the lower quality of the samples, crushed powders in Refs. Jia et al. (1996); Carlisle et al. (1999a), the lower resolution, 0.5 eV in Refs.Jia et al. (1996); Carlisle et al. (1999a) and 0.3 eV in Ref. MacNaughton et al. (2005), or the very long tail of the elastic peak in Ref.MacNaughton et al. (2005)). In the following subsection we will analyse this low energy excitation in more detail.
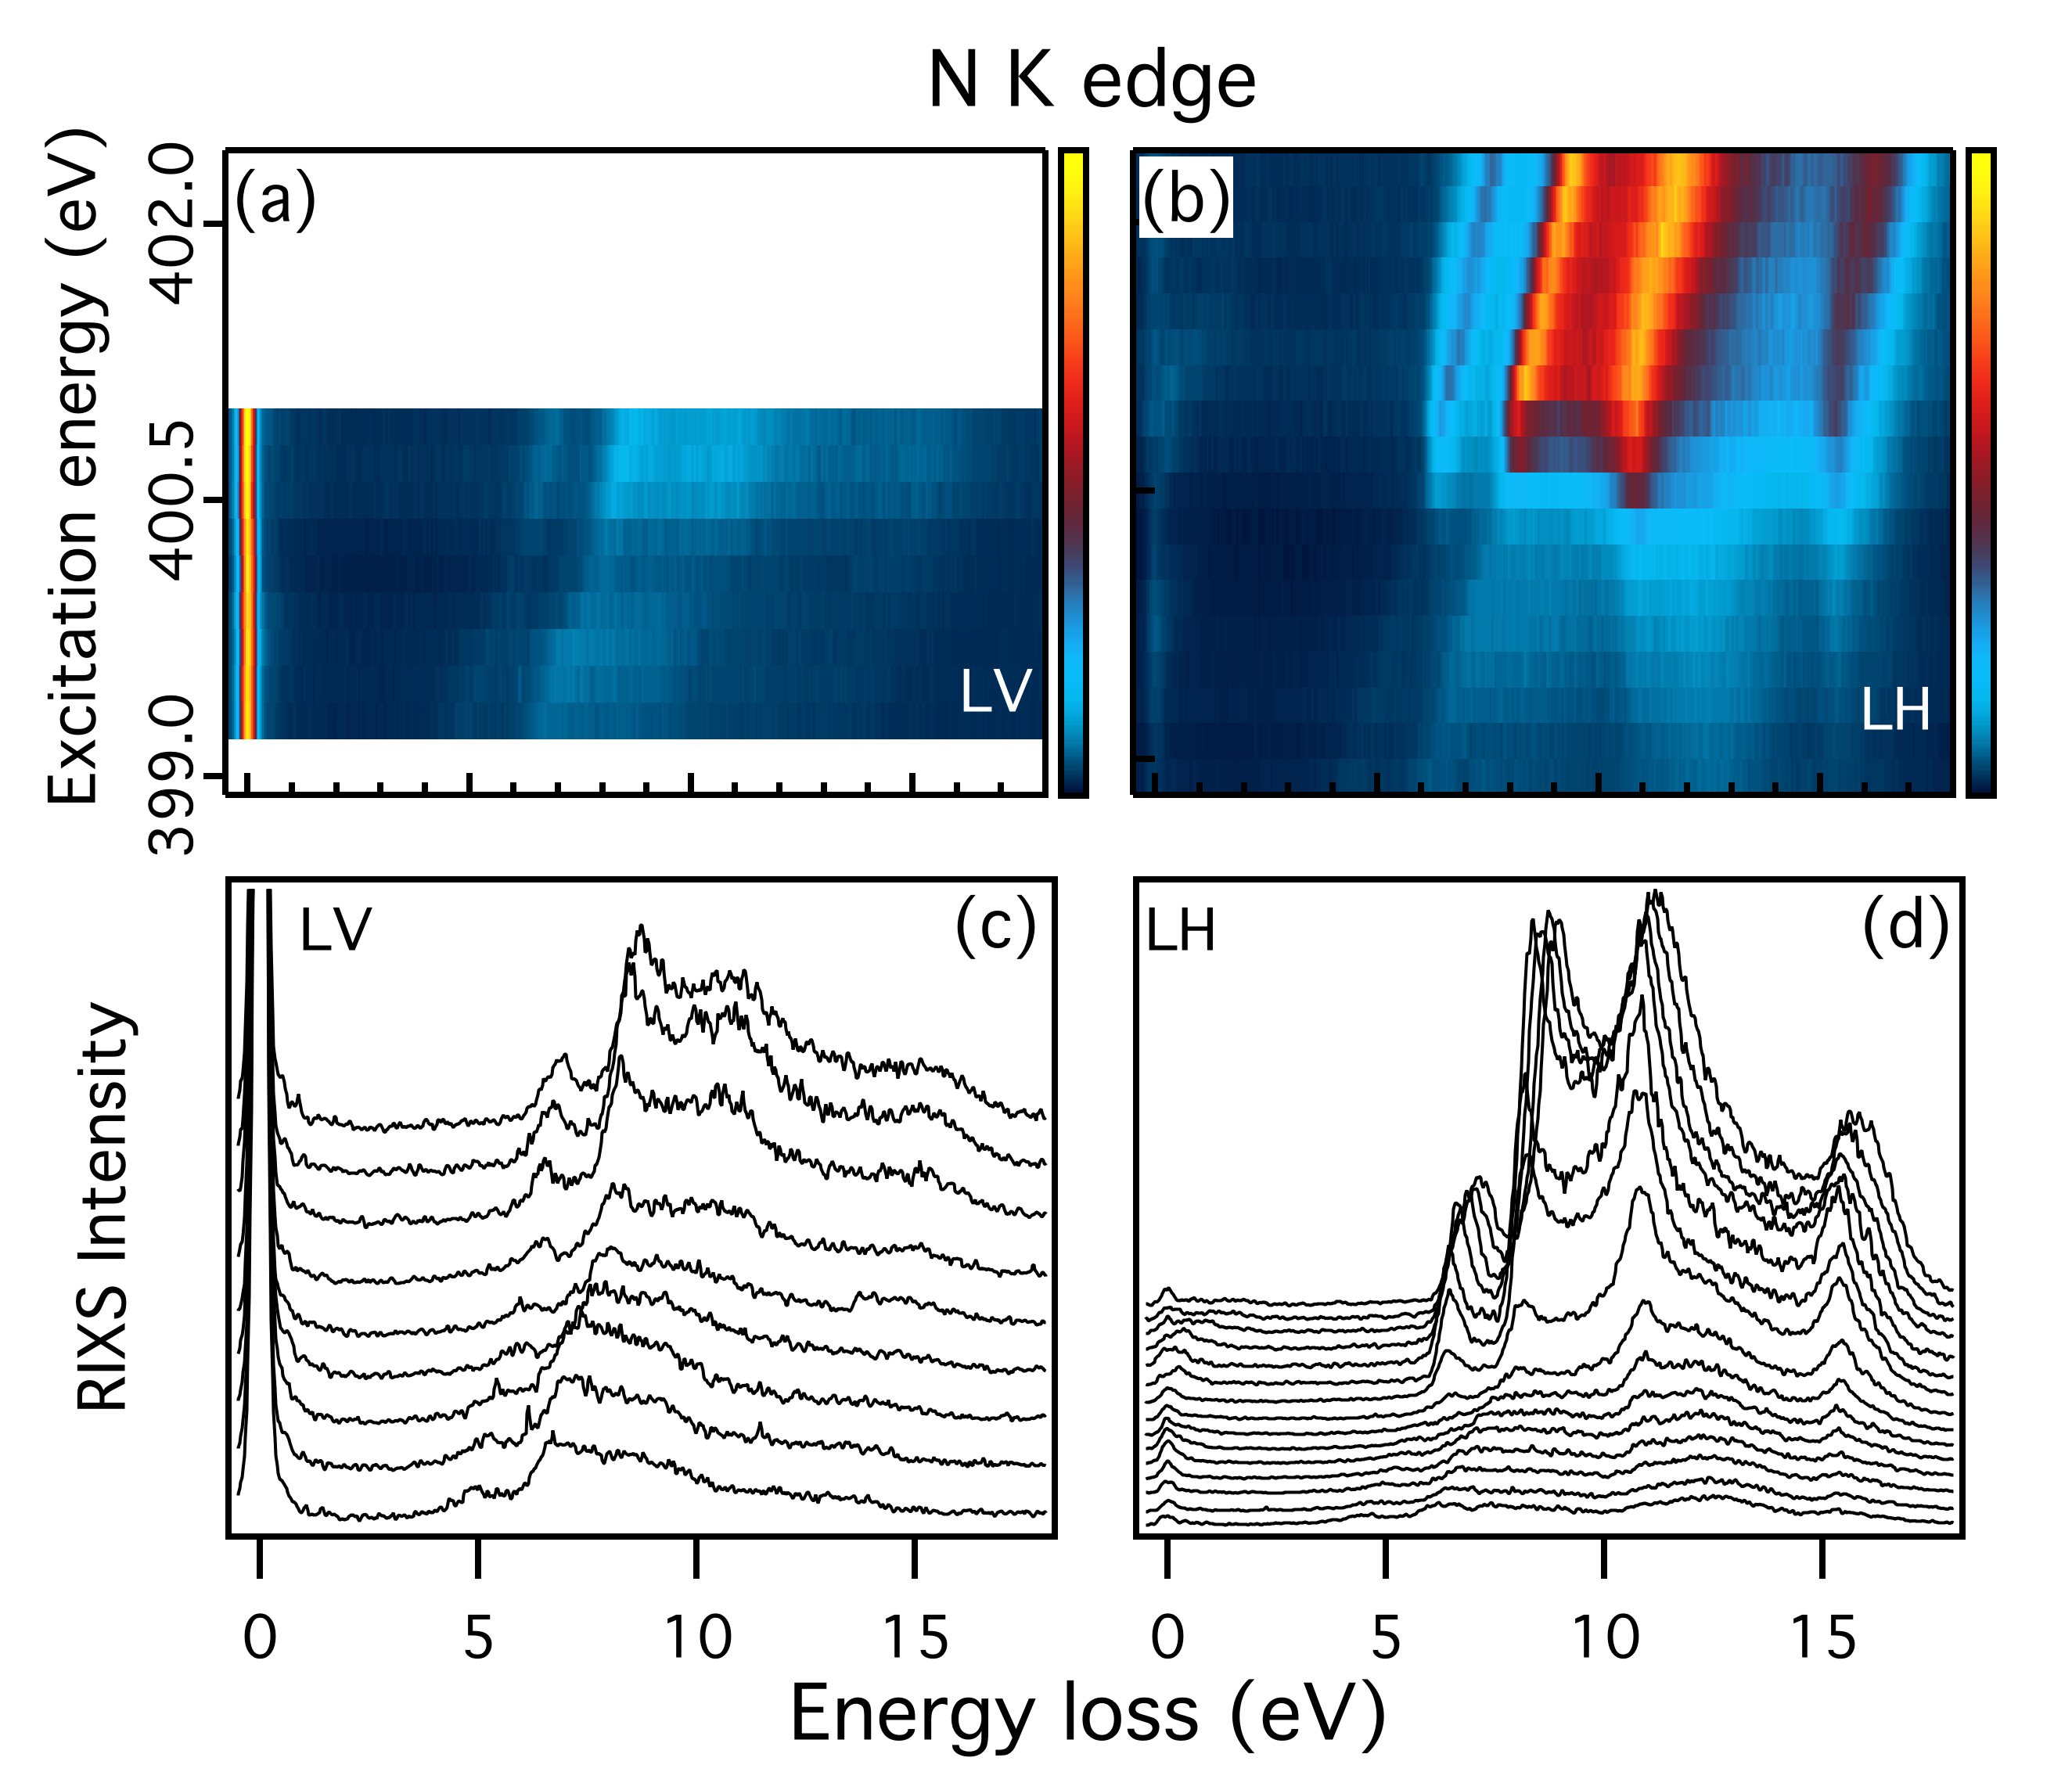
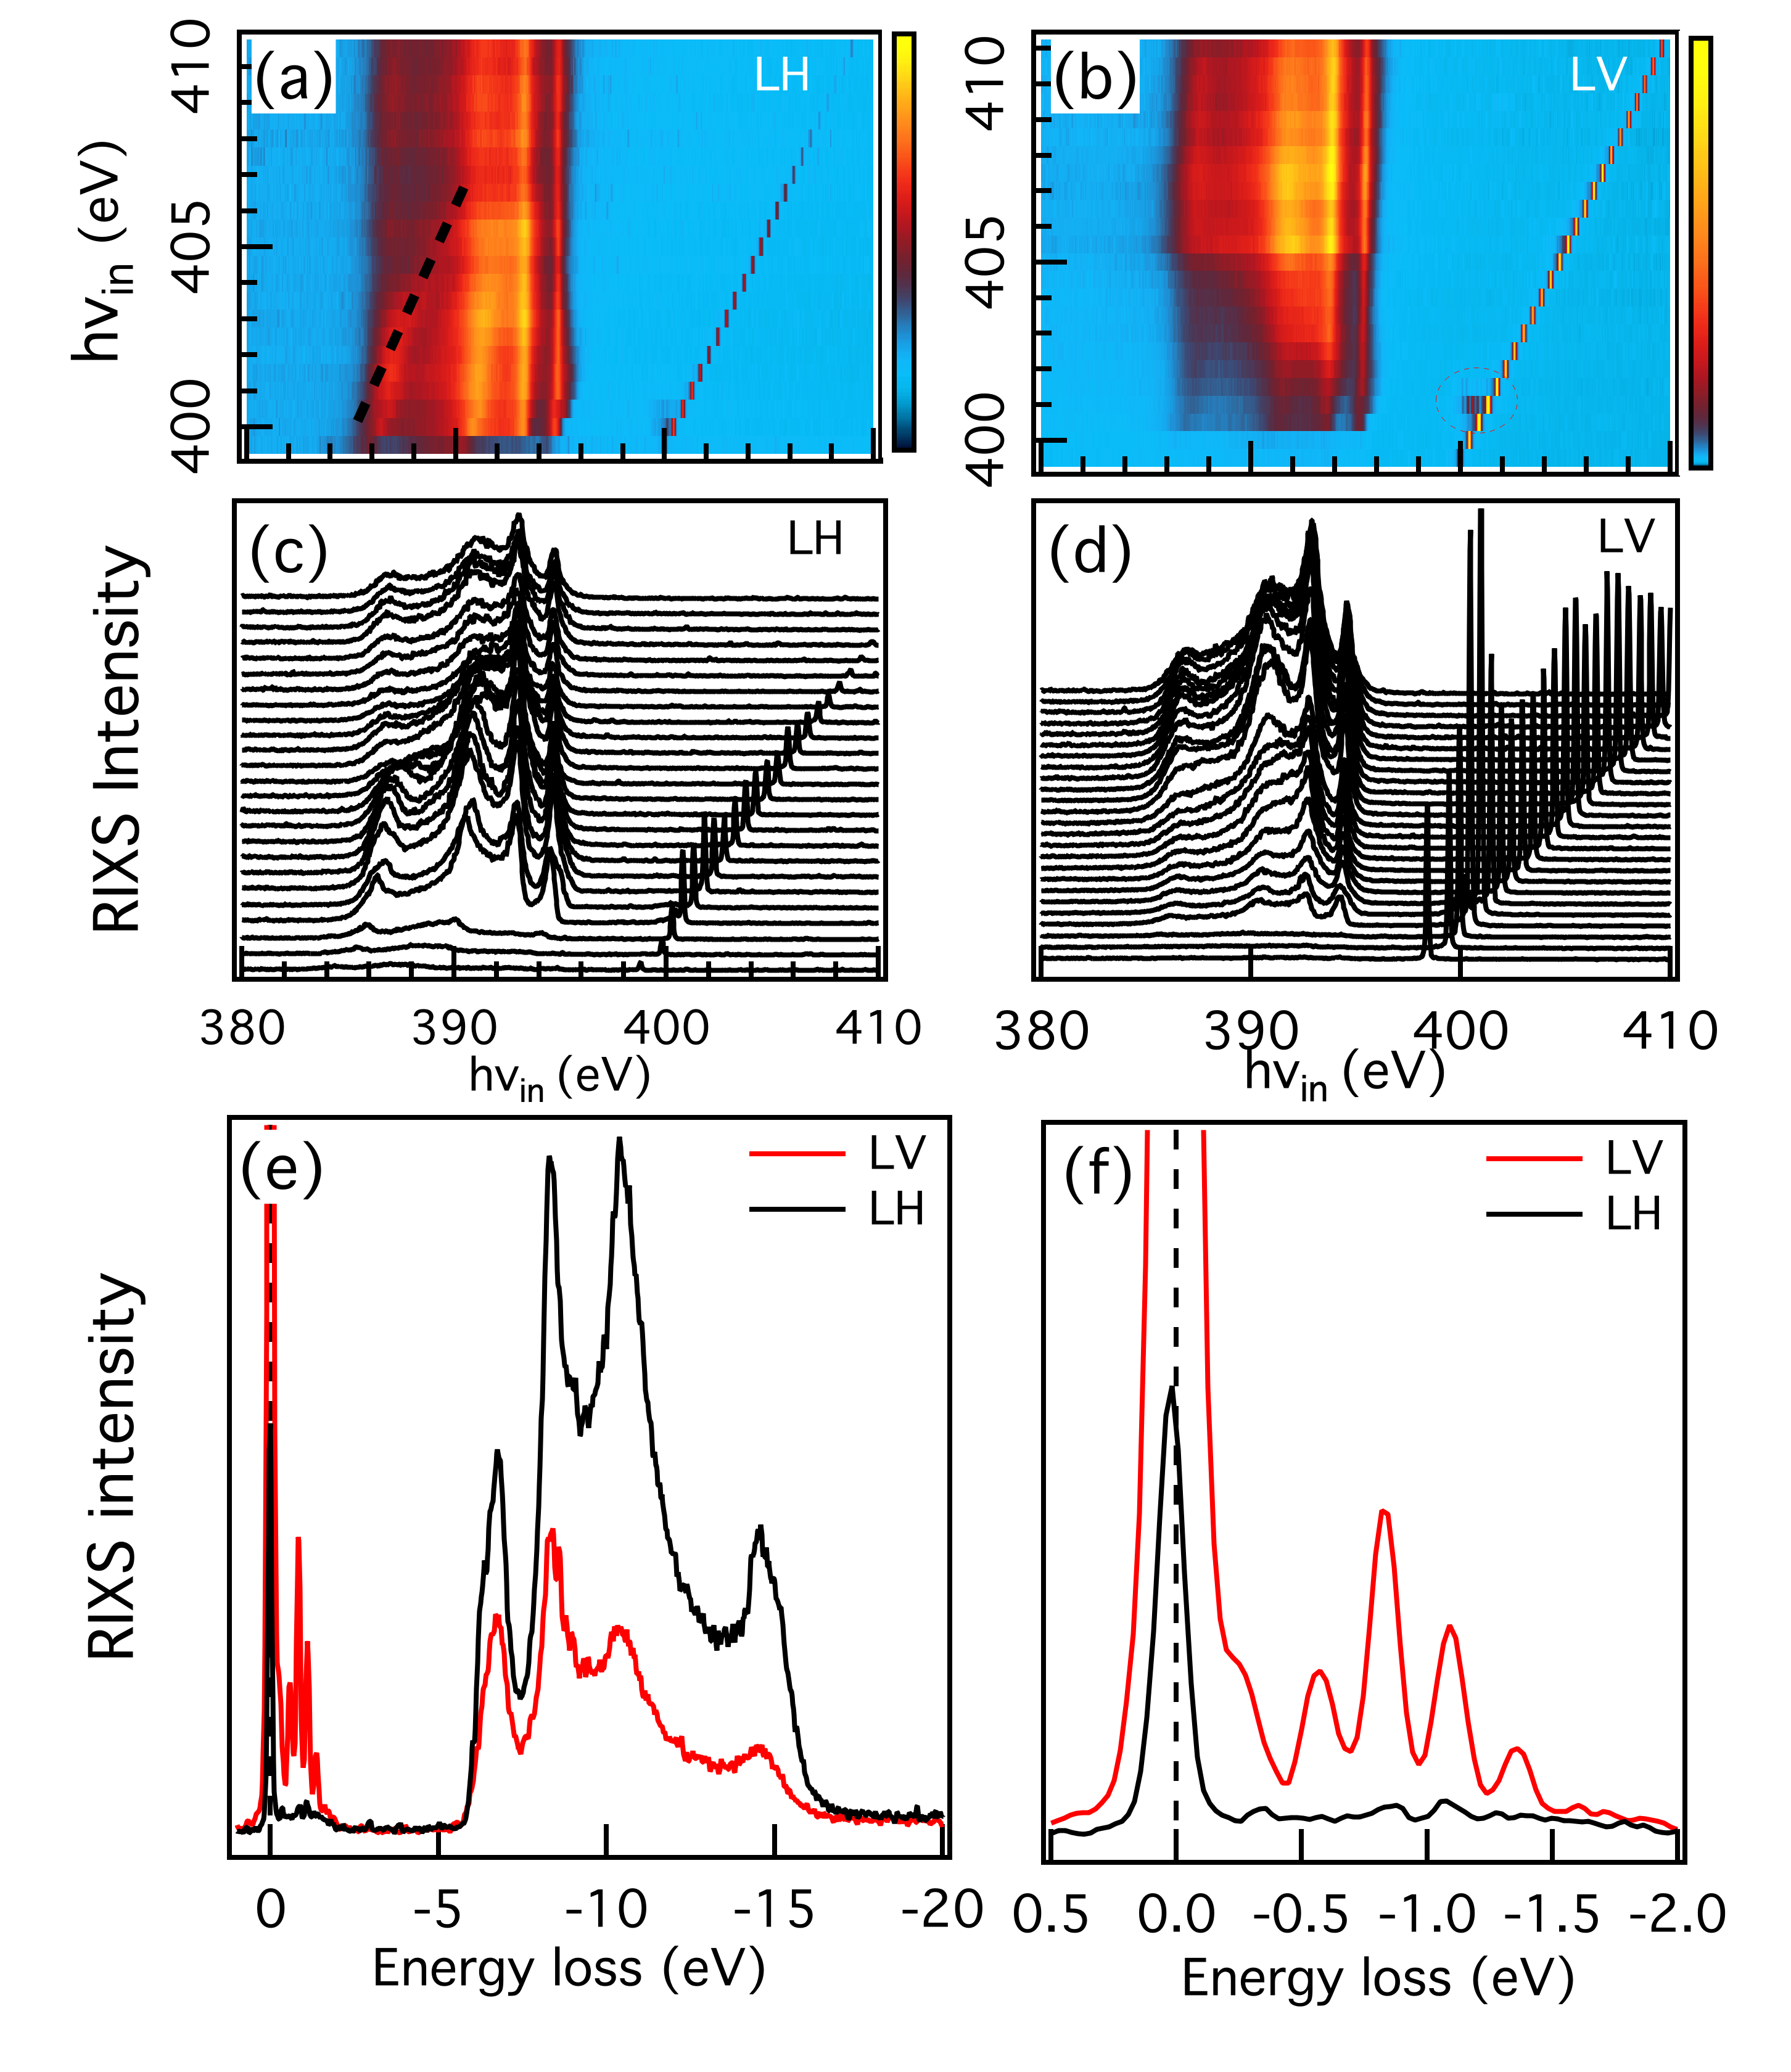
Fig. 3 shows the RIXS maps [panels (a)-(b)] together with the individual spectra [panels (c)-(d)] measured across the N K edge in both polarizations. In this case we observe a qualitatively different behaviour with respect to the B K edge RIXS spectra in Fig. 2. In the spectra at the N edge all the energies of the main peaks have a linear dependence on the excitation energy. This implies that they are not Raman losses, but fluorescence features. As in the normal N K edge emission, they can be interpreted in terms of the valence density of states, projected on the N atomic sites and bearing a angular componentMacNaughton et al. (2005); Vinson et al. (2017). The dominant contribution of N states is in the upper region of the valence band, in a range spanning 10 eV (whereas N are mainly located at the bottom of the valence band). Remarkably, the lowest-energy Raman loss at 6.4 eV found at the B edge in LH polarization is not clearly visible at the N edge, where the lowest-energy peak in both polarizations does not show a pure Raman behavior. The most plausible explanationUrquiza et al. (2024) for the absence of this Raman feature is that the lowest conduction states in -BN have mainly B character and therefore cannot be reached exciting an electron at the N K edge. Therefore, the important first answer that we obtain from this survey of the RIXS results is that in the ionic -BN compound the determination of lowest neutral excitations is more favorable at the cation B K edge than at the anion N K edge.
In the next subsection, we will relate the RIXS results at the B K edge with the spectra obtained by EELS and ellipsometry, and with ab initio BSE calculations.
III.3 Connection with EELS and optical absorption
We may expect that RIXS, on one side, and EELS (and NRIXS), on the other side, being very different spectroscopies, give rise to completely different spectra of neutral excitations in materials. Since the matrix elements [i.e., the squared moduli multiplying the delta functions in Eqs. (2)-(3)] are not the same, the two spectral shapes can be very different. A notable example are - transitions within the gap of transition metal compounds that are routinely measured by RIXS at small , whereas they have negligible spectral weight in EELS at the same momentum transfer, since they are forbidden in the dipole limit and become visible in the loss function only at large momentum transfersLarson et al. (2007); Hiraoka et al. (2009); Gloter et al. (2009); Ghiringhelli et al. (2005); Chiuzbăian et al. (2008); Huotari et al. (2008). However, a careful analysis of Eqs. (2)-(4) suggests that RIXS and EELS can still measure the same electronic excitations: they share the same delta functions expressing energy conservation in Eqs. (2)-(3). Therefore, if RIXS and EELS spectra have peaks at the same energy, we can, in principle, use either technique to interpret the other222Extracting the dynamical structure factor directly from RIXS spectra instead requires additional hypothesesvan den Brink and van Veenendaal (2006); Ament et al. (2011)..
A possible origin of further discrepancy in practice between measured RIXS and EELS spectra is their respective momentum resolutions (see Secs. II.1-II.2). In EELS the momentum integration is much larger than in the soft X-ray RIXS measurements, even though the EELS cross section (5) favors the small components. Even taking into account these precautions, it remains sensible to directly compare EELS and RIXS spectra.
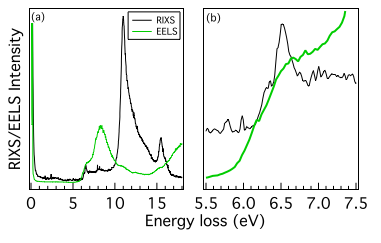
Therefore, in order to establish how we can benefit in practice from a fruitful combination of EELS and RIXS spectroscopies, we have also measured the EELS loss function of -BN on the same type of samples used in RIXS experiments. The measured EELS spectrum is in agreement with previous -BN resultsFossard et al. (2017); Schuster et al. (2018) at small Å-1. Fig. 4 compares the B K edge RIXS spectrum at 191.4 eV excitation energy in LH polarization with the EELS spectrum. The right panel (b) of Fig. 4 shows a closeup of the same spectra in the energy range corresponding to the spectral onset. Also taking into account that the momentum transfer in RIXS is much smaller than the EELS angular integration, we find that both RIXS and EELS spectra in Fig. 4 display the same features at 8 eV and 6.4 eV, with a less intense shoulder at 6.2 eV in RIXS and at 6.17 eV in EELS. The main peak at 11.5 eV in the RIXS spectrum becomes in the EELS spectrum a high-energy shoulder of the 8 eV main peak. From previous EELS and NRIXS investigationsMamy, R. et al. (1981); Tarrio and Schnatterly (1989); Fossard et al. (2017); Galambosi et al. (2011); Fugallo et al. (2015), we know that the 8 eV peak is the plasmon of -BN. This very good matching between EELS and RIXS proves the capability of RIXS to investigate also collective charge excitations that are delocalised as the plasmon of -BN. Instead, the origin of the common excitation peaking at 6.4 eV remains to be elucidated.
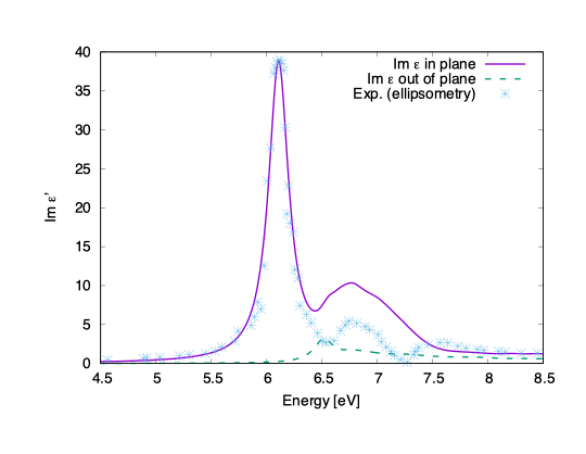
To interpret RIXS results, RIXS spectra are often directly compared to optical absorption spectra (see e.g. Ishii et al. (2004); Kim et al. (2004); Grenier et al. (2005); Braicovich et al. (2007); Benckiser et al. (2013); Bachar et al. (2022); Vorwerk et al. (2020)). In the upper panel of Fig. 5 we report the experimental absorption spectrum (light blue crosses), , for in-plane polarization , from a recent accurate ellipsometry experimentArtús et al. (2021). The main exciton peak at the absorption onset is located at 6.12 eV, i.e., at a lower energy than the lowest energy features in the EELS and RIXS spectra in Fig. 4. This mismatch evidences how the excitations measured by RIXS are actually not the same as those probed by optical absorption.
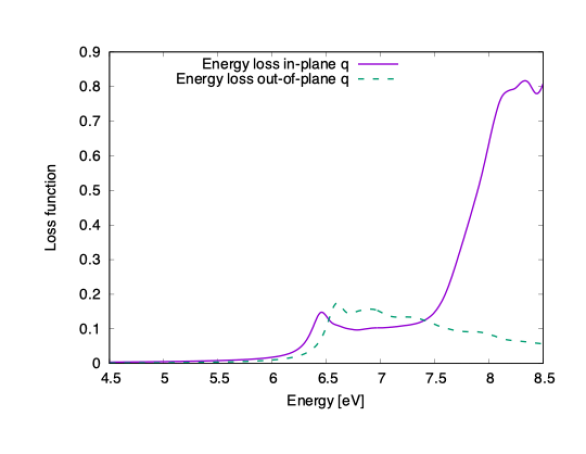
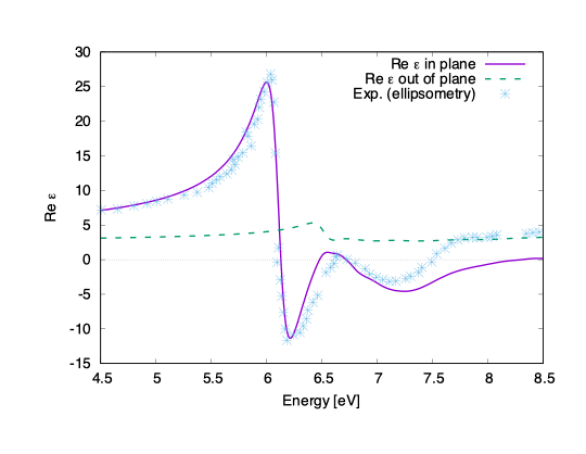
In the upper panel of Fig. 5, the experimental absorption is also compared to the theoretical spectrum calculated from the solution of the BSE for both in-plane (solid line) and out-of-plane (dashed line). In this energy range, the out-of-plane spectrum has a much lower intensity, since - transitions are dipole forbidden in the out-of-plane polarization. As in previous studiesArnaud et al. (2006); Artús et al. (2021), the agreement between theory and experiment for the optical absorption spectra is very good: the BSE is certainly reliable for the description of excitons in -BN. Using the same formalism, we have also calculated the loss function , see the middle panel of Fig. 5. Contrary to the absorption spectra in the upper panel of Fig. 5, the loss functions in the two directions have similar intensities at their respective onsets.
The simulated spectra compare very well with the experimental EELS spectrum in Fig. 4, also considering the fact that while the calculation is done at , the experimental spectrum is a result of an integration over a finite solid angle around . Most importantly, we find that, as in the EELS spectrum, in the calculated loss function for the in-plane the main plasmon peak at 8 eV is preceded by a smaller feature peaking at 6.45 eV. This first peak in the loss function is located where also (see the bottom panel of Fig. 5), it is therefore by definition a longitudinal collective excitationBechstedt (2014).
However, contrary to the 8 eV peak, it is not a plasmonKoskelo et al. (2017); Wirtz et al. (2005): its physical origin is not the repulsive electron-hole exchange in Eq. (1) but the attractive electron-hole interaction . It is therefore a bound longitudinal excitonAgranovich and Ginzburg (1984). Indeed, it is located well inside the direct band gap of -BN (6.95 eV in the GW calculationArtús et al. (2021)), while its energy is larger than the one of the transverse exciton measured by optical absorption (see the top panel of Fig. 5). The energy difference between the two is called longitudinal-transverse splitting, and is due to the long-range component of the Coulomb interaction Agranovich and Ginzburg (1984); Galamić-Mulaomerović and Patterson (2005); Bechstedt (2014). On the basis of the solution of the BSE we evaluate the longitudinal-transverse splitting to be 350 meV. This value is smaller than the estimation of 420 meV in Ref. Elias et al., 2021 that has been obtained from a fit of the experimental optical spectra. The BSE longitudinal-transverse splitting in -BN turns out to have a value similar to the analogous BSE calculationsGalamić-Mulaomerović and Patterson (2005) in Ne and Ar (300 meV and 360 meV, respectively333We note that both BSE results in Ref. Galamić-Mulaomerović and Patterson, 2005 overestimated the corresponding experimental values.).
In summary, the direct comparison between RIXS and EELS spectra has shown that they have features in common, whereas excitations measured by RIXS and optical absorption are generally not the same. Besides the plasmon at 8 eV, our analysis has demonstrated that the lowest electronic excitation that both RIXS and EELS find in -BN is a longitudinal exciton due to the same electron-hole pairs.
It is worth noticing that these states are optically excited using in-plane polarization, whereas in RIXS, they are excited using LH polarization, which is orthogonal to the planes. This can be attributed to the fact that absorption at the K edge involving transitions to orbitals, can be achieved through out-of-plane polarization, as discussed in Sec. III.1. In the next subsection, we investigate in detail the dispersion of this exciton as a function of the wavevector .
III.4 Exciton dispersion
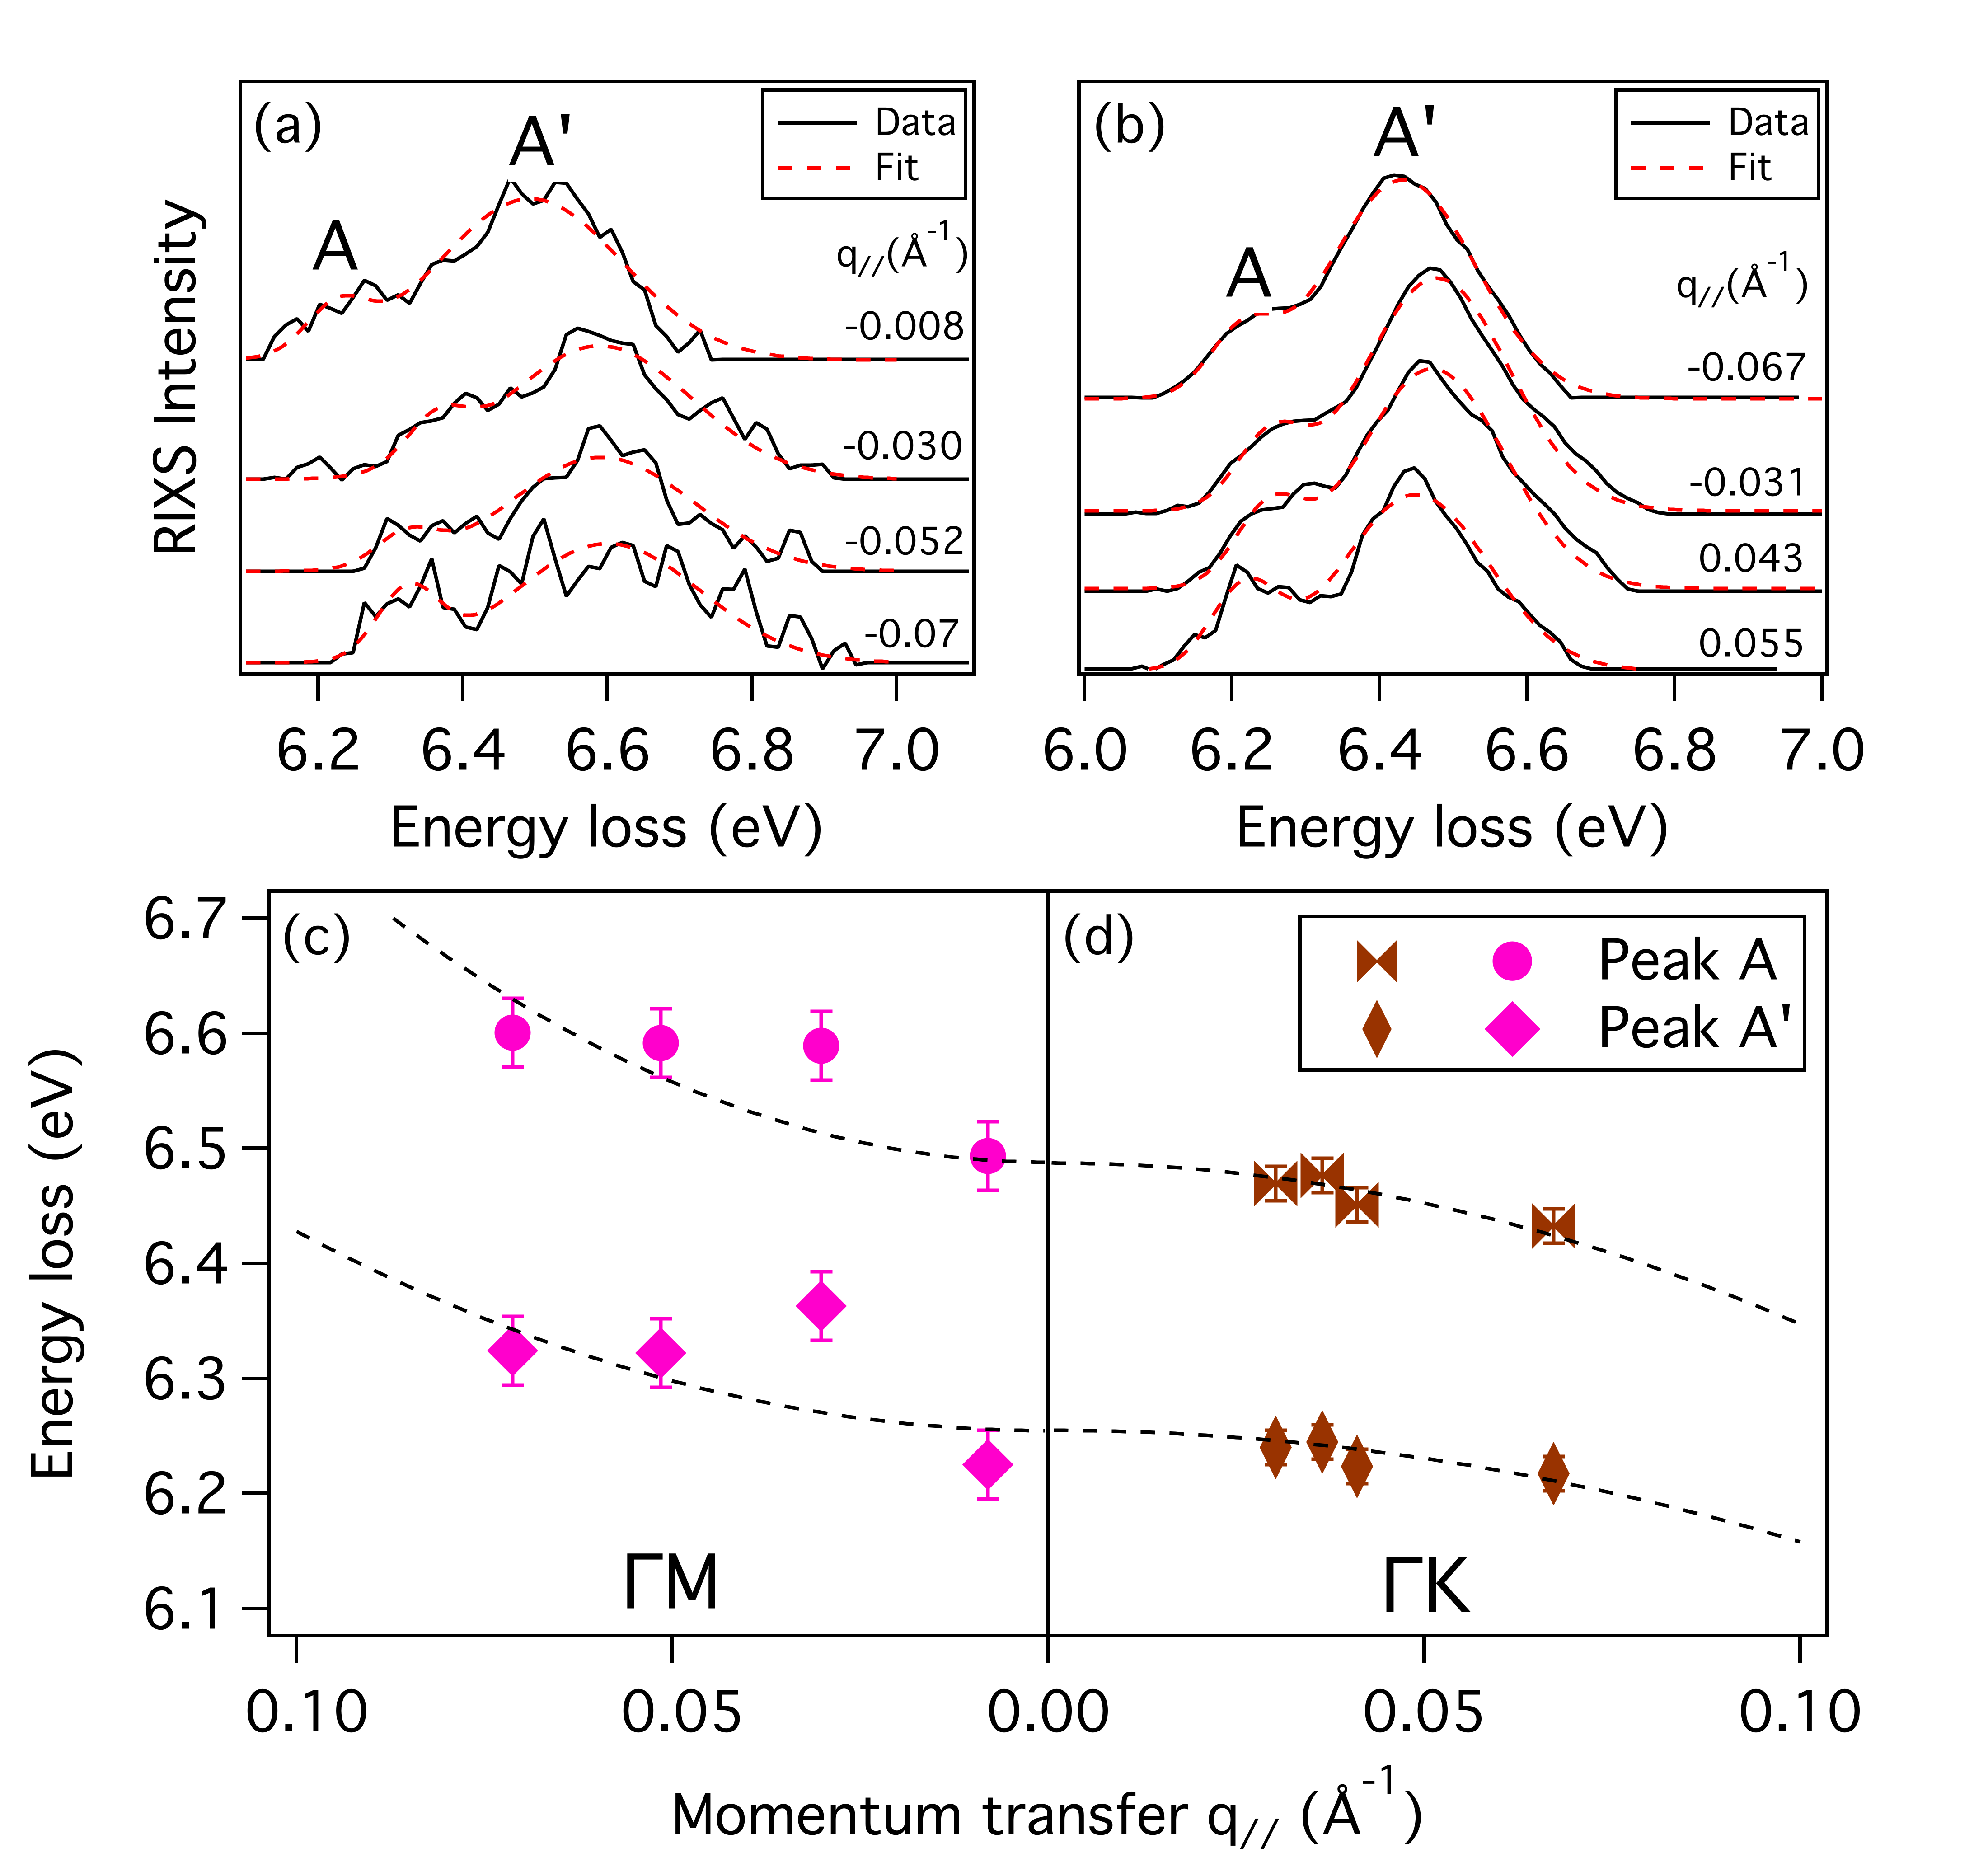
To measure the exciton dispersion, we have carried out RIXS measurements as a function of the incident angle, using LH polarization with an excitation energy eV. This corresponds to an experimental configuration where the exciton is clearly visible. The in-plane momentum transfer changes between and Å-1 along the M direction of the Brillouin zone and between and Å-1 along K (see Tab. 1). The out-of-plane component varies concomitantly between 0.11 and 0.13 Å-1, but its effect on the exciton dispersion can be considered negligible due to the layered nature of -BNGalambosi et al. (2011); Fugallo et al. (2015); Fossard et al. (2017).
The features corresponding to the two lowest-energy excitations at 6.2 and 6.4 eV, marked A and A’, have been extracted from the rest of the RIXS signal by subtracting a linear background under the two peaks. They give rise to the spectra shown in Fig. 6(a) and Fig. 6(b), for momentum transfers along M and K, respectively. The spectra have been fitted by means of two gaussian functions. All the fit parameters were left free for the K direction. The FWHM was found to be sharper for the A feature with respect to the A’ one, being respectively about 0.1 eV and 0.2 eV. Due to the poorer statistics of the data along the M direction, here the fit was done by keeping the FWHM of A and A’ fixed to 0.1 eV and 0.3 eV respectively.
| Direction | (Å-1) | (Å-1) |
| M | -0.07 | 0.11 |
| -0.05 | 0.12 | |
| -0.03 | 0.13 | |
| -0.01 | 0.13 | |
| K | -0.04 | 0.12 |
| -0.03 | 0.13 | |
| 0.04 | 0.12 | |
| 0.07 | 0.11 |
Fig. 6(c) summarizes the result of the fits, displaying the measured excitation energies as a function of the absolute value of the momentum transfer . The two features A and A’ follow parallel parabolic-like dispersions along both directions. However, their dispersion is positive along M, while it is negative along K: the largest energy is at and decreases by increasing . This negative dispersion is due to the fact that -BN has an indirect band gapArnaud et al. (2006) along K. As a consequence, increasing the momentum transfer , the smallest energy separation between the bottom conduction and top valence band decreases. The present results are complementary to the EELS findings in Ref. Schuster et al., 2018, where the negative exciton dispersion was measured in the loss function for larger momentum transfers Å along K. Here, soft X-ray RIXS demonstrates to be a powerful way to identify the nature of the band gap in semiconductors and insulators.
IV Discussion
IV.1 Analogy to orbital excitations in transition metal compounds
Transition metal compounds, where the electrons are tightly localised around the atoms, are often considered as paradigmatic strongly correlated materialsMott (1990); Fujimori et al. (1992); Imada et al. (1998). In these materials, transition metal ions have partially filled shells: neutral electronic excitations can therefore take the form of orbital - excitations localised at the transition metal ions, in which one (or more) electron is promoted from an occupied orbital to another, empty, orbital. The details of these local - transitions are well described by cluster models with a single ion in a crystal field van Veenendaal and Haverkort (2008); De Groot and Kotani (2008); Haverkort et al. (2012). Instead, orbital excitations that have an appreciable dispersion as a consequence of the superexchange interaction, which makes them mobile, are called orbitonsKugel’ and Khomskiĭ (1982); van den Brink et al. (1998); Khaliullin (2005) (or orbital waves). By definition, these dispersive excitations cannot be captured by finite clusters: their description requires the introduction of specific spin-orbital modelsKugel’ and Khomskiĭ (1982); van den Brink et al. (1998); Khaliullin (2005). Like magnons in a magnetic system, orbitons are the collective excitations of the orbital degrees of freedom. Alternatively, orbital excitations, whose peaks in the spectra are located well within the photoemission band gaps, can be considered as strongly bound excitonsLee et al. (2010). In this sense, they are similar to localised Frenkel excitons in wide-gap insulators or molecular solidsKnox (1963); Bassani and Parravicini (1975). Their dispersion can be generally understood in terms of electron and hole hoppings (i.e., the band dispersion) and/or dipole-dipole electron-hole exchange interactionsCudazzo et al. (2015).
This general connection allows us to suggest a parallelism also with the exciton in -BN, a material that definitely has different physical properties than transition metal compounds and, obviously, is not considered strongly correlated (notably, -BN is not magnetic and superexchange interactions are not at play). Indeed, analogously to a - excitation at a transition-metal ion, in -BN the exciton corresponds to a molecular - orbital excitation, situated on a BN molecule, and is tightly bound (i.e., its excitation energy is well below the band gap). Moreover, it is a collective longitudinal excitation (corresponding to a zero of ) with a non-negligible dispersion, suggesting that it could alternatively be termed with the evocative name of “-orbiton”. Along this line, one could also note that, in analogy to cupratesSchlappa et al. (2012), -BN showcases an orbital-charge separation444Contrary to cuprates, in -BN the spin degree of freedom is, of course, inactive., evidenced by the separation between the - exciton at the spectral onset and the higher-energy plasmon, both associated with the same electrons.
V Conclusion
In summary, we have characterised the lowest energy exciton in -BN by means of RIXS, identifying spectral features that were missed in previous measurements. We have determined the exciton dispersion along the -KK and M directions for 0.1 Å-1, complementing available results for the loss functionSchuster et al. (2018) for 0.1 Å-1. We have contrasted the positive exciton dispersion along M to the negative dispersion along K, which is a consequence of the indirect band gap in -BN. This also demonstrates that soft x-ray RIXS is a powerful tool to measure the dispersion at small of excitons in low-dimensional materials. Finally, we have directly compared RIXS with EELS, showing that they probe the same longitudinal exciton, at variance with absorption spectra where is the transverse exciton that is observed. The combination of different spectroscopy techniques, such as RIXS and EELS, and ab initio calculations is an insightful and rewarding strategy to characterise electronic excitations in materials.
Appendix A Low-energy excitations at the N K edge
In the RIXS spectra at the N K edge, in the low-energy region close to the elastic line, clear vibrational modes of 270 meV energy are also visible for LV polarization, but not for LH polarization, see Fig. 7.
These excitations disappear upon cleaving, so we attribute them to molecular N2 or other impurities possibly adsorbed at the surface.
However, some low energy features remain visible also in the cleaved samples at the B K edge, as shown by Fig. 8. In this case, they behave as a fluorescence. Moreover, they strongly resonate at the main XAS peak at 192 eV, they have a maximum at the constant emitted energy 191.6 eV, and they disappear in less than 1 eV. The most plausible origin of these low-energy excitations are defects or impurities.
Very recently, Ref. Pelliciari et al. (2024) has similarly identified peaks in N K edge RIXS spectra of defective -BN at multiples of 285 meV energy, correlated with
single-photon emitters.
Acknowledgements.
This work was supported by a public grant overseen by the French National Research Agency (ANR) as part of the “Investissements d’Avenir” program (Labex NanoSaclay, reference: ANR-10-LABX-0035), by the Magnus Ehrnrooth Foundation, by the Labex Palm (Grant No. ANR-10-LABX-0039-PALM) and by the BONASPES project (ANR-19-CE30-0007). The research leading to these results has received funding also from the People Programme (Marie Curie Actions) of the European Union’s Seventh Framework Programme (FP7/2007-2013) under REA grant agreement n. PCOFUND-GA-2013-609102, through the PRESTIGE programme coordinated by Campus France. Computational time was granted by GENCI (Project No. 544). K.W. and T.T. acknowledge support from the JSPS KAKENHI (Grant Numbers 21H05233 and 23H02052) , the CREST (JPMJCR24A5), JST and World Premier International Research Center Initiative (WPI), MEXT, Japan. Finally, this work is part of the IMPRESS project that has received funding from the HORIZON EUROPE framework program for research and innovation under grant agreement n. 101094299.References
- Schülke (2007) W. Schülke, Electron Dynamics by Inelastic X-Ray Scattering, Oxford Series on Synchrotron Radiation (OUP Oxford, 2007).
- Kotani and Shin (2001) A. Kotani and S. Shin, Rev. Mod. Phys. 73, 203 (2001).
- Rueff and Shukla (2010) J.-P. Rueff and A. Shukla, Rev. Mod. Phys. 82, 847 (2010).
- Ament et al. (2011) L. J. P. Ament, M. van Veenendaal, T. P. Devereaux, J. P. Hill, and J. van den Brink, Rev. Mod. Phys. 83, 705 (2011).
- Hepting et al. (2018) M. Hepting, L. Chaix, E. W. Huang, R. Fumagalli, Y. Y. Peng, B. Moritz, K. Kummer, N. B. Brookes, W. C. Lee, M. Hashimoto, T. Sarkar, J.-F. He, C. R. Rotundu, Y. S. Lee, R. L. Greene, L. Braicovich, G. Ghiringhelli, Z. X. Shen, T. P. Devereaux, and W. S. Lee, Nature 563, 374 (2018).
- Gretarsson et al. (2019) H. Gretarsson, H. Suzuki, H. Kim, K. Ueda, M. Krautloher, B. J. Kim, H. Yavaş, G. Khaliullin, and B. Keimer, Phys. Rev. B 100, 045123 (2019).
- Braicovich et al. (2009) L. Braicovich, L. J. P. Ament, V. Bisogni, F. Forte, C. Aruta, G. Balestrino, N. B. Brookes, G. M. De Luca, P. G. Medaglia, F. M. Granozio, M. Radovic, M. Salluzzo, J. van den Brink, and G. Ghiringhelli, Phys. Rev. Lett. 102, 167401 (2009).
- Le Tacon et al. (2011) M. Le Tacon, G. Ghiringhelli, J. Chaloupka, M. M. Sala, V. Hinkov, M. W. Haverkort, M. Minola, M. Bakr, K. J. Zhou, S. Blanco-Canosa, C. Monney, Y. T. Song, G. L. Sun, C. T. Lin, G. M. De Luca, M. Salluzzo, G. Khaliullin, T. Schmitt, L. Braicovich, and B. Keimer, Nature Physics 7, 725 (2011).
- Schlappa et al. (2012) J. Schlappa, K. Wohlfeld, K. J. Zhou, M. Mourigal, M. W. Haverkort, V. N. Strocov, L. Hozoi, C. Monney, S. Nishimoto, S. Singh, A. Revcolevschi, J.-S. Caux, L. Patthey, H. M. Rønnow, J. van den Brink, and T. Schmitt, Nature 485, 82 (2012).
- Hill et al. (2008) J. P. Hill, G. Blumberg, Y.-J. Kim, D. S. Ellis, S. Wakimoto, R. J. Birgeneau, S. Komiya, Y. Ando, B. Liang, R. L. Greene, D. Casa, and T. Gog, Phys. Rev. Lett. 100, 097001 (2008).
- Braicovich et al. (2010) L. Braicovich, J. van den Brink, V. Bisogni, M. M. Sala, L. J. P. Ament, N. B. Brookes, G. M. De Luca, M. Salluzzo, T. Schmitt, V. N. Strocov, and G. Ghiringhelli, Phys. Rev. Lett. 104, 077002 (2010).
- Lee et al. (2013) W. S. Lee, S. Johnston, B. Moritz, J. Lee, M. Yi, K. J. Zhou, T. Schmitt, L. Patthey, V. Strocov, K. Kudo, Y. Koike, J. van den Brink, T. P. Devereaux, and Z. X. Shen, Phys. Rev. Lett. 110, 265502 (2013).
- Lee et al. (2014) J. J. Lee, B. Moritz, W. S. Lee, M. Yi, C. J. Jia, A. P. Sorini, K. Kudo, Y. Koike, K. J. Zhou, C. Monney, V. Strocov, L. Patthey, T. Schmitt, T. P. Devereaux, and Z. X. Shen, Phys. Rev. B 89, 041104 (2014).
- Moser et al. (2015) S. Moser, S. Fatale, P. Krüger, H. Berger, P. Bugnon, A. Magrez, H. Niwa, J. Miyawaki, Y. Harada, and M. Grioni, Phys. Rev. Lett. 115, 096404 (2015).
- Rossi et al. (2019) M. Rossi, R. Arpaia, R. Fumagalli, M. Moretti Sala, D. Betto, K. Kummer, G. M. De Luca, J. van den Brink, M. Salluzzo, N. B. Brookes, L. Braicovich, and G. Ghiringhelli, Phys. Rev. Lett. 123, 027001 (2019).
- Ruotsalainen et al. (2021a) K. Ruotsalainen, M. Gatti, J. M. Ablett, F. Yakhou-Harris, J.-P. Rueff, A. David, W. Prellier, and A. Nicolaou, Phys. Rev. B 103, 235158 (2021a).
- Note (1) Atomic units are used throughout the paper if not otherwise stated.
- Onida et al. (2002) G. Onida, L. Reining, and A. Rubio, Rev. Mod. Phys. 74, 601 (2002).
- Hedin (1965) L. Hedin, Phys. Rev. 139, A796 (1965).
- Shirley (1998) E. L. Shirley, Phys. Rev. Lett. 80, 794 (1998).
- Carlisle et al. (1999a) J. A. Carlisle, E. L. Shirley, L. J. Terminello, J. J. Jia, T. A. Callcott, D. L. Ederer, R. C. C. Perera, and F. J. Himpsel, Phys. Rev. B 59, 7433 (1999a).
- Carlisle et al. (1999b) J. Carlisle, S. Blankenship, R. Smith, E. L. Shirley, L. Terminello, J. Jia, T. Callcott, and D. Ederer, Journal of Electron Spectroscopy and Related Phenomena 101-103, 839 (1999b).
- Shirley (2000a) E. Shirley, Journal of Physics and Chemistry of Solids 61, 445 (2000a).
- Shirley (2000b) E. L. Shirley, Journal of Electron Spectroscopy and Related Phenomena 110-111, 305 (2000b).
- Gilmore et al. (2015) K. Gilmore, J. Vinson, E. Shirley, D. Prendergast, C. Pemmaraju, J. Kas, F. Vila, and J. Rehr, Computer Physics Communications 197, 109 (2015).
- Vinson et al. (2017) J. Vinson, T. Jach, M. Müller, R. Unterumsberger, and B. Beckhoff, Phys. Rev. B 96, 205116 (2017).
- Gilmore et al. (2021) K. Gilmore, J. Pelliciari, Y. Huang, J. J. Kas, M. Dantz, V. N. Strocov, S. Kasahara, Y. Matsuda, T. Das, T. Shibauchi, and T. Schmitt, Phys. Rev. X 11, 031013 (2021).
- Dashwood et al. (2021) C. D. Dashwood, A. Geondzhian, J. G. Vale, A. C. Pakpour-Tabrizi, C. A. Howard, Q. Faure, L. S. I. Veiga, D. Meyers, S. G. Chiuzbăian, A. Nicolaou, N. Jaouen, R. B. Jackman, A. Nag, M. García-Fernández, K.-J. Zhou, A. C. Walters, K. Gilmore, D. F. McMorrow, and M. P. M. Dean, Phys. Rev. X 11, 041052 (2021).
- Vorwerk et al. (2020) C. Vorwerk, F. Sottile, and C. Draxl, Phys. Rev. Research 2, 042003 (2020).
- de Groot et al. (2021) F. M. de Groot, H. Elnaggar, F. Frati, R. pan Wang, M. U. Delgado-Jaime, M. van Veenendaal, J. Fernandez-Rodriguez, M. W. Haverkort, R. J. Green, G. van der Laan, Y. Kvashnin, A. Hariki, H. Ikeno, H. Ramanantoanina, C. Daul, B. Delley, M. Odelius, M. Lundberg, O. Kuhn, S. I. Bokarev, E. Shirley, J. Vinson, K. Gilmore, M. Stener, G. Fronzoni, P. Decleva, P. Kruger, M. Retegan, Y. Joly, C. Vorwerk, C. Draxl, J. Rehr, and A. Tanaka, Journal of Electron Spectroscopy and Related Phenomena 249, 147061 (2021).
- Faleev et al. (2004) S. V. Faleev, M. van Schilfgaarde, and T. Kotani, Phys. Rev. Lett. 93, 126406 (2004).
- Bruneval and Gatti (2014) F. Bruneval and M. Gatti, “Quasiparticle self-consistent gw method for the spectral properties of complex materials,” in First Principles Approaches to Spectroscopic Properties of Complex Materials, edited by C. Di Valentin, S. Botti, and M. Cococcioni (Springer Berlin Heidelberg, Berlin, Heidelberg, 2014) pp. 99–135.
- Cudazzo and Reining (2020) P. Cudazzo and L. Reining, Phys. Rev. Research 2, 012032 (2020).
- De Groot and Kotani (2008) F. De Groot and A. Kotani, Core level spectroscopy of solids (CRC Press, 2008).
- Haverkort et al. (2012) M. W. Haverkort, M. Zwierzycki, and O. K. Andersen, Phys. Rev. B 85, 165113 (2012).
- Josefsson et al. (2012) I. Josefsson, K. Kunnus, S. Schreck, A. Föhlisch, F. de Groot, P. Wernet, and M. Odelius, The Journal of Physical Chemistry Letters 3, 3565 (2012), pMID: 26290989.
- Zimmermann et al. (2018) P. Zimmermann, R. J. Green, M. W. Haverkort, and F. M. F. de Groot, Journal of Synchrotron Radiation 25, 899 (2018).
- Zaanen et al. (1985) J. Zaanen, G. A. Sawatzky, and J. W. Allen, Phys. Rev. Lett. 55, 418 (1985).
- Huotari (2012) S. Huotari, “Spectroscopy in the frequency domain,” in Fundamentals of Time-Dependent Density Functional Theory, edited by M. A. Marques, N. T. Maitra, F. M. Nogueira, E. Gross, and A. Rubio (Springer Berlin Heidelberg, Berlin, Heidelberg, 2012) pp. 15–28.
- Fink et al. (2001) J. Fink, M. Knupfer, S. Atzkern, and M. Golden, Journal of Electron Spectroscopy and Related Phenomena 117-118, 287 (2001).
- García de Abajo (2010) F. J. García de Abajo, Rev. Mod. Phys. 82, 209 (2010).
- Egerton (2011) R. Egerton, Electron energy-loss spectroscopy in the electron microscope, 3rd ed. (Springer, New York, 2011).
- Waidmann et al. (2000) S. Waidmann, M. Knupfer, B. Arnold, J. Fink, A. Fleszar, and W. Hanke, Phys. Rev. B 61, 10149 (2000).
- Galambosi et al. (2005) S. Galambosi, J. A. Soininen, A. Mattila, S. Huotari, S. Manninen, G. Vankó, N. D. Zhigadlo, J. Karpinski, and K. Hämäläinen, Phys. Rev. B 71, 060504 (2005).
- Cai et al. (2006) Y. Q. Cai, P. C. Chow, O. D. Restrepo, Y. Takano, K. Togano, H. Kito, H. Ishii, C. C. Chen, K. S. Liang, C. T. Chen, S. Tsuda, S. Shin, C. C. Kao, W. Ku, and A. G. Eguiluz, Phys. Rev. Lett. 97, 176402 (2006).
- Larson et al. (2007) B. C. Larson, W. Ku, J. Z. Tischler, C.-C. Lee, O. D. Restrepo, A. G. Eguiluz, P. Zschack, and K. D. Finkelstein, Phys. Rev. Lett. 99, 026401 (2007).
- Abbamonte et al. (2008) P. Abbamonte, T. Graber, J. P. Reed, S. Smadici, C.-L. Yeh, A. Shukla, J.-P. Rueff, and W. Ku, Proceedings of the National Academy of Sciences 105, 12159 (2008).
- Huotari et al. (2009) S. Huotari, C. Sternemann, M. C. Troparevsky, A. G. Eguiluz, M. Volmer, H. Sternemann, H. Müller, G. Monaco, and W. Schülke, Phys. Rev. B 80, 155107 (2009).
- Huotari et al. (2010) S. Huotari, J. A. Soininen, G. Vankó, G. Monaco, and V. Olevano, Phys. Rev. B 82, 064514 (2010).
- Huotari et al. (2011) S. Huotari, M. Cazzaniga, H.-C. Weissker, T. Pylkkänen, H. Müller, L. Reining, G. Onida, and G. Monaco, Phys. Rev. B 84, 075108 (2011).
- Mao et al. (2011) H.-K. Mao, Y. Ding, Y. Xiao, P. Chow, J. Shu, S. Lebègue, A. Lazicki, and R. Ahuja, Proceedings of the National Academy of Sciences 108, 20434 (2011).
- Knox (1963) R. S. Knox, Theory of Excitons (Academic Press, 1963).
- Bechstedt (2014) F. Bechstedt, Many-Body Approach to Electronic Excitations: Concepts and Applications, Springer Series in Solid-State Sciences (Springer Berlin Heidelberg, 2014).
- Martin et al. (2016) R. M. Martin, L. Reining, and D. M. Ceperley, Interacting Electrons: Theory and Computational Approaches (Cambridge University Press, 2016).
- Runge and Gross (1984) E. Runge and E. K. U. Gross, Phys. Rev. Lett. 52, 997 (1984).
- Ullrich (2012) C. Ullrich, Time-dependent Density-functional Theory: Concepts and Applications, Oxford graduate texts (Oxford University Press, 2012).
- Pines (1963) D. Pines, Elementary Excitations In Solids (Benjamin, New York, 1963).
- Quong and Eguiluz (1993) A. A. Quong and A. G. Eguiluz, Phys. Rev. Lett. 70, 3955 (1993).
- Aryasetiawan and Karlsson (1994) F. Aryasetiawan and K. Karlsson, Phys. Rev. Lett. 73, 1679 (1994).
- Larson et al. (1996) B. C. Larson, J. Z. Tischler, E. D. Isaacs, P. Zschack, A. Fleszar, and A. G. Eguiluz, Phys. Rev. Lett. 77, 1346 (1996).
- Marinopoulos et al. (2002) A. G. Marinopoulos, L. Reining, V. Olevano, A. Rubio, T. Pichler, X. Liu, M. Knupfer, and J. Fink, Phys. Rev. Lett. 89, 076402 (2002).
- Gurtubay et al. (2005) I. G. Gurtubay, J. M. Pitarke, W. Ku, A. G. Eguiluz, B. C. Larson, J. Tischler, P. Zschack, and K. D. Finkelstein, Phys. Rev. B 72, 125117 (2005).
- Weissker et al. (2006) H.-C. Weissker, J. Serrano, S. Huotari, F. Bruneval, F. Sottile, G. Monaco, M. Krisch, V. Olevano, and L. Reining, Phys. Rev. Lett. 97, 237602 (2006).
- Hambach et al. (2008) R. Hambach, C. Giorgetti, N. Hiraoka, Y. Q. Cai, F. Sottile, A. G. Marinopoulos, F. Bechstedt, and L. Reining, Phys. Rev. Lett. 101, 266406 (2008).
- Cazzaniga et al. (2011) M. Cazzaniga, H.-C. Weissker, S. Huotari, T. Pylkkänen, P. Salvestrini, G. Monaco, G. Onida, and L. Reining, Phys. Rev. B 84, 075109 (2011).
- Echeverry et al. (2012) J. P. Echeverry, E. V. Chulkov, P. M. Echenique, and V. M. Silkin, Phys. Rev. B 85, 205135 (2012).
- Zubizarreta et al. (2014) X. Zubizarreta, V. M. Silkin, and E. V. Chulkov, Phys. Rev. B 90, 165121 (2014).
- Seidu et al. (2018) A. Seidu, A. Marini, and M. Gatti, Phys. Rev. B 97, 125144 (2018).
- Iori et al. (2012) F. Iori, F. Rodolakis, M. Gatti, L. Reining, M. Upton, Y. Shvyd’ko, J.-P. Rueff, and M. Marsi, Phys. Rev. B 86, 205132 (2012).
- Rödl et al. (2017) C. Rödl, K. O. Ruotsalainen, F. Sottile, A.-P. Honkanen, J. M. Ablett, J.-P. Rueff, F. Sirotti, R. Verbeni, A. Al-Zein, L. Reining, and S. Huotari, Phys. Rev. B 95, 195142 (2017).
- Ruotsalainen et al. (2021b) K. Ruotsalainen, A. Nicolaou, C. J. Sahle, A. Efimenko, J. M. Ablett, J.-P. Rueff, D. Prabhakaran, and M. Gatti, Phys. Rev. B 103, 235136 (2021b).
- Caliebe et al. (2000) W. A. Caliebe, J. A. Soininen, E. L. Shirley, C.-C. Kao, and K. Hämäläinen, Phys. Rev. Lett. 84, 3907 (2000).
- Soininen and Shirley (2000) J. A. Soininen and E. L. Shirley, Phys. Rev. B 61, 16423 (2000).
- Olevano and Reining (2001) V. Olevano and L. Reining, Phys. Rev. Lett. 86, 5962 (2001).
- Gatti and Sottile (2013) M. Gatti and F. Sottile, Phys. Rev. B 88, 155113 (2013).
- Bassani and Parravicini (1975) F. Bassani and G. P. Parravicini, Electronic States and Optical Transitions in Solids (Pergamon Press, 1975).
- Watanabe et al. (2004) K. Watanabe, T. Taniguchi, and H. Kanda, Nature Materials 3, 404 (2004).
- Watanabe and Taniguchi (2009) K. Watanabe and T. Taniguchi, Phys. Rev. B 79, 193104 (2009).
- Gil et al. (2020) B. Gil, G. Cassabois, R. Cusco, G. Fugallo, and L. Artus, Nanophotonics 9, 3483 (2020).
- (80) S. Moon, J. Kim, J. Park, S. Im, J. Kim, I. Hwang, and J. k. Kim, Advanced Materials n/a, 2204161.
- O’Brien et al. (1993) W. L. O’Brien, J. Jia, Q.-Y. Dong, T. A. Callcott, K. E. Miyano, D. L. Ederer, D. R. Mueller, and C.-C. Kao, Phys. Rev. Lett. 70, 238 (1993).
- Jia et al. (1996) J. J. Jia, T. A. Callcott, E. L. Shirley, J. A. Carlisle, L. J. Terminello, A. Asfaw, D. L. Ederer, F. J. Himpsel, and R. C. C. Perera, Phys. Rev. Lett. 76, 4054 (1996).
- Yanagihara et al. (1997) M. Yanagihara, N. Miyata, T. Ejima, M. Watanabe, and Y. Kayanuma, Journal of the Physical Society of Japan 66, 1626 (1997).
- Miyata et al. (2002) N. Miyata, M. Yanagihara, M. Watanabe, Y. Harada, and S. Shin, Journal of the Physical Society of Japan 71, 1761 (2002).
- MacNaughton et al. (2005) J. B. MacNaughton, A. Moewes, R. G. Wilks, X. T. Zhou, T. K. Sham, T. Taniguchi, K. Watanabe, C. Y. Chan, W. J. Zhang, I. Bello, S. T. Lee, and H. Hofsäss, Phys. Rev. B 72, 195113 (2005).
- Pelliciari et al. (2024) J. Pelliciari, E. Mejia, J. M. Woods, Y. Gu, J. Li, S. B. Chand, S. Fan, K. Watanabe, T. Taniguchi, V. Bisogni, and G. Grosso, Nature Materials (2024).
- Mamy, R. et al. (1981) Mamy, R., Thomas, J., Jezequel, G., and Lemonnier, J.C., J. Physique Lett. 42, 473 (1981).
- Artús et al. (2021) L. Artús, M. Feneberg, C. Attaccalite, J. H. Edgar, J. Li, R. Goldhahn, and R. Cuscó, Advanced Photonics Research 2, 2000101 (2021).
- Museur et al. (2011) L. Museur, G. Brasse, A. Pierret, S. Maine, B. Attal-Tretout, F. Ducastelle, A. Loiseau, J. Barjon, K. Watanabe, T. Taniguchi, and A. Kanaev, physica status solidi (RRL) – Rapid Research Letters 5, 214 (2011).
- Bourrellier et al. (2014) R. Bourrellier, M. Amato, L. H. Galvão Tizei, C. Giorgetti, A. Gloter, M. I. Heggie, K. March, O. Stéphan, L. Reining, M. Kociak, and A. Zobelli, ACS Photonics 1, 857 (2014).
- Cassabois et al. (2016) G. Cassabois, P. Valvin, and B. Gil, Nature Photonics 10 (2016).
- Schué et al. (2016) L. Schué, B. Berini, A. C. Betz, B. Plaçais, F. Ducastelle, J. Barjon, and A. Loiseau, Nanoscale 8, 6986 (2016).
- Elias et al. (2021) C. Elias, G. Fugallo, P. Valvin, C. L’Henoret, J. Li, J. H. Edgar, F. Sottile, M. Lazzeri, A. Ouerghi, B. Gil, and G. Cassabois, Phys. Rev. Lett. 127, 137401 (2021).
- Schué et al. (2019) L. Schué, L. Sponza, A. Plaud, H. Bensalah, K. Watanabe, T. Taniguchi, F. Ducastelle, A. Loiseau, and J. Barjon, Phys. Rev. Lett. 122, 067401 (2019).
- Büchner (1977) U. Büchner, physica status solidi (b) 81, 227 (1977).
- Tarrio and Schnatterly (1989) C. Tarrio and S. E. Schnatterly, Phys. Rev. B 40, 7852 (1989).
- Fossard et al. (2017) F. Fossard, L. Sponza, L. Schué, C. Attaccalite, F. Ducastelle, J. Barjon, and A. Loiseau, Phys. Rev. B 96, 115304 (2017).
- Schuster et al. (2018) R. Schuster, C. Habenicht, M. Ahmad, M. Knupfer, and B. Büchner, Phys. Rev. B 97, 041201 (2018).
- Galambosi et al. (2011) S. Galambosi, L. Wirtz, J. A. Soininen, J. Serrano, A. Marini, K. Watanabe, T. Taniguchi, S. Huotari, A. Rubio, and K. Hämäläinen, Phys. Rev. B 83, 081413 (2011).
- Fugallo et al. (2015) G. Fugallo, M. Aramini, J. Koskelo, K. Watanabe, T. Taniguchi, M. Hakala, S. Huotari, M. Gatti, and F. Sottile, Phys. Rev. B 92, 165122 (2015).
- Tran et al. (2016) T. T. Tran, K. Bray, M. J. Ford, M. Toth, and I. Aharonovich, Nature Nanotechnology 11, 37 (2016).
- Caldwell et al. (2019) J. D. Caldwell, I. Aharonovich, G. Cassabois, J. H. Edgar, B. Gil, and D. N. Basov, Nature Reviews Materials 4, 552 (2019).
- Taniguchi and Watanabe (2007) T. Taniguchi and K. Watanabe, Journal of Crystal Growth 303, 525 (2007).
- Catellani et al. (1987) A. Catellani, M. Posternak, A. Baldereschi, and A. J. Freeman, Phys. Rev. B 36, 6105 (1987).
- Blase et al. (1995) X. Blase, A. Rubio, S. G. Louie, and M. L. Cohen, Phys. Rev. B 51, 6868 (1995).
- Cappellini et al. (2001) G. Cappellini, G. Satta, M. Palummo, and G. Onida, Phys. Rev. B 64, 035104 (2001).
- Arnaud et al. (2006) B. Arnaud, S. Lebègue, P. Rabiller, and M. Alouani, Phys. Rev. Lett. 96, 026402 (2006).
- Wirtz et al. (2005) L. Wirtz, A. Marini, M. Gruning, and A. Rubio, “Excitonic effects in optical absorption and electron-energy loss spectra of hexagonal boron nitride,” (2005).
- Wirtz et al. (2006) L. Wirtz, A. Marini, and A. Rubio, Phys. Rev. Lett. 96, 126104 (2006).
- Doni and Parravicini (1969) E. Doni and G. P. Parravicini, Il Nuovo Cimento B (1965-1970) 64, 117 (1969).
- Galvani et al. (2016) T. Galvani, F. Paleari, H. P. C. Miranda, A. Molina-Sánchez, L. Wirtz, S. Latil, H. Amara, and F. Ducastelle, Phys. Rev. B 94, 125303 (2016).
- Paleari et al. (2018) F. Paleari, T. Galvani, H. Amara, F. Ducastelle, A. Molina-Sánchez, and L. Wirtz, 2D Materials 5, 045017 (2018).
- Sacchi et al. (2013) M. Sacchi, N. Jaouen, H. Popescu, R. Gaudemer, J. M. Tonnerre, S. G. Chiuzbaian, C. F. Hague, A. Delmotte, J. M. Dubuisson, G. Cauchon, B. Lagarde, and F. Polack, J. Phys. Conf. Ser. 425, 072018 (2013).
- Chiuzbăian et al. (2014) S. G. Chiuzbăian, C. F. Hague, A. Avila, R. Delaunay, N. Jaouen, M. Sacchi, F. Polack, M. Thomasset, B. Lagarde, A. Nicolaou, et al., Rev, of Sci. Instrum. 85, 043108 (2014).
- Adler (1962) S. L. Adler, Phys. Rev. 126, 413 (1962).
- Wiser (1963) N. Wiser, Phys. Rev. 129, 62 (1963).
- Sottile et al. (2005) F. Sottile, F. Bruneval, A. G. Marinopoulos, L. K. Dash, S. Botti, V. Olevano, N. Vast, A. Rubio, and L. Reining, International Journal of Quantum Chemistry 102, 684 (2005).
- Koskelo et al. (2017) J. Koskelo, G. Fugallo, M. Hakala, M. Gatti, F. Sottile, and P. Cudazzo, Phys. Rev. B 95, 035125 (2017).
- Troullier and Martins (1991) N. Troullier and J. L. Martins, Phys. Rev. B 43, 1993 (1991).
- Solozhenko et al. (1995) V. Solozhenko, G. Will, and F. Elf, Solid State Communications 96, 1 (1995).
- Gonze et al. (2016) X. Gonze, F. Jollet, F. Abreu Araujo, D. Adams, B. Amadon, T. Applencourt, C. Audouze, J.-M. Beuken, J. Bieder, A. Bokhanchuk, E. Bousquet, F. Bruneval, D. Caliste, M. Côté, F. Dahm, F. Da Pieve, M. Delaveau, M. Di Gennaro, B. Dorado, C. Espejo, G. Geneste, L. Genovese, A. Gerossier, M. Giantomassi, Y. Gillet, D. Hamann, L. He, G. Jomard, J. Laflamme Janssen, S. Le Roux, A. Levitt, A. Lherbier, F. Liu, I. Lukačević, A. Martin, C. Martins, M. Oliveira, S. Poncé, Y. Pouillon, T. Rangel, G.-M. Rignanese, A. Romero, B. Rousseau, O. Rubel, A. Shukri, M. Stankovski, M. Torrent, M. Van Setten, B. Van Troeye, M. Verstraete, D. Waroquiers, J. Wiktor, B. Xu, A. Zhou, and J. Zwanziger, Comput. Phys. Commun. 205, 106 (2016).
- (122) http://www.bethe-salpeter.org/.
- Brown et al. (1976) F. C. Brown, R. Z. Bachrach, and M. Skibowski, Phys. Rev. B 13, 2633 (1976).
- Davies et al. (1981) B. M. Davies, F. Bassani, F. C. Brown, and C. G. Olson, Phys. Rev. B 24, 3537 (1981).
- Chaiken et al. (1993) A. Chaiken, L. J. Terminello, J. Wong, G. L. Doll, and C. A. Taylor, Applied Physics Letters 63, 2112 (1993).
- Jiménez et al. (1996) I. Jiménez, A. Jankowski, L. J. Terminello, J. A. Carlisle, D. G. J. Sutherland, G. L. Doll, J. V. Mantese, W. M. Tong, D. K. Shuh, and F. J. Himpsel, Applied Physics Letters 68, 2816 (1996).
- Franke et al. (1997) R. Franke, S. Bender, J. Hormes, A. Pavlychev, and N. Fominych, Chemical Physics 216, 243 (1997).
- Hua Li et al. (2012) L. Hua Li, M. Petravic, B. C. C. Cowie, T. Xing, R. Peter, Y. Chen, C. Si, and W. Duan, Applied Physics Letters 101, 191604 (2012).
- Watanabe et al. (1996) N. Watanabe, H. Hayashi, Y. Udagawa, K. Takeshita, and H. Kawata, Applied Physics Letters 69, 1370 (1996).
- Feng et al. (2008) Y. Feng, J. A. Soininen, A. L. Ankudinov, J. O. Cross, G. T. Seidler, A. T. Macrander, J. J. Rehr, and E. L. Shirley, Phys. Rev. B 77, 165202 (2008).
- Leapman and Silcox (1979) R. D. Leapman and J. Silcox, Phys. Rev. Lett. 42, 1361 (1979).
- Arenal et al. (2007) R. Arenal, M. Kociak, and N. J. Zaluzec, Applied Physics Letters 90, 204105 (2007).
- Karsai et al. (2018) F. Karsai, M. Humer, E. Flage-Larsen, P. Blaha, and G. Kresse, Phys. Rev. B 98, 235205 (2018).
- Caretti and Jiménez (2011) I. Caretti and I. Jiménez, Journal of Applied Physics 110, 023511 (2011).
- Niibe et al. (2010) M. Niibe, K. Miyamoto, T. Mitamura, and K. Mochiji, Journal of Vacuum Science & Technology A 28, 1157 (2010).
- McDougall et al. (2017) N. L. McDougall, J. G. Partridge, R. J. Nicholls, S. P. Russo, and D. G. McCulloch, Phys. Rev. B 96, 144106 (2017).
- Pantelides (1975) S. T. Pantelides, Phys. Rev. B 11, 2391 (1975).
- Urquiza et al. (2024) M. L. Urquiza, M. Gatti, and F. Sottile, Phys. Rev. B 109, 115157 (2024).
- Hiraoka et al. (2009) N. Hiraoka, H. Okamura, H. Ishii, I. Jarrige, K. D. Tsuei, and Y. Q. Cai, The European Physical Journal B 70, 157 (2009).
- Gloter et al. (2009) A. Gloter, M.-W. Chu, M. Kociak, C. H. Chen, and C. Colliex, Ultramicroscopy 109, 1333 (2009).
- Ghiringhelli et al. (2005) G. Ghiringhelli, M. Matsubara, C. Dallera, F. Fracassi, R. Gusmeroli, A. Piazzalunga, A. Tagliaferri, N. B. Brookes, A. Kotani, and L. Braicovich, Journal of Physics: Condensed Matter 17, 5397 (2005).
- Chiuzbăian et al. (2008) S. G. Chiuzbăian, T. Schmitt, M. Matsubara, A. Kotani, G. Ghiringhelli, C. Dallera, A. Tagliaferri, L. Braicovich, V. Scagnoli, N. B. Brookes, U. Staub, and L. Patthey, Phys. Rev. B 78, 245102 (2008).
- Huotari et al. (2008) S. Huotari, T. Pylkkänen, G. Vankó, R. Verbeni, P. Glatzel, and G. Monaco, Phys. Rev. B 78, 041102 (2008).
- Note (2) Extracting the dynamical structure factor directly from RIXS spectra instead requires additional hypothesesvan den Brink and van Veenendaal (2006); Ament et al. (2011).
- Ishii et al. (2004) K. Ishii, T. Inami, K. Ohwada, K. Kuzushita, J. Mizuki, Y. Murakami, S. Ishihara, Y. Endoh, S. Maekawa, K. Hirota, and Y. Moritomo, Phys. Rev. B 70, 224437 (2004).
- Kim et al. (2004) Y.-J. Kim, J. P. Hill, F. C. Chou, D. Casa, T. Gog, and C. T. Venkataraman, Phys. Rev. B 69, 155105 (2004).
- Grenier et al. (2005) S. Grenier, J. P. Hill, V. Kiryukhin, W. Ku, Y.-J. Kim, K. J. Thomas, S.-W. Cheong, Y. Tokura, Y. Tomioka, D. Casa, and T. Gog, Phys. Rev. Lett. 94, 047203 (2005).
- Braicovich et al. (2007) L. Braicovich, G. Ghiringhelli, L. H. Tjeng, V. Bisogni, C. Dallera, A. Piazzalunga, W. Reichelt, and N. B. Brookes, Phys. Rev. B 76, 125105 (2007).
- Benckiser et al. (2013) E. Benckiser, L. Fels, G. Ghiringhelli, M. Moretti Sala, T. Schmitt, J. Schlappa, V. N. Strocov, N. Mufti, G. R. Blake, A. A. Nugroho, T. T. M. Palstra, M. W. Haverkort, K. Wohlfeld, and M. Grüninger, Phys. Rev. B 88, 205115 (2013).
- Bachar et al. (2022) N. Bachar, K. Koteras, J. Gawraczynski, W. Trzciński, J. Paszula, R. Piombo, P. Barone, Z. Mazej, G. Ghiringhelli, A. Nag, K.-J. Zhou, J. Lorenzana, D. van der Marel, and W. Grochala, Phys. Rev. Res. 4, 023108 (2022).
- Agranovich and Ginzburg (1984) V. Agranovich and V. Ginzburg, Crystal Optics with Spatial Dispersion, and Excitons, Springer Series in Solid-State Sciences (Springer Berlin Heidelberg, 1984).
- Galamić-Mulaomerović and Patterson (2005) S. Galamić-Mulaomerović and C. H. Patterson, Phys. Rev. B 72, 035127 (2005).
- Note (3) We note that both BSE results in Ref. \rev@citealpnumGalamic2005 overestimated the corresponding experimental values.
- Mott (1990) N. F. Mott, Metal-Insulator Transitions, 2nd ed. (Taylor & Francis, London, 1990).
- Fujimori et al. (1992) A. Fujimori, I. Hase, H. Namatame, Y. Fujishima, Y. Tokura, H. Eisaki, S. Uchida, K. Takegahara, and F. M. F. de Groot, Phys. Rev. Lett. 69, 1796 (1992).
- Imada et al. (1998) M. Imada, A. Fujimori, and Y. Tokura, Rev. Mod. Phys. 70, 1039 (1998).
- van Veenendaal and Haverkort (2008) M. van Veenendaal and M. W. Haverkort, Phys. Rev. B 77, 224107 (2008).
- Kugel’ and Khomskiĭ (1982) K. I. Kugel’ and D. I. Khomskiĭ, Soviet Physics Uspekhi 25, 231 (1982).
- van den Brink et al. (1998) J. van den Brink, W. Stekelenburg, D. I. Khomskii, G. A. Sawatzky, and K. I. Kugel, Phys. Rev. B 58, 10276 (1998).
- Khaliullin (2005) G. Khaliullin, Progress of Theoretical Physics Supplement 160, 155 (2005).
- Lee et al. (2010) C.-C. Lee, H. C. Hsueh, and W. Ku, Phys. Rev. B 82, 081106 (2010).
- Cudazzo et al. (2015) P. Cudazzo, F. Sottile, A. Rubio, and M. Gatti, Journal of Physics: Condensed Matter 27, 113204 (2015).
- Note (4) Contrary to cuprates, in -BN the spin degree of freedom is, of course, inactive.
- van den Brink and van Veenendaal (2006) J. van den Brink and M. van Veenendaal, Europhysics Letters (EPL) 73, 121 (2006).