Comparison of fundamental frequency estimators with subharmonic voice signals
Abstract
In clinical voice signal analysis, mishandling of subharmonic voicing may cause an acoustic parameter to signal false negatives. As such, the ability of a fundamental frequency estimator to identify speaking fundamental frequency is critical. This paper presents a sustained-vowel study, which used a quality-of-estimate classification to identify subharmonic errors and subharmonics-to-harmonics ratio (SHR) to measure the strength of subharmonic voicing. Five estimators were studied with a sustained vowel dataset: Praat, YAAPT, Harvest, CREPE, and FCN-F0. FCN-F0, a deep-learning model, performed the best both in overall accuracy and in correctly resolving subharmonic signals. CREPE and Harvest are also highly capable estimators for sustained vowel analysis.
Index Terms:
Disordered voice, Acoustic analysis, Pitch, SubharmonicsI Introduction
One of the hallmarks in the pathological voice is the frequent occurrences of subharmonic phonation [1, 2, 3, 4], causing the voice to have a rough perceptual quality [5]. Normally, vocal folds oscillate in unison, locked to the same frequency. Subharmonic oscillation causes the glottal cycles to have cyclically varying magnitude, duration, or shape, and voice signals capturing this behavior are categorized as the type 2 voice signals [6].
Subharmonic vocal fold vibration may occur in three ways or a combination thereof. The entire glottal structure may cyclically modulate with the same cycle period[7, 8, 9]. Alternately, two parts of glottis—e.g., left vs. right vocal folds or anterior vs. posterior—may vibrate at different cycle periods (biphonation) but in a synchronized manner [7, 10, 11, 9]. Synchronization imposes these cycles to align periodically. Finally, subharmonic voicing may also occur with additional vibration of the ventricular or aryepiglottic folds [12]. All these forms of irregular vocal fold vibration produce acoustic signals with subharmonic components or additional tones that relate to the harmonic tones by rational frequency ratios.
An important trait of subharmonic voice signals is that they are nearly periodic, i.e., they share the same basic quality with normal voice signals. The fundamental period of a subharmonic signal, however, is longer than the normal as its period spans over multiple glottal cycles. When normal harmonic oscillation with -second period bifurcates to period- subharmonic oscillation, the true period of the signal elongates to seconds. Here, a positive integer is the subharmonic period in glottal cycles. In the case of the subharmonic biphonation with two glottal fundamental periods and , there exist two subharmonic periods and such that , which constitutes the common true period.
Importantly, the vast majority of clinical acoustic parameters—such as jitter, shimmer, and harmonics-to-noise ratio—rely on the knowledge of the speaking fundamental frequency [13]. Thus, the effectiveness of these parameters hinges on the accuracy of the estimated , but the near-periodicity of subharmonic signals often steers a fundamental frequency estimator away from , either detecting or reporting unvoiced. While reporting unvoiced merely declares that most of the acoustic parameters cannot be computed for the signal segment, misdetecting as has potentially negative consequences. The resulting measurements may fall into the normal parameter ranges by treating the subharmonic tones as the harmonic tones, thereby underreporting the severity.
Many of the estimation algorithms (also known as pitch detection algorithms), however, are designed to detect the true fundamental frequency of their input signals rather than the speaking based on the assertion that the voice is a nearly periodic phenomenon. This assertion is appropriate for normal speech processing tasks because subharmonic phonation is rare in the vocally healthy population although it can be voluntarily produced as vocal fry [14] or as a singing technique [15].
The knowledge of subharmonics in voice and its implication for pathological voice analysis have led to several detection algorithms to account for this possibility. In 1990, Hedelin and Huber[16] proposed to use the amplitude compression technique among others to reduce the abrupt amplitude change associated with irregular voicing. Sun [17] proposed an algorithm to estimate and detect the period-doubling subharmonics simultaneously based on the subharmonics-to-harmonics ratios. However, extending this method to support higher subharmonic period is not trivial despite that higher-period subharmonics are known to be present in pathological voice [4]. Hlavnička et al. [18] improved Sun’s method with more elaborate estimation using a Kalman filter although still limited to the period-doubling subharmonics. Hagmüller and Kubin[19] proposed the use of the phase space from the dynamical systems analysis with a mixed result, targeting the subharmonic voice. Aichinger et al. [20, 21, 22] proposed to use parametric models with multiple harmonic sources to resolve two oscillators of biphonation cases. None of these algorithms, however, have yet been adopted by voice and speech analysis tools.
Existing estimators have been evaluated for their handling of pathological voices [23, 24, 25, 26, 27]. To assess the effect of the subharmonics, Jang et al.[25] and Vaysse et al.[27] quantified the -halving error rate. It is a generic coarse metric to identify excessive under-estimation errors rather than classifying whether an estimator selected or . The prior studies also only reported per-recording averaged results rather than individual estimates. Averaging obfuscates the impact of subharmonics because pathological voice can be highly volatile; its mode of operation can change intermittently, and even rapidly [28, 6, 1, 4].
The current study aimed to assess the performance of five selected modern estimators with a reference autocorrelation-based estimator. The study focused on their per-frame handling of subharmonic sustained vowel samples. A quality-of-estimate classification method was devised to identify possible undesirable detections of subharmonic fundamental frequency over other types of estimation errors. Moreover, the subharmonics-to-harmonics ratio (SHR) measurements were used to gain further insights.
II Methods
Acoustic Data. Sustained /a/ audio data of KayPENTAX Disordered Voice Database [29] was used in the study. All the available recordings (710) were considered, including those without demographics and diagnostic information. This database supplies its data at two different sampling rates: 53 normal voice recordings at 50000 samples/second (S/s) and 657 pathological voice recordings at 25000 S/s. The recordings come pre-trimmed without voice onsets and offsets. The normal recordings are three seconds long while the pathological recordings are variable lengths: most are one-second long with the shortest of 450 milliseconds (ms). All recordings were resampled to 8000 S/s for the study. Each recording was assessed in a 50-ms interval, yielding 16174 total intervals.
Annotation. The database does not provide information pertaining to the fundamental frequency or the presence of subharmonics. As such, the truth value (denoted by ) of each signal interval was manually annotated in three steps. First, the initial estimates were gathered from the Praat 111https://github.com/praat/praat/tree/v6.1.38. Then, these estimated ’s were reviewed and adjusted manually with a custom computer program, which superimposes a manually adjustable track on a narrowband spectrogram with audio playback capability. All instances of voice breaks and loss of harmonic structure were also confirmed to be excluded from the study. Finally, the estimates were refined using the time-varying harmonic model with a gradient-based optimization [30]. After the elimination of unvoiced segments, the analysis sample size reduced to 15941 intervals out of 703 recordings.
Spectrogram with audio playback was found sufficient to identify the ’s of normal voicing and those with weak or intermittent subharmonics. There were a few cases for which decisive judgments could not be reached due to strong sustained subharmonics. For those cases, the speaker’s information was first checked for sex appropriate (e.g., the lowest tone under 100 Hz is likely a subharmonic tone for a female voice), then the signal waveform was inspected in Praat to identify the glottal cycles.
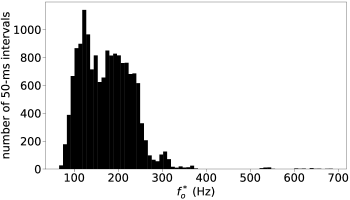
Fig. 1 illustrates the distribution of the study dataset. It follows the expected bimodal nature due to the sexual difference and fully covers the expected frequency range of modal voice [31]. The observable outliers with abnormally high were all included in the study.
Detection Algorithms. Five detection algorithms were assessed: Praat detector[32], Harvest estimator[33], “yet another algorithm for pitch tracking” (YAAPT)[34], convolutional representation for pitch estimation (CREPE) [35], and fully convolutional network for estimation (FCN-F0) [36]. These were chosen by the general popularity (Praat, CREPE) and based on their reported ability to handle subharmonics[27] (YAAPT, FCN-F0), and the state-of-art successor (Harvest) of another popular estimator, nearly-defect free (NDF) estimator[37]. Finally, an alternate configuration of the Praat detector was used to obtain another set of estimates based only on the autocorrelation function (ACF) as the baseline.
Publicly available implementations of these algorithms were used in the assessment with their default parameter settings unless noted otherwise below. All the estimators, except for CREPE and FCN-F0, were configured to limit their estimates to be between 60 and 700 Hz based on the observed values during the annotation step. The ranges of CREPE and FCN-F0 models are fixed by the structures of the models. The evaluation interval was either changed to 50 ms to match the annotation interval (Praat, ACF, CREPE, and FCN-F0) or the results from the middle of the intervals were picked (Harvest and YAAPT).
Praat estimator [32] is based on the ACF and uses the Viterbi algorithm[38] for postprocessing. Strong peaks of the ACF are selected as the candidates, each with computed and pitch strength estimates at each time-step. The Viterbi algorithm is a dynamic programming algorithm to obtain the most likely sequence of over the time steps by selecting the best path among the candidates, including the possibility of an unvoiced time-step. The path is determined by the candidates’ pitch strengths and the cost associated with switching the frequency. The ACF estimator is a reconfigured Praat estimator with the Viterbi postprocessing stage disabled by setting the Octave-jump cost and Voiced / unvoiced cost parameters to zero [32]. This forces the estimator to select the candidate with the strongest autocorrelation in each interval. The Parselmouth Python package [39] was used to run Praat for this study.
The Harvest estimator [33] is the latest estimator for the WORLD vocoder[40]. It uses a filterbank to find an candidate in each filter with logarithmically spaced center frequency and derives the final estimates with using a complex set of conditions such as harmonic reliability, frequency jump, and voicing duration. The Python implementation222https://github.com/JeremyCCHsu/Python-Wrapper-for-World-Vocoder/tree/v0.3.4 was used in this study.
The YAAPT estimator[34] combines multiple techniques including the normalized cross-correlation, spectral harmonic correlation, and dynamic programming. A Python version of this estimator333https://github.com/bjbschmitt/AMFM_decompy/tree/01fe42 was used for the assessment.
The CREPE deep-learning model [35] is a six-layer convolutional neural network (CNN) model. The dense output layer produces 360 nodes, representing between 31.7 and 2005.5 Hz, spaced logarithmically. Each output node represents the likelihood of the fundamental frequency in the proximity of its assigned value. The final estimate is obtained via weighted averaging. The model takes 1024-sample input at 16000 S/s; hence the input signal (which were initially resampled to 8000 S/s) was again resampled up to 16000 S/s. The study used the supplied pretrained model coefficients, which were trained with synthesized music data[35].
The FCN-F0 deep-learning model [36] is an extension of the CREPE model by replacing the final dense layer with another convolution layer, thereby turning the model into a fully convolutional network, and adjusting its hyperparameters for improved performance. It uses the input sampling rate of 8000 S/s and produces the likelihood outputs over a modified frequency range between 30 and 1000 Hz with 486 bins. This model was published with three pretrainined models, and this study used the FCN-993 model with 993 input frame size. The model coefficients were trained with English and French non-pathological speech corpus[36]. Author (TI)’s repackaged version444https://github.com/tikuma-lsuhsc/python-ml-pitch-models/releases/tag/v0.0.1 was used for both FCN-F0 and CREPE.
Quality-of-Estimate Classification. Each estimator’s output (denoted by ) for every 50-ms time interval was checked for its correctness against the annotated truth, . An estimate was labeled either correct, erroneous due to subharmonic error, or erroneous due to other types of estimation error. The subharmonic error refers to an event when an estimator output near with some positive integer . This could be caused either by the true presence of the subharmonics or by an estimator incidentally picking less than the largest frequency to explain the periodicity. The former is not technically an error for the sake of mathematical correctness but is an undesirable outcome for the purpose of clinical voice analysis.
Both correct and subharmonic error labels were casted based on the closeness of to , . The closeness was evaluated based on where they are placed on the harmonic power profile, which is defined by
| (1) |
where is the periodogram of the input signal with 50-ms Hamming window and is the maximum observable number of the harmonics of a signal with the fundamental frequency , i.e.,
| (2) |
Here, is the sampling rate and is the floor function. An example of is shown in Fig. 2.
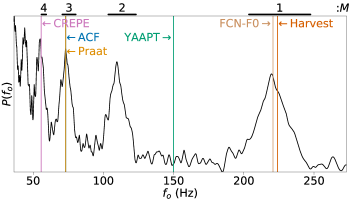
Given the annotated truth , -intervals were defined for the correct estimate () and subharmonic error estimate (). The th interval contains and is bounded by a pair of the neighboring local minima of . If fell in one of the intervals, it was said to be close enough to be correct () or was erroneous with subharmonic error (). If no such was found, was labeled erroneous with some other error. On Fig. 2, these intervals are indicated by the horizontal black bars at the top of the axes, and two estimators (Harvest and FCN-F0 under ) yielded correct estimates while CREPE (), Praat and ACF () were subject to subharmonic errors, and YAAPT failed with other error,
The -intervals were numerically evaluated with a peak-picking algorithm. The periodogram was densely sampled with the discrete Fourier transform with 0.5-Hz resolution.
Analysis Objectives. The per-frame analyses were conducted to observe three performance aspects: (1) the mapping between the estimates and the truths, (2) the detection error rates of the estimators, and (3) how the input intervals which caused subharmonic errors on the ACF were handled by the other estimators. Since the ACF estimator is the most primitive among those tested, it was thought to be most sensitive to the subharmonics.
In addition to the error rates, the subharmonics-to-harmonics ratios (SHRs) were estimated with the ACF outcomes with subharmonic errors. The SHR is a ratio of the power of subharmonic tones and the power of harmonic tones. It is equivalent to the noise-to-harmonics ratio if the nonharmonic component of the signal is subharmonics dominated. Stronger subharmonics yield higher SHR measures and are expected to increase the detection errors. As such, studying the SHRs of the signal intervals with ACF subharmonic errors identifies the sensitivities of the detectors to the subharmonic strength. The SHR was computed by
| (3) |
where is the set of the harmonic multipliers, and is the set of the subharmonic multipliers. Here, is the ACF estimate, and is its associated subharmonic period. The signal frame shown in Fig. 2 registered –6.8 dB SHR.
III Results and Discussion
A scatter plot of vs. for each estimator is shown in Fig. 3 with diagonal grid lines indicating the correct and subharmonic mappings. The cases with abnormally high (shown in Fig. 1) or are not displayed because they are scarce (less than 2% of all signal intervals) and are an atypical response to the instruction of producing voice at normal pitch. The top scatter plot reveals the hypersensitivity of the ACF to subharmonics. Fig. 3 also shows the period elongation factor of each estimator. Integer ’s correspond to the subharmonic periods. Subharmonics with periods from 2 to 6 are observable in the scatter plots with the highest period of 11. The Praat result indicates that its Viterbi postprocessor eliminated a number of high subharmonic period cases though many still remain.
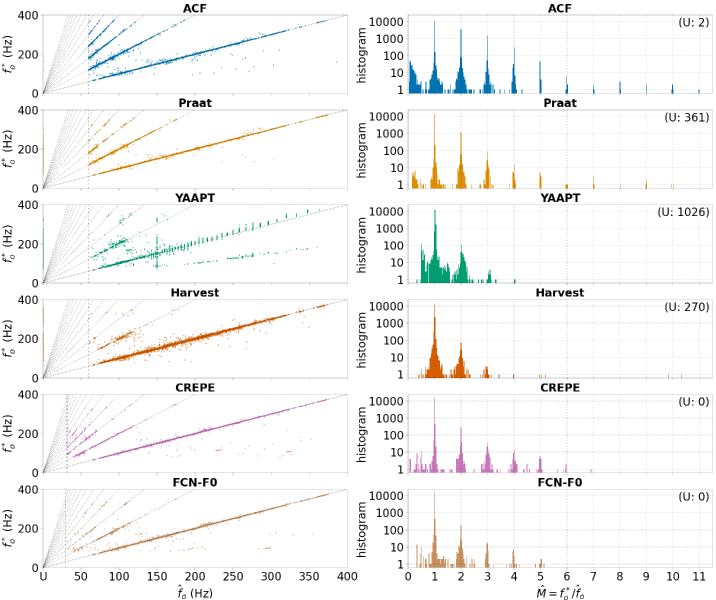
YAAPT and Harvest, which are both more complex than Praat, are visibly less sensitive to subharmonics. Not many of their estimates follow the subharmonic grid lines except for the period doubling. Instead, their errors have different tendencies (which lead to more “other error” labels). YAAPT tends to report erroneous Hz, and its granularity and bias are apparent at high . It is also susceptible to the frequency-doubling error with its results forming the line . The estimates of Harvest, on the other hand, show higher variance along the correct mapping.
The mappings of the deep-learning solutions, CREPE and FCN-F0, are placid compared to the others. While their subharmonic errors are apparent, they are much more subdued than Praat. FCN-F0 visibly has less estimates with higher subharmonic errors than CREPE. The results do not indicate any other obvious tendency of their estimation errors.
Next, the per-interval rates of correct and erroneous estimations are presented in Fig. 4. FCN-F0 marked the highest accuracy with a 96% success rate, closely followed by CREPE and Harvest at 95%. YAAPT and Praat (88%) were below the top three and trailed by ACF (62%).
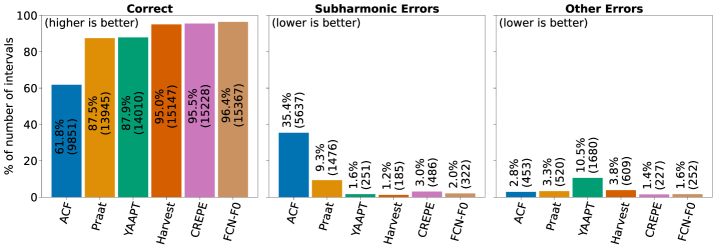
The types of the estimation errors follow the observation of Fig. 3. The ACF and Praat are dominated by subharmonic errors though the Praat postprocessor reduced the error by 74%. The rate of the other types of errors is low for both ACF and Praat. YAAPT produced more other errors (11%) in exchange for minimal numbers of the subharmonic errors (1.6%). Harvest likewise produced more other errors than subharmonic errors but only the third as many other errors than YAAPT. Finally, the deep-learning models produced the most evenly balanced ratio of subharmonics to other errors. The FCN-F0 model appears to be the best solution not only for the highest accuracy but reduces the subharmonic errors (34% less than CREPE) and achieved the best balance between subharmonic and other errors (2.0% vs. 1.6%).
As predicted, the most simplistic ACF estimator failed most often, and the vast majority of its failures were attributed to the subharmonic errors (35.4% vs. 2.8% other). Additional insights may be gained by studying how the signal intervals were evaluated differently by the other estimators compared to ACF.
Fig. 5 shows the contingency tables, illustrating how the ACF outcomes differ from the others’ outcomes. An ideally improved estimator maintains all the ACF’s correct estimations while it corrects as many of the cases of which ACF failed. The FCN-F0 model came the closest to this ideal. It reduced both subharmonic and other error counts while keeping most of the ACF’s correct decisions. The CREPE model also came close; however, its resolution for the other errors was notably inferior to FCN-F0 (reclassified 29% of ACF’s other-error cases to subharmonic errors).
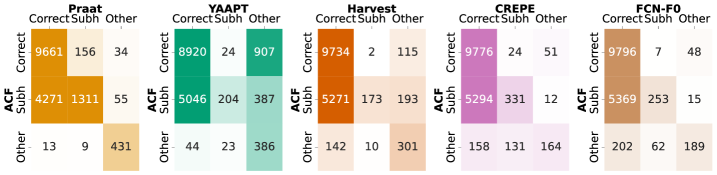
Both deep-learning models maintained most of ACF’s correct estimates (CREPE only turned over 0.8% and FCN-F0 0.6%). Harvest lost 1.1% to other errors, mostly due to its high estimation variance while Praat switched 1.6% to subharmonic errors due to the Viterbi algorithm’s breakdown on recordings, which comprise majority subharmonic. The Viterbi algorithm may incorrectly toggle the correct estimates to when subharmonic frames outnumber harmonic (or weakly subharmonic) frames in a recording. Of YAAPT’s 907 turnovers to the other error, it lost 38% to the 150-Hz error and another 42% to the frequency-doubling error.
On the other end of the tables, Harvest, CREPE, and FCN-F0 were able to turn the ACF’s other error cases to match the annotated (31%, 35%, and 46% turnover rates, respectively). These are the cases, in which the non-harmonic component presents a stronger peak of the autocorrelation function than the harmonic component. Praat and YAAPT were generally incapable of handling such cases.
Finally, the ACF’s subharmonic error cases, which are the cases with suspected presence of subharmonics, are either resolved and remained as subharmonic error by FCN-F0, CREPE, and Praat. YAAPT and Harvest both switched more than half of their remaining errors to the other error category. The majority of the Harvest’s switches were either due to high variance or unvoiced decisions. Interestingly, none of the YAAPT’s switches was due to unvoiced decisions, and no patterns were visually apparent.
Further insight for the handling of subharmonic error cases can be gained by analyzing the estimators’ outcomes with the SHR measurements as shown in Fig. 6. All the histograms show the same overall shape, i.e., the occurrences of ACF subharmonic errors as a function of the SHR. It is apparent that there are two peaks in this distribution: the main peak at –25 dB and the secondary peak at –10 dB. Based on a few spectral samplings of the cases with low SHR, we postulate that the main peak represents the incidental estimation errors by ACF while the secondary peak represents the signal intervals with subharmonics. All other detectors were able to fix most of the ACF’s incidental errors in the main peak. Praat’s inability to correct most of the subharmonic errors in the second peak indicates that Praat’s postprocessor only excels in correcting the incidental ACF errors, and its reported subharmonic error rate (9.3% in Fig. 4) is a reasonably tight lower bound for the portion of the signal intervals with subharmonics. The true number of subharmonic intervals would be higher because the imposed minimum limit (60 Hz) forces Praat and ACF to ignore candidates below the limit, steering them away from committing the subharmonic errors. This is most prevalent for the male voices with period-doubling subharmonics.
Note that SHR = –10 dB (0.1) is roughly equivalent to period-2 subharmonic amplitude modulation with 10% modulation extent[41], and Bergan and Titze[42] found that amplitude modulation with 10% modulation extent is a lower bound for period-doubling subharmonic voicing to produce an audible effect. FCN-F0, CREPE, and Harvest resolved virtually all cases with SHR < –10 dB, and they were also able to handle a sizable number of cases with SHR > –10 dB. Among the 755 recording intervals with the SHR > –10 dB, Praat estimated 3.4% of them correct, YAAPT 46.0%, Harvest 54.3%, CREPE 53.4%, and FCN-F0 63.7%.
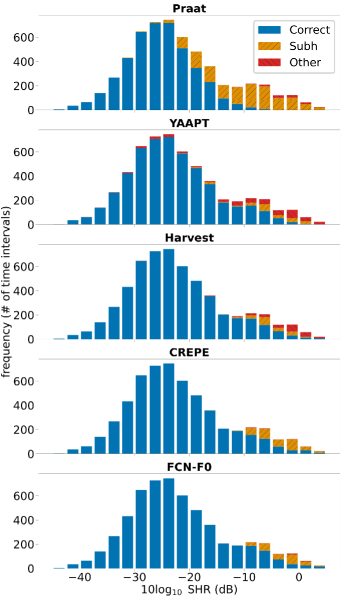
The report by Vaysse et al.[27] that YAAPT and FCN-F0 can handle the subharmonic intervals over Praat is confirmed in Fig. 6. YAAPT and FCN-F0 show that they registered a number of correct estimates well into the > –10-dB SHR region. There is also a notable discrepancy between these current findings and Vaysse et al. They found that NDF (which is a predecessor of Harvest555Both NDF and Harvest were initially considered for this study, and only Harvest is presented in this paper because they are conceptually similar and Harvest decisively outperformed NDF (95.0% vs. 88.4% in their accuracies).) had the lowest halving- errors, lower than FCN-F0 by more than a percentage point for the head-and-neck cancer group. This is in contrary to the current study in which FCN-F0 outperformed Harvest by 9% for the accuracy for the cases with SHR > –10 dB. A likely reason for these discrepancies is the target recording type. The presented results are for sustained /a/ recordings while Vaysse et al. analyzed running speech signals. Sustained vowel phonation is naturally more consistent than connected speech. The performance of deep-learning models depends on the data they were trained on, and the combination of unfamiliar intonation patterns and unfamiliarity to pathological voicing may have caused these models to have difficulty processing running speech samples.
There is an interesting parallel between the model-based Harvest estimator and the data-based CREPE and FCN-F0 estimators. All three estimators make use of frequency binning. Harvest uses a filterbank as the first step while the deep-learning models produce a likelihood measure for each bin. It could be that the deep-learning models are trained to assimilate the internal working of Harvest, and FCN-F0 surpassed it for sustained vowel application.
A limitation of this study is the uncertainty in the manually determined truths. The nearly periodic nature of subharmonic voicing made the establishment of the truths challenging for the voices with sustained strong subharmonics. Most notably, a female voice with strong subharmonics could be mistaken for a normal male voice. Despite careful annotation effort, it is possible for a small number of such errors to be still present in the truths. This could slightly change the reported accuracies of the detectors, but the key finding remains valid: None of the detectors could reliably handle strong subharmonics (SHR > –3 dB). Use of glottal inverse filtering or a dataset with simultaneous source observations (e.g., high-speed videoendoscopy or electroglottography) could minimize this type of errors.
IV Concluding Remarks
Deep learning appears to be the best approach to estimate the fundamental frequency of pathological sustained voice, especially with its encouraging results in handling the voice signals with subharmonics. Detecting the speaking fundamental frequency of subharmonic voicing is a challenging process to automate as most algorithms are designed to estimate the pure mathematical definition of the fundamental frequency rather than the speaking fundamental frequency which is tied to the overall glottal behavior (i.e., opening and closing). Deep learning models are generally free from such algorithmic assumptions as their architectures are generic, and their model coefficients are trained by annotated data. These models can, therefore, utilize more features than just periodicity to reach its conclusion. For example, relative amplitudes and phases of the harmonics may provide additional information.
In this study, the two deep-learning models, CREPE and FCN-F0, outperformed other estimators in the quality-of-estimate metric. They were in agreement with the manually annotated truths for more than 95% of the cases, slightly exceeding the performance of Harvest, the leading non-data-driven estimator. Meanwhile, CREPE and FCN-F0’s estimates are visibly less variable than those of Harvest. The deep-learning models also demonstrated their consistent ability to handle weak subharmonics with the SHRs under –10 dB, and their subharmonic errors are compartmentalized only to the high SHR cases. Achieving this degree of performance without being trained with subharmonic voice samples is quite remarkable. Retraining these models with subharmonic voice samples may bring further performance improvements for the high SHR cases.
Accurate speaking fundamental frequency estimate is crucial to the advancement of acoustic voice analysis, especially in clinical use. Deep learning is a promising tool to address the current shortcomings with the handling of subharmonic voicing.
References
- Behrman et al. [1998] A. Behrman, C. J. Agresti, E. Blumstein, and N. Lee, “Microphone and electroglottographic data from dysphonic patients: Type 1, 2 and 3 signals,” J. Voice, vol. 12, no. 2, pp. 249–260, Jan. 1998.
- Cavalli and Hirson [1999] L. Cavalli and A. Hirson, “Diplophonia reappraised,” J. Voice, vol. 13, no. 4, pp. 542–556, 1999.
- Kramer et al. [2013] E. Kramer, R. Linder, and R. Schönweiler, “A study of subharmonics in connected speech material,” Journal of Voice, vol. 27, no. 1, pp. 29–38, Jan. 2013.
- Ikuma et al. [2023] T. Ikuma, A. J. McWhorter, L. Adkins, and M. Kunduk, “Investigation of vocal bifurcations and voice patterns induced by asymmetry of pathological vocal folds,” J. Speech. Lang. Hear. Res., vol. 66, no. 1, pp. 48–60, Jan. 2023.
- Omori et al. [1997] K. Omori, H. Kojima, R. Kakani, D. H. Slavit, and S. M. Blaugrund, “Acoustic characteristics of rough voice: Subharmonics,” J. Voice, vol. 11, no. 1, pp. 40–47, Mar. 1997.
- Titze [1994] I. R. Titze, Workshop on Acoustic Voice Analysis: Summary Statement. Denver, CO, USA: National Center for Voice and Speech, 1994.
- Kiritani et al. [1993] S. Kiritani, H. Hirose, and H. Imagawa, “High-speed digital image analysis of vocal cord vibration in diplophonia,” Speech Commun., vol. 13, no. 1-2, pp. 23–32, 1993.
- Kniesburges et al. [2016] S. Kniesburges, A. Lodermeyer, S. Becker, M. Traxdorf, and M. Döllinger, “The mechanisms of subharmonic tone generation in a synthetic larynx model,” J. Acoust. Soc. Am., vol. 139, no. 6, pp. 3182–3192, Jun. 2016.
- Ikuma et al. [2016] T. Ikuma, M. Kunduk, D. Fink, and A. J. McWhorter, “Synthetic multi-line kymographic analysis: A spatiotemporal data reduction technique for high-speed videoendoscopy,” J. Acoust. Soc. Am., vol. 140, no. 4, pp. 2703–2713, Oct. 2016.
- Mergell et al. [2000] P. Mergell, H. Herzel, and I. R. Titze, “Irregular vocal-fold vibration—High-speed observation and modeling,” J. Acoust. Soc. Am., vol. 108, no. 6, pp. 2996–3002, 2000.
- Neubauer et al. [2001] J. Neubauer, P. Mergell, U. Eysholdt, and H. Herzel, “Spatio-temporal analysis of irregular vocal fold oscillations: Biphonation due to desynchronization of spatial modes,” J. Acoust. Soc. Am., vol. 110, no. 6, pp. 3179–3192, 2001.
- Titze [2024] I. R. Titze, “Simulation of multiple source vocalization in the larynx: How true folds, false folds, and aryepiglottic folds may interact,” J Speech Lang Hear Res, vol. 67, no. 3, pp. 802–810, Mar. 2024.
- KayPENTAX [2008] KayPENTAX, “Multi-Dimensional Voice Program (MDVP) Model 5105 Software Instruction Manual,” Lincoln Park, NJ, Jun. 2008.
- Hollien et al. [1966] H. Hollien, P. Moore, R. W. Wendahl, and J. F. Michel, “On the nature of vocal fry,” Journal of Speech and Hearing Research, vol. 9, no. 2, pp. 245–247, Jun. 1966.
- Herbst et al. [2017] C. T. Herbst, S. Hertegard, D. Zangger-Borch, and P.-Å. Lindestad, “Freddie Mercury—acoustic analysis of speaking fundamental frequency, vibrato, and subharmonics,” Logoped. Phoniatr. Vocol., vol. 42, no. 1, pp. 29–38, Jan. 2017.
- Hedelin and Huber [1990] P. Hedelin and D. Huber, “Pitch period determination of aperiodic speech signals,” in Int. Conf. Acoust. Speech Signal Process., Apr. 1990, pp. 361–364 vol.1.
- Sun [2000] X. Sun, “A pitch determination algorithm based on subharmonic-to-harmonic ratio,” in Proc. 6th ICSLP, vol. 4, Beijing, China, 2000, pp. 676–679.
- Hlavnička et al. [2019] J. Hlavnička, R. Čmejla, J. Klempíř, E. Růžička, and J. Rusz, “Acoustic tracking of pitch, modal, and subharmonic vibrations of vocal folds in Parkinson’s Disease and Parkinsonism,” IEEE Access, vol. 7, pp. 150 339–150 354, 2019.
- Hagmüller and Kubin [2006] M. Hagmüller and G. Kubin, “Poincaré pitch marks,” Speech Communication, vol. 48, no. 12, pp. 1650–1665, Dec. 2006.
- Aichinger et al. [2015, Sept. 2-4] P. Aichinger, M. Hagmüller, I. Roesner, W. Bigenzahn, B. Schneider-Stickler, J. Schoentgen, and F. Pernkopf, “Measurement of fundamental frequencies in diplophonic voices,” in Proc. 13th MAVEBA. Florence, Italy: Firenze University Press, 2015, Sept. 2-4, pp. 21–24.
- Aichinger et al. [2017] P. Aichinger, M. Hagmüller, I. Roesner, B. Schneider-Stickler, J. Schoentgen, and F. Pernkopf, “Fundamental frequency tracking in diplophonic voices,” Biomed. Signal Process. Control, vol. 37, pp. 69–81, Aug. 2017.
- Aichinger et al. [2018] P. Aichinger, M. Hagmüller, B. Schneider-Stickler, J. Schoentgen, and F. Pernkopf, “Tracking of multiple fundamental frequencies in diplophonic voices,” IEEEACM Trans. Audio Speech Lang. Process., vol. 26, no. 2, pp. 330–341, Feb. 2018.
- Laver et al. [1982] J. Laver, S. Hiller, and R. Hanson, “Comparative performance of pitch detection algorithms on dysphonic voices,” in ICASSP 82 IEEE Int. Conf. Acoust. Speech Signal Process., vol. 7, May 1982, pp. 192–195.
- Parsa and Jamieson [1999] V. Parsa and D. G. Jamieson, “A comparison of high precision FO extraction algorithms for sustained vowels,” J. Speech. Lang. Hear. Res., vol. 42, no. 1, pp. 112–126, Feb. 1999.
- Jang et al. [2007] S.-J. Jang, S.-H. Choi, H.-M. Kim, H.-S. Choi, and Y.-R. Yoon, “Evaluation of performance of several established pitch detection algorithms in pathological voices,” in 2007 29th Annu. Int. Conf. IEEE Eng. Med. Biol. Soc., Lyon, France, Aug. 2007, pp. 620–623.
- Tsanas et al. [2014] A. Tsanas, M. Zañartu, M. A. Little, C. Fox, L. O. Ramig, and G. D. Clifford, “Robust fundamental frequency estimation in sustained vowels: Detailed algorithmic comparisons and information fusion with adaptive Kalman filtering,” J. Acoust. Soc. Am., vol. 135, no. 5, pp. 2885–2901, May 2014.
- Vaysse et al. [2022] R. Vaysse, C. Astésano, and J. Farinas, “Performance analysis of various fundamental frequency estimation algorithms in the context of pathological speech,” J. Acoust. Soc. Am., vol. 152, no. 5, pp. 3091–3101, 2022.
- Dejonckere and Lebacq [1983] P. Dejonckere and J. Lebacq, “An analysis of the diplophonia phenomenon,” Speech Commun., vol. 2, no. 1, pp. 47–56, May 1983.
- KayPENTAX and Massachusetts Eye and Ear Infirmary [2006] KayPENTAX and Massachusetts Eye and Ear Infirmary, “Disordered Voice Database and Program [Model 4337],” 2006.
- Ikuma et al. [2022] T. Ikuma, B. Story, A. J. McWhorter, L. Adkins, and M. Kunduk, “Harmonics-to-noise ratio estimation with deterministically time-varying harmonic model for pathological voice signals,” J. Acoust. Soc. Am., vol. 152, no. 3, pp. 1783–1794, Sep. 2022.
- Baken and Orlikoff [2000] R. J. Baken and R. F. Orlikoff, Clinical Measurement of Speech and Voice, 2nd ed. San Diego, CA, USA: Singular, 2000.
- Boersma [1993] P. Boersma, “Accurate short-term analysis of the fundamental frequency and the harmonics-to-noise ratio of a sampled sound,” Proc. Inst. Phonet. Sci., vol. 17, pp. 97–110, 1993.
- Morise [2017] M. Morise, “Harvest: A high-performance fundamental frequency estimator from speech signals,” in Interspeech 2017. ISCA, Aug. 2017, pp. 2321–2325.
- Zahorian and Hu [2008] S. A. Zahorian and H. Hu, “A spectral/temporal method for robust fundamental frequency tracking,” J. Acoust. Soc. Am., vol. 123, no. 6, pp. 4559–4571, Jun. 2008.
- Kim et al. [2018] J. W. Kim, J. Salamon, P. Li, and J. P. Bello, “Crepe: A convolutional representation for pitch estimation,” in IEEE ICASSP 2018, Calgary, AB, Apr. 2018, pp. 161–165.
- Ardaillon and Roebel [2019] L. Ardaillon and A. Roebel, “Fully-convolutional network for pitch estimation of speech signals,” in Interspeech 2019, Sep. 2019, pp. 2005–2009.
- Kawahara et al. [2005] H. Kawahara, A. D. Cheveigné, H. Banno, T. Takahashi, and T. Irino, “Nearly defect-free F0 trajectory extraction for expressive speech modifications based on STRAIGHT,” in Interspeech 2005. ISCA, Sep. 2005, pp. 537–540.
- Viterbi [1967] A. Viterbi, “Error bounds for convolutional codes and an asymptotically optimum decoding algorithm,” IEEE Trans. Inf. Theory, vol. 13, no. 2, pp. 260–269, Apr. 1967.
- Jadoul et al. [2018] Y. Jadoul, B. Thompson, and B. de Boer, “Introducing Parselmouth: A Python interface to Praat,” Journal of Phonetics, vol. 71, pp. 1–15, Nov. 2018.
- Morise et al. [2016] M. Morise, F. Yokomori, and K. Ozawa, “WORLD: A vocoder-based high-quality speech synthesis system for real-time applications,” IEICE Trans. Inf. & Syst., vol. E99.D, no. 7, pp. 1877–1884, 2016.
- Herbst [2021] C. T. Herbst, “Performance evaluation of subharmonic-to-harmonic ratio (SHR) computation,” J. Voice, vol. 35, no. 3, pp. 365–375, May 2021.
- Bergan and Titze [2001] C. C. Bergan and I. R. Titze, “Perception of pitch and roughness in vocal signals with subharmonics,” J. Voice, vol. 15, no. 2, pp. 165–175, Jun. 2001.