Who Does the Giant Number Pile Like Best: Analyzing Fairness in Hiring Contexts
Abstract
Large language models (LLMs) are increasingly being deployed in high-stakes applications like hiring, yet their potential for unfair decision-making and outcomes remains understudied, particularly in generative settings. In this work, we examine the fairness of LLM-based hiring systems through two real-world tasks: resume summarization and retrieval. By constructing a synthetic resume dataset and curating job postings, we investigate whether model behavior differs across demographic groups and is sensitive to demographic perturbations. Our findings reveal that race-based differences appear in approximately 10% of generated summaries, while gender-based differences occur in only 1%. In the retrieval setting, all evaluated models display non-uniform selection patterns across demographic groups and exhibit high sensitivity to both gender and race-based perturbations. Surprisingly, retrieval models demonstrate comparable sensitivity to non-demographic changes, suggesting that fairness issues may stem, in part, from general brittleness issues. Overall, our results indicate that LLM-based hiring systems, especially at the retrieval stage, can exhibit notable biases that lead to discriminatory outcomes in real-world contexts.
Who Does the Giant Number Pile Like Best: Analyzing Fairness in Hiring Contexts
Preethi Seshadri UC Irvine preethis@uci.edu Seraphina Goldfarb-Tarrant Cohere seraphina@cohere.com
1 Introduction
Large language models (LLMs) are increasingly being used for real-world, high-stakes domains, including medicine, law, and hiring. As LLMs are incorporated into critical decision-making processes, ensuring reliable and responsible usage is paramount. A key aspect of this effort includes anticipating and preventing specific risks and harms, such as identifying biases that could unfairly disadvantage certain demographic groups in hiring screening processes.
Prior work focuses on two types of harms: representational harms (i.e., representing certain groups in a less favorable light than others, demeaning them, or failing to recognize their existence altogether) and allocational harms (i.e., allocating resources or opportunities or unfairly to different social groups) (Barocas et al., 2017; Blodgett et al., 2020). There is a substantial body of work that analyzes representational harms in LLMs (Zhao et al., 2018; Abid et al., 2021; Kirk et al., 2021; Cheng et al., 2023; Gadiraju et al., 2023), yet allocational harms—which are the primary harm at play in high-stakes situations—remain understudied. Given the growing use of LLMs in consequential applications, it is especially important to examine whether models produce unfair outcomes or performance gaps between different groups (allocational harms, also referred to as allocational fairness).
Although there are a few studies on LLM harms in real-world settings (e.g., hiring) (Tamkin et al., 2023; An et al., 2024; Haim et al., 2024; Nghiem et al., 2024), there is minimal work closely simulating actual deployment scenarios. By using highly simplified setups and tasks, these prior works may fail to predict real-world outcomes and as a result provide an incomplete assessment of harms. Investigations into LLM harms should ensure ecological validity (Goldfarb-Tarrant et al., 2021; Cao et al., 2022); they should either be grounded in realistic scenarios and tasks that match how these systems are used in practice, or use a proxy that has been proven to be predictive of real world outcomes.
Additionally, these existing studies have cast their investigations of allocational harms in LLMs as discrete classification tasks (such as binary accept/reject decisions) or quantitative predictions (such as determining salary levels). This makes the implementation and evaluation more straightforward, but does not match the real use of generative LLMs (Kelly, 2023; Yin et al., 2024). In contrast, there is limited work on allocational harms in generative settings (Wan et al., 2023), like summarization, since measuring how generated text might create disparities is more open-ended and complex than analyzing classification predictions.
In this work, we examine whether LLMs are fair in real-world contexts for hiring. We choose hiring due to the growing adoption of LLMs in hiring tools (Sánchez-Monedero et al., 2020). Hiring is a high-stakes domain with clear societal risks – unfair systems may discriminate against already marginalized groups, risking further underrepresentation throughout the hiring pipeline (Dastin, 2018; Raghavan et al., 2020; Suresh and Guttag, 2021). We focus on two tasks that mirror how LLMs are integrated into hiring and recruitment workflows: resume summarization and resume retrieval with respect to a job post (Herman, 2024; Humanly, 2024). We then examine whether model behavior in these tasks is sensitive to gender and race demographic perturbations in resumes (e.g., name perturbations or tailored extracurricular content). Specifically, we ask the following questions:
-
•
RQ1: Do model generated summaries differ meaningfully across demographic groups?
-
•
RQ2: In a retrieval setting, do models disparately select resumes across demographic groups?
-
•
RQ3: In a retrieval setting, how sensitive are model rankings to demographic and non-demographic perturbations in resumes?
In this work, we: (1) create a synthetic resume dataset and curate a job post dataset, (2) propose metrics to measure fairness in generative and retrieval settings for two real-world hiring tasks, validated by an expert human preference study, and (3) perform a study investigating the fairness of an automated LLM hiring system based on real world usage, for 7 models (3 generative, 4 retrieval).111The data and code can be found at https://github.com/preethisesh/hiring_fairness.
In the summarization setting, on average, we observe meaningful differences between summaries generated for different racial groups nearly 10% of the time, as opposed to only 1% for gender (RQ1). On the other hand, for retrieval, we find that all models are prone to non-uniformly selecting resumes across demographic groups (RQ2). In addition, all models produce rankings that are highly sensitive to both name and race demographic perturbations (RQ3). We also find that model sensitivity to non-demographic perturbations is notable and sometimes even on par with demographic perturbations (RQ3), suggesting that fairness issues may largely be due to model brittleness as a whole, rather than encoded biases only. Overall, our results demonstrate that an LLM hiring system with automated resume retrieval and summarization exhibits considerable bias, primarily stemming from the initial retrieval stage.
2 Methodology
To study fairness in hiring, we consider an LLM-based pipeline with two components: resume retrieval with respect to a job post (using an embedding model), and resume summarization (using an LLM).222We analyze both components because they reflect real-world usage of automation to streamline hiring processes. We focus on summarization first because it is more neglected in research, though in a pipeline it would come after retrieval (as summarization would be of retrieved resumes). We investigate the impact of perturbing the demographic group of a resume on each component of the pipeline and look for: (1) systematic differences in generated resume summaries and (2) changes in similarity of a resume to a job posting, and as a result its ranking in a resume set.
Let represent a set of resumes, where each resume has demographic label . For each resume, let represent any perturbed version of where . For each , there can be several perturbed versions along various demographic dimensions (e.g., gender or race, to name a few). The resume content remains largely unchanged except for the demographic perturbation.
2.1 Summarization
Perturbed resumes are by design highly similar to original resumes, so we expect generated summaries for original and perturbed resumes to also maintain a high degree of similarity. In other words, we are testing for invariance, since we expect the output to change minimally after perturbing the input (Ribeiro et al., 2020).
In order to assess invariance, we need a way to measure whether the original and perturbed summaries differ meaningfully. For cost and scalability reasons, we rely on an automated approach—human preferences are expensive and cannot be collected frequently, especially if these preferences are sourced from HR staff. Additionally, collecting human preferences for a specific dataset does not extend to other analyses with new datasets.
Automated measures can evaluate whether specific properties of generated summaries differ, where differences in these properties would be undesirable in practice. For instance, summaries for a specific demographic group should not be written more positively than summaries for other demographic groups; this could lead to disparity in hiring outcomes. We use the following measures as proxies for undesirable variation that could influence the decision of an HR staff reading the summary: reading ease, reading time, polarity, subjectivity, and regard (Appendix A.5). We verify that these measures capture meaningful differences in practice by conducting a preference task annotated by HR staff. This study shows that these are good proxies for human preferences (Appendix A.6).
Fairness Metric
We compute an invariance metric that aggregates the proposed measures for both original and perturbed resume summaries. For each measure, we do a paired t-test between scores for original and perturbed summaries, repeated for each demographic perturbation. We then calculate how often the null hypothesis (that the mean difference between paired summaries is zero) is rejected, i.e., how often invariance is violated. We choose a significance level of , and apply Bonferroni correction to account for Type 1 errors with multiple comparisons (Bland and Altman, 1995).
2.2 Retrieval
In contrast to summarization, which relies on only the resume, retrieval utilizes both a query (i.e., job posting) and candidates to select (i.e., resumes). The top- of the resulting resumes sorted by similarity then make it to the next stage of the pipeline. Similar to the previous setting, we assume that demographically perturbing a resume should have no impact on its relevance to a job posting.
Given an embedding model and a similarity measure , we compute the similarity between embeddings for resume and a job posting . In practice, we use cosine similarity (also used in Wilson and Caliskan (2024)). We define the set , which represents the set of similarity values between each resume and job posting :
We transform the similarity values between each resume and job posting, , into a rank such that lower ranks indicate higher similarity (note: the highest similarity value receives rank 1):
Let represent the set of top- resumes from , which are the resumes with the lowest ranks (i.e., highest similarities) for job posting :
Fairness Metrics
Non-uniformity
evaluates whether the top-% (where is a percentage instead of a fixed number ) of resumes are uniformly distributed with respect to the demographic groups being considered. To compute non-uniformity, we consider the set of top-% of resumes retrieved from the combined pool of all demographically perturbed versions, which we denote as . Following the approach from Wilson and Caliskan (2024), we perform a chi-squared goodness-of-fit test to determine whether the demographic makeup of deviates from the uniform distribution.
Exclusion
evaluates how often resumes in the set of top- resumes are excluded (i.e., the ranking falls outside top-) after perturbation. Ideally, should be robust to demographic perturbations, yielding nearly identical similarity scores and rankings for both resume and demographically perturbed version . Exclusion directly tests this behavior by measuring the extent to which the set of top- resumes differs after perturbation.
3 Experimental Setup
In this section, we provide an overview of the datasets, perturbations, and models used in our evaluation.
3.1 Data
Resumes
Resumes are sourced through social media platforms including LinkedIn, Slack, and X. Given the authors’ professional circles, the sample skews heavily toward tech and academic professionals. For privacy reasons, we anonymize resumes using Presidio anonymize,333https://microsoft.github.io/presidio/anonymizer/ which masks PII entities. To further mitigate privacy concerns and enable us to release the dataset, we use the collected resumes as examples to generate synthetic resumes, instead of using original resumes in our analysis. We generate 525 resumes across 21 professions using Cohere’s Command-R model (Cohere, 2024). All synthetic resumes are free of explicit demographic information, until we add it as part of experimentation.
In addition to our curated resume set, we use a publicly available resume dataset from Kaggle (Bhawal, 2021).444Has a CC0: Public Domain License These resumes differ in two notable ways: (1) the Kaggle resumes are less structured and formatted than synthetically generated resumes, and (2) they include a more diverse set of fields (e.g., apparel, construction, fitness, etc.). We sample 1175 Kaggle resumes across 24 fields.
Job Posts
Our resume dataset consists of two types: realistic synthetic resumes generated for specific roles (e.g., data analyst) and actual resumes from Kaggle labeled with broader field categories (e.g., construction). For each profession/field (we choose 11 from generated resumes and 11 from Kaggle resumes), we carefully select 7 detailed LinkedIn job postings that clearly describe the role and outline qualifications. For Kaggle resumes, we match postings to roles within each broader field (e.g., choosing “construction manager” postings for the construction field). In total, we collect 154 job postings across different professions.
3.2 Demographic Perturbations
We use names as a proxy for gender and racial information. Initially, all resumes are free of names. We then add names using the curated set of names from Yin et al. (2024).555Uses voter registration data from North Carolina to identify demographically-distinct names. We consider four demographic groups, each with 100 unique names: Black female (FB), White female (FW), Black male (MB), and White male (MW). Following Wilson and Caliskan (2024), we use the demographically neutral “Williams” as the last name for all groups and only vary first name.
In actual resumes, demographic information can be encoded in more than just the name. Therefore, for synthetically generated resumes, we perform an additional augmentation step that adds extracurricular information to the resumes (similar to Glazko et al. (2024)). We use Command-R to augment resumes by including awards, clubs and leadership, and mentorship and volunteering experiences that are reflective of the individual’s background and identity (more details in Appendix A.3 and A.4). In addition to explicit gender and race information from names, extracurricular information can reinforce demographic signal by providing further explicit and implicit cues.
3.3 Non-Demographic Perturbations
We do two non-demographic perturbation experiments for retrieval to assess baseline sensitivity of embedding models that is not due to demographics.
Within Group Name Perturbations
As a baseline comparison to performing name perturbations between different demographic groups (e.g., White female Black Female), we assess whether models are sensitive to same group demographic perturbations (e.g., White female White Female). By doing so, we disentangle how much bias is due demographic changes vs. overall model sensitivity to name changes.
To control for the effects of frequency (Ethayarajh et al., 2019), we bin names in each demographic group according to their frequency in the Pile dataset (Gao et al., 2020), and match names based on the bin. Therefore, name perturbations should result in a similarly occurring name within the same demographic group.
Non-Name Perturbations
We also assess whether model rankings are sensitive to non-name perturbations. This allows us to examine whether models lack robustness more broadly, or mainly exhibit brittleness with respect to name changes.
We test two perturbation types: (1) random character swapping, which does not impact readability or comprehension in a meaningful way and (2) replacing new lines in the resume with a single space instead, which targets formatting without modifying content. For character swapping, we choose 10 random characters in the resume and swap based on neighboring keys to simulate typos.
3.4 Models
Summarization
We generate summaries using a combination of closed and open state-of-the-art language models: GPT-4o (OpenAI, 2024), Command-R (Cohere, 2024), and Mixtral 8x7B (Jiang et al., 2024). For summary instructions, we vary the generation length (100 and 200 words) as well as the point of view (first and third person) specified in the prompt. We generate summaries with temperatures of 0.0 and 0.3.
Retrieval
For retrieval, we select four popular dense embedding models used in retrieval augmented generation (RAG) systems (Lewis et al., 2020): OpenAI’s text-embedding-3-small and text-embedding-3-large models, Cohere’s embed-english-v3.0, and Mistral’s mistral-embed.
4 Results
In this section, we evaluate the use of LLMs in two real-world hiring tasks: resume summarization and retrieval. Unless otherwise mentioned, we present results for generated resumes below, and include results for Kaggle resumes in the Appendix. Similar trends and findings hold for both datasets.
4.1 Summarization
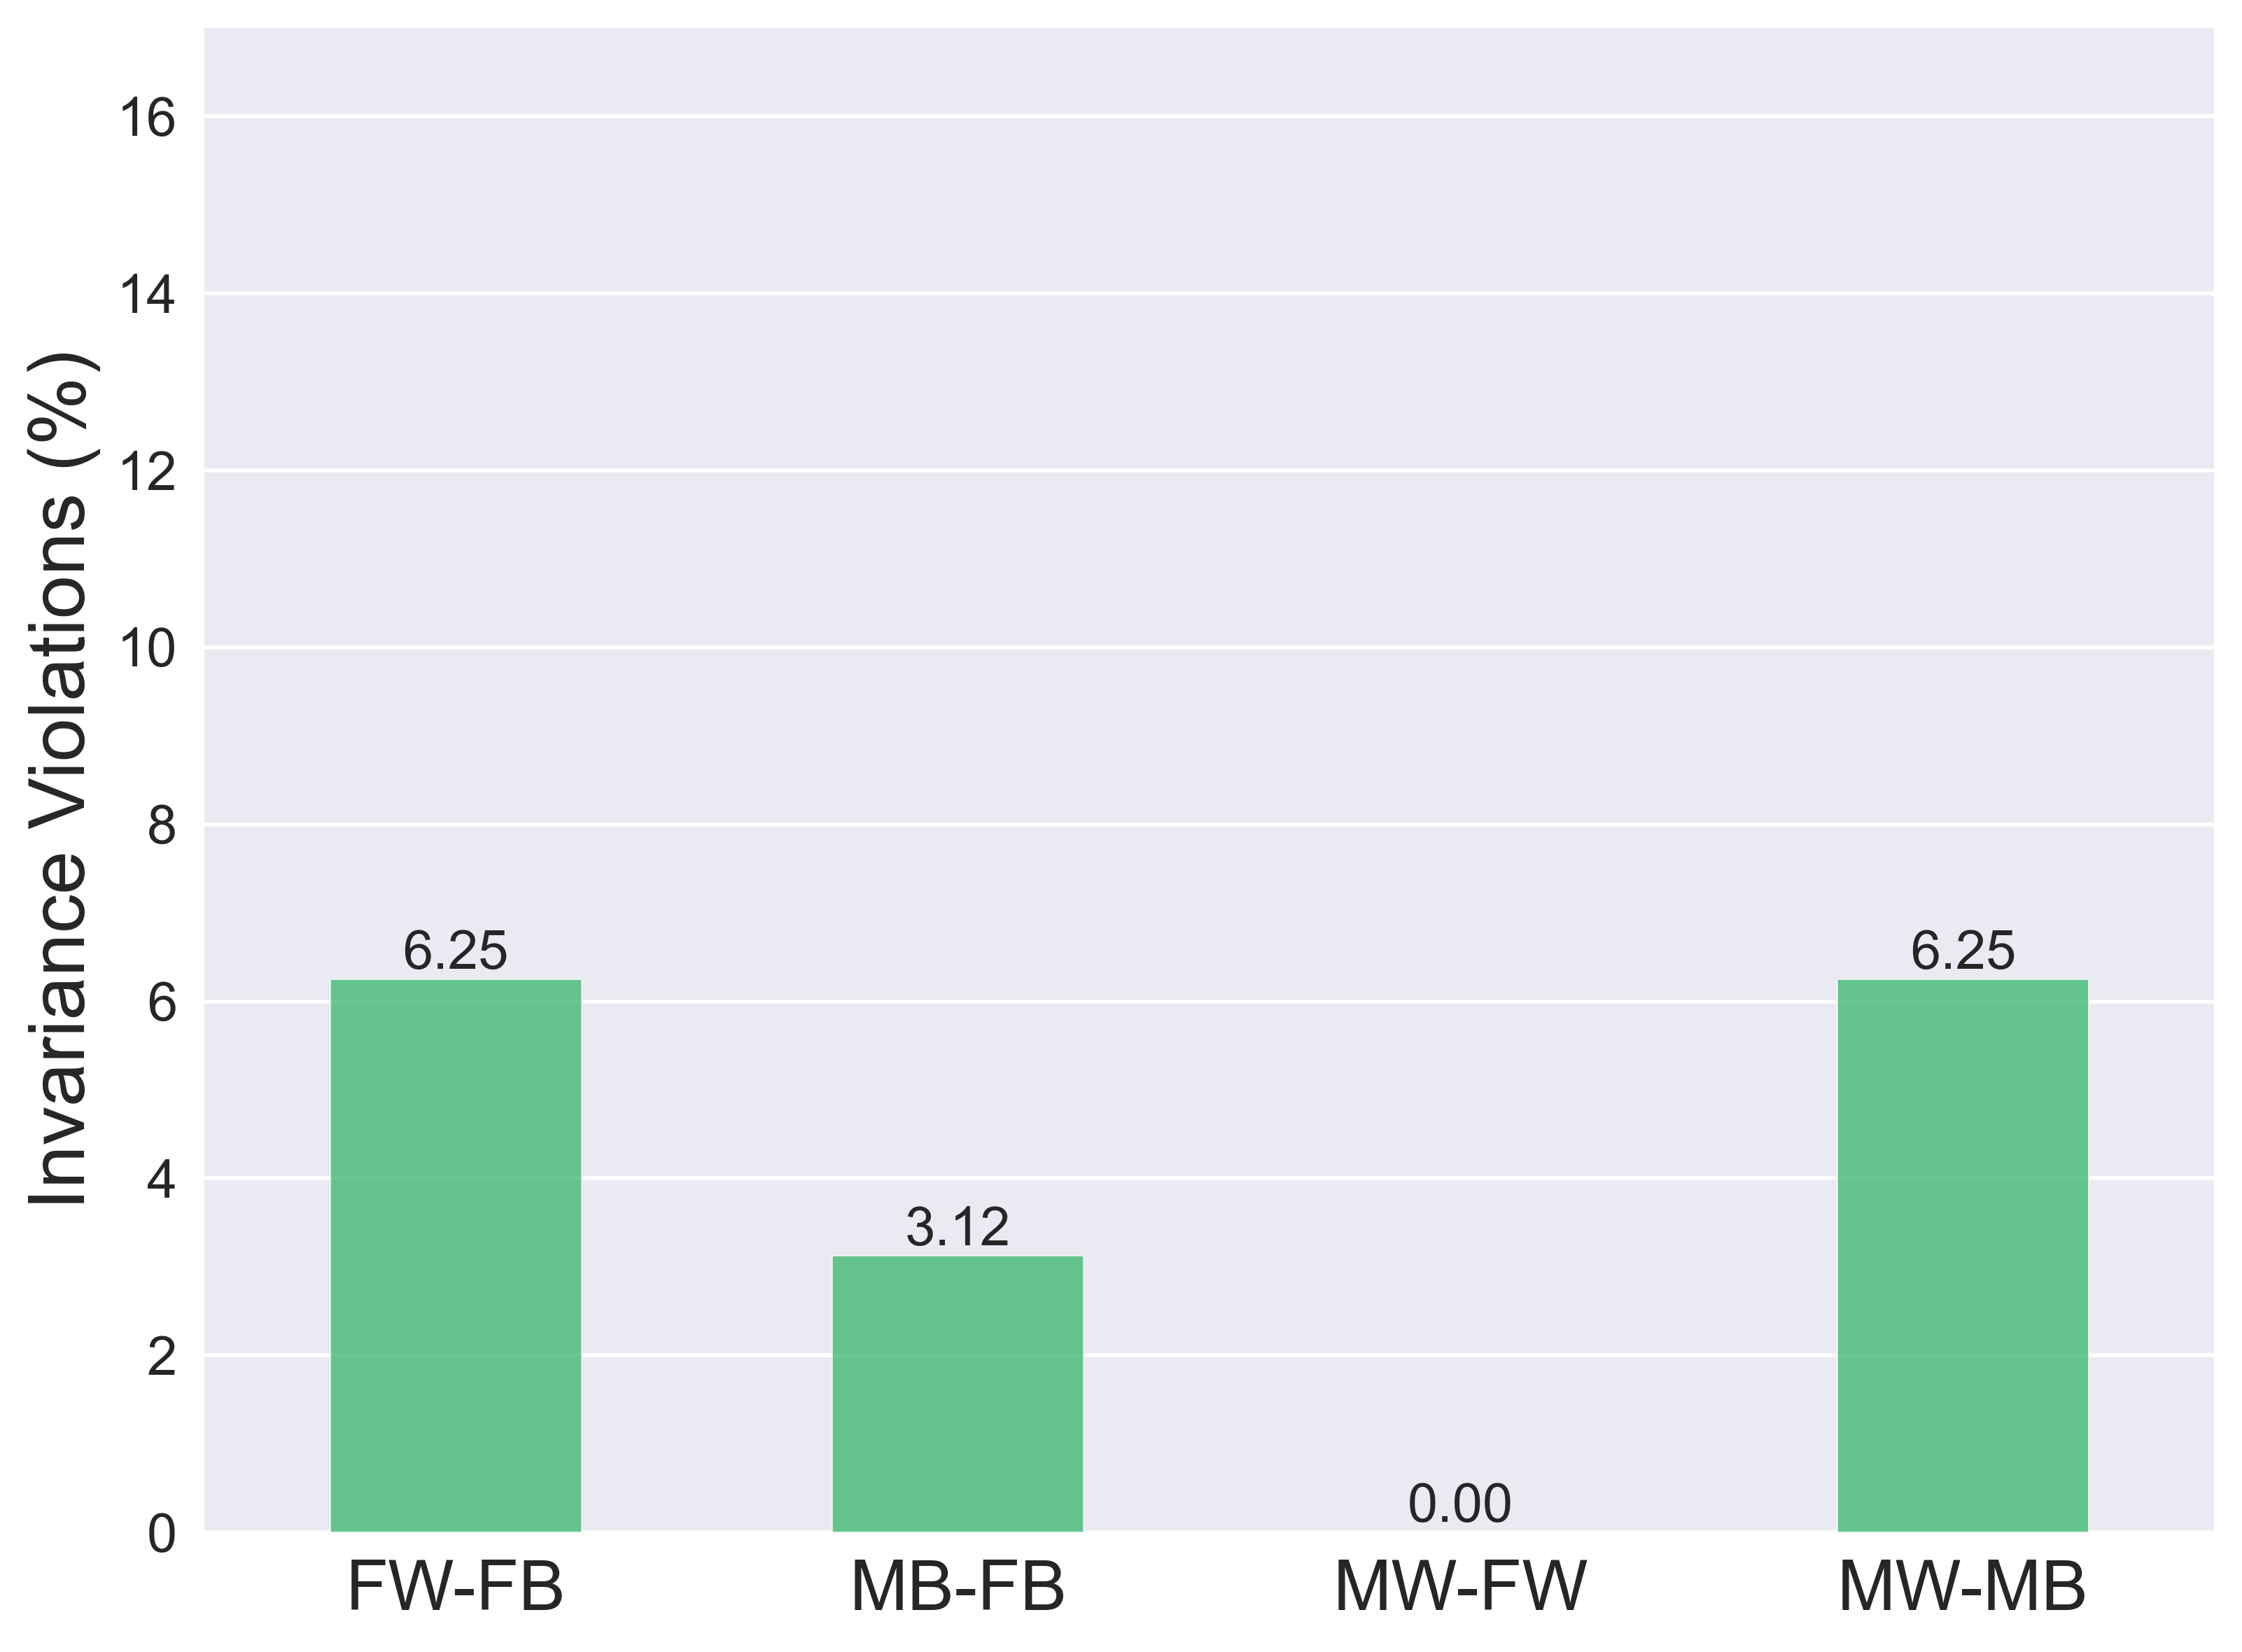
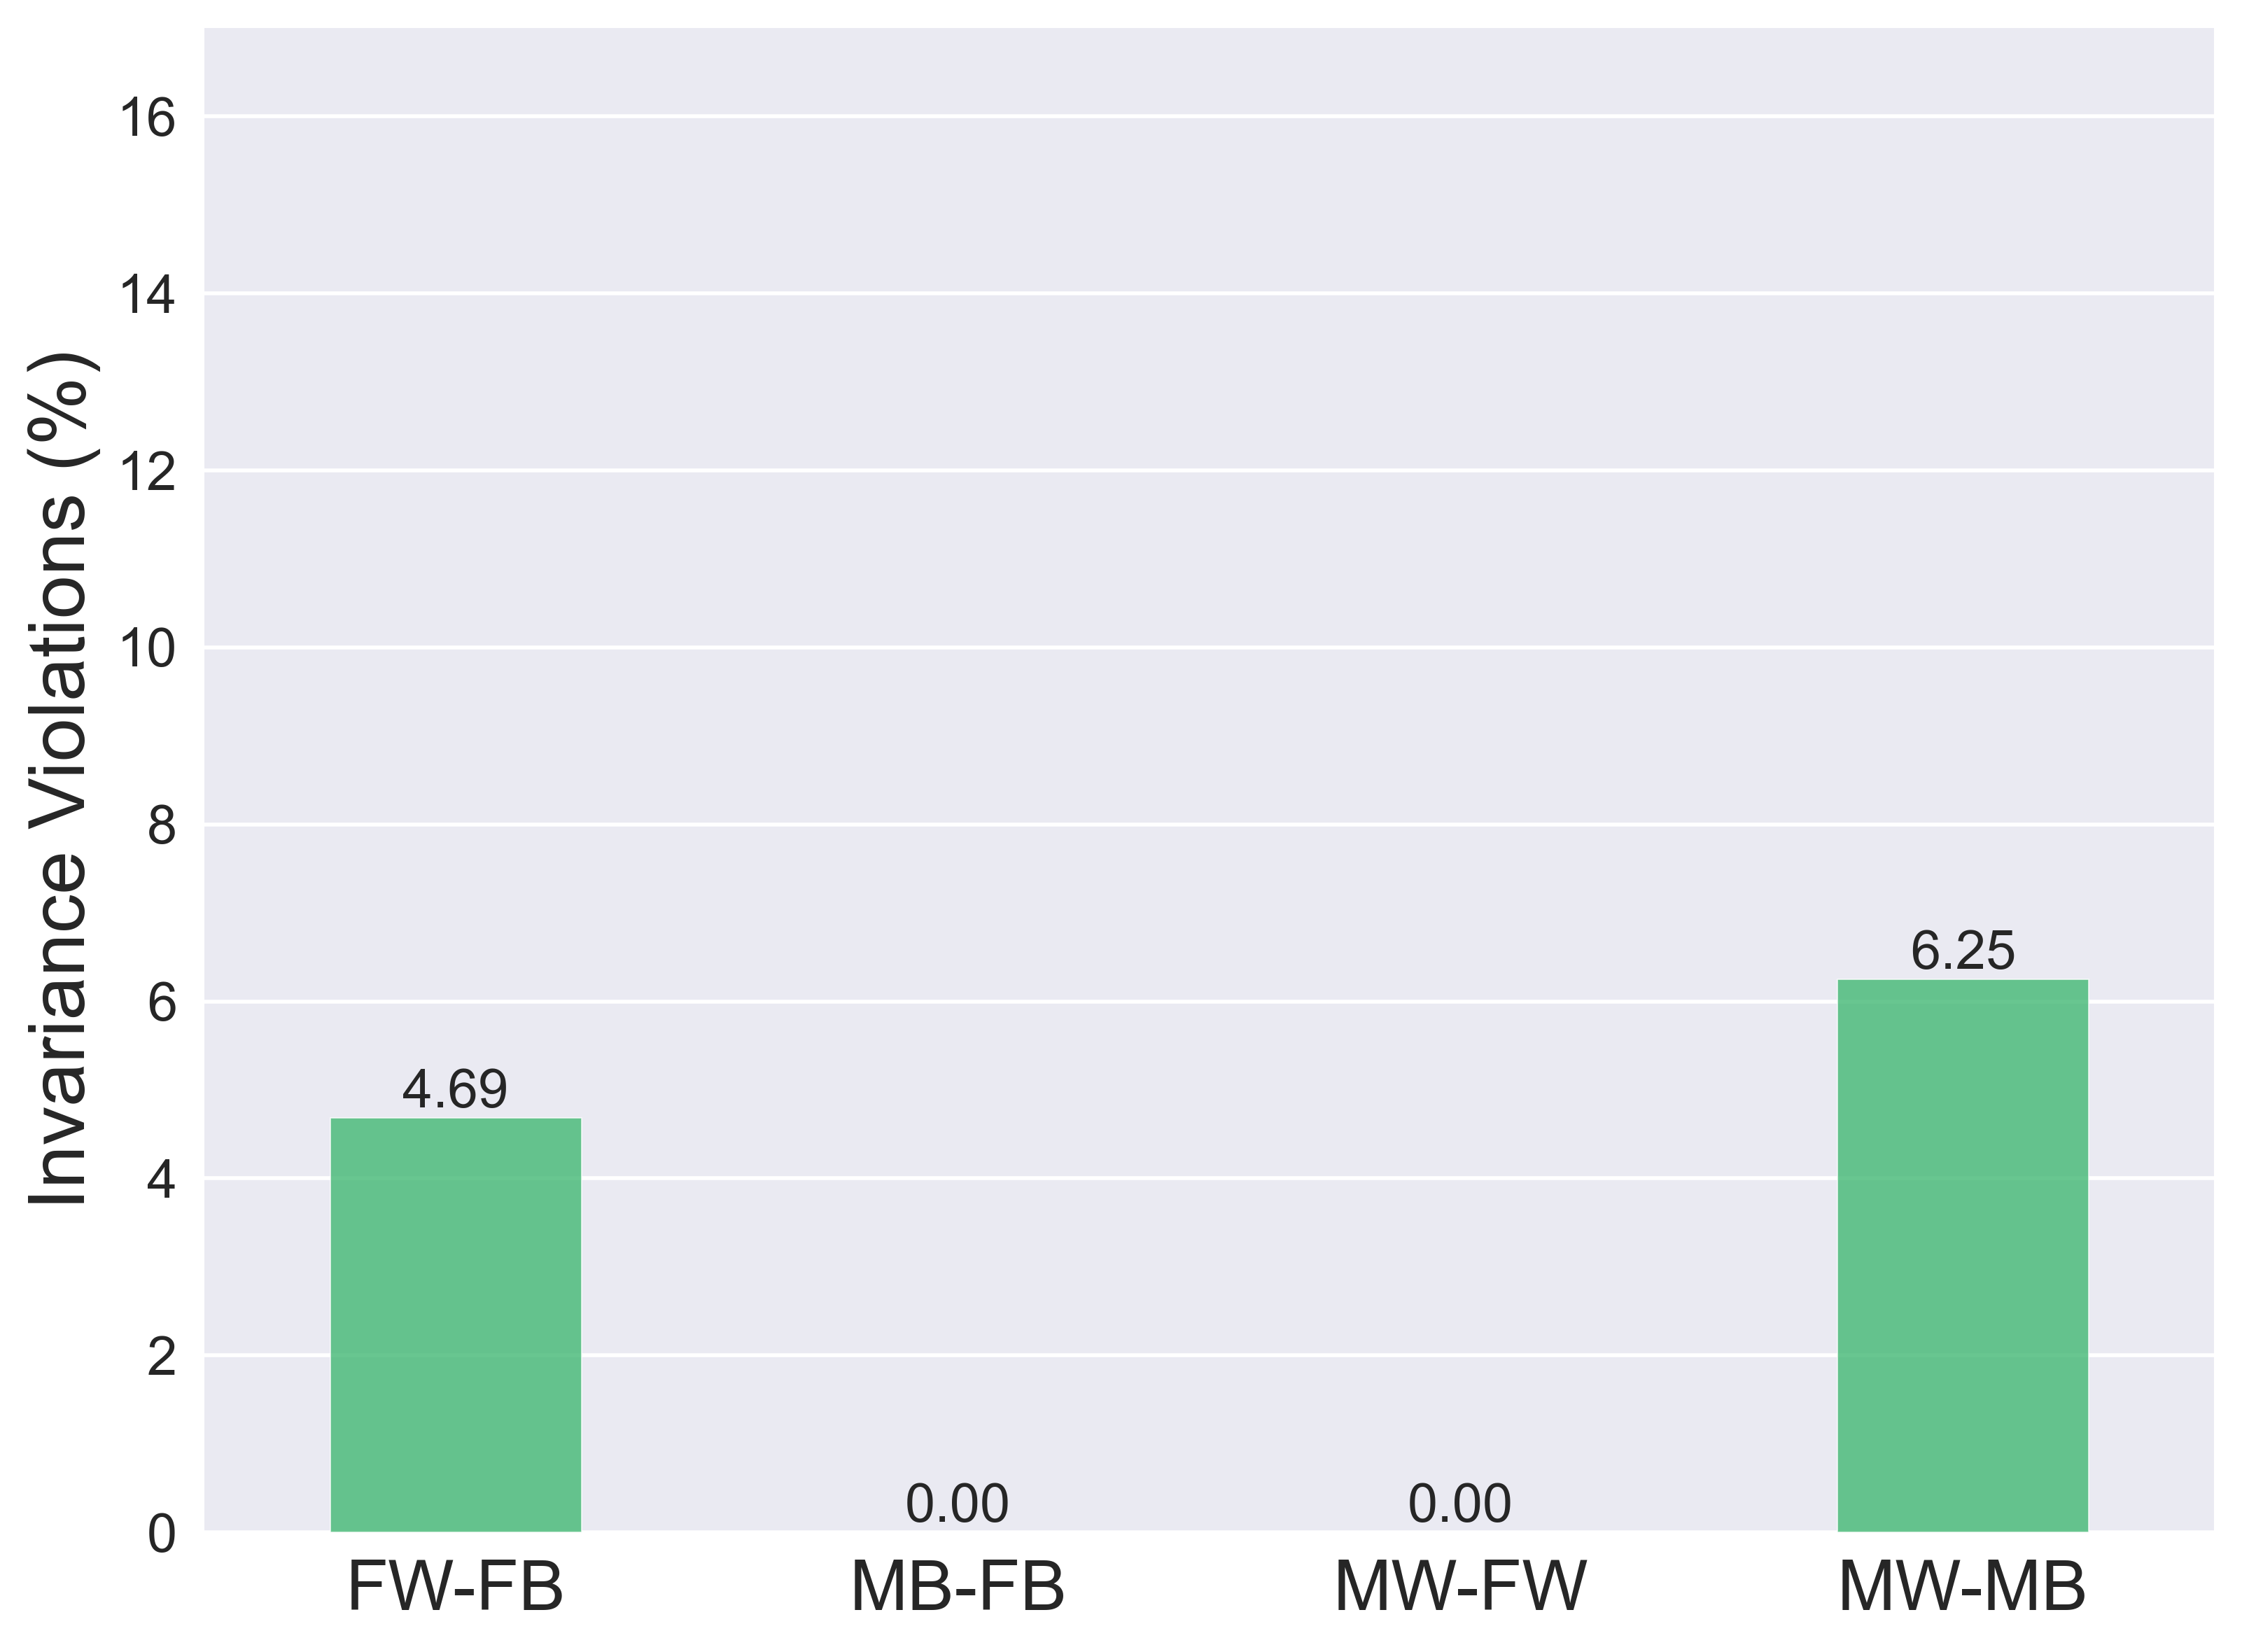
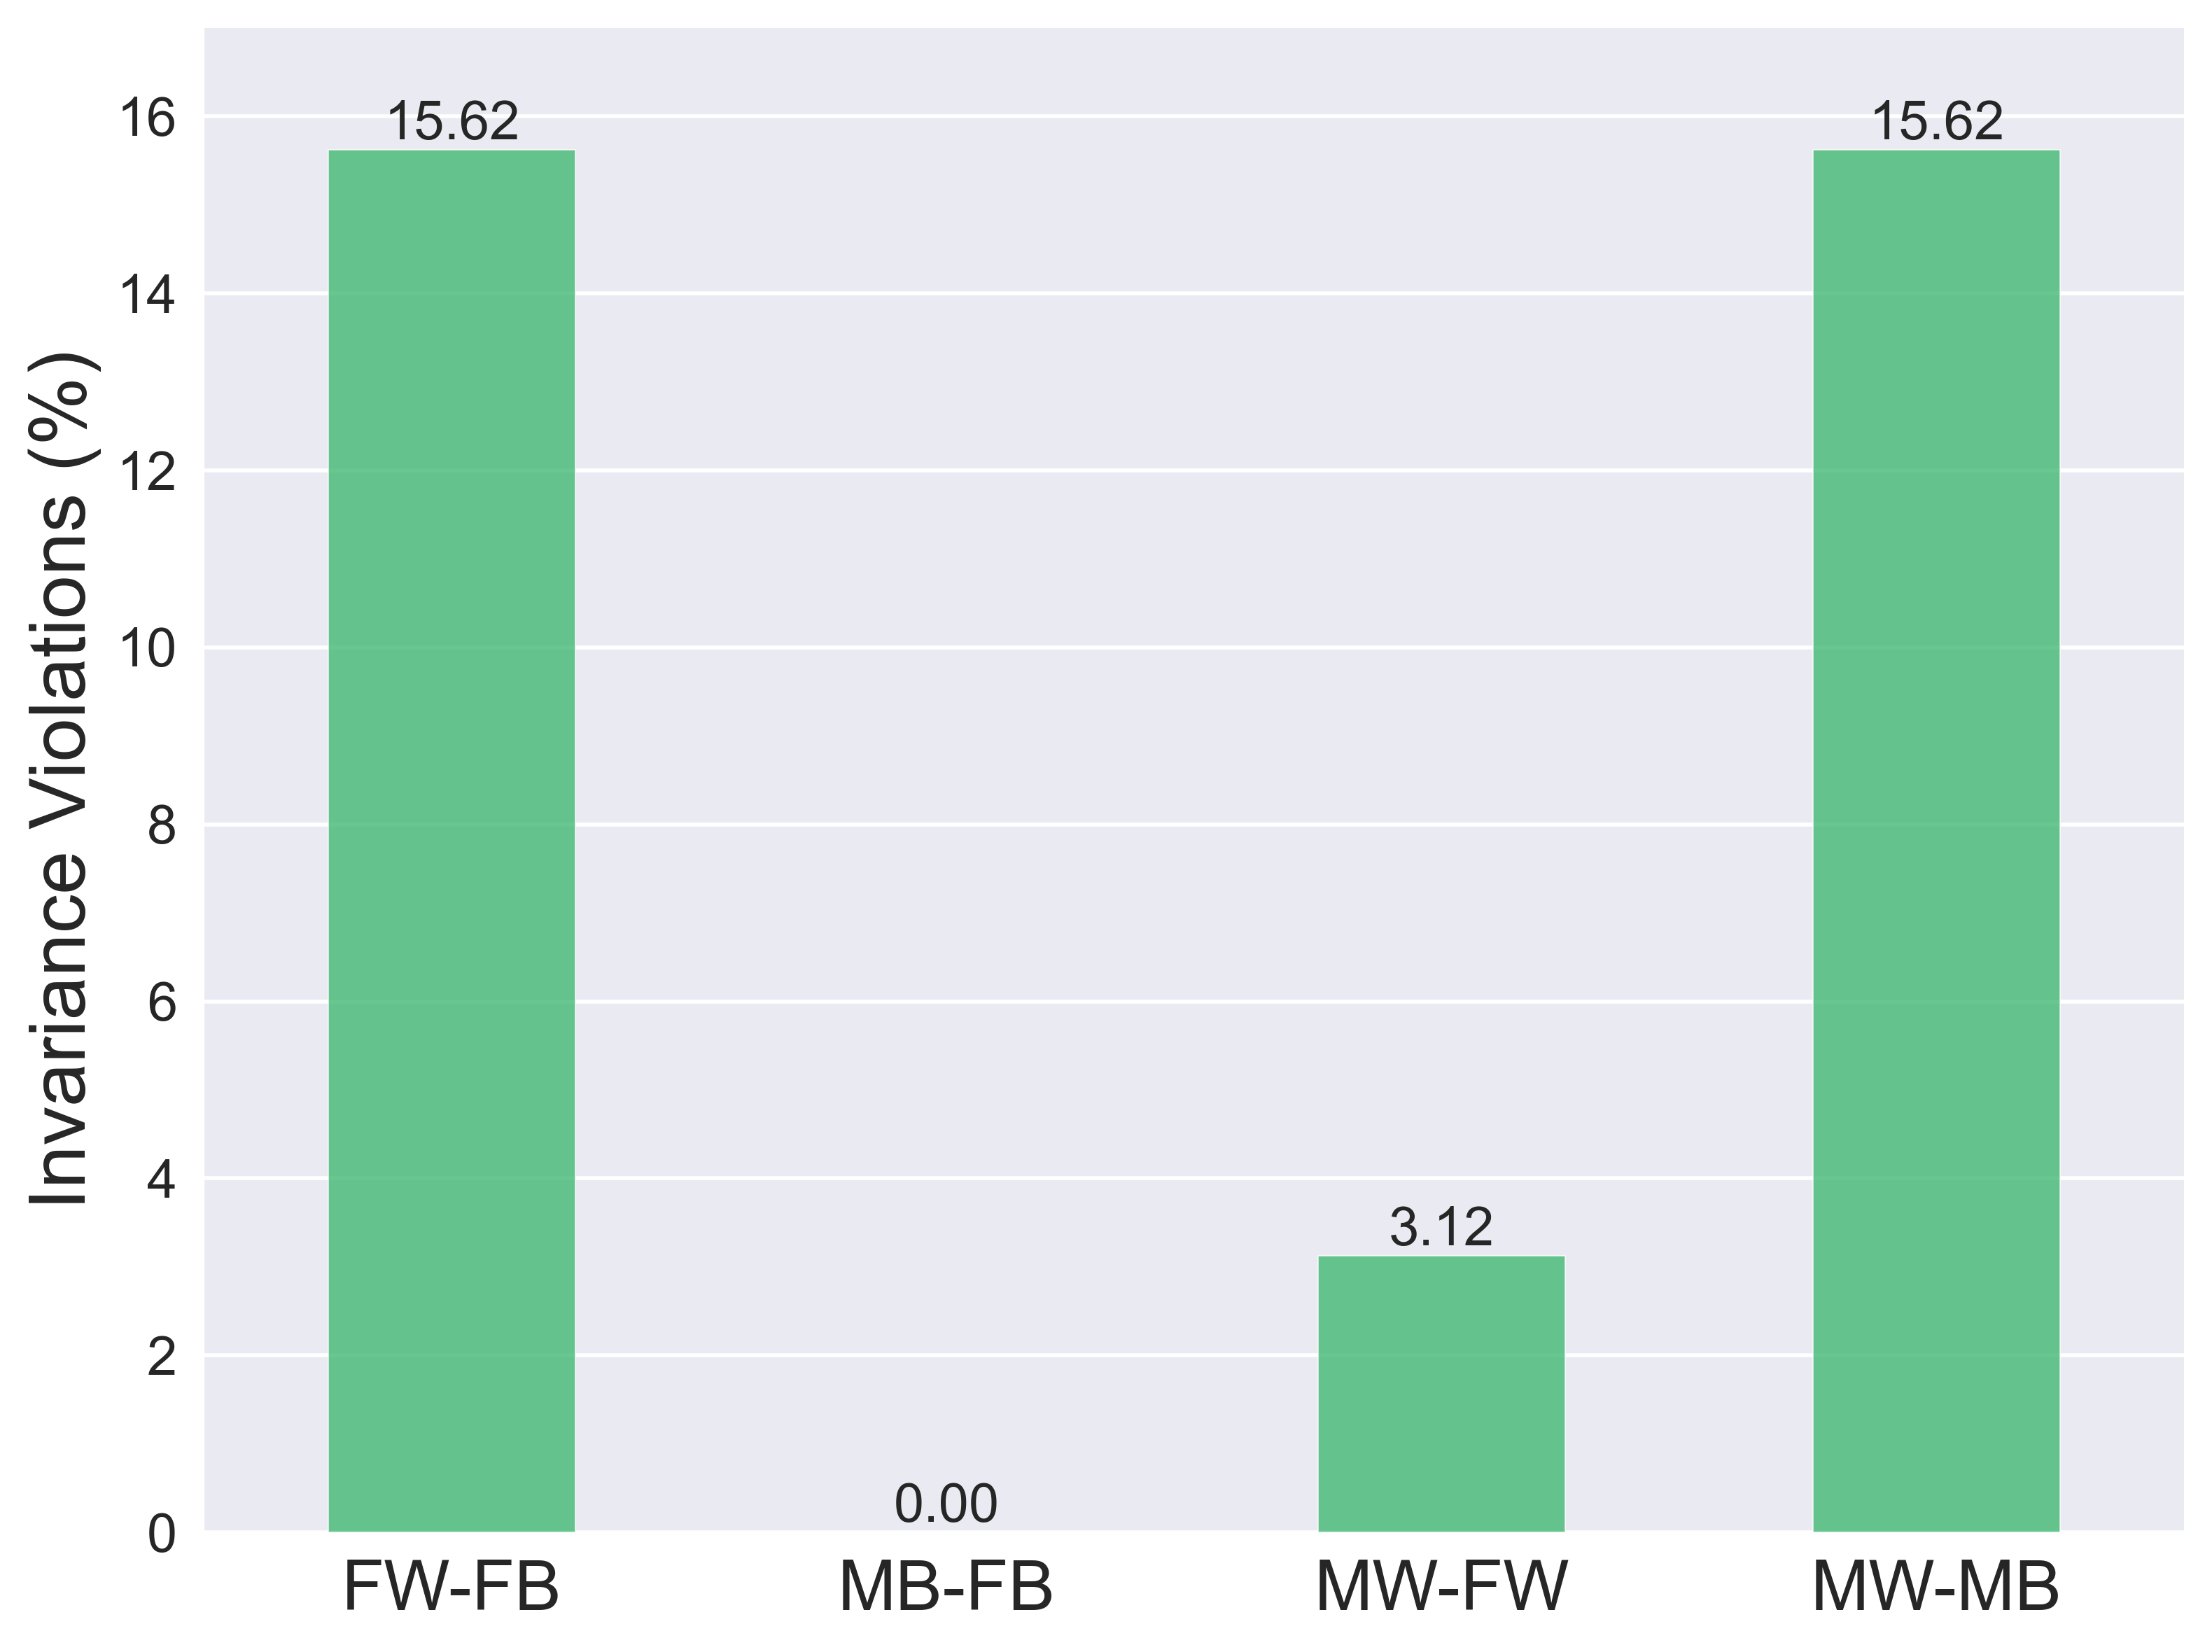
We analyze whether generated summaries differ meaningfully across demographic groups (RQ1) by examining invariance violations, i.e., the percentage of t-tests that yield significant differences in our automated measures. We measure across summaries with different characteristics (length, point of view, and temperature). Figure 1 displays results for generated resumes, grouped by completion model and demographic perturbation.
Mixtral 8x7B exhibits the highest average invariance violations (8.59%), followed by GPT-4o (3.91%) and Command-R (2.74%). All models violate invariance much more for resumes that differ by race vs. gender. For example, the average invariance violations for race perturbations is 15.62% for Mixtral 8x7B, as compared to only 1.56% for gender. In summary, we observe that models exhibit some but not considerable discrepancies between generated summaries for different demographic groups, with different models having potentially large differences in sensitivity.
4.2 Retrieval
We now shift to a retrieval setting and ask: do models exhibit fairness issues in resume retrieval? Our analysis tackles this question from both a distributional (RQ2) and robustness (RQ3) perspective.
4.2.1 Non-Uniformity
Do models disparately select resumes across demographic groups?
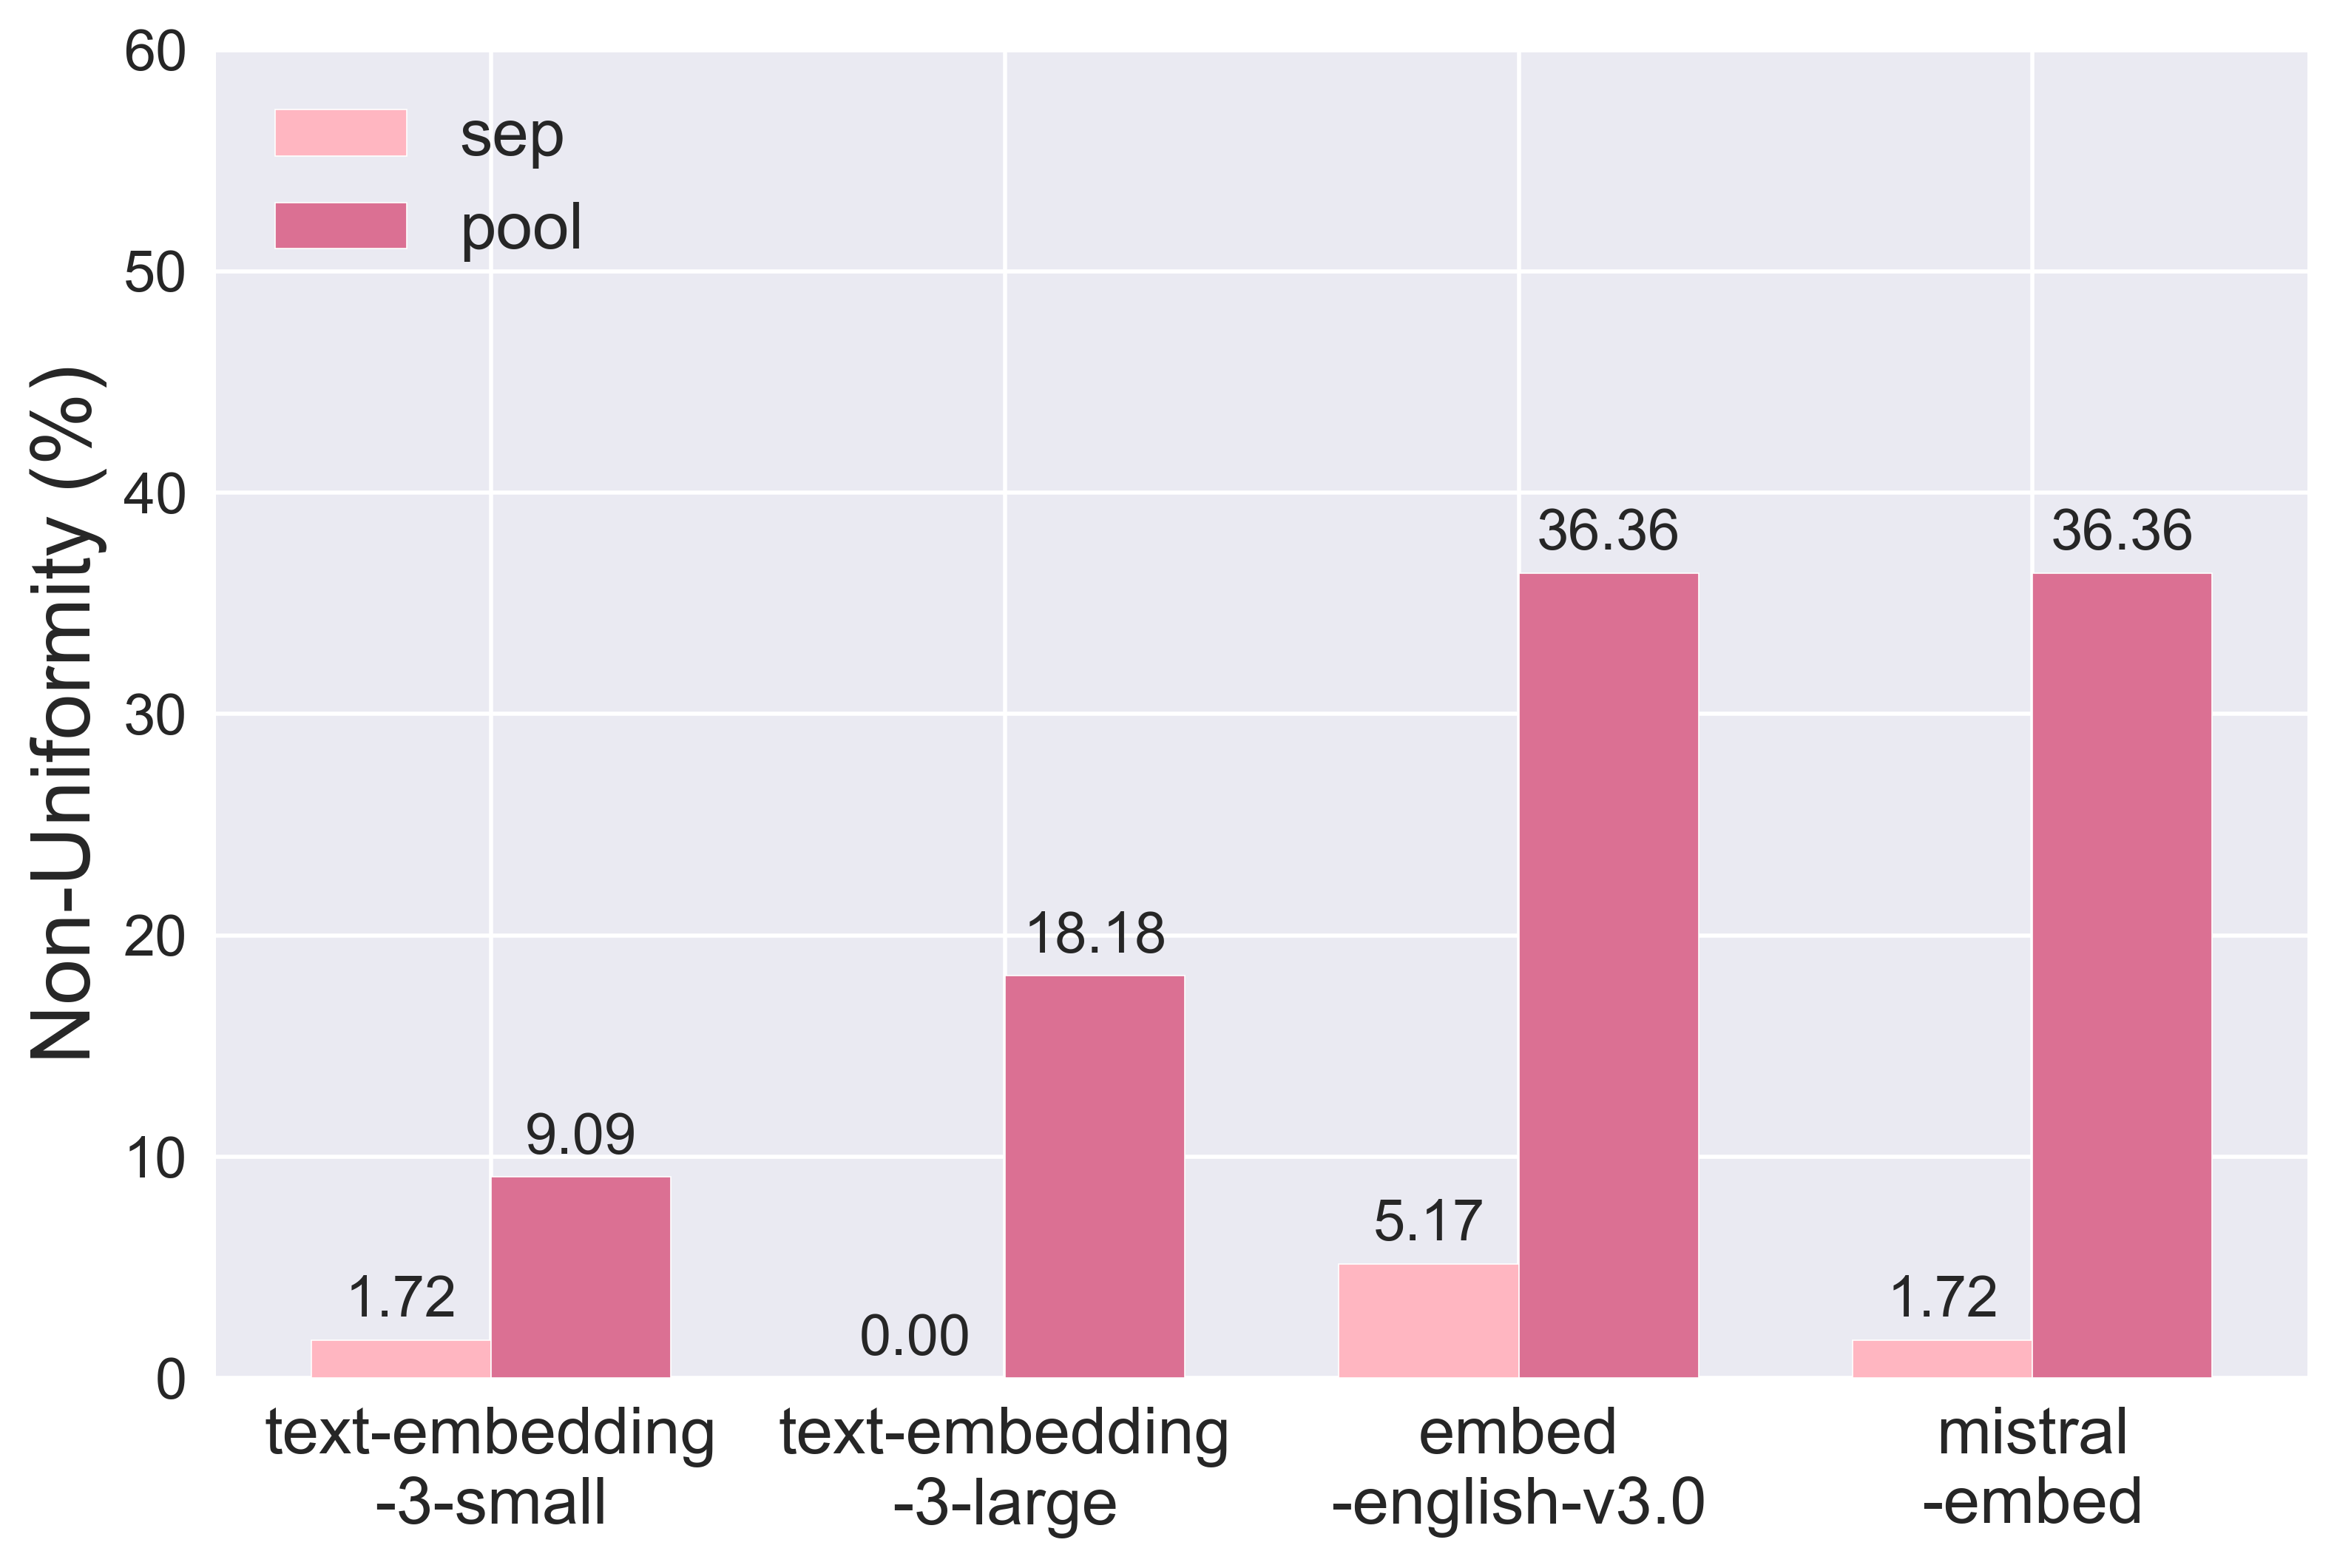
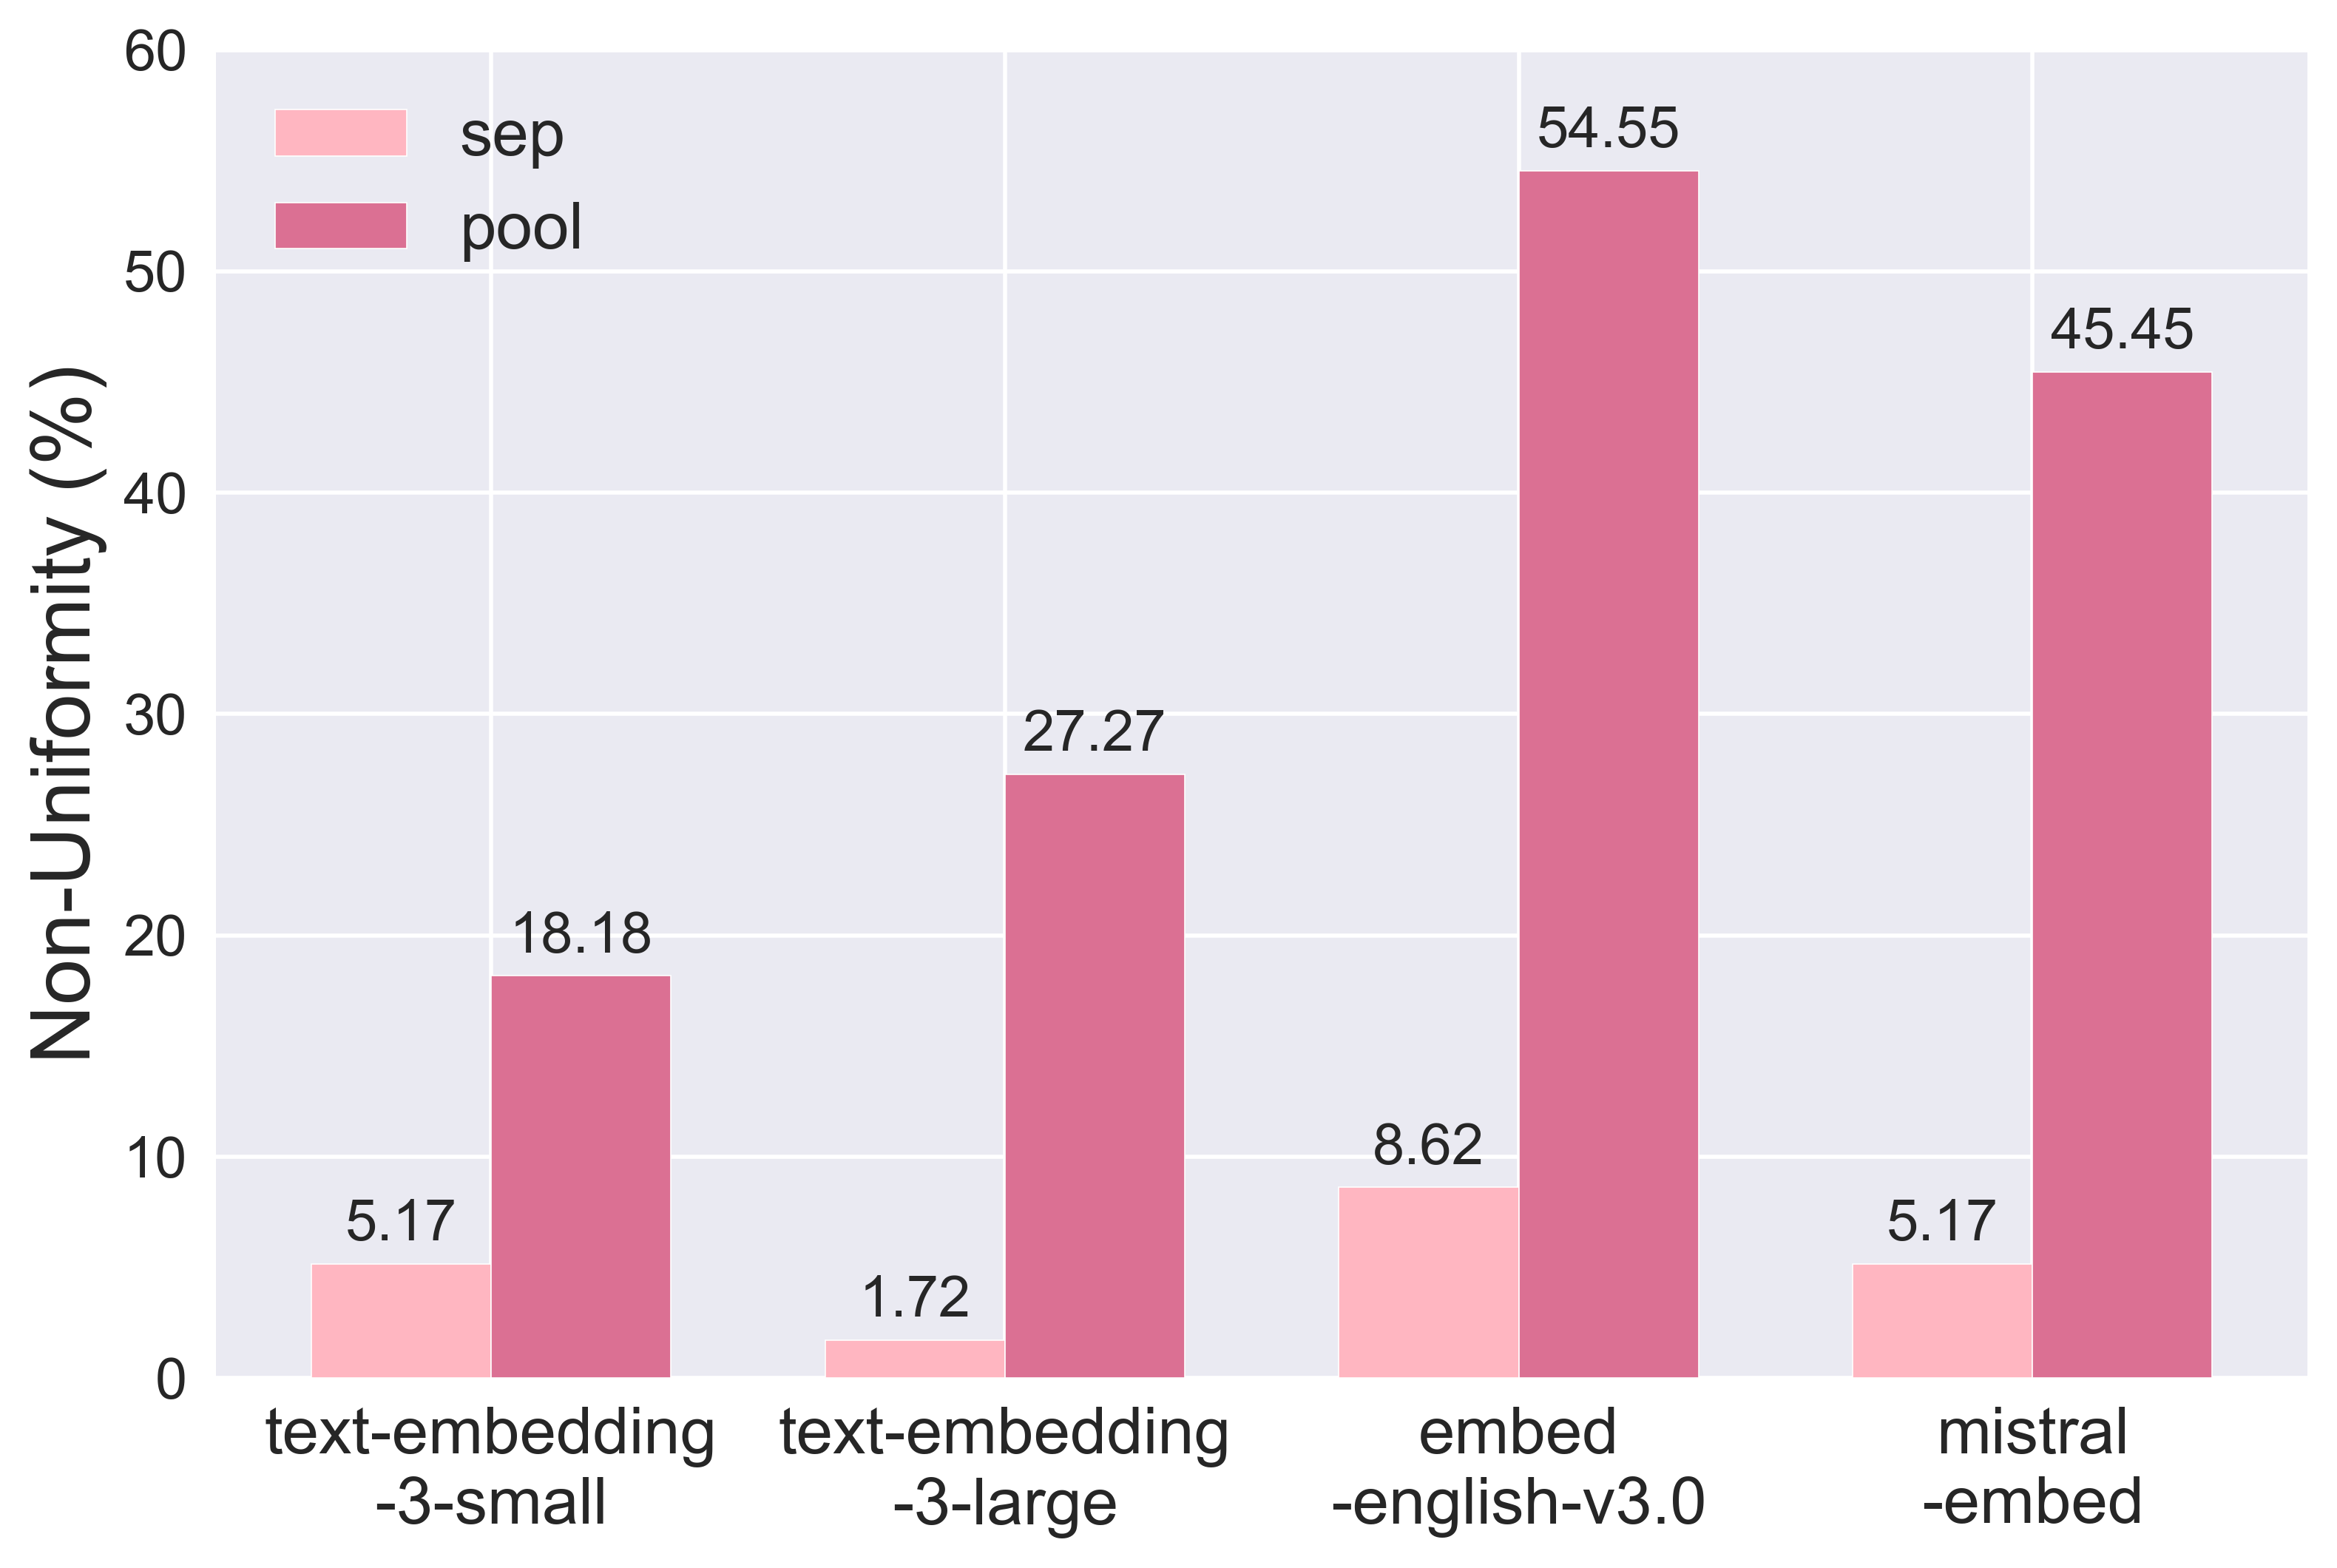
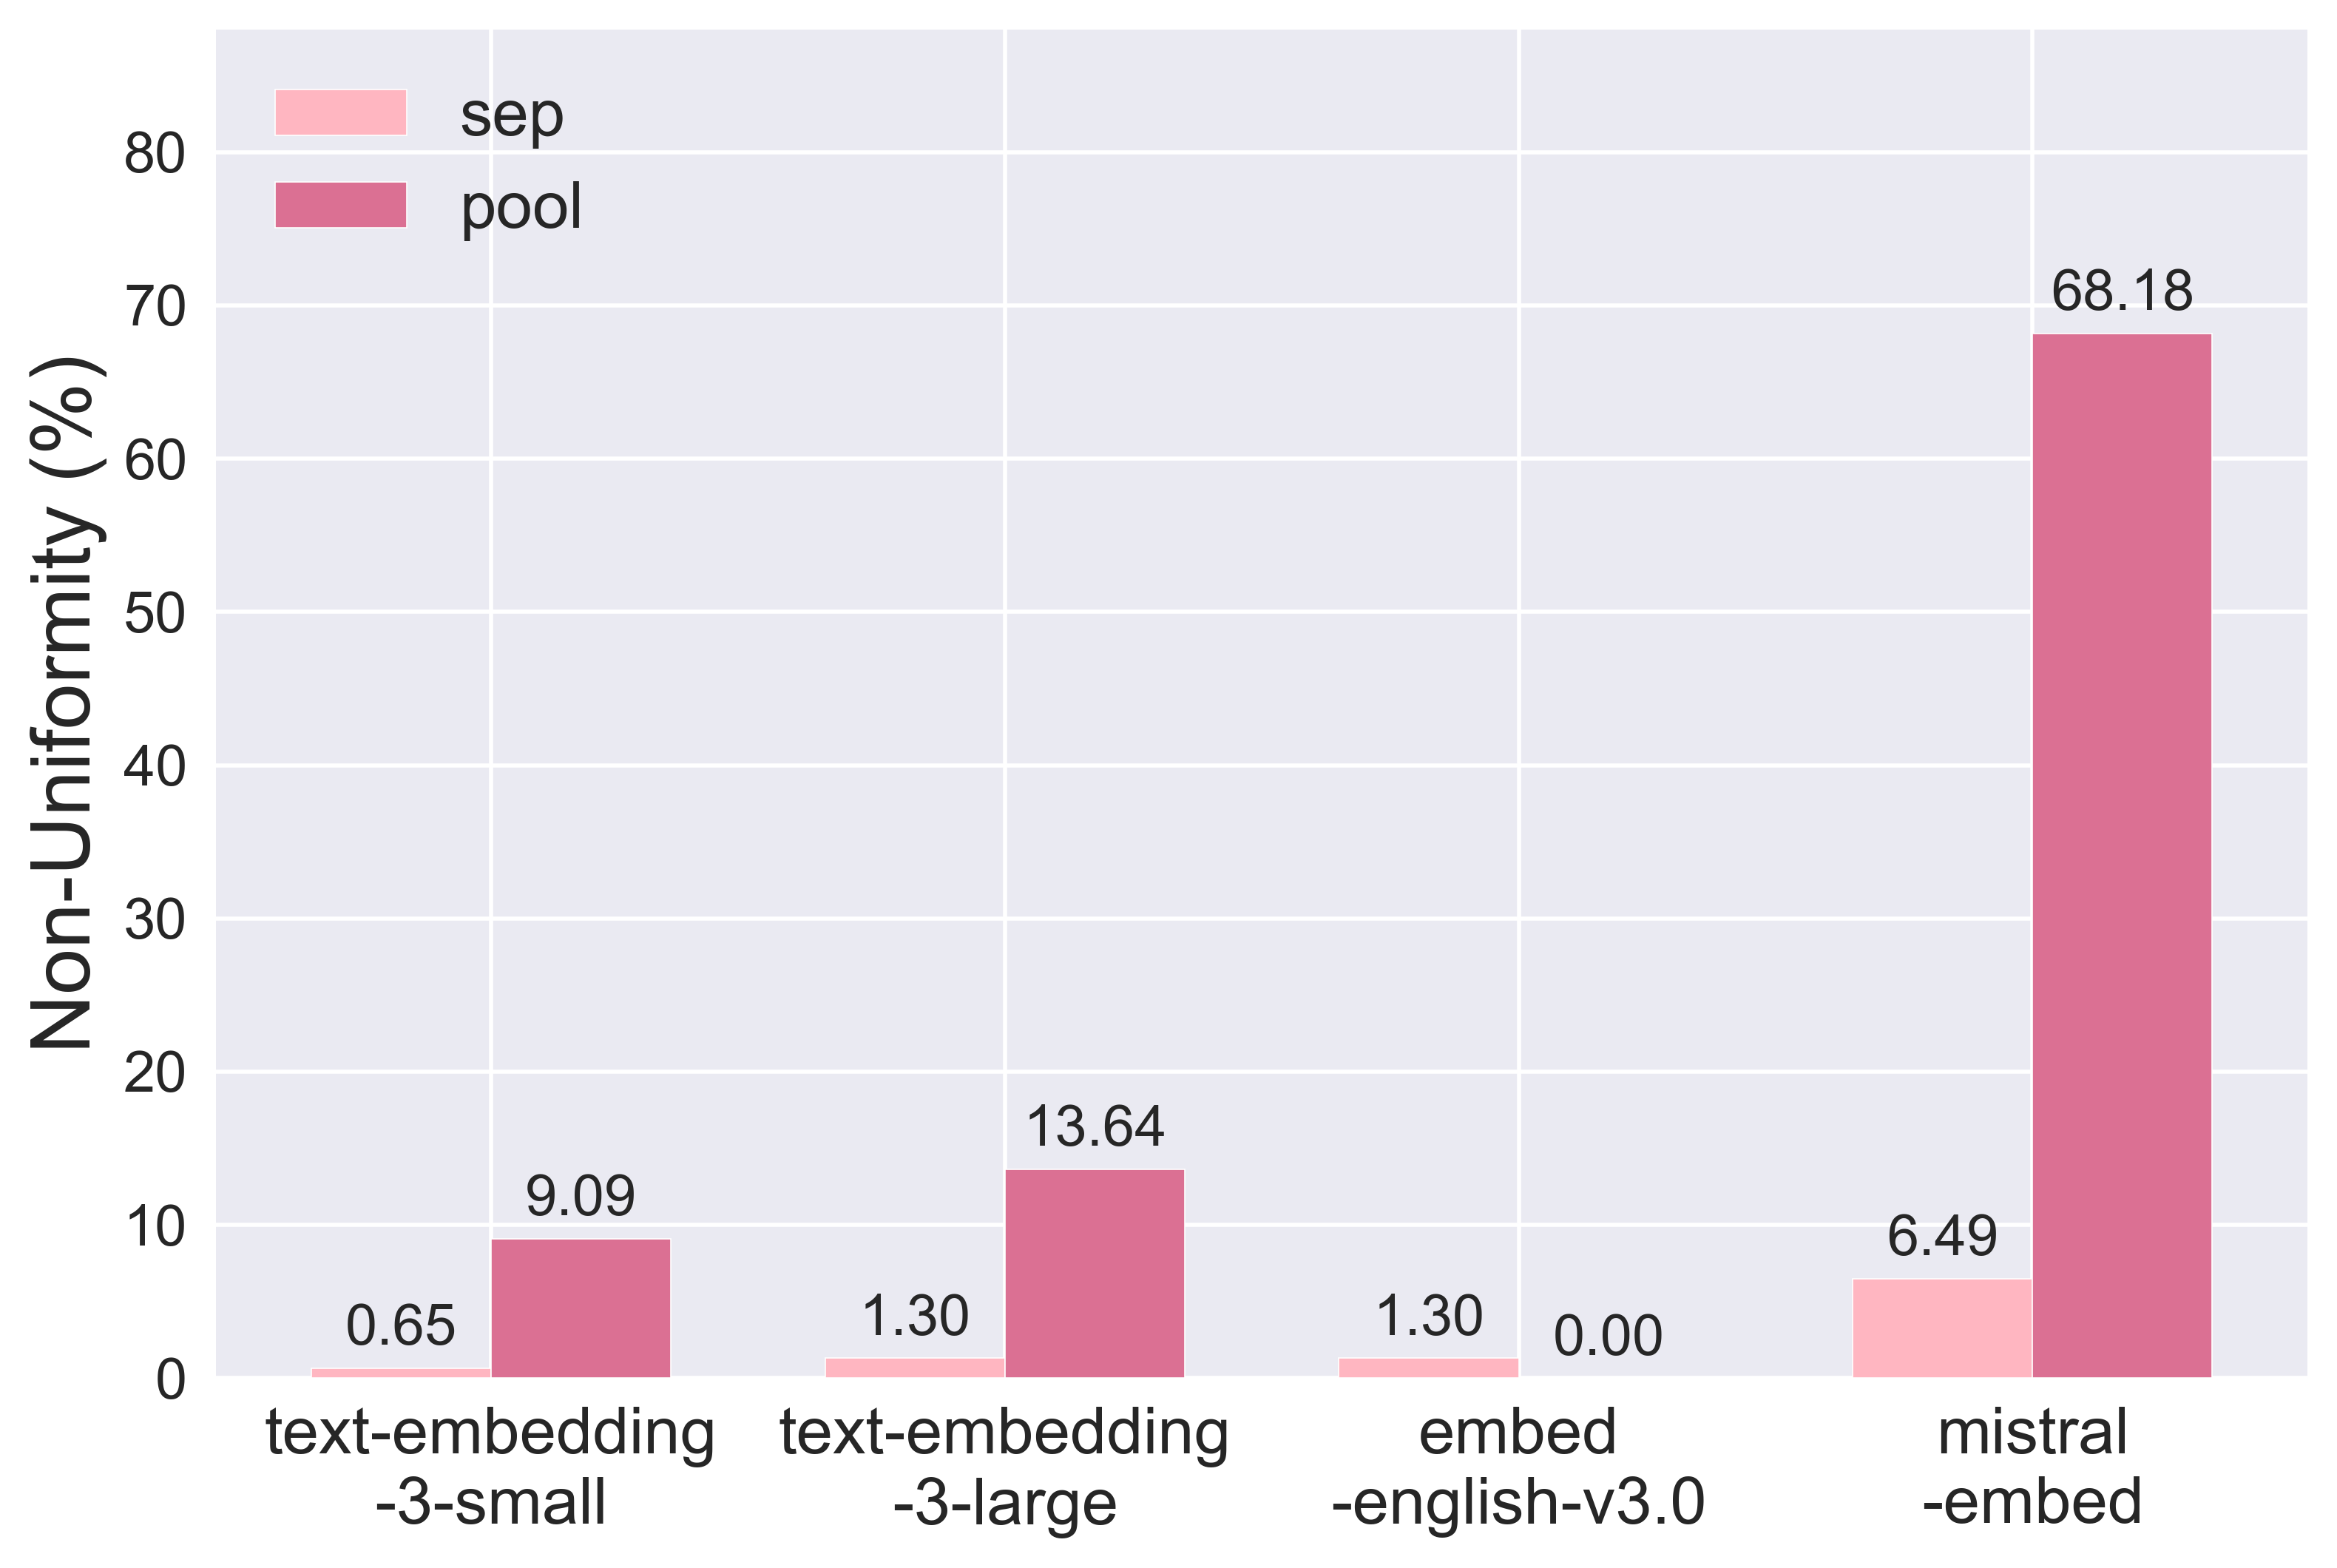
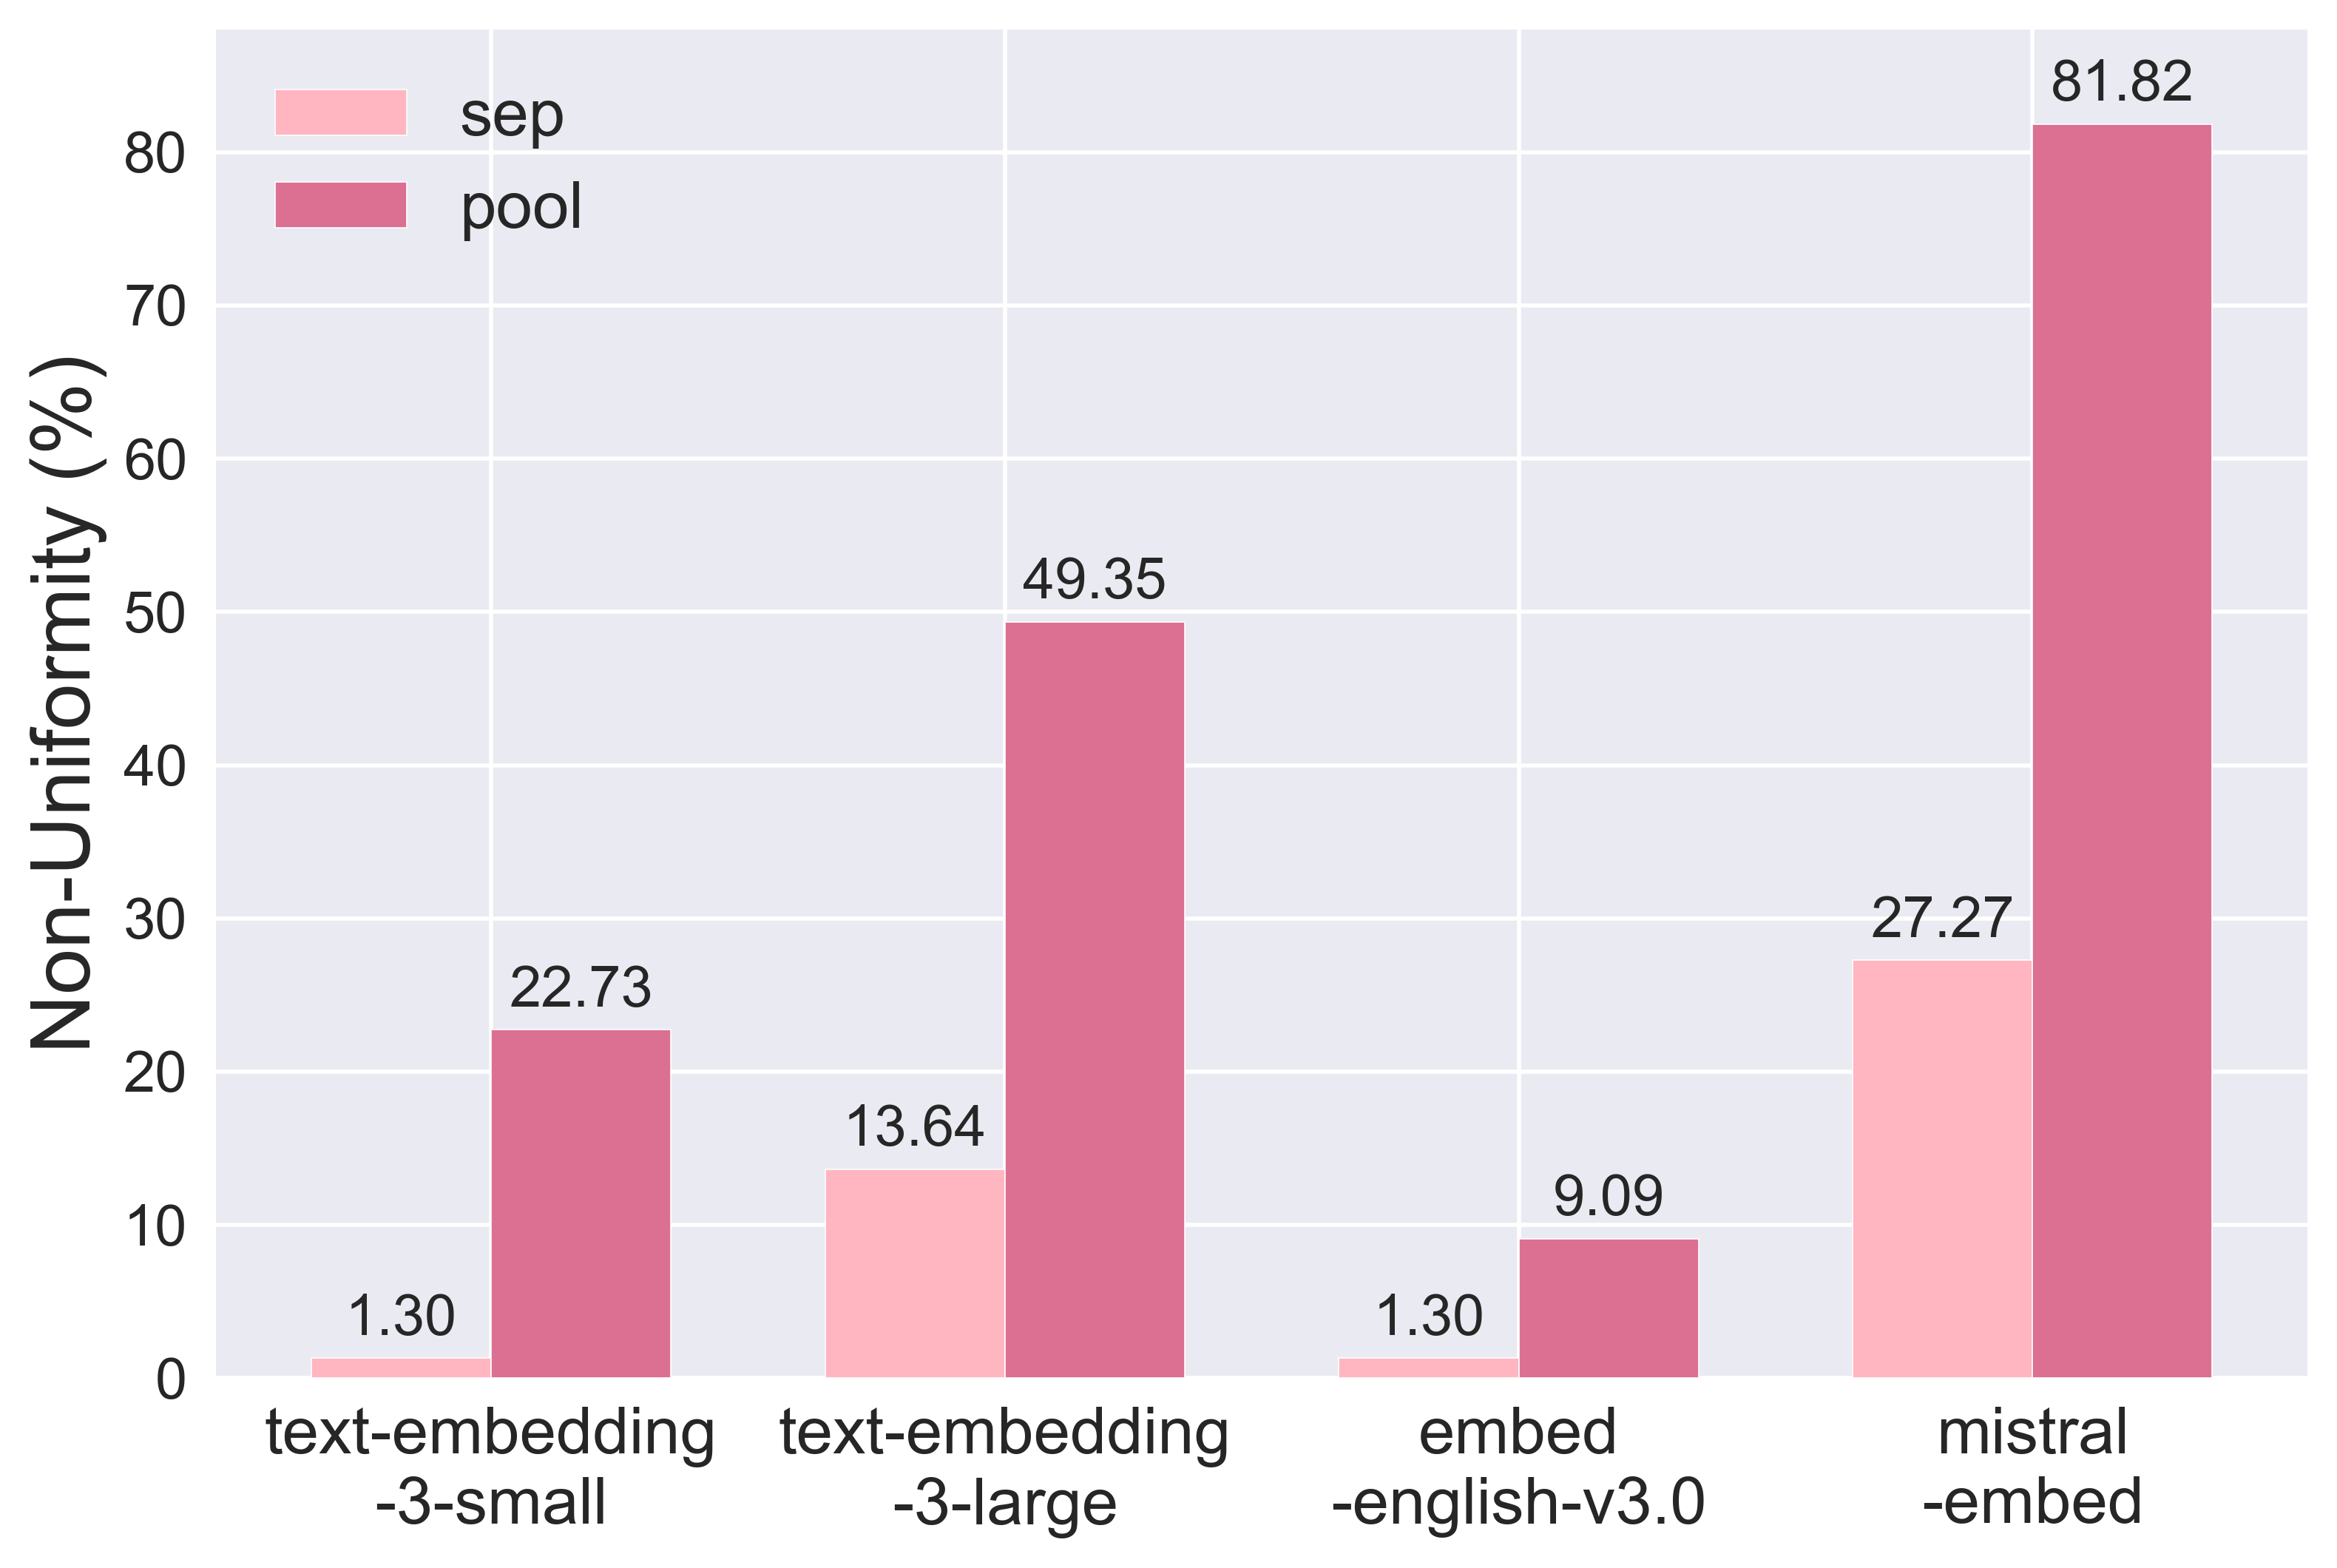
We compute non-uniformity (i.e., how often top retrieved resumes have non-uniform demographic distributions). Non-uniformity differs considerably across models, choice of top- percent, and whether or not resumes are pooled across occupations (Figure 2).
We observe that embed-english-v3.0 exhibits the highest non-uniformity on average, where 6.90% of job posts and 45.45% of occupations have non-uniformly distributed resumes. We see that increasing top- from 5% to 10% and pooling resumes both yield higher non-uniformity across all models. In particular, pooling resumes across occupations can produce massive changes – for example, we see that on average across models, non-uniformity goes from 3.66% 30.68% after pooling, resulting in a nearly 750% increase. However, this reflects a sensitivity in the metric itself more than a change in the shape of the distribution. Increasing top- and pooling both increase sample size, which can lead to rejecting the null hypothesis that the distribution is uniform in cases where the null hypothesis previously failed to be rejected.
Different models demonstrate distinct patterns of bias. For example, when considering the highest represented groups in the top-10% of resumes with respect to each job post, White females are the top group in 37 job posts (48.05%), while Black males are the top group in only 3 job posts (3.90%) for embed-english-v3.0. In contrast, for mistral-embed, White males are the top group in 56 job posts (72.73%), while White females are the top group in only 4 job posts (5.19%). We cannot determine why such differences exist without access to datasets or training details, but it is notable and somewhat surprising that models do not uniformly prefer one demographic group over the other.
4.2.2 Exclusion
How sensitive are models to gender and race perturbations?
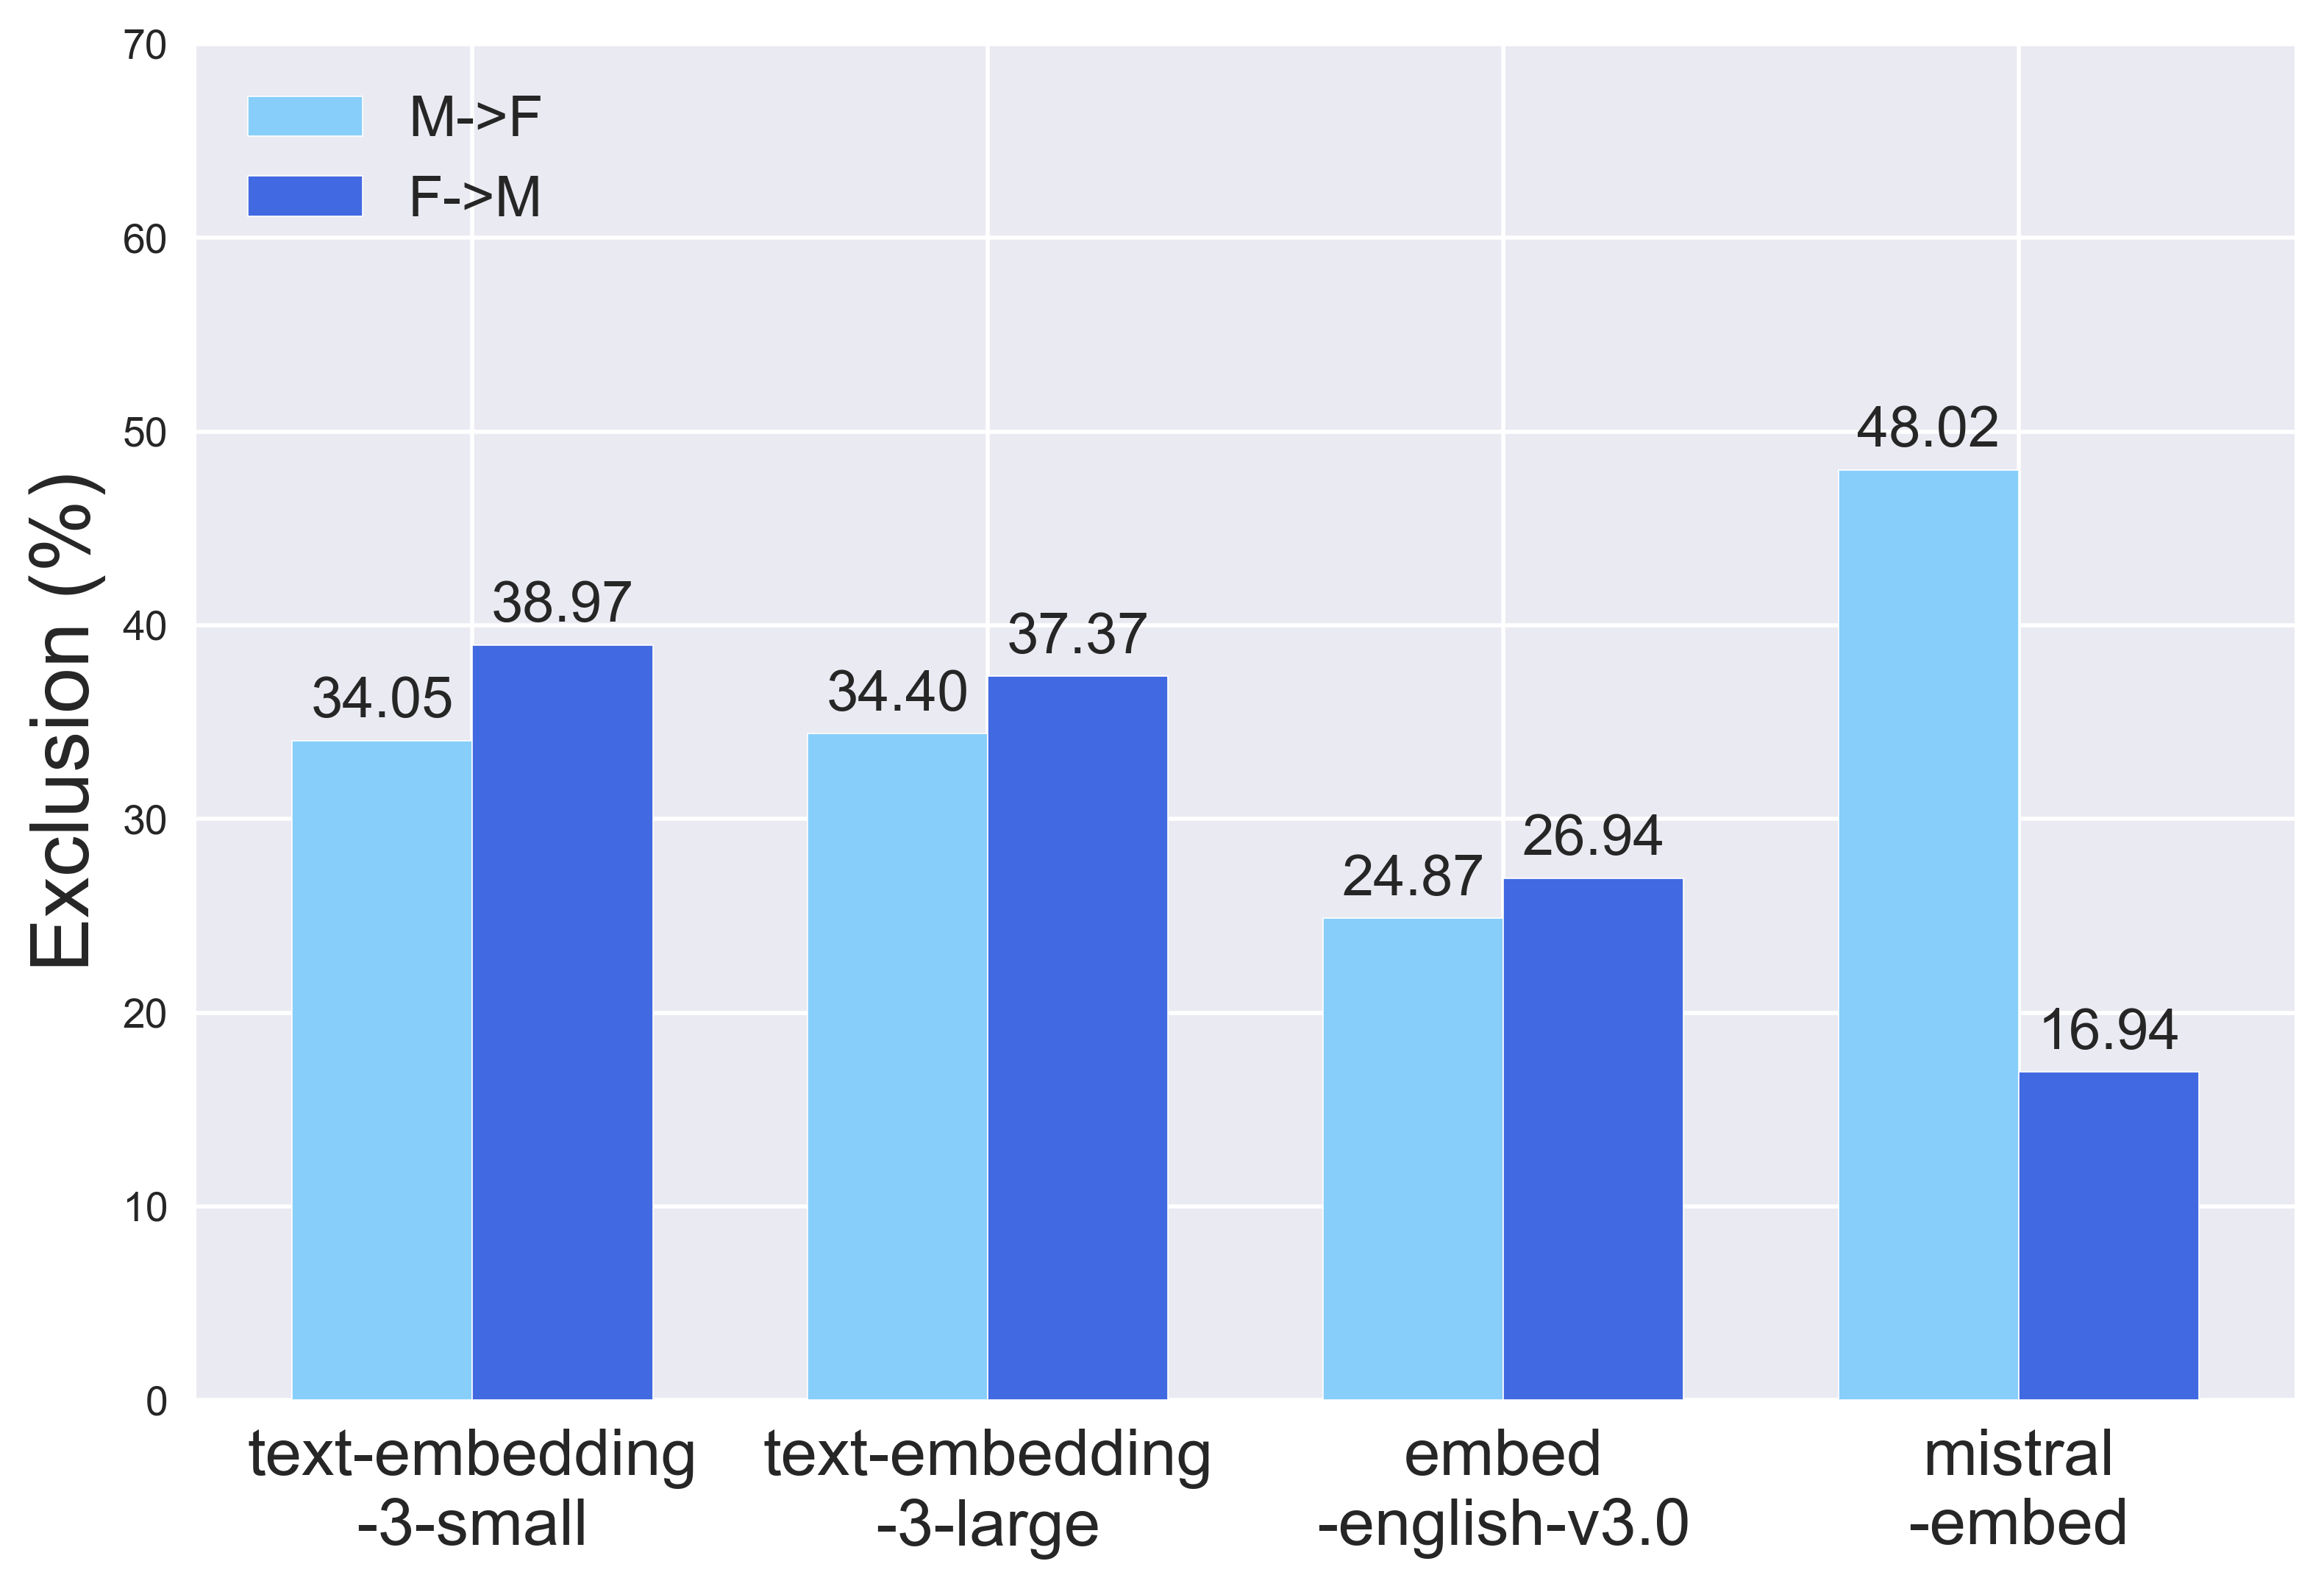
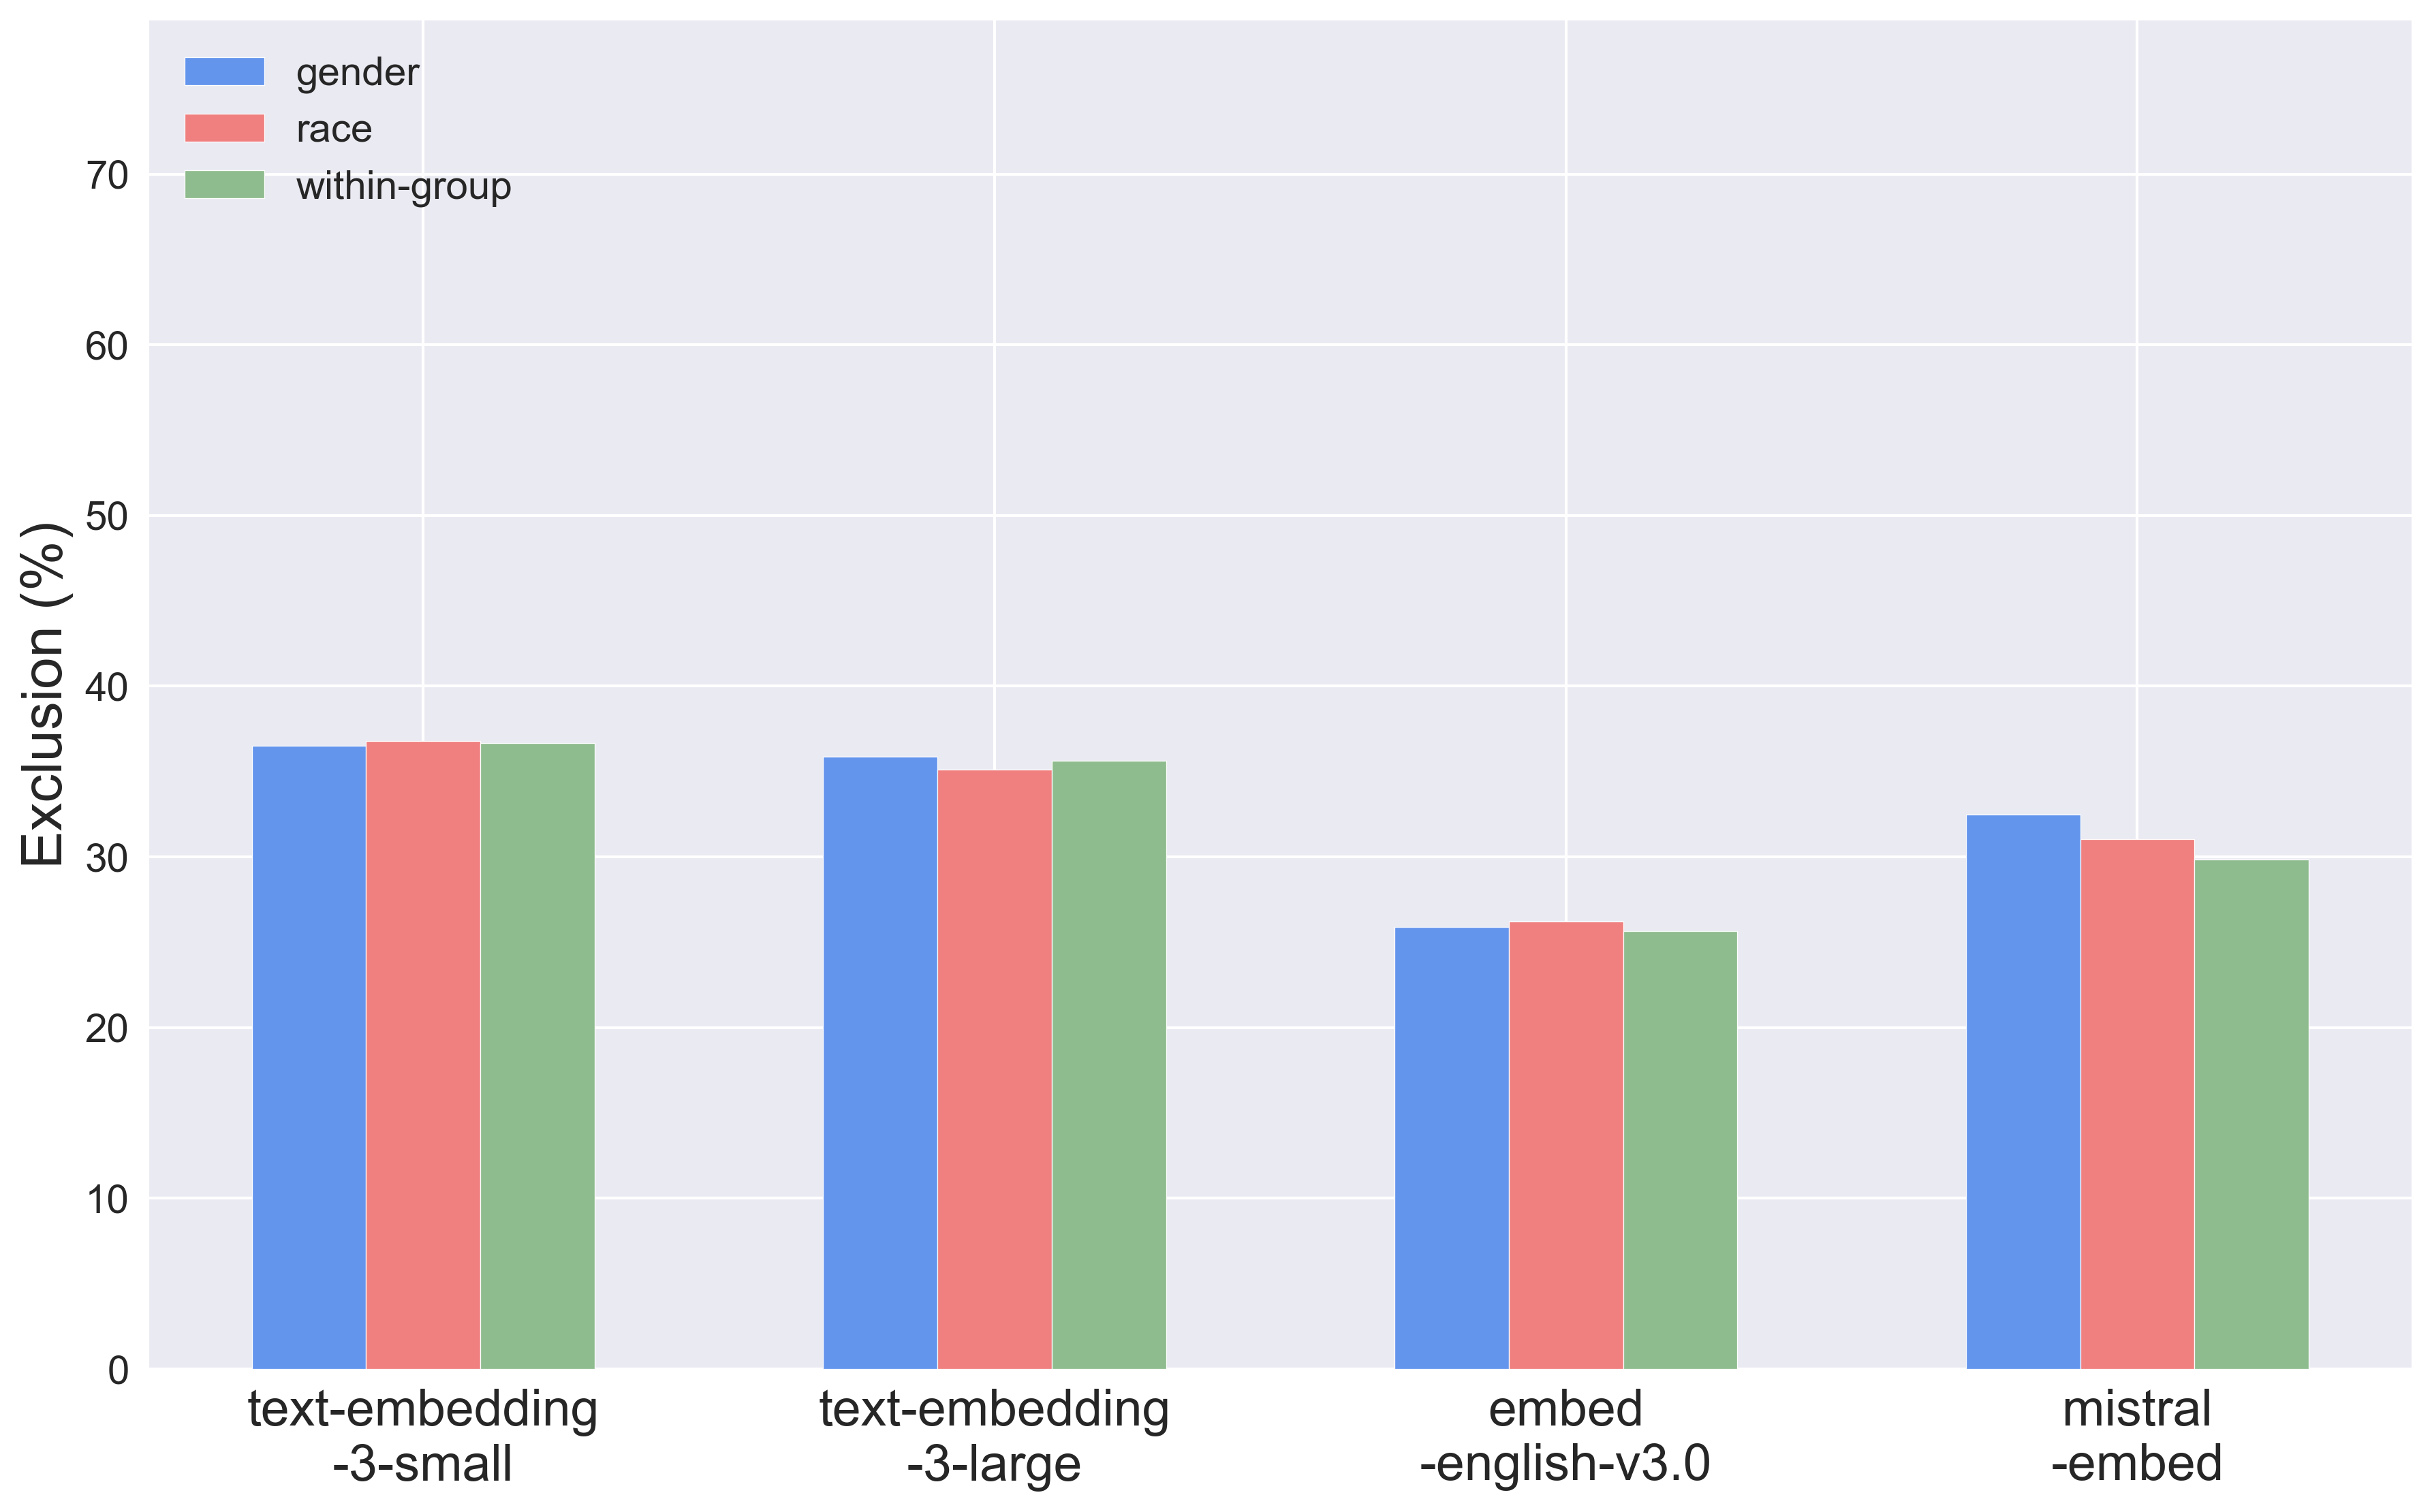
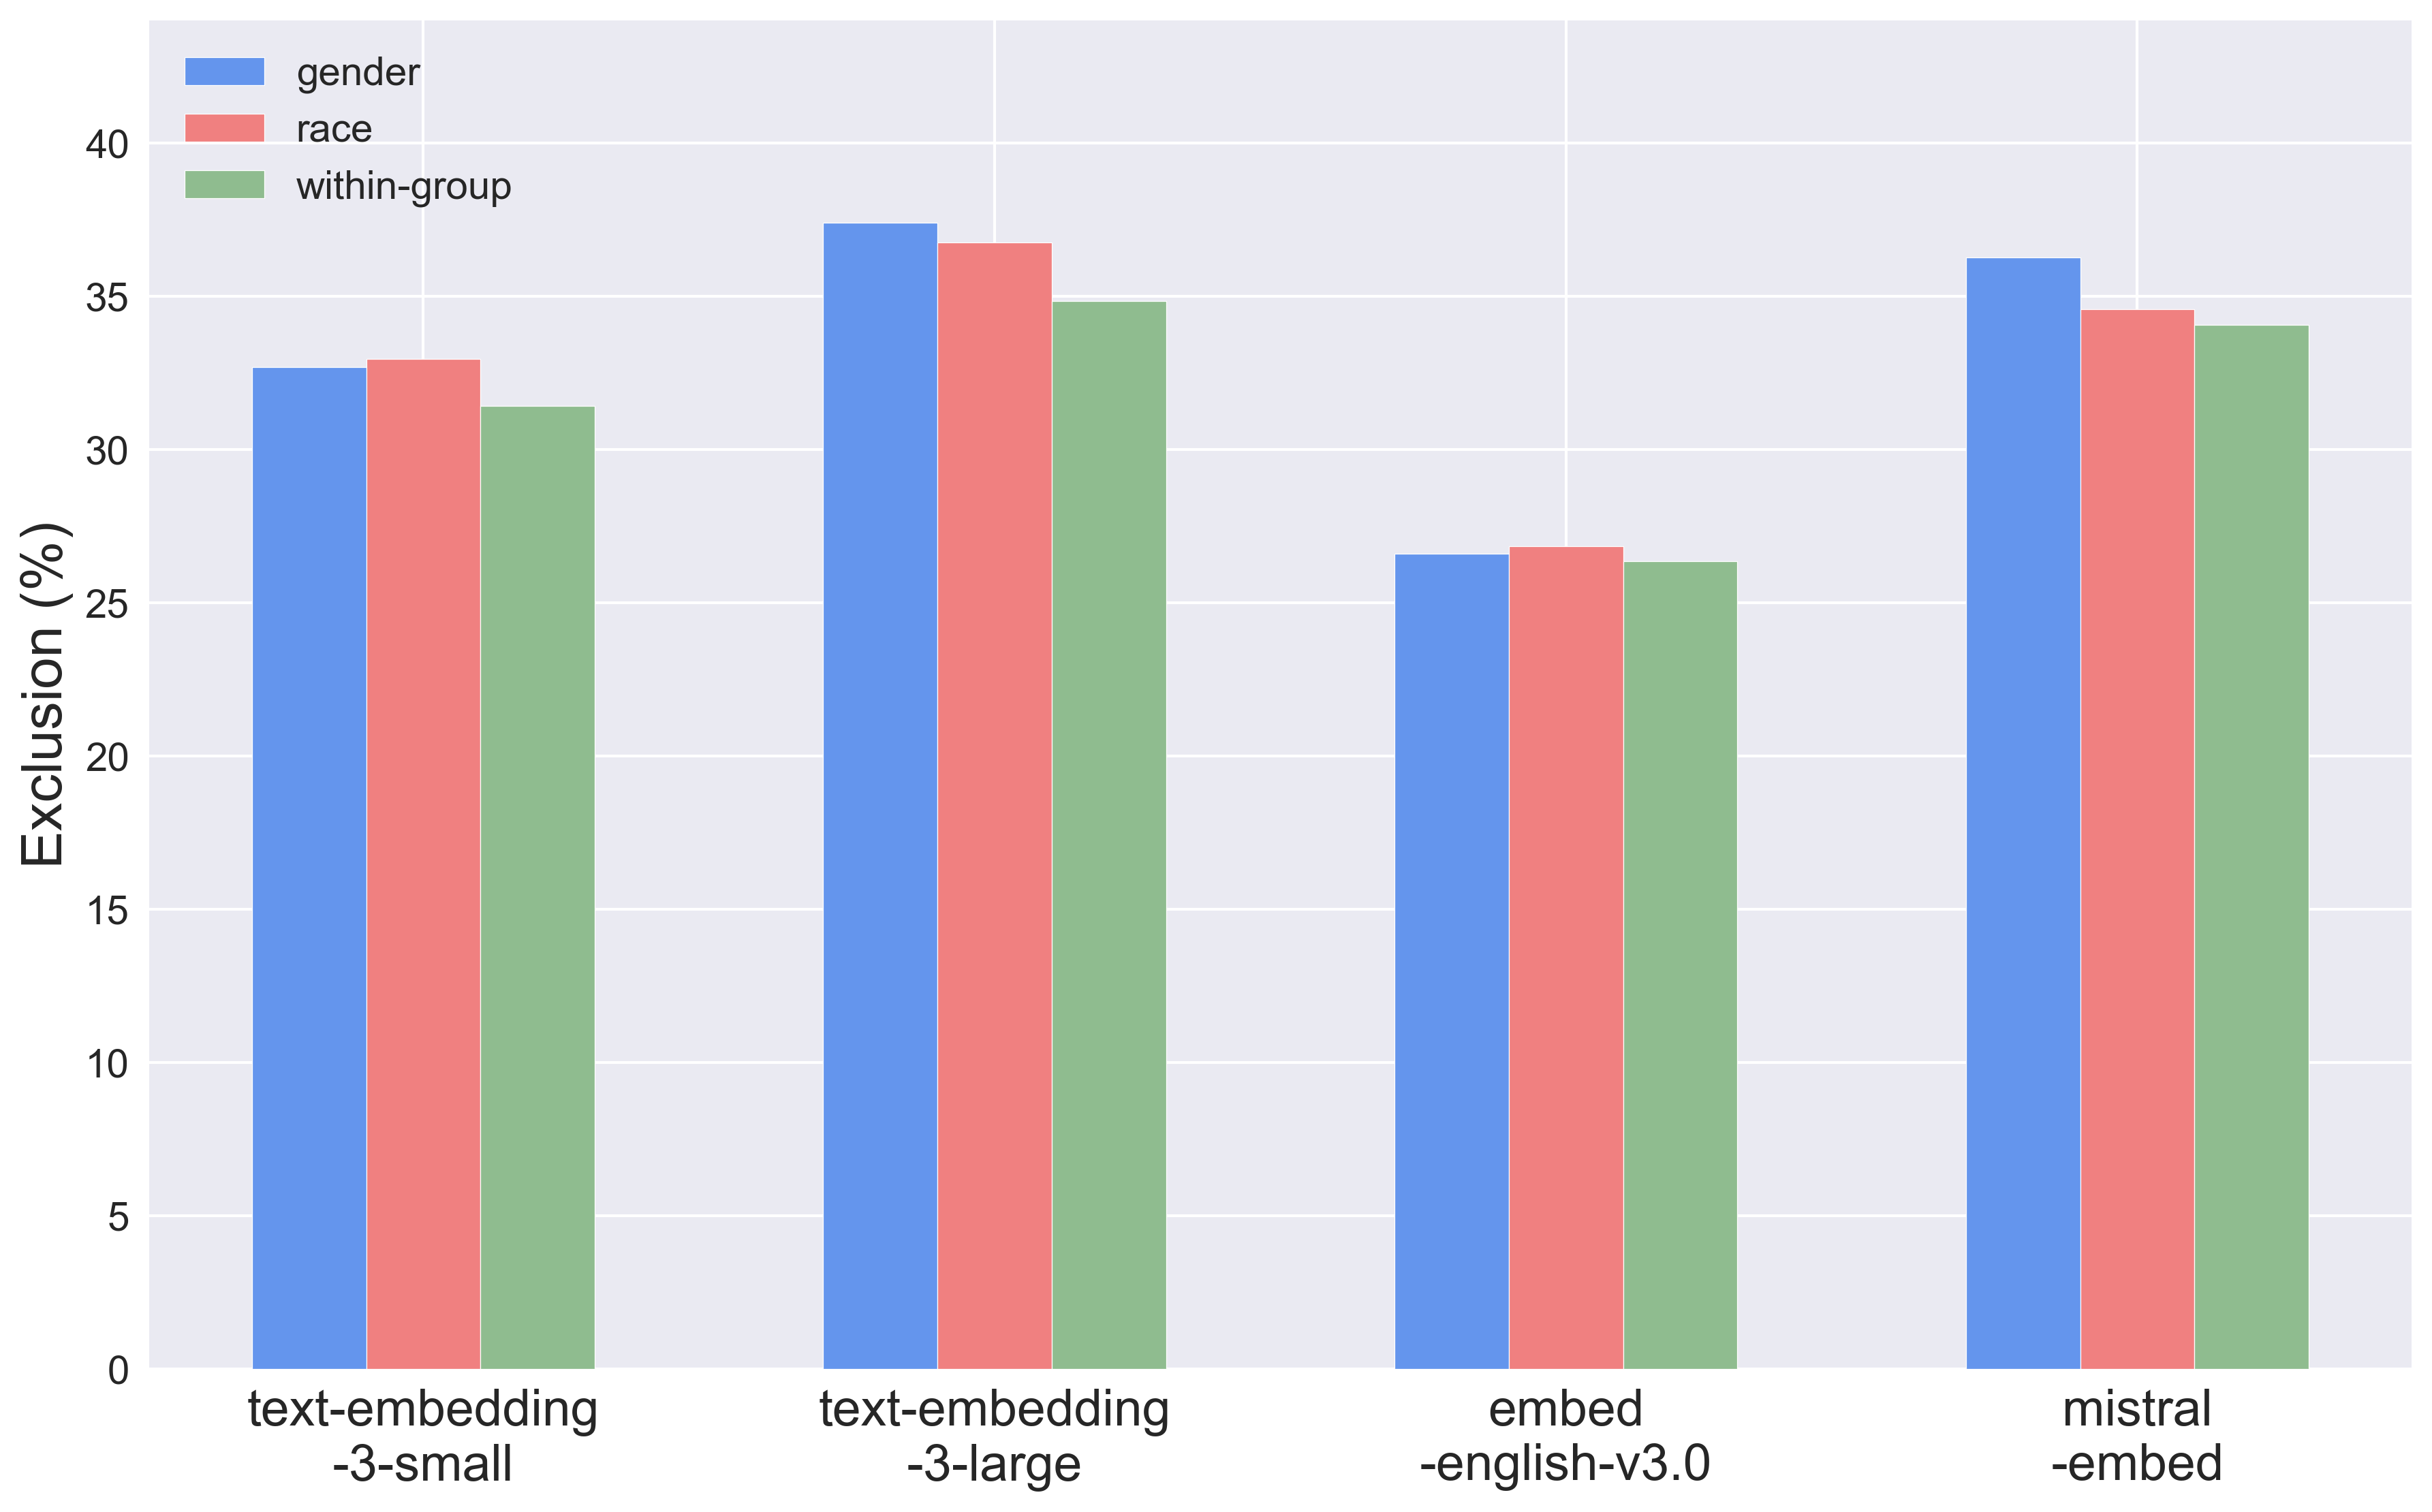
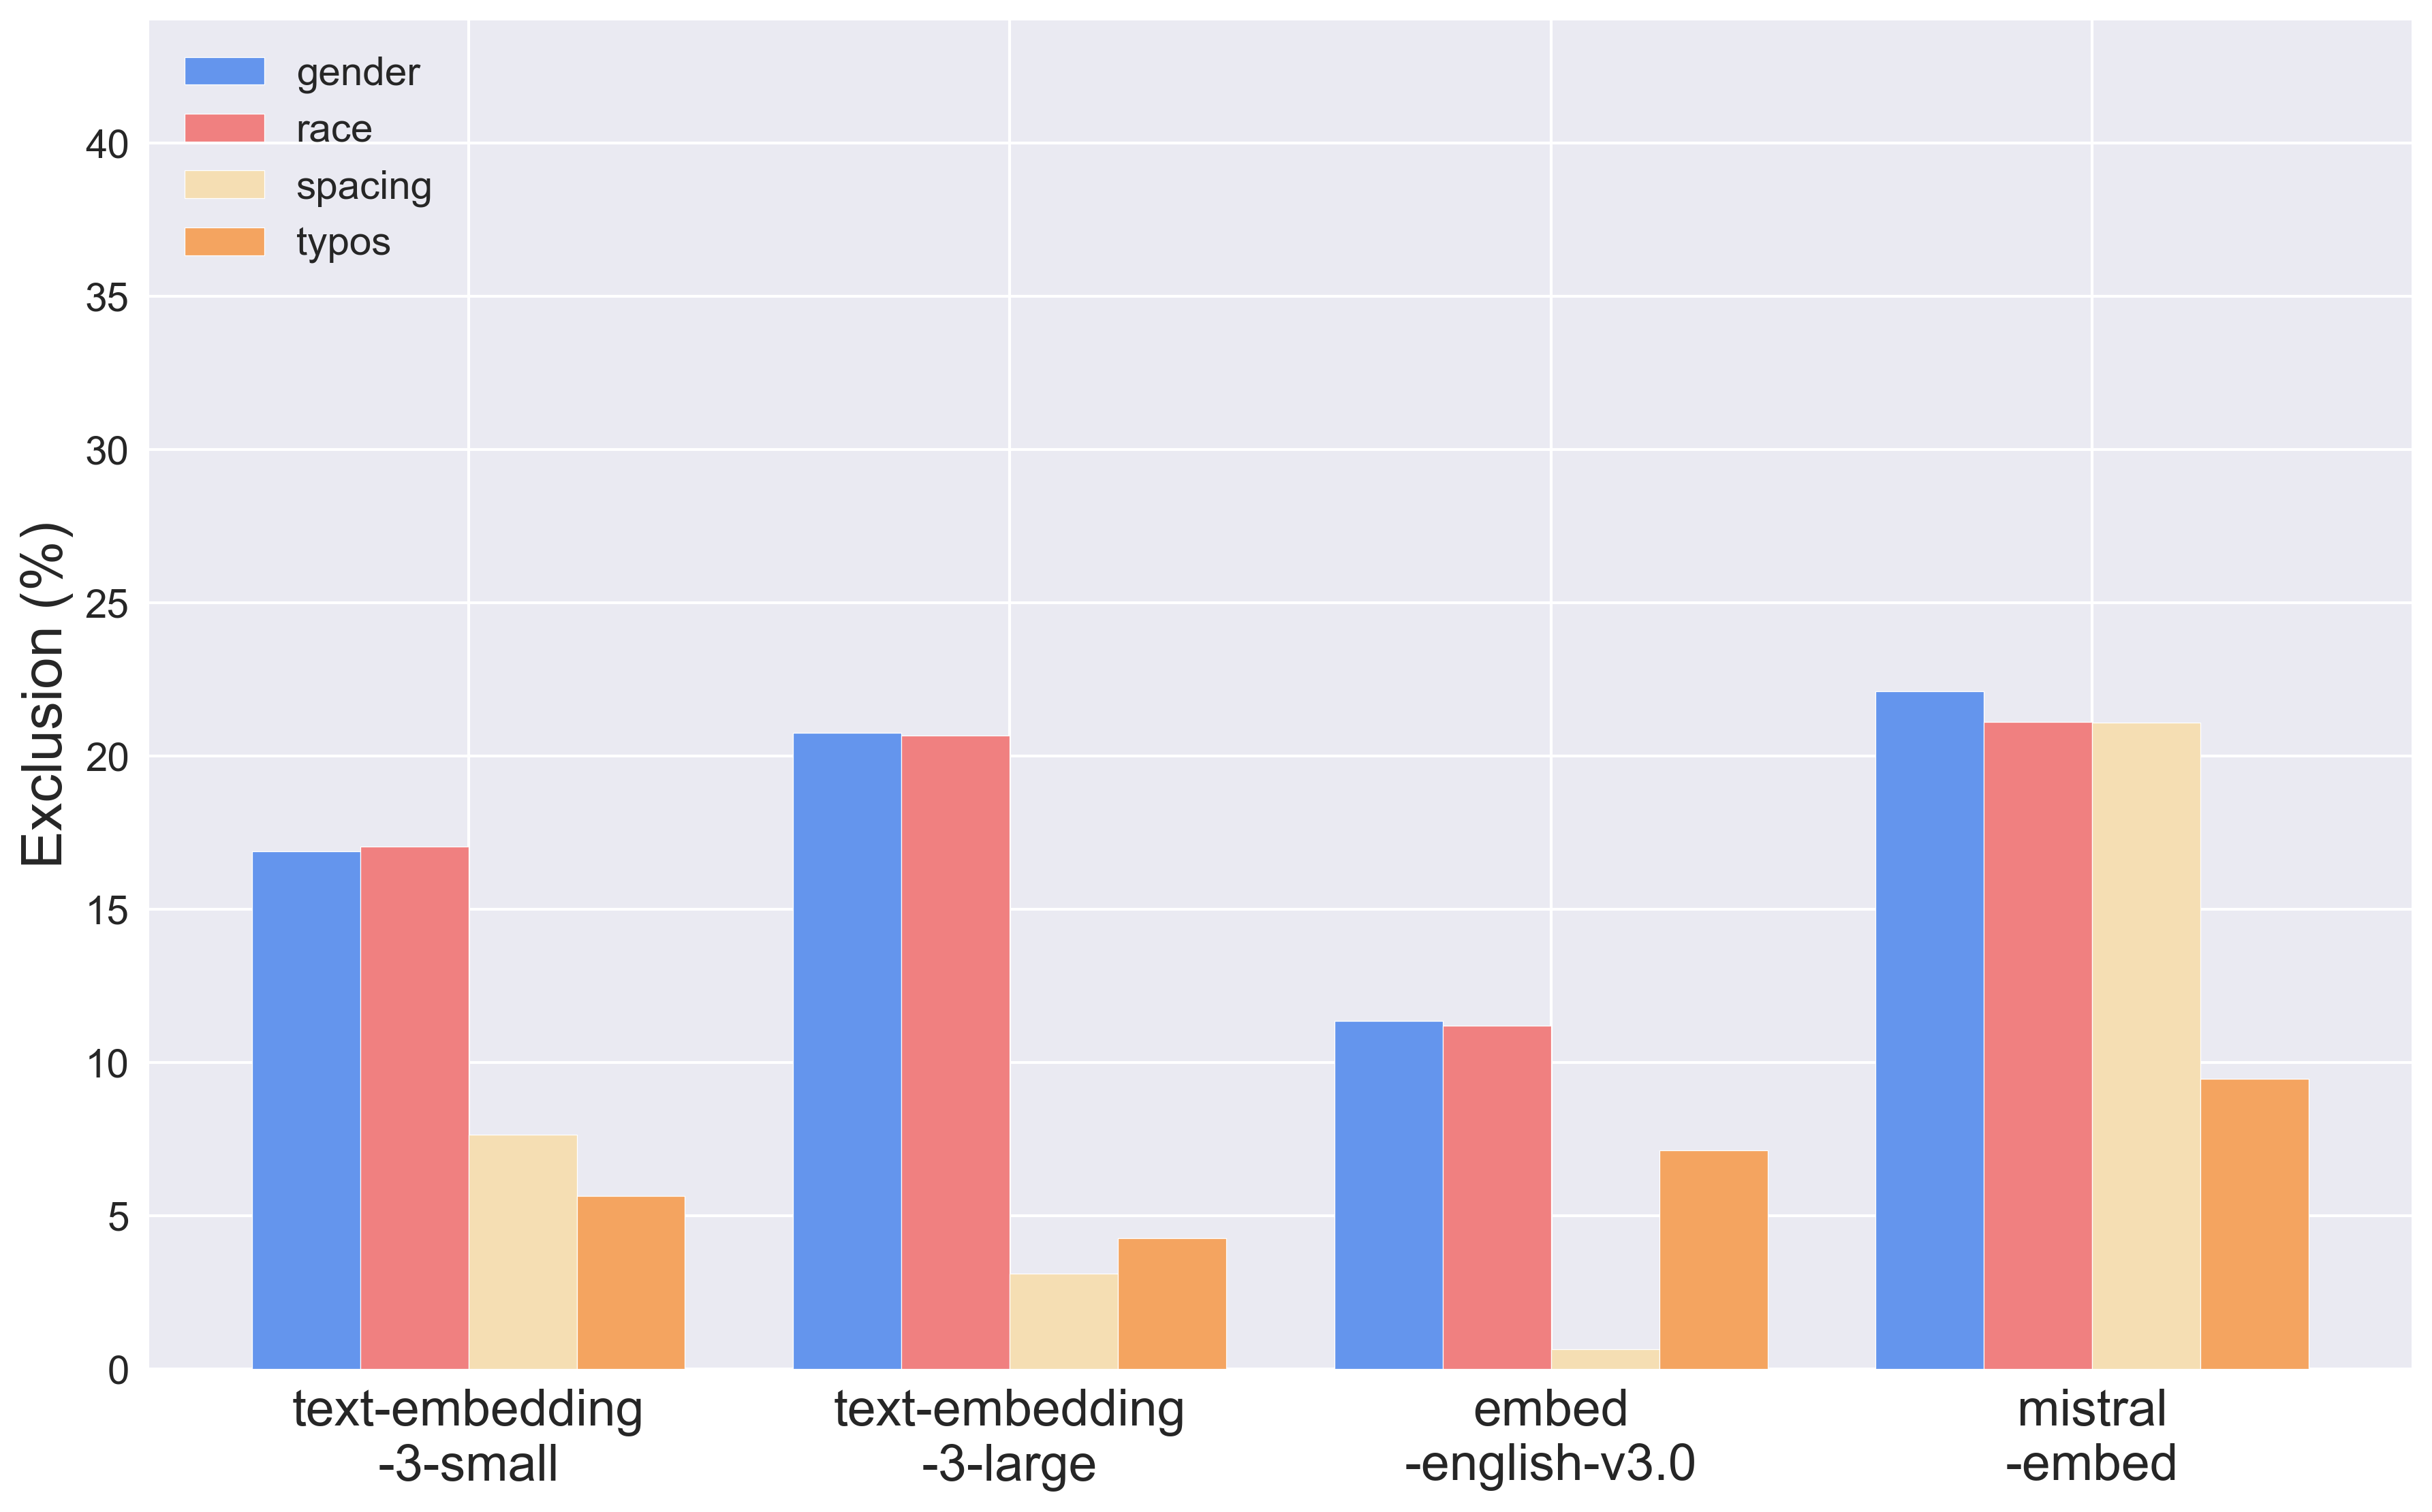
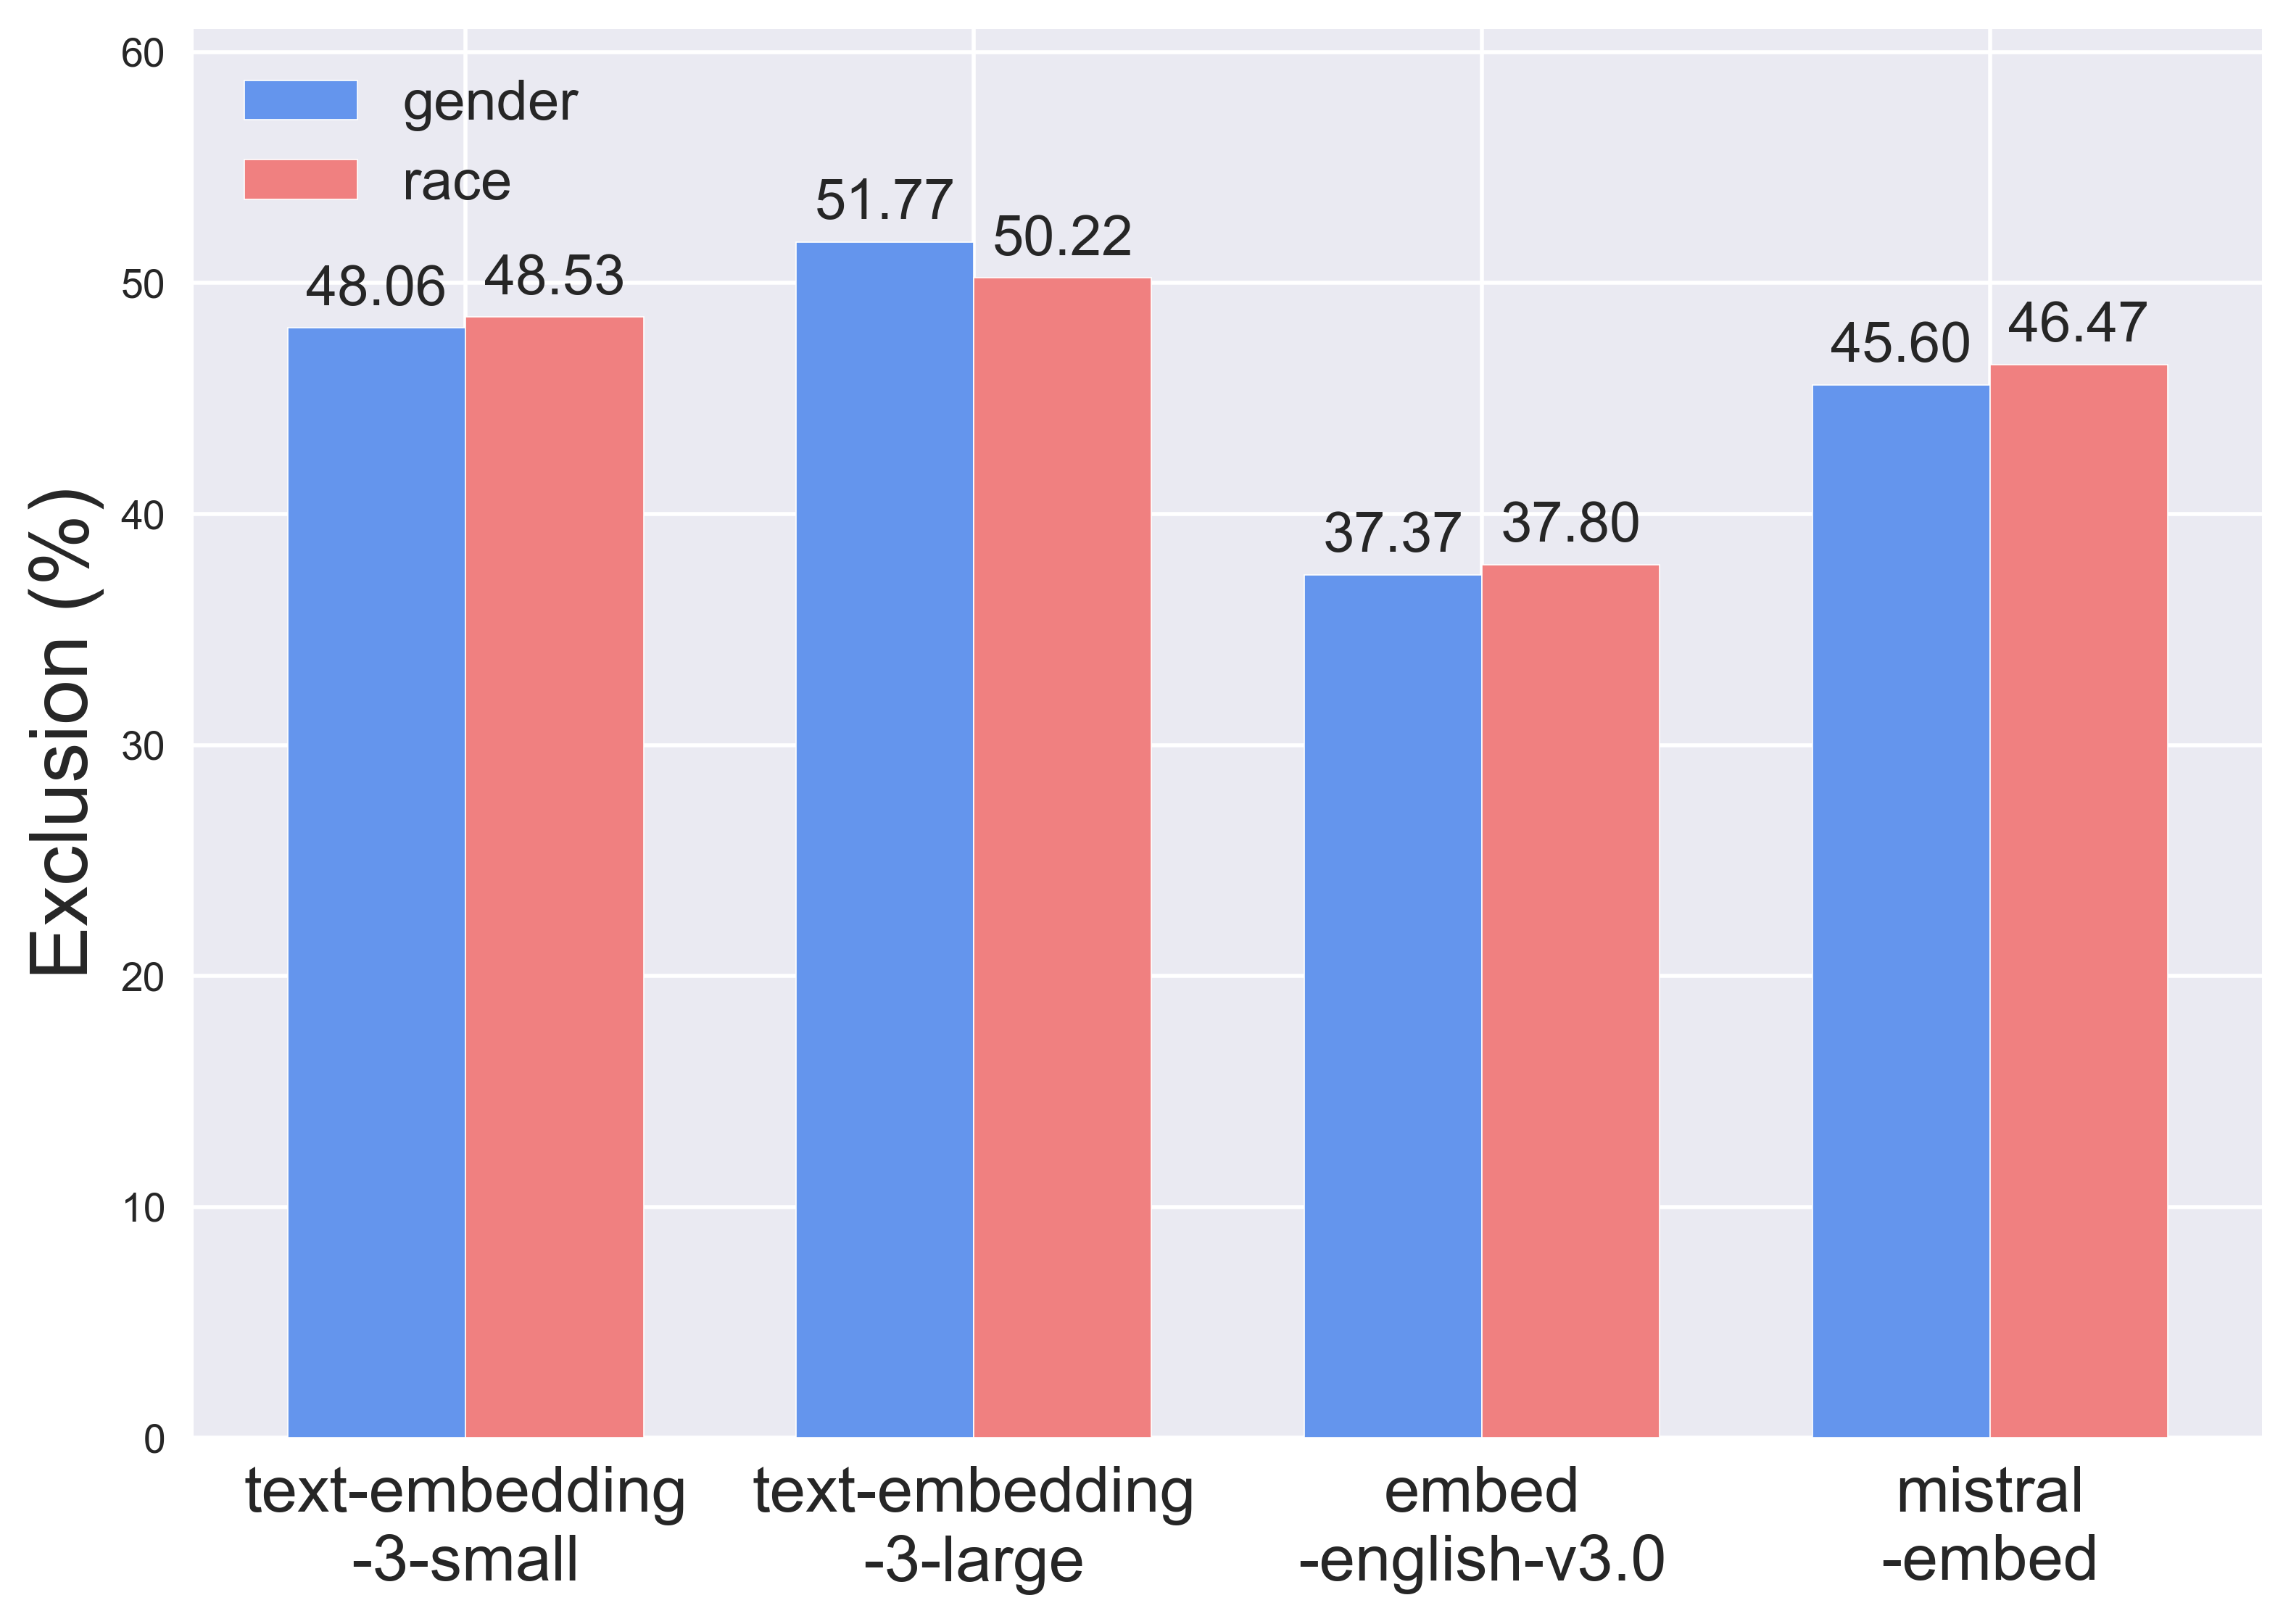
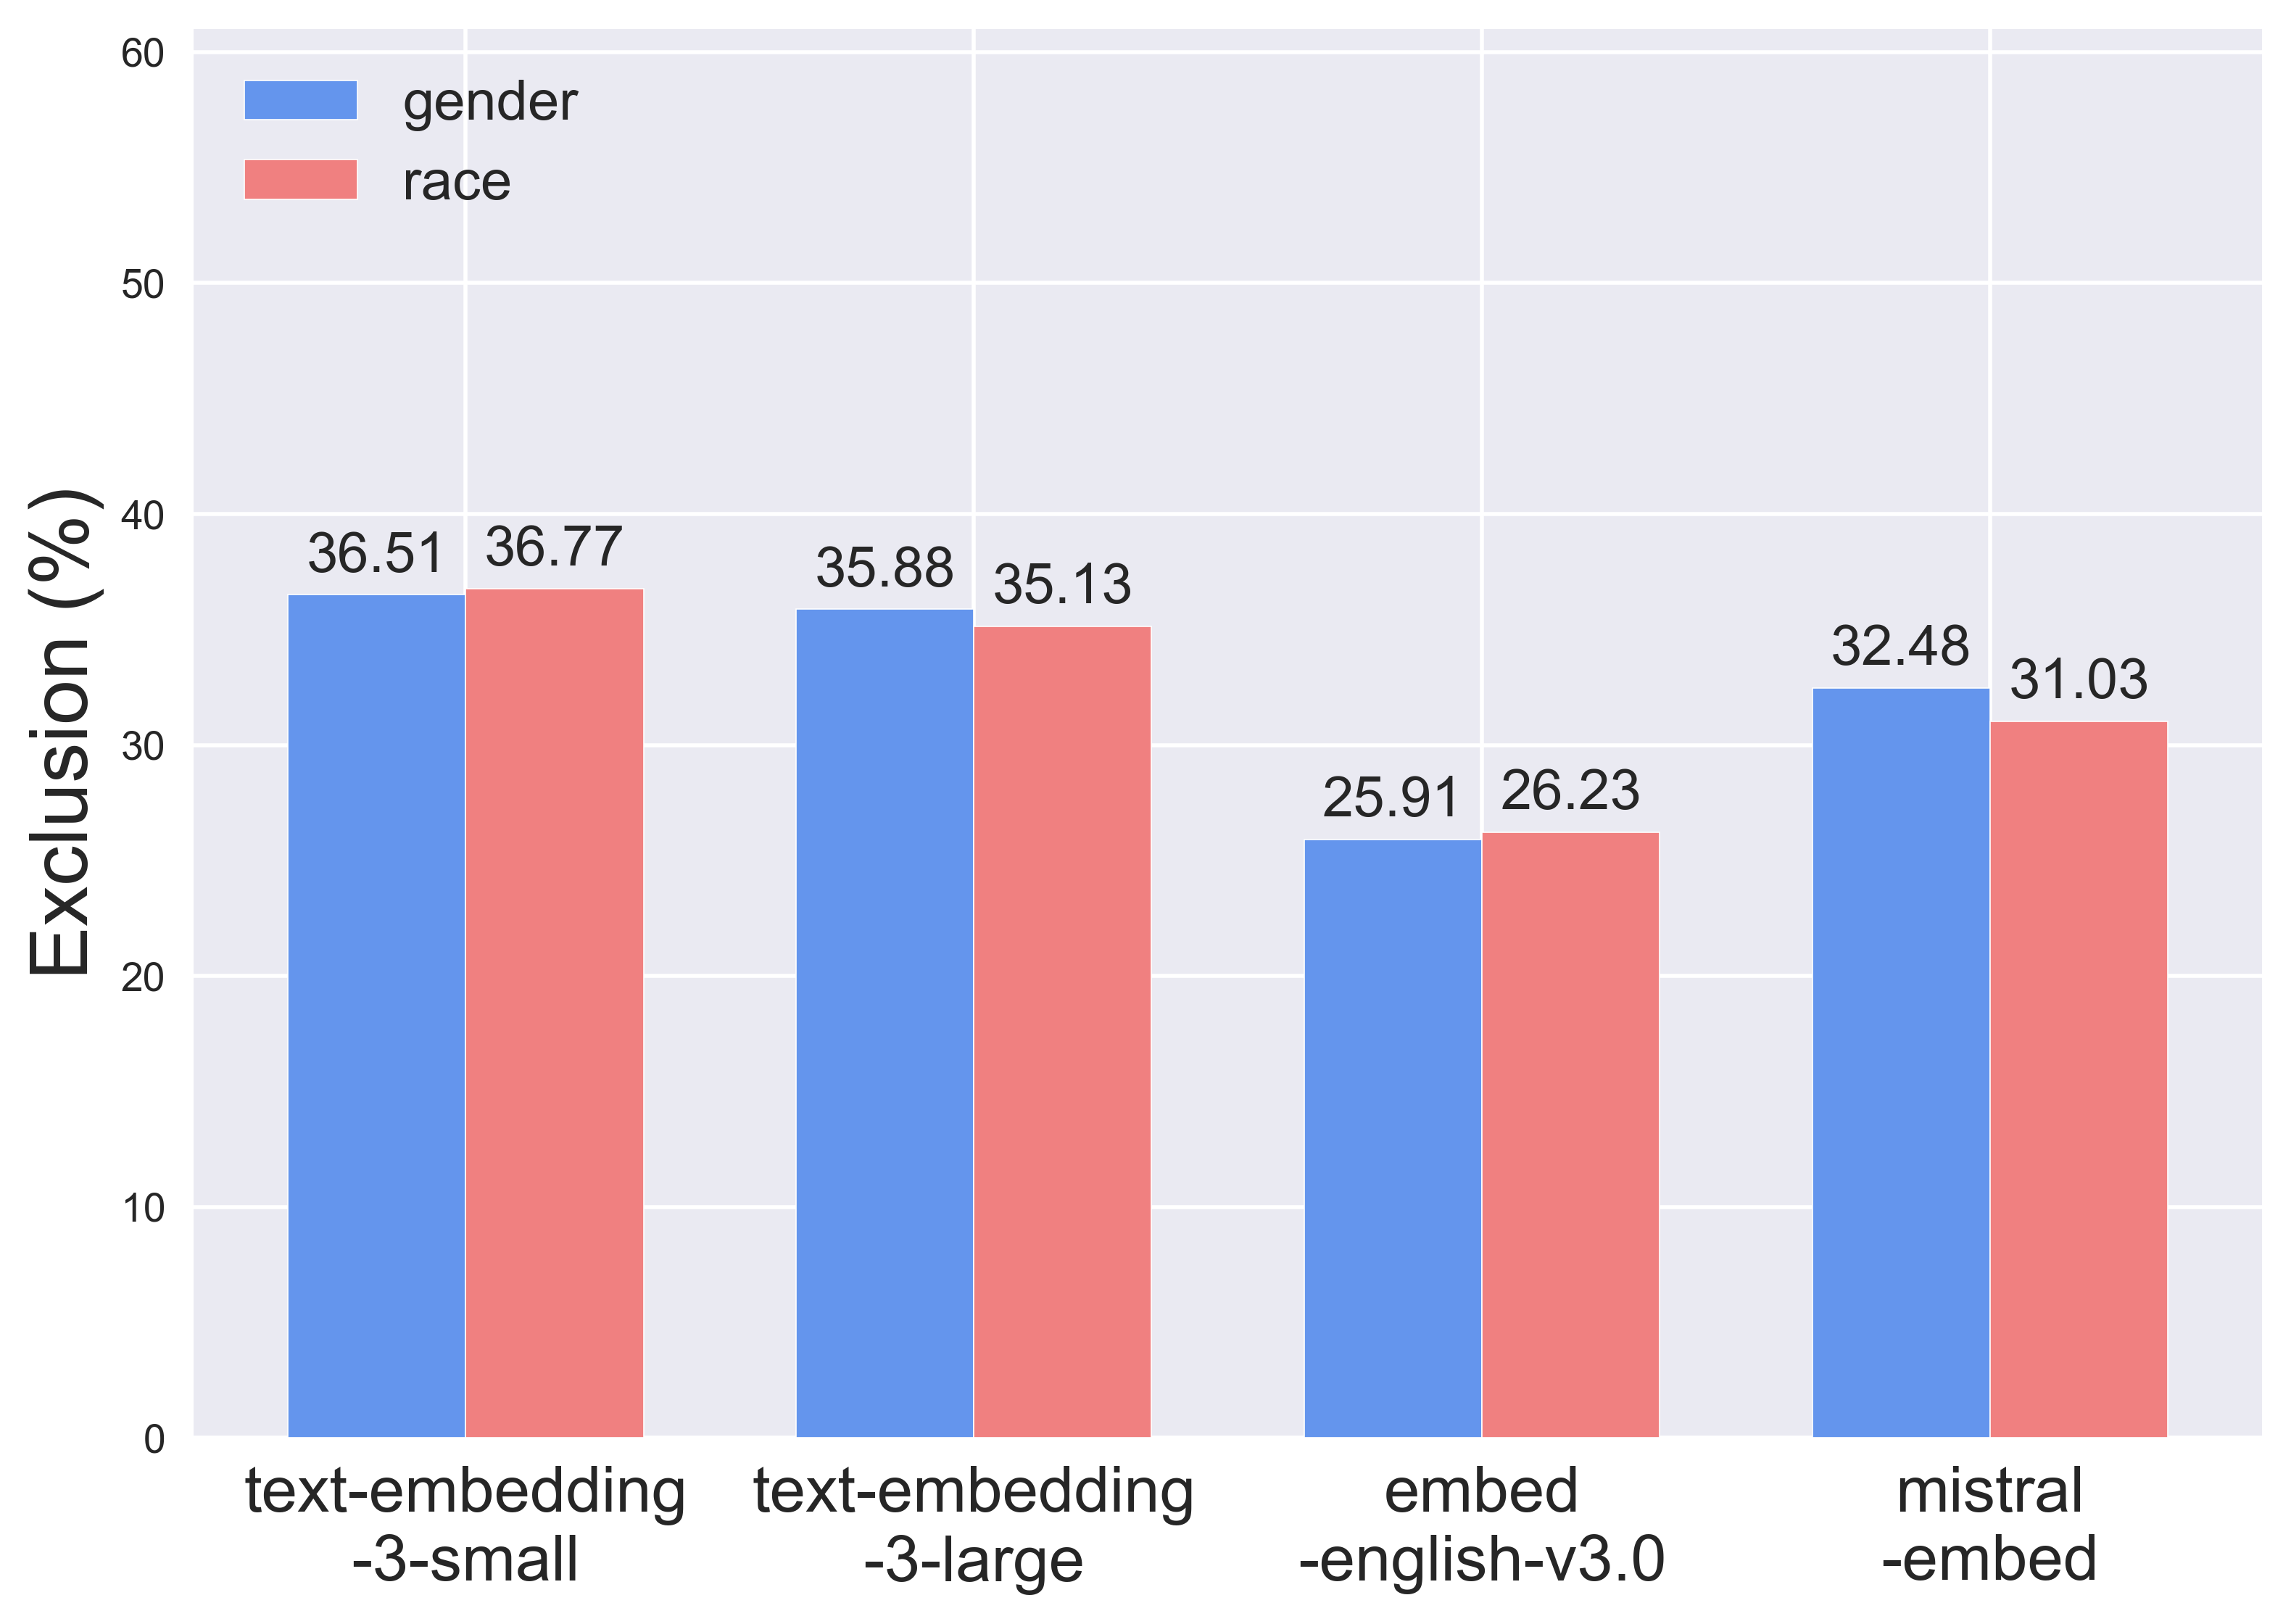
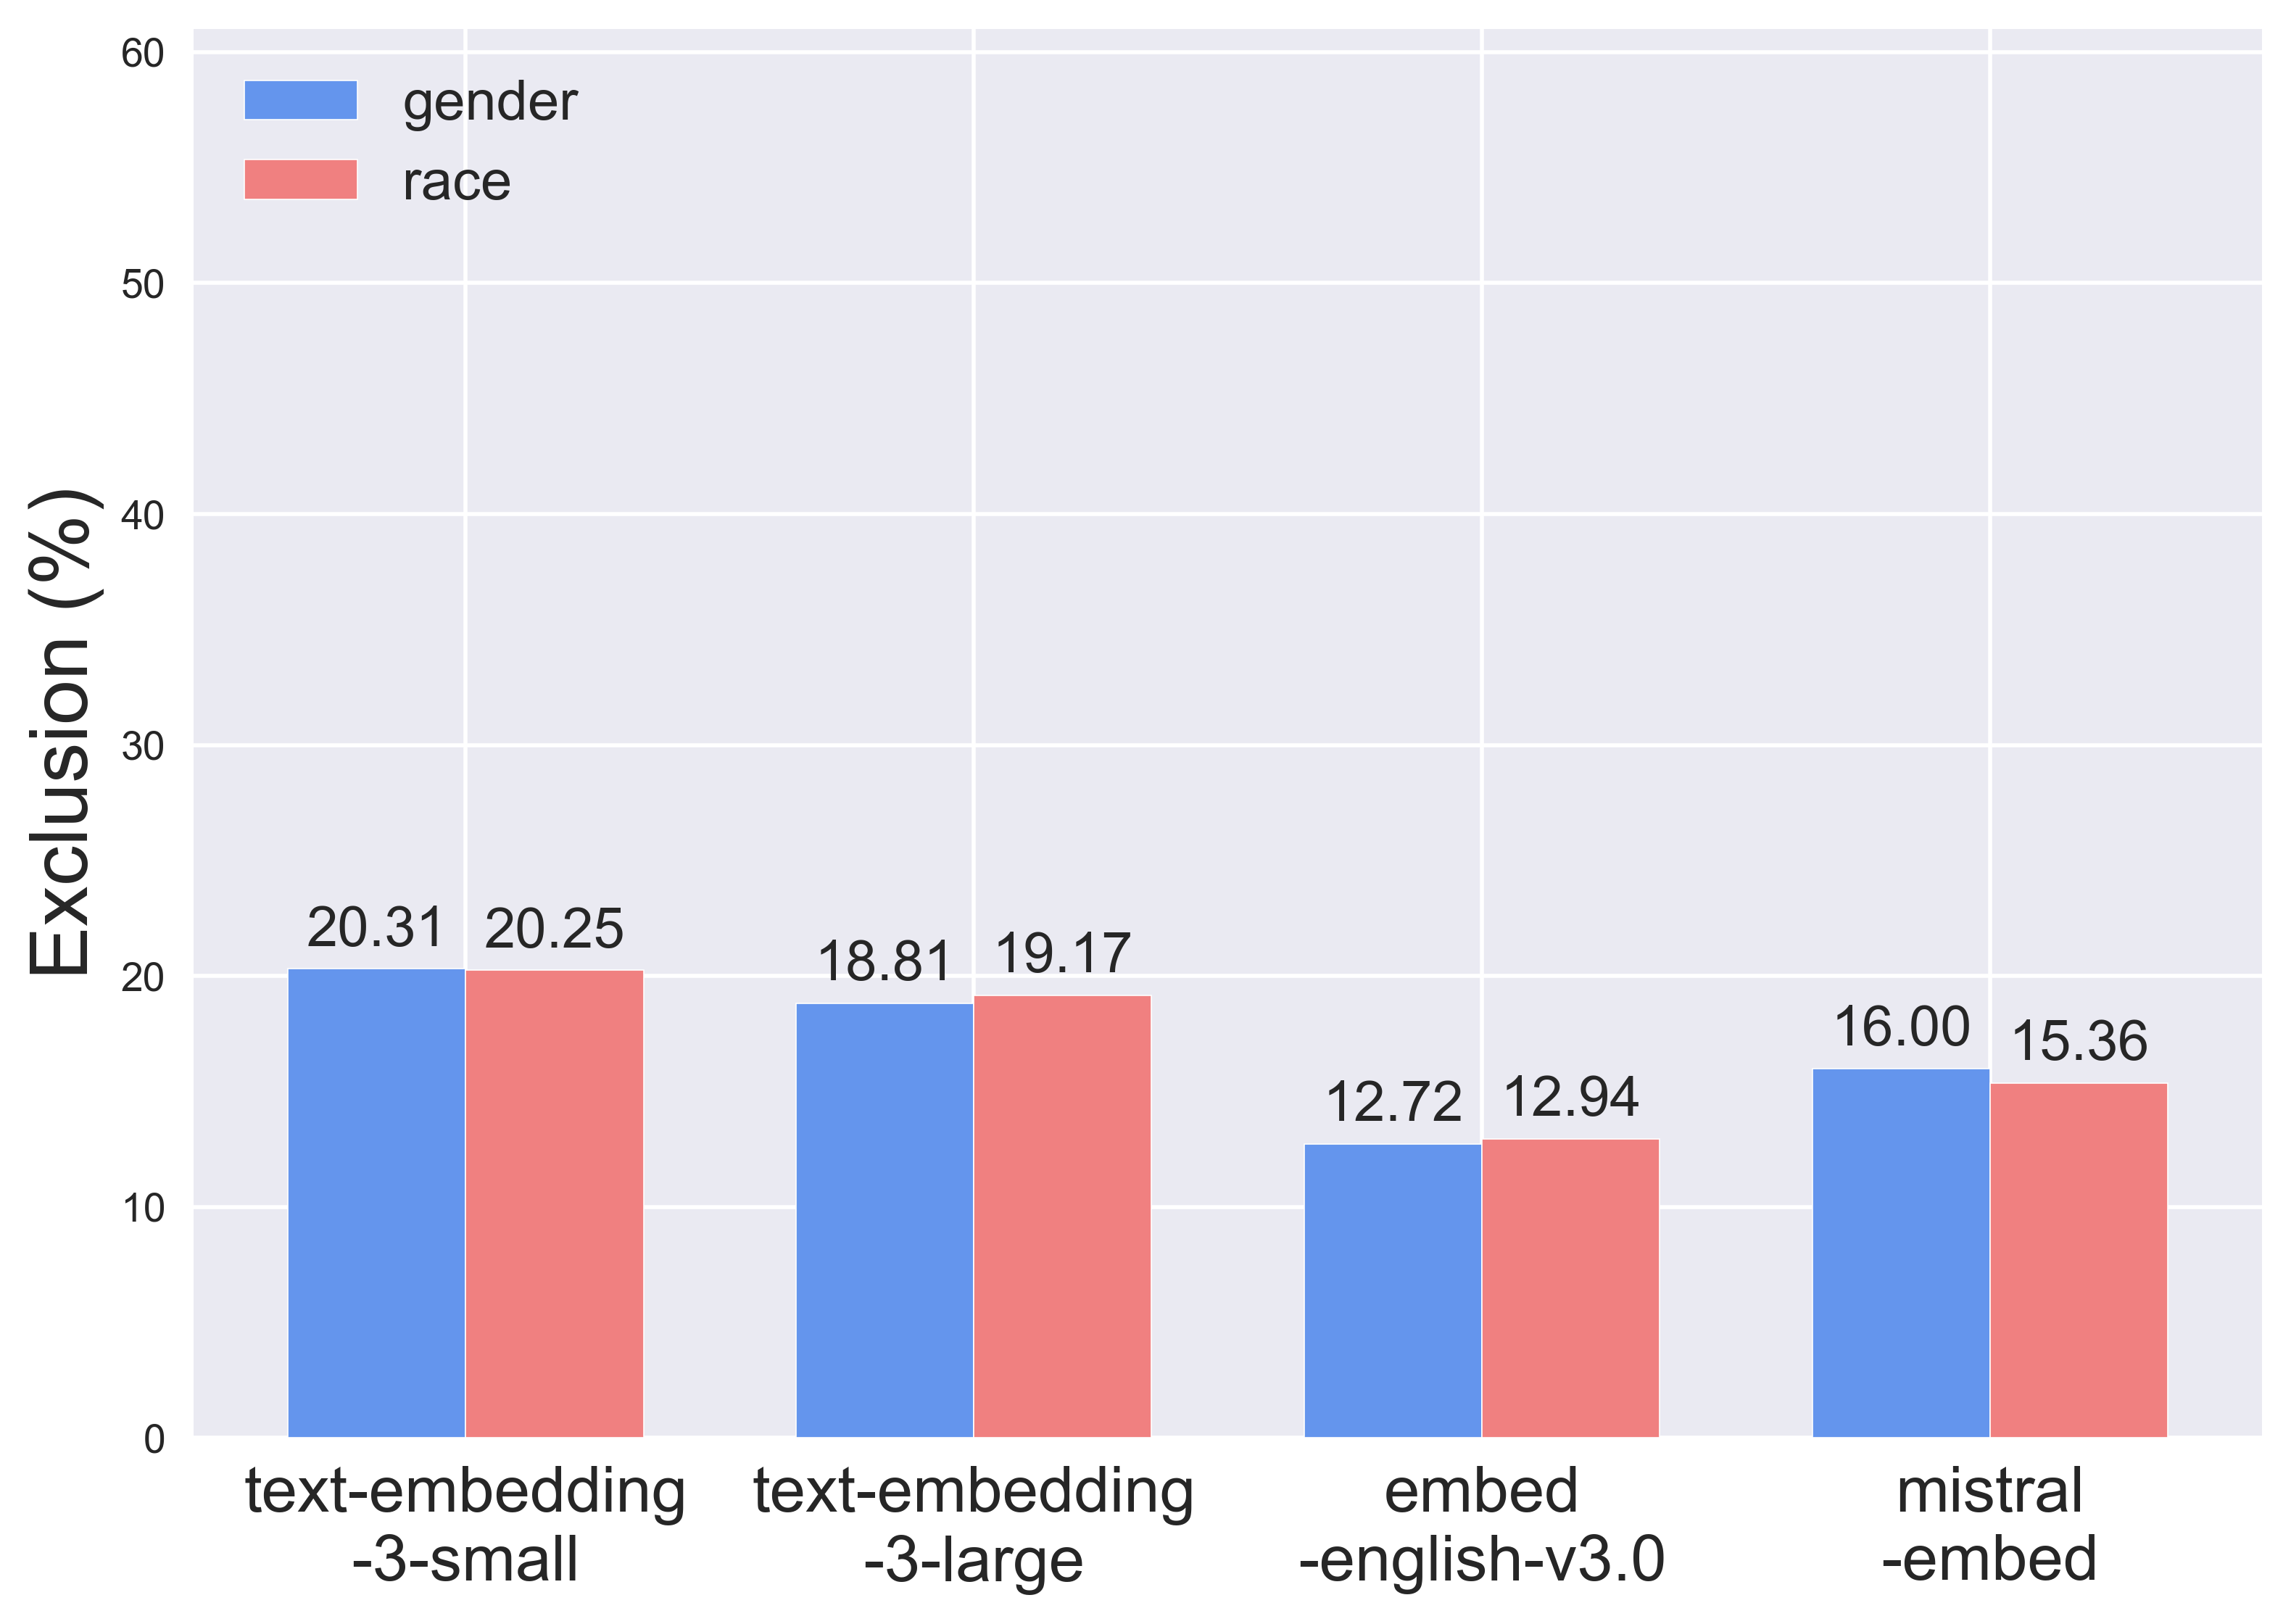
We compute exclusion (i.e., how often top retrieved resumes are excluded from the set of top- resumes after demographic perturbations). We find that all models display notable sensitivity to gender and race name perturbations, as shown in Figure 3. When considering top-5 resumes, we find that models tend to exclude perturbed resumes nearly half the time (45.75% on average).
Across both gender and race name perturbations, and different values, text-embedding-3-small and text-embedding-3-large have the highest exclusion, while embed-english-v3.0 consistently has the lowest exclusion. As expected, exclusion lowers as increases, since larger values are less restrictive and consider a larger set of retrieved resumes. That being said, exclusion for is still considerable, as all models have exclusion > 12%.666In practice we expect to be low for filtering candidates.
For exclusion, models have similar sensitivity to both gender and race perturbations. Overall, average exclusion for gender is 31.78% on generated resumes (25.47% on Kaggle resumes) vs. 31.66% on generated resumes (25.40% on Kaggle resumes) for race.777Kaggle resumes exhibit similar patterns but lower exclusion magnitude than generated resumes. This is likely because generated resumes are tech-focused and closer in content. These results contrast our summarization findings, where models show greater invariance violations on race vs. gender perturbations. Our analysis reveals that the set of top retrieved resumes with respect to a job posting is highly brittle, as merely altering the demographic on resumes (through names only) often results in otherwise identical resumes dropping out of the top- results.
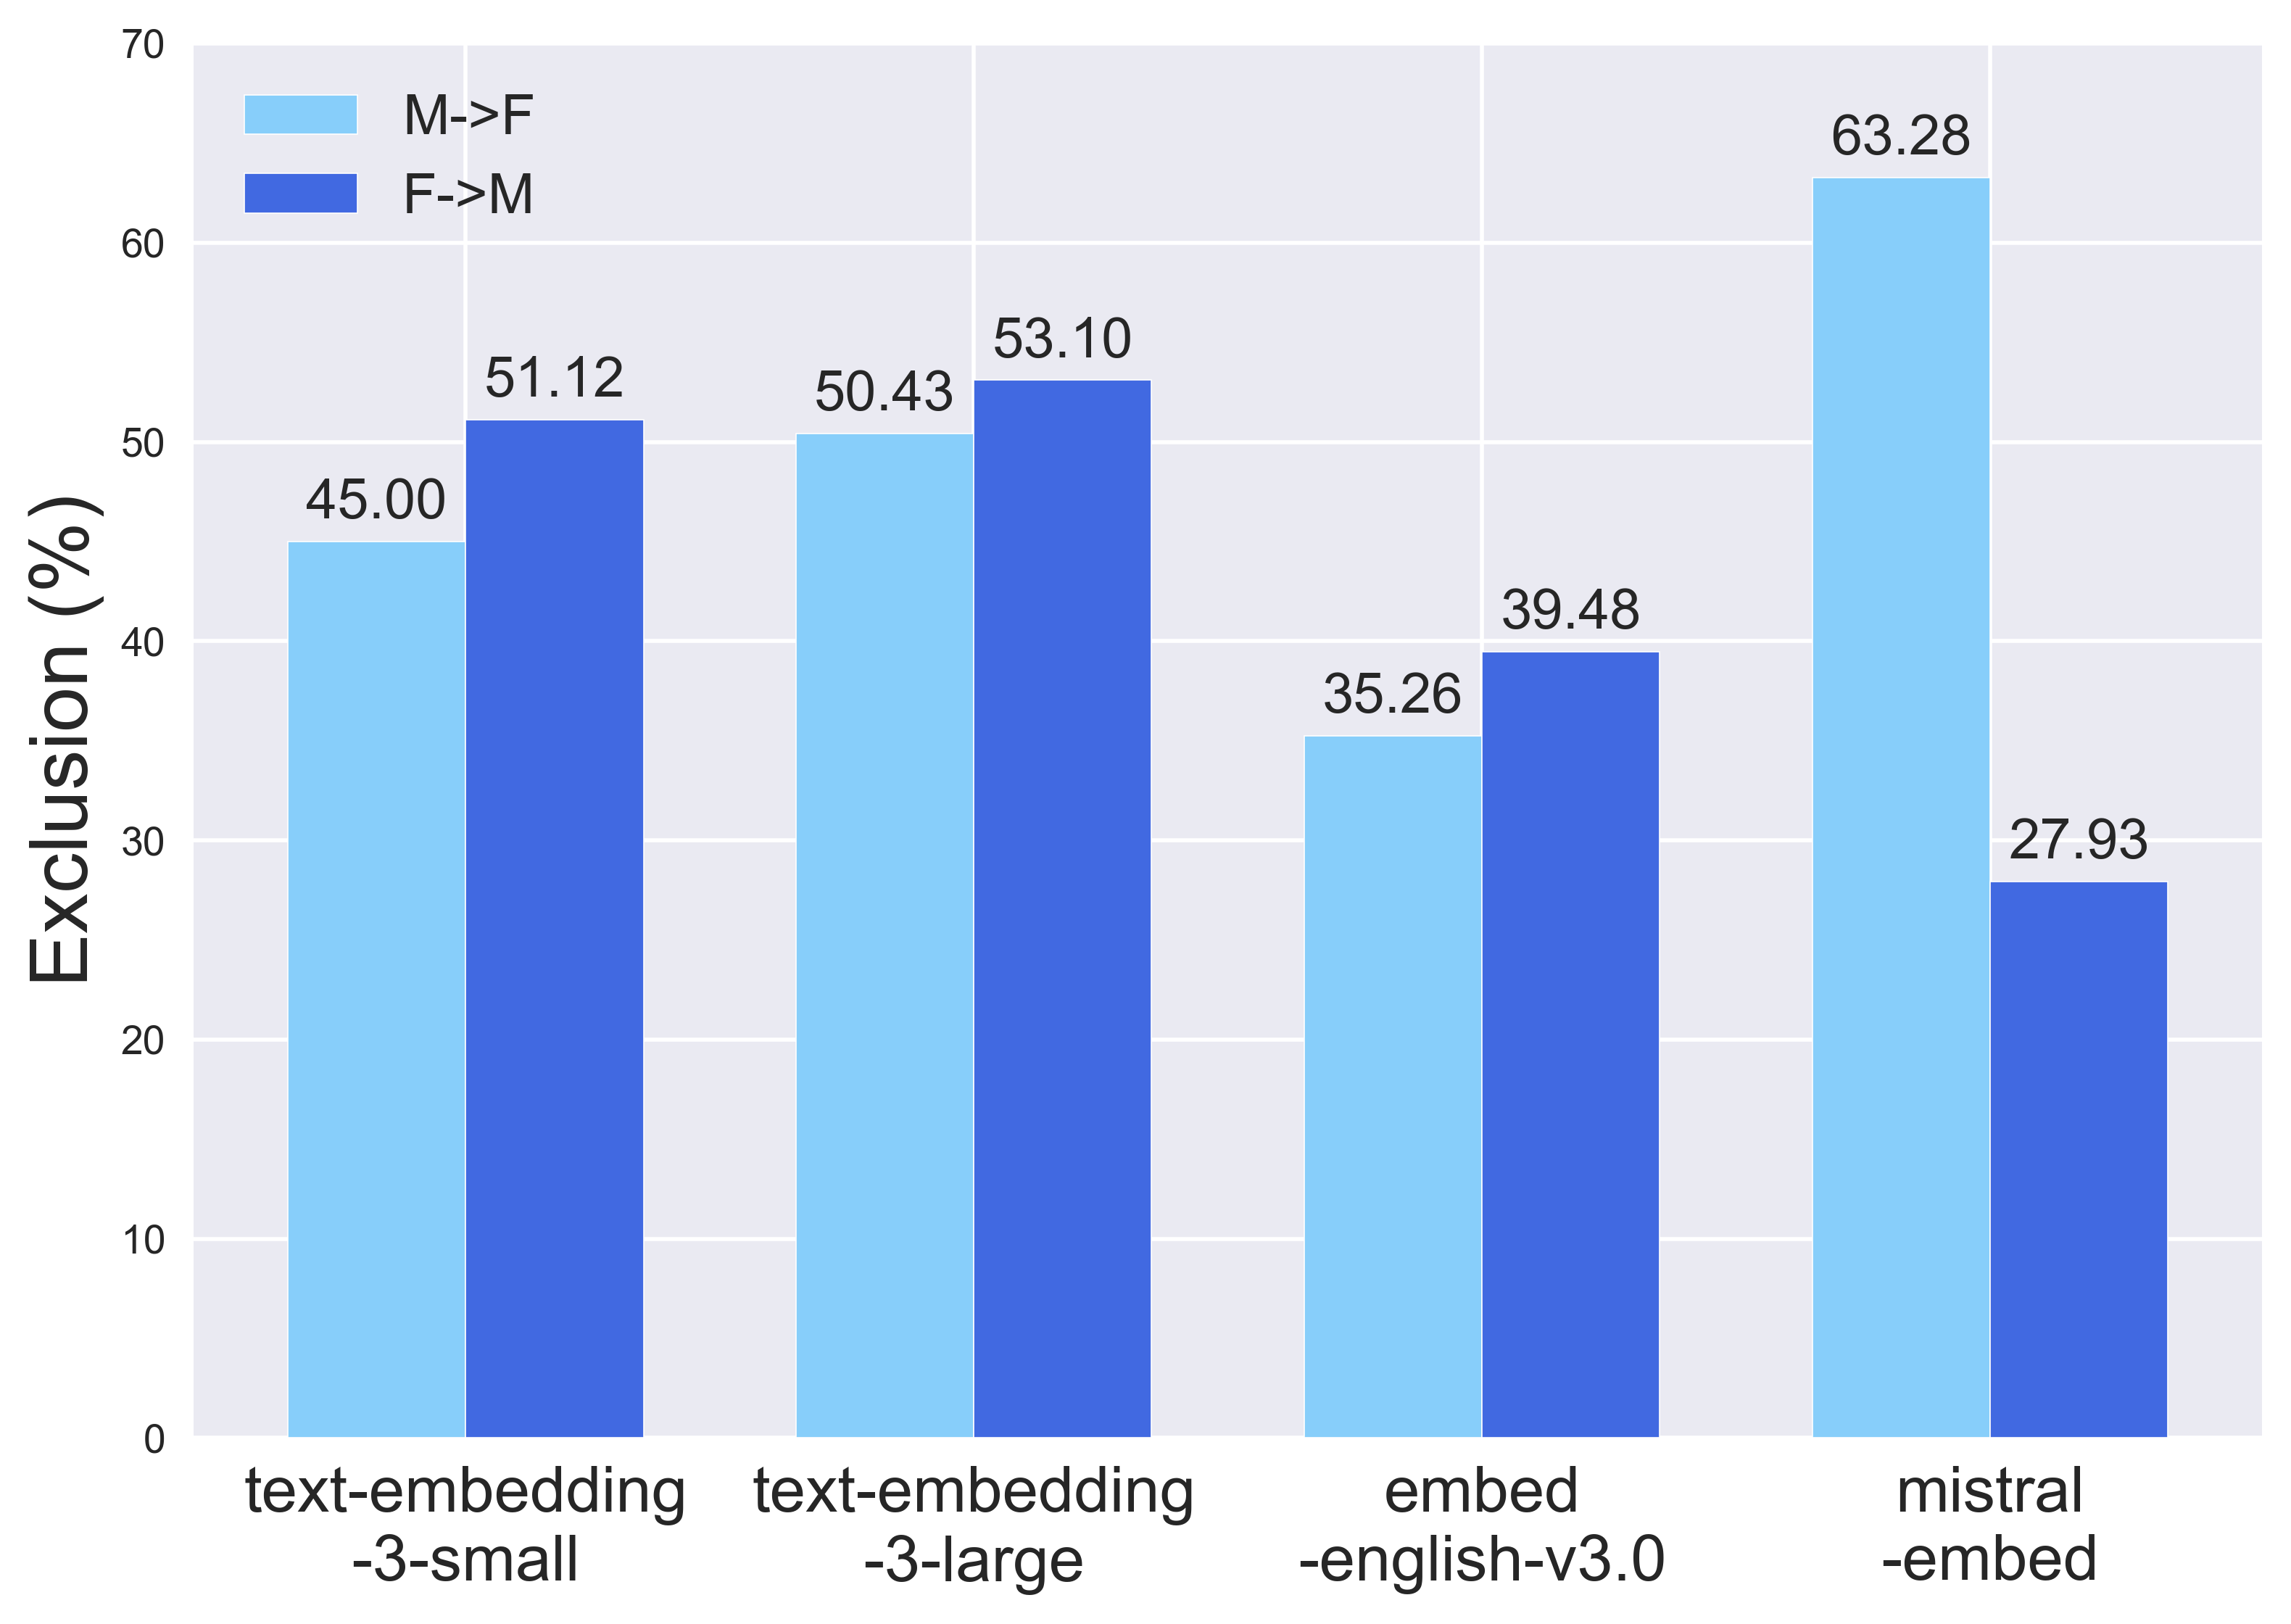
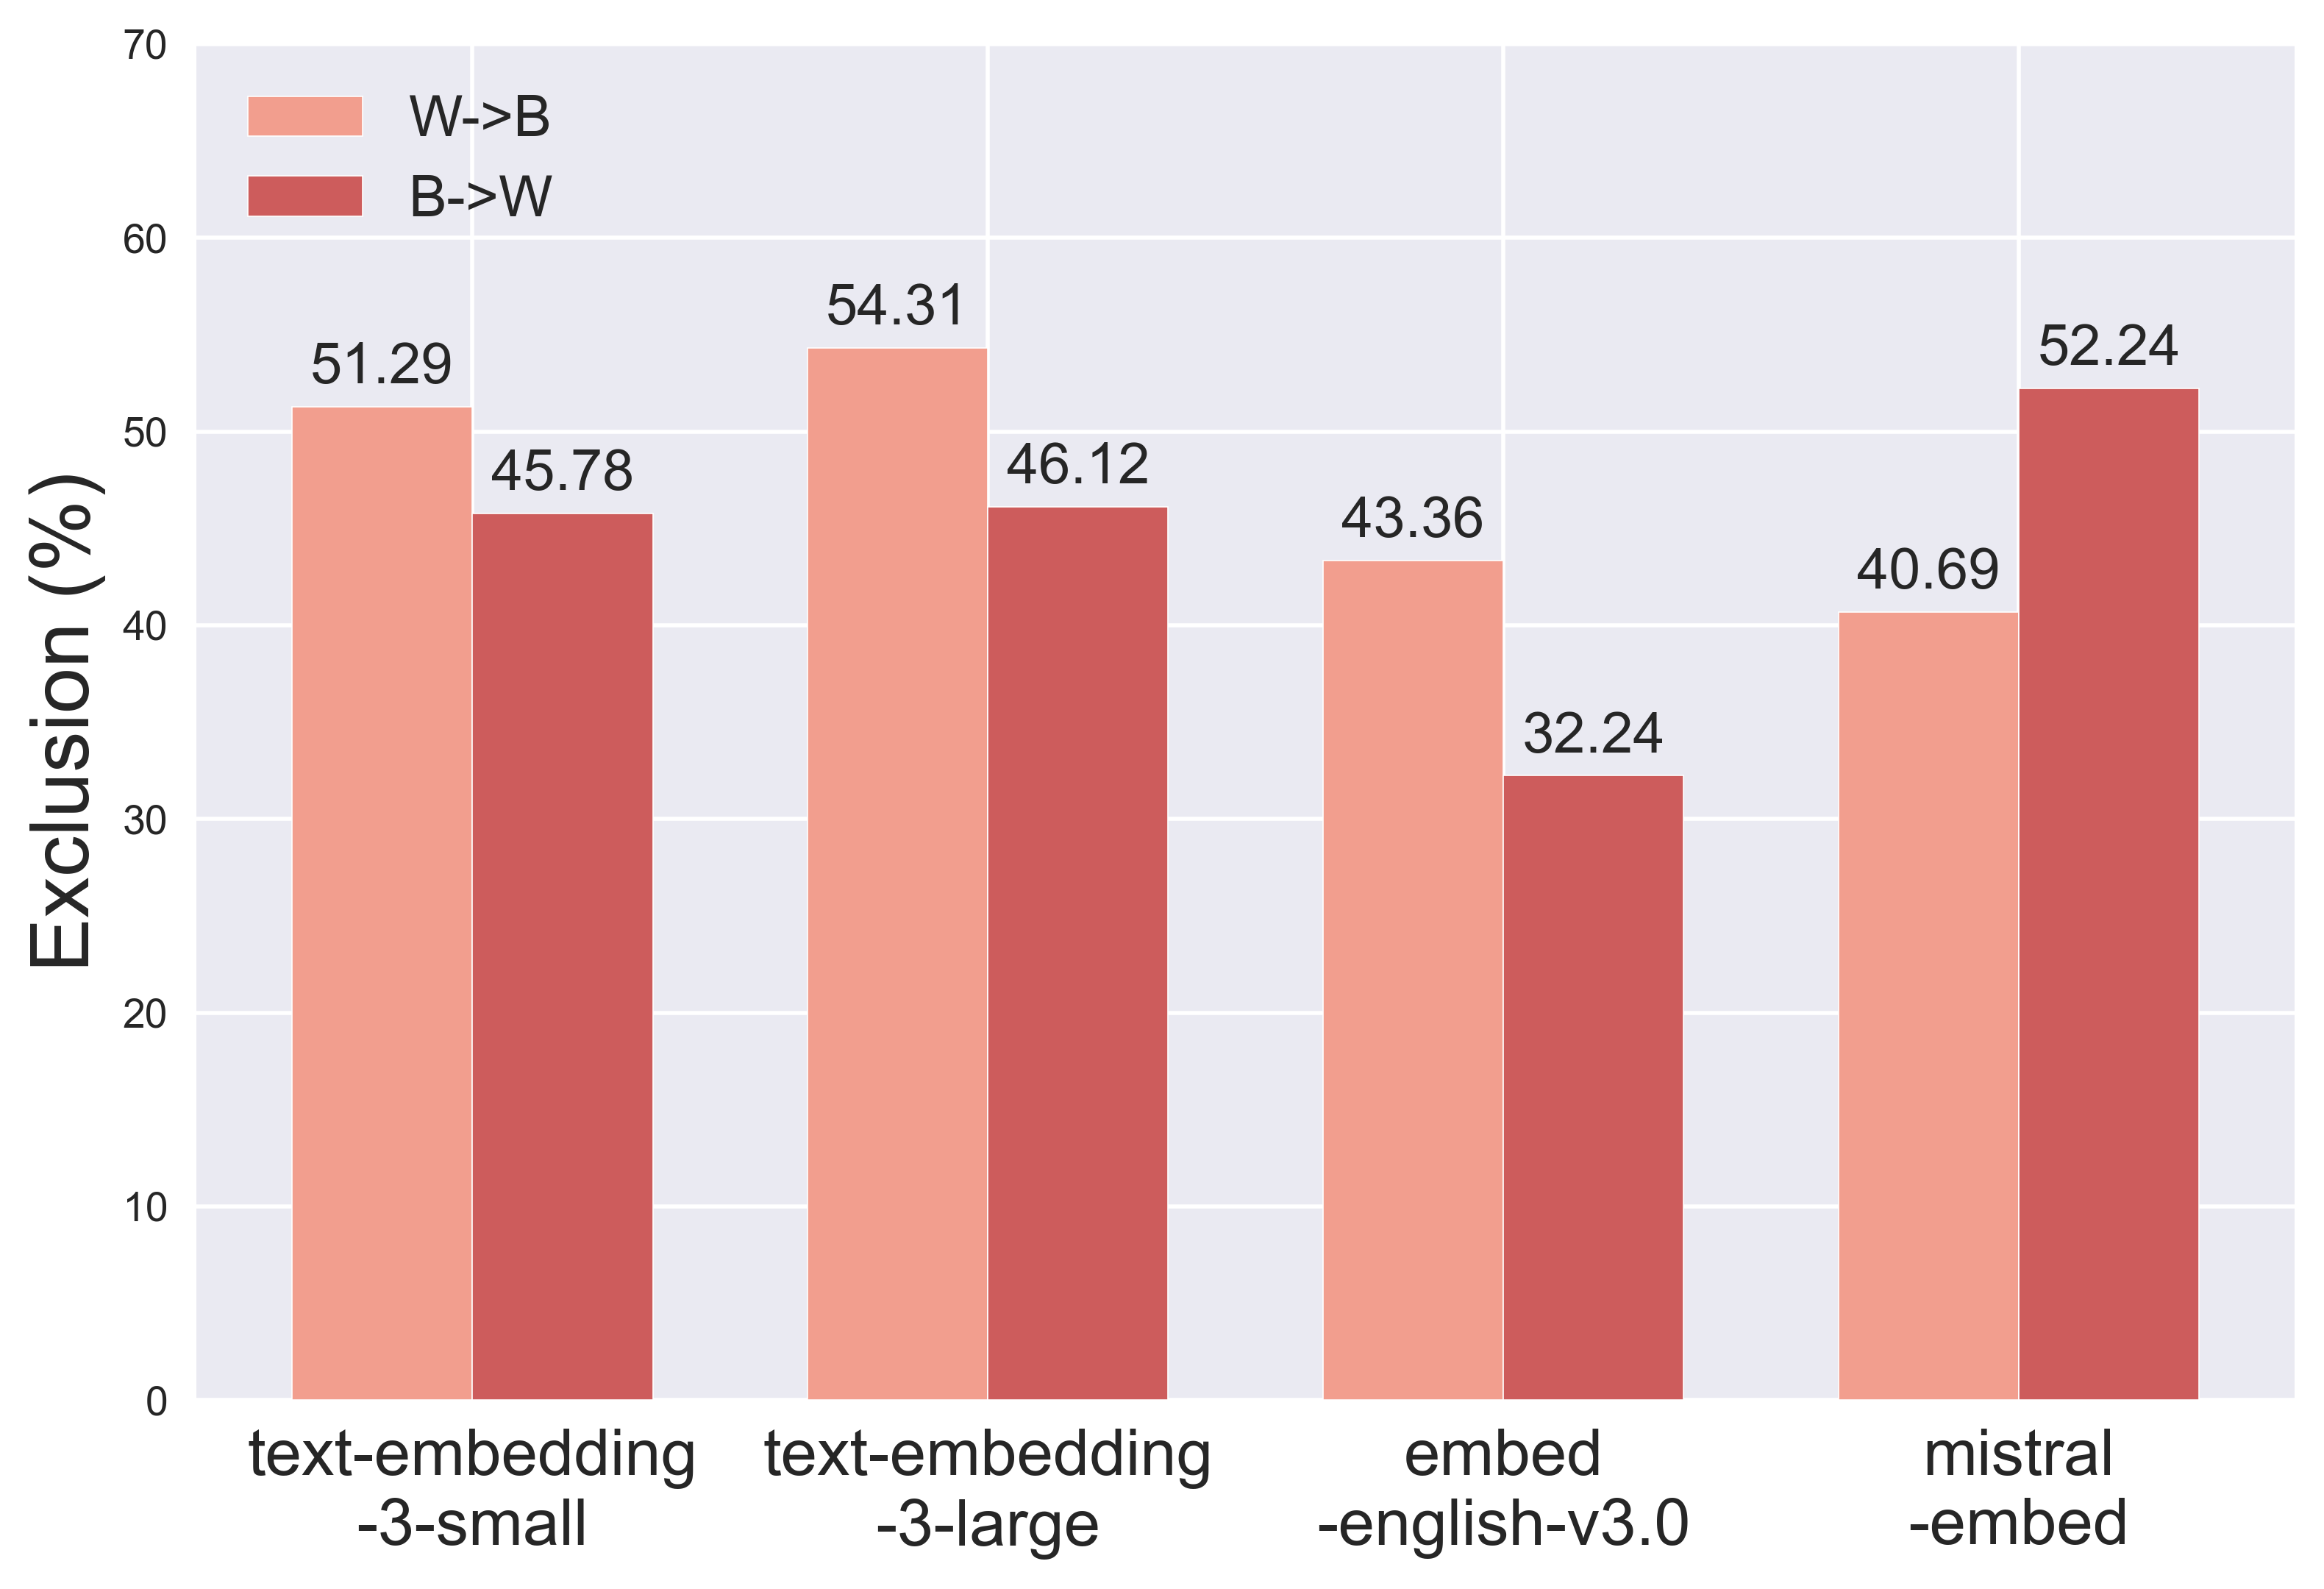
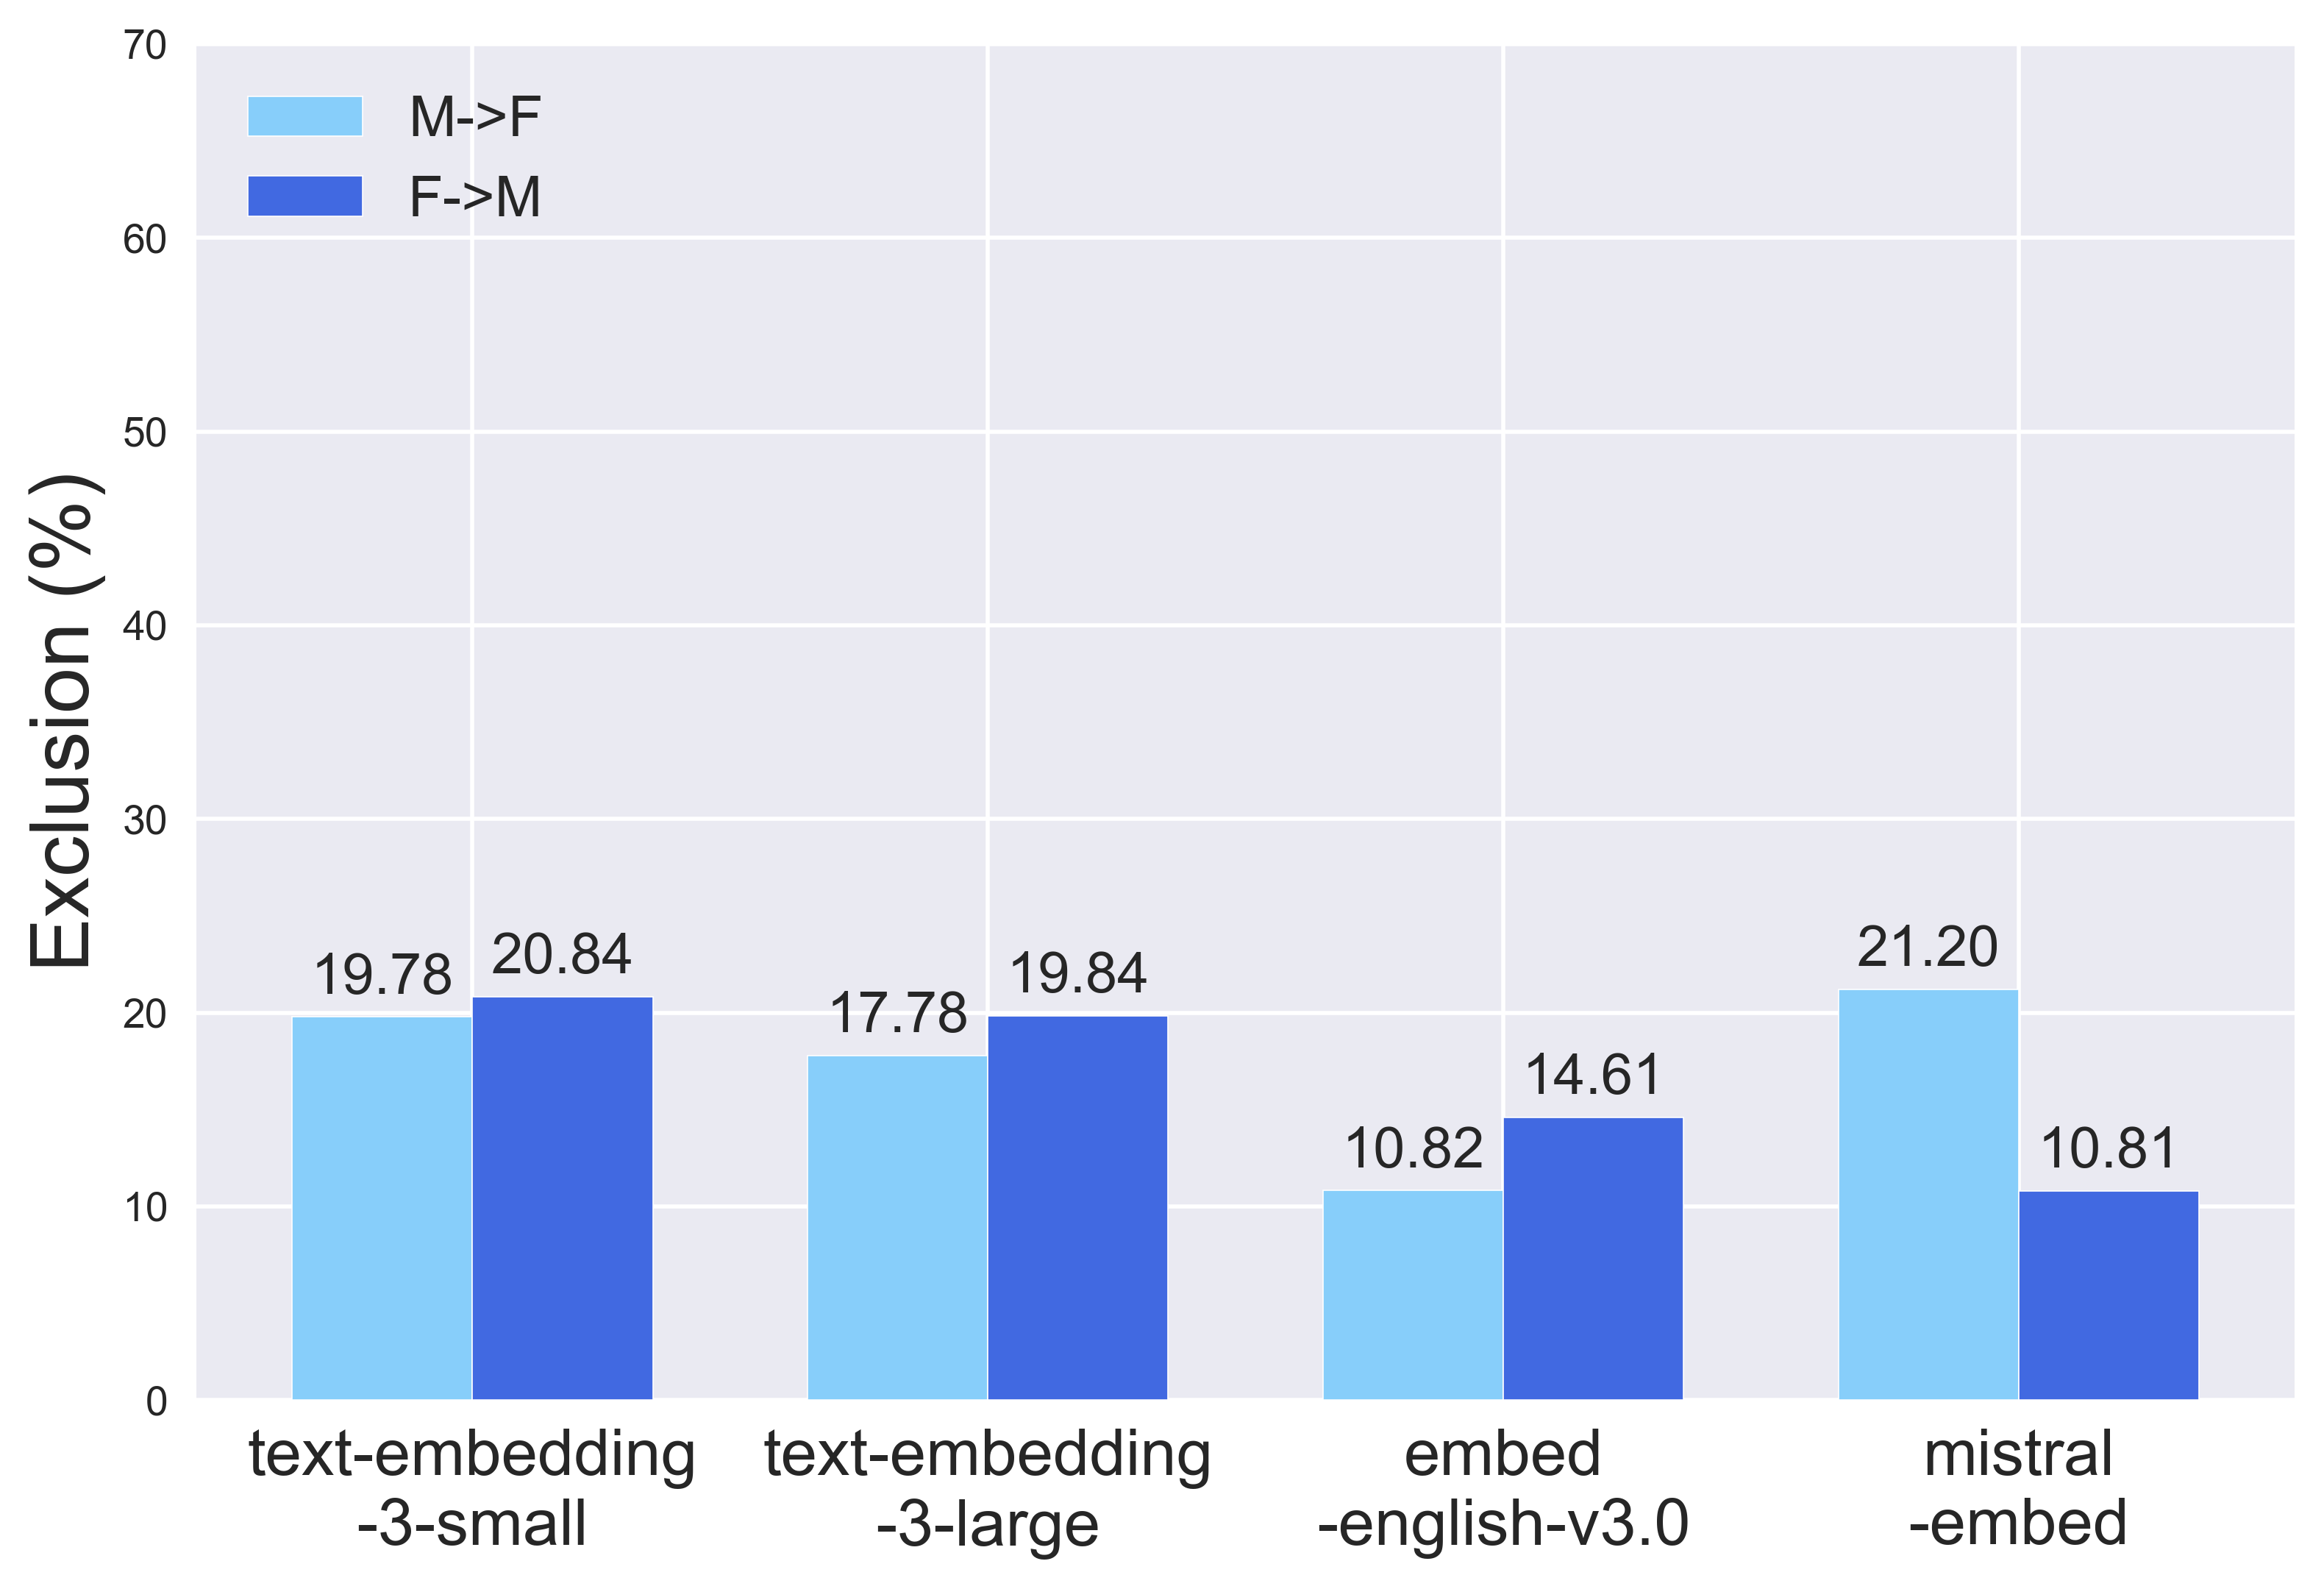
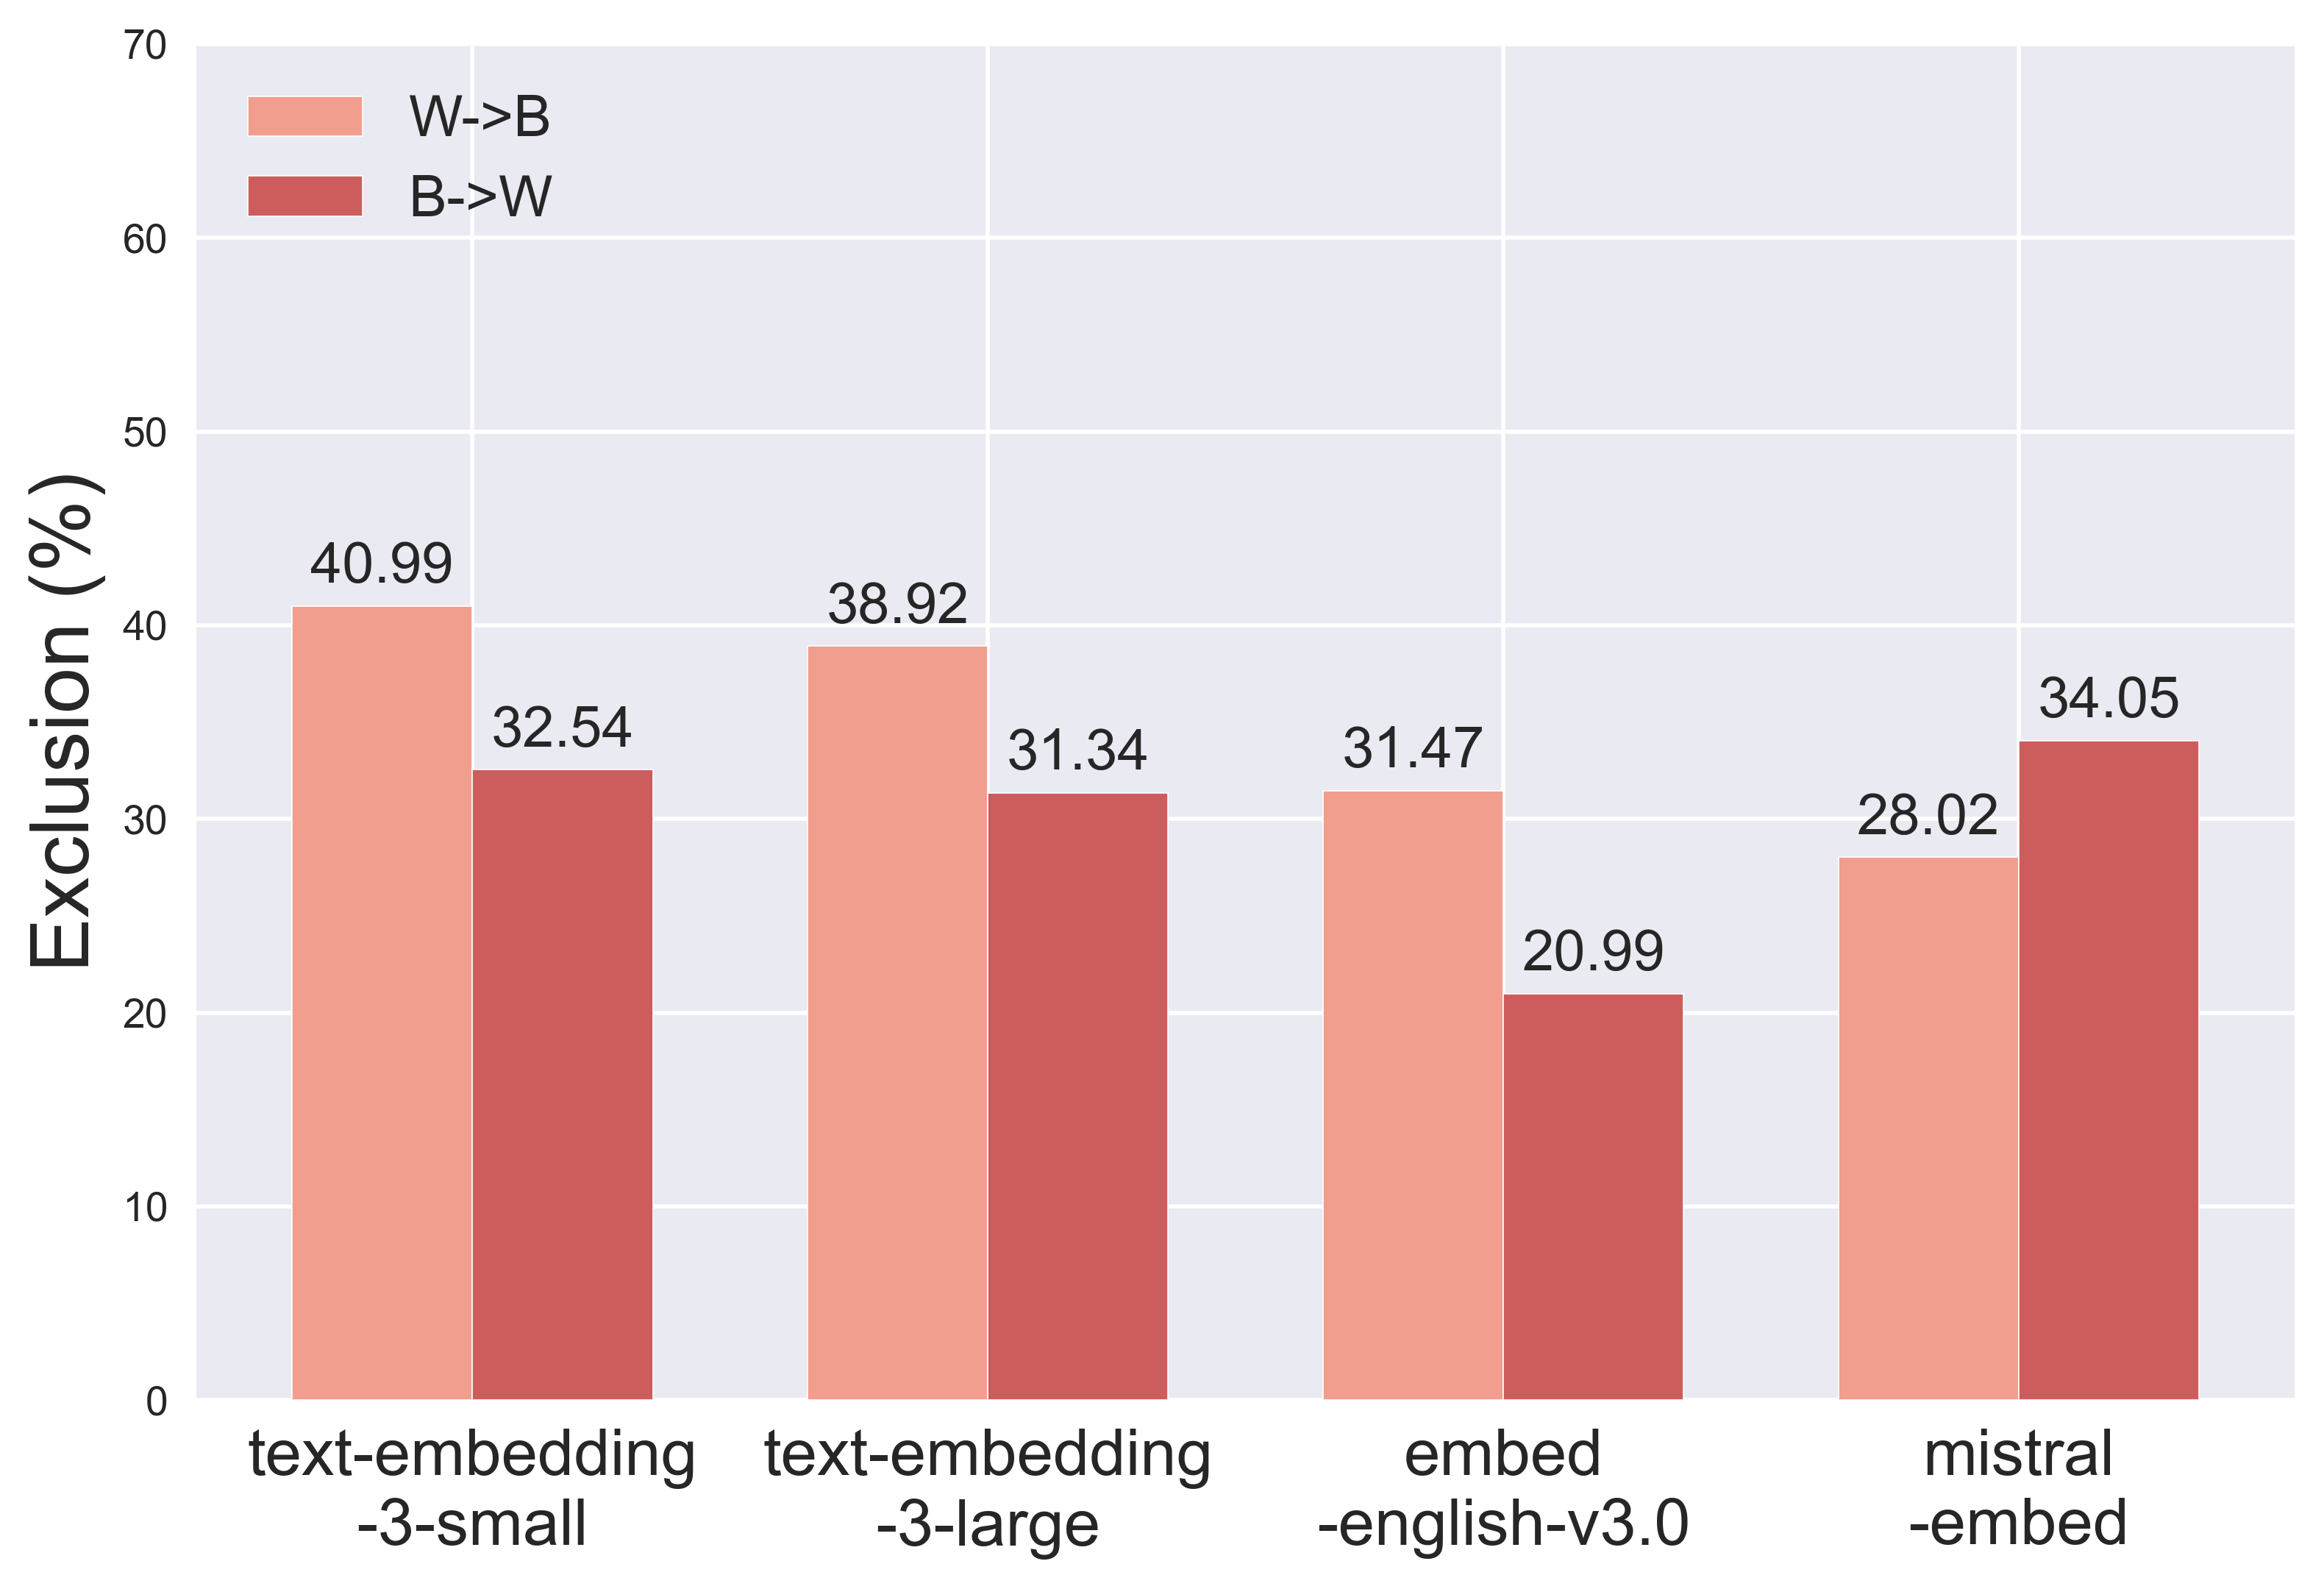
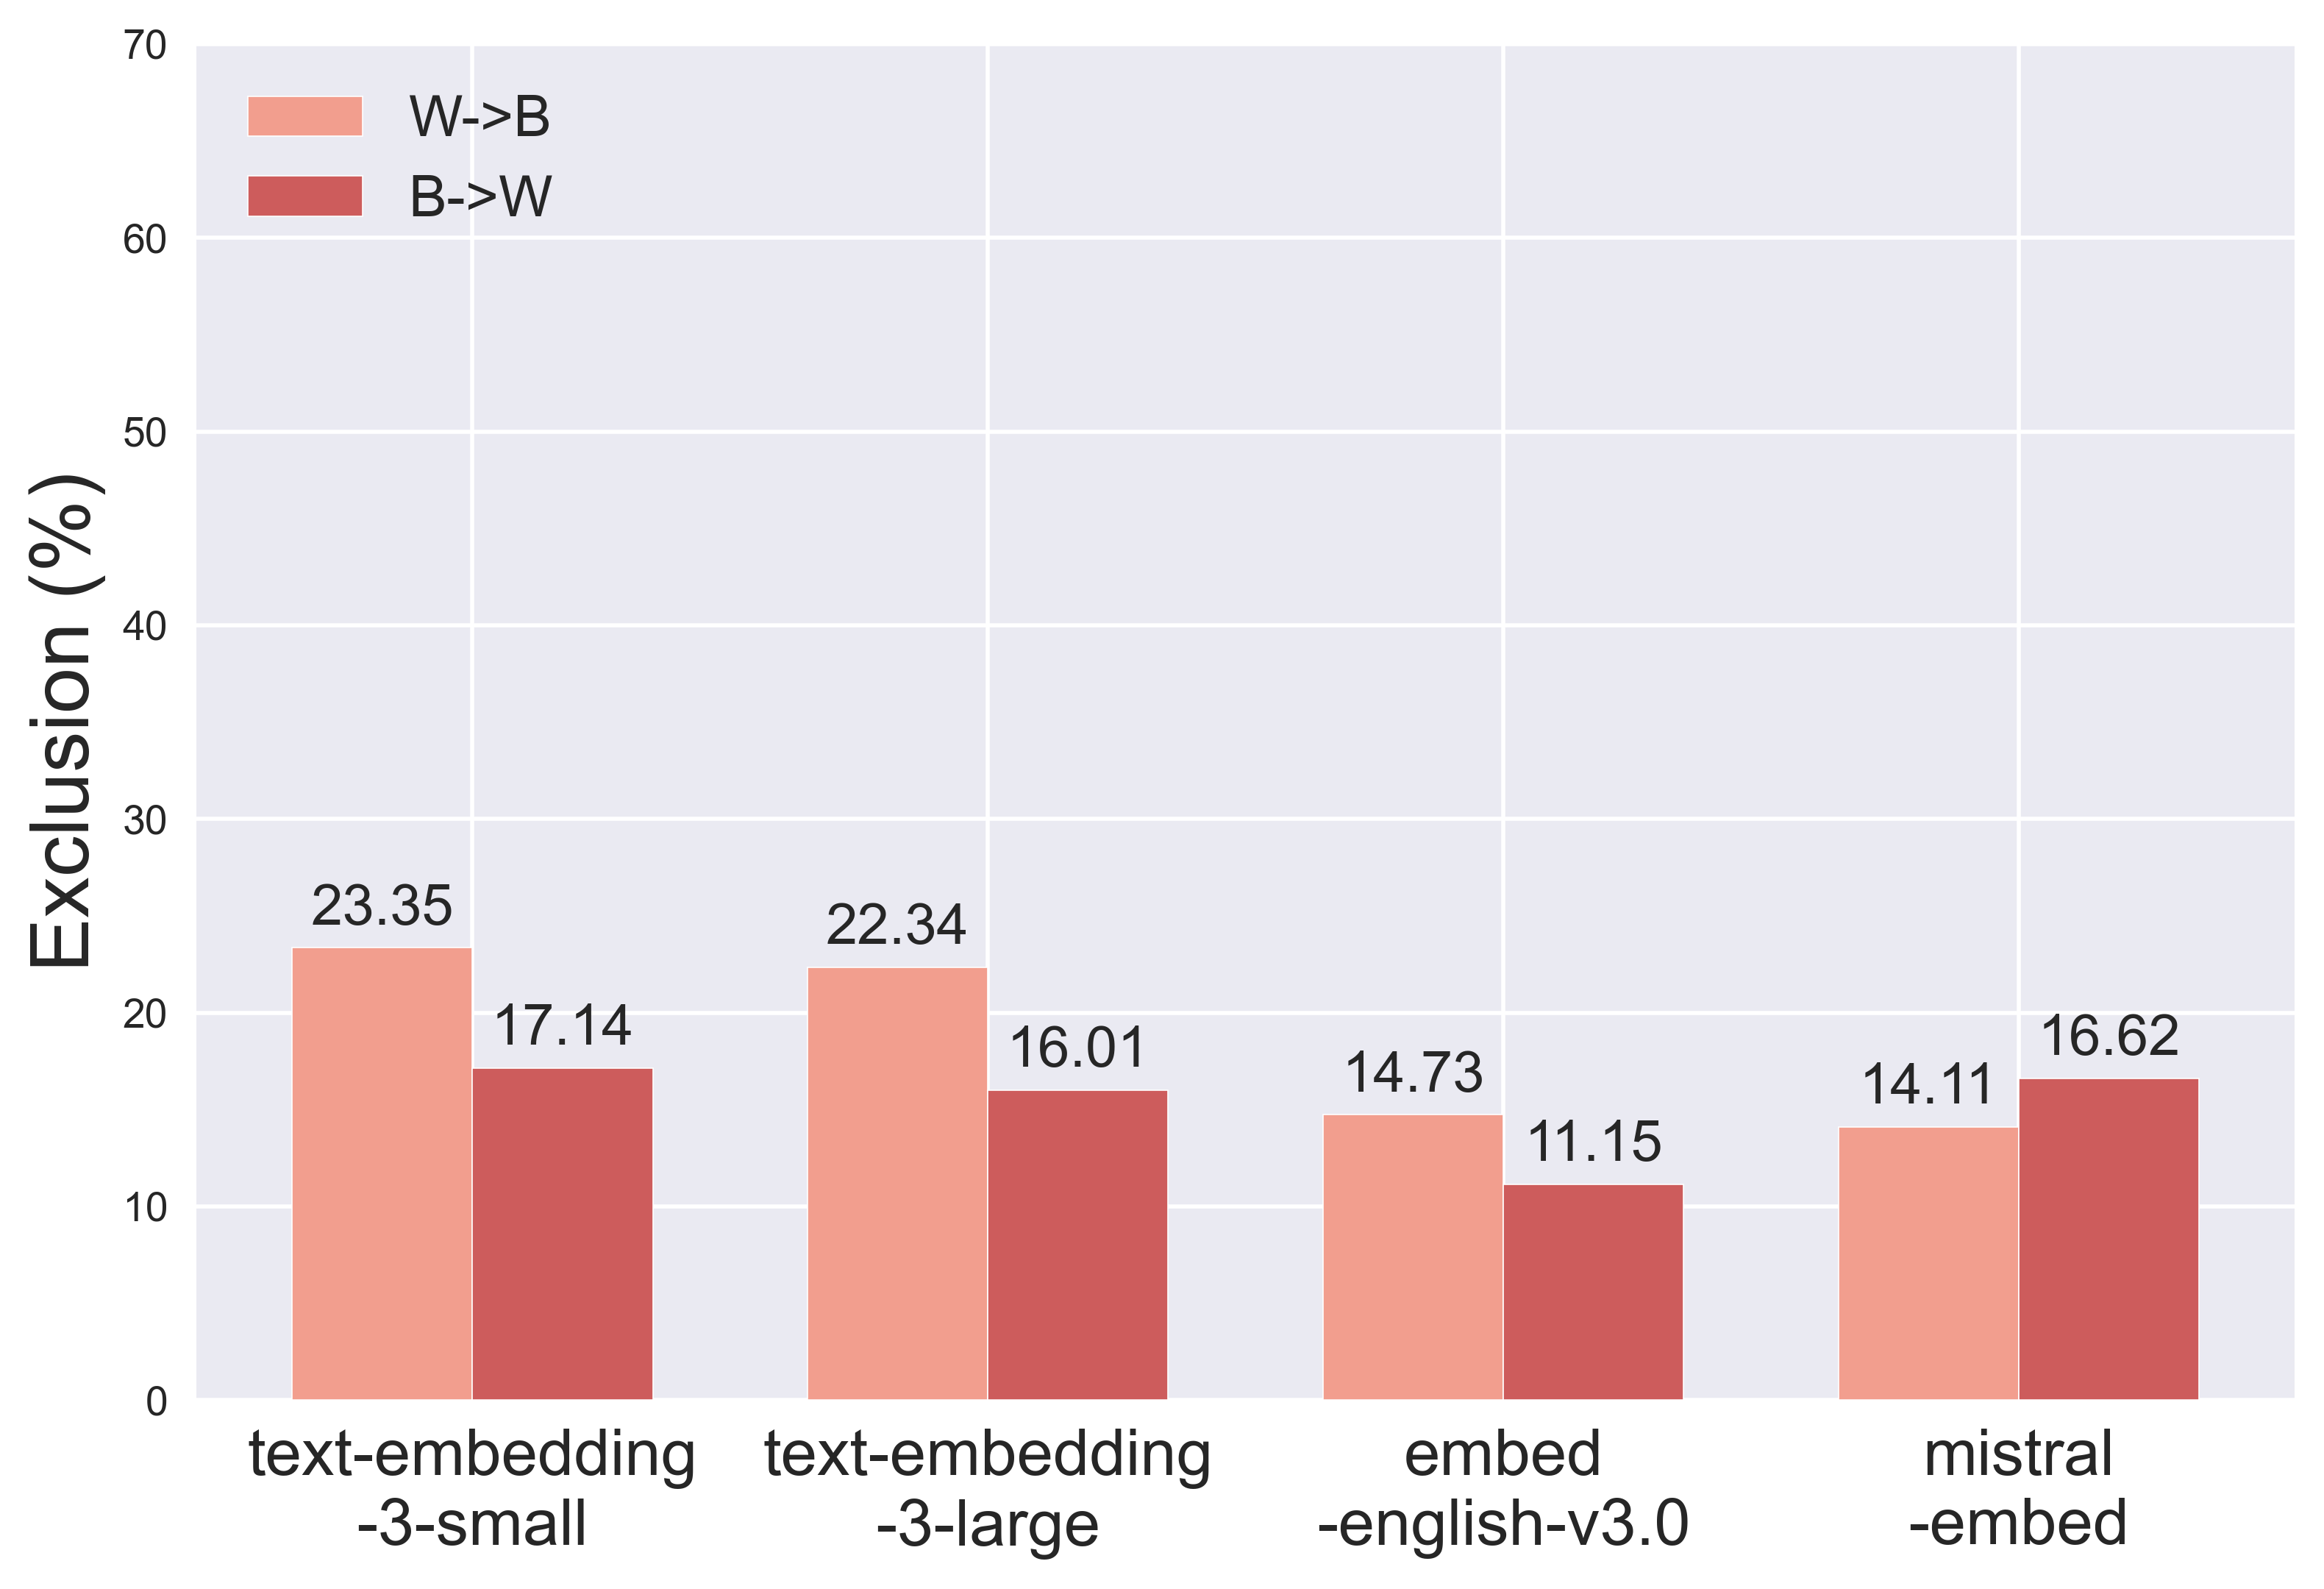
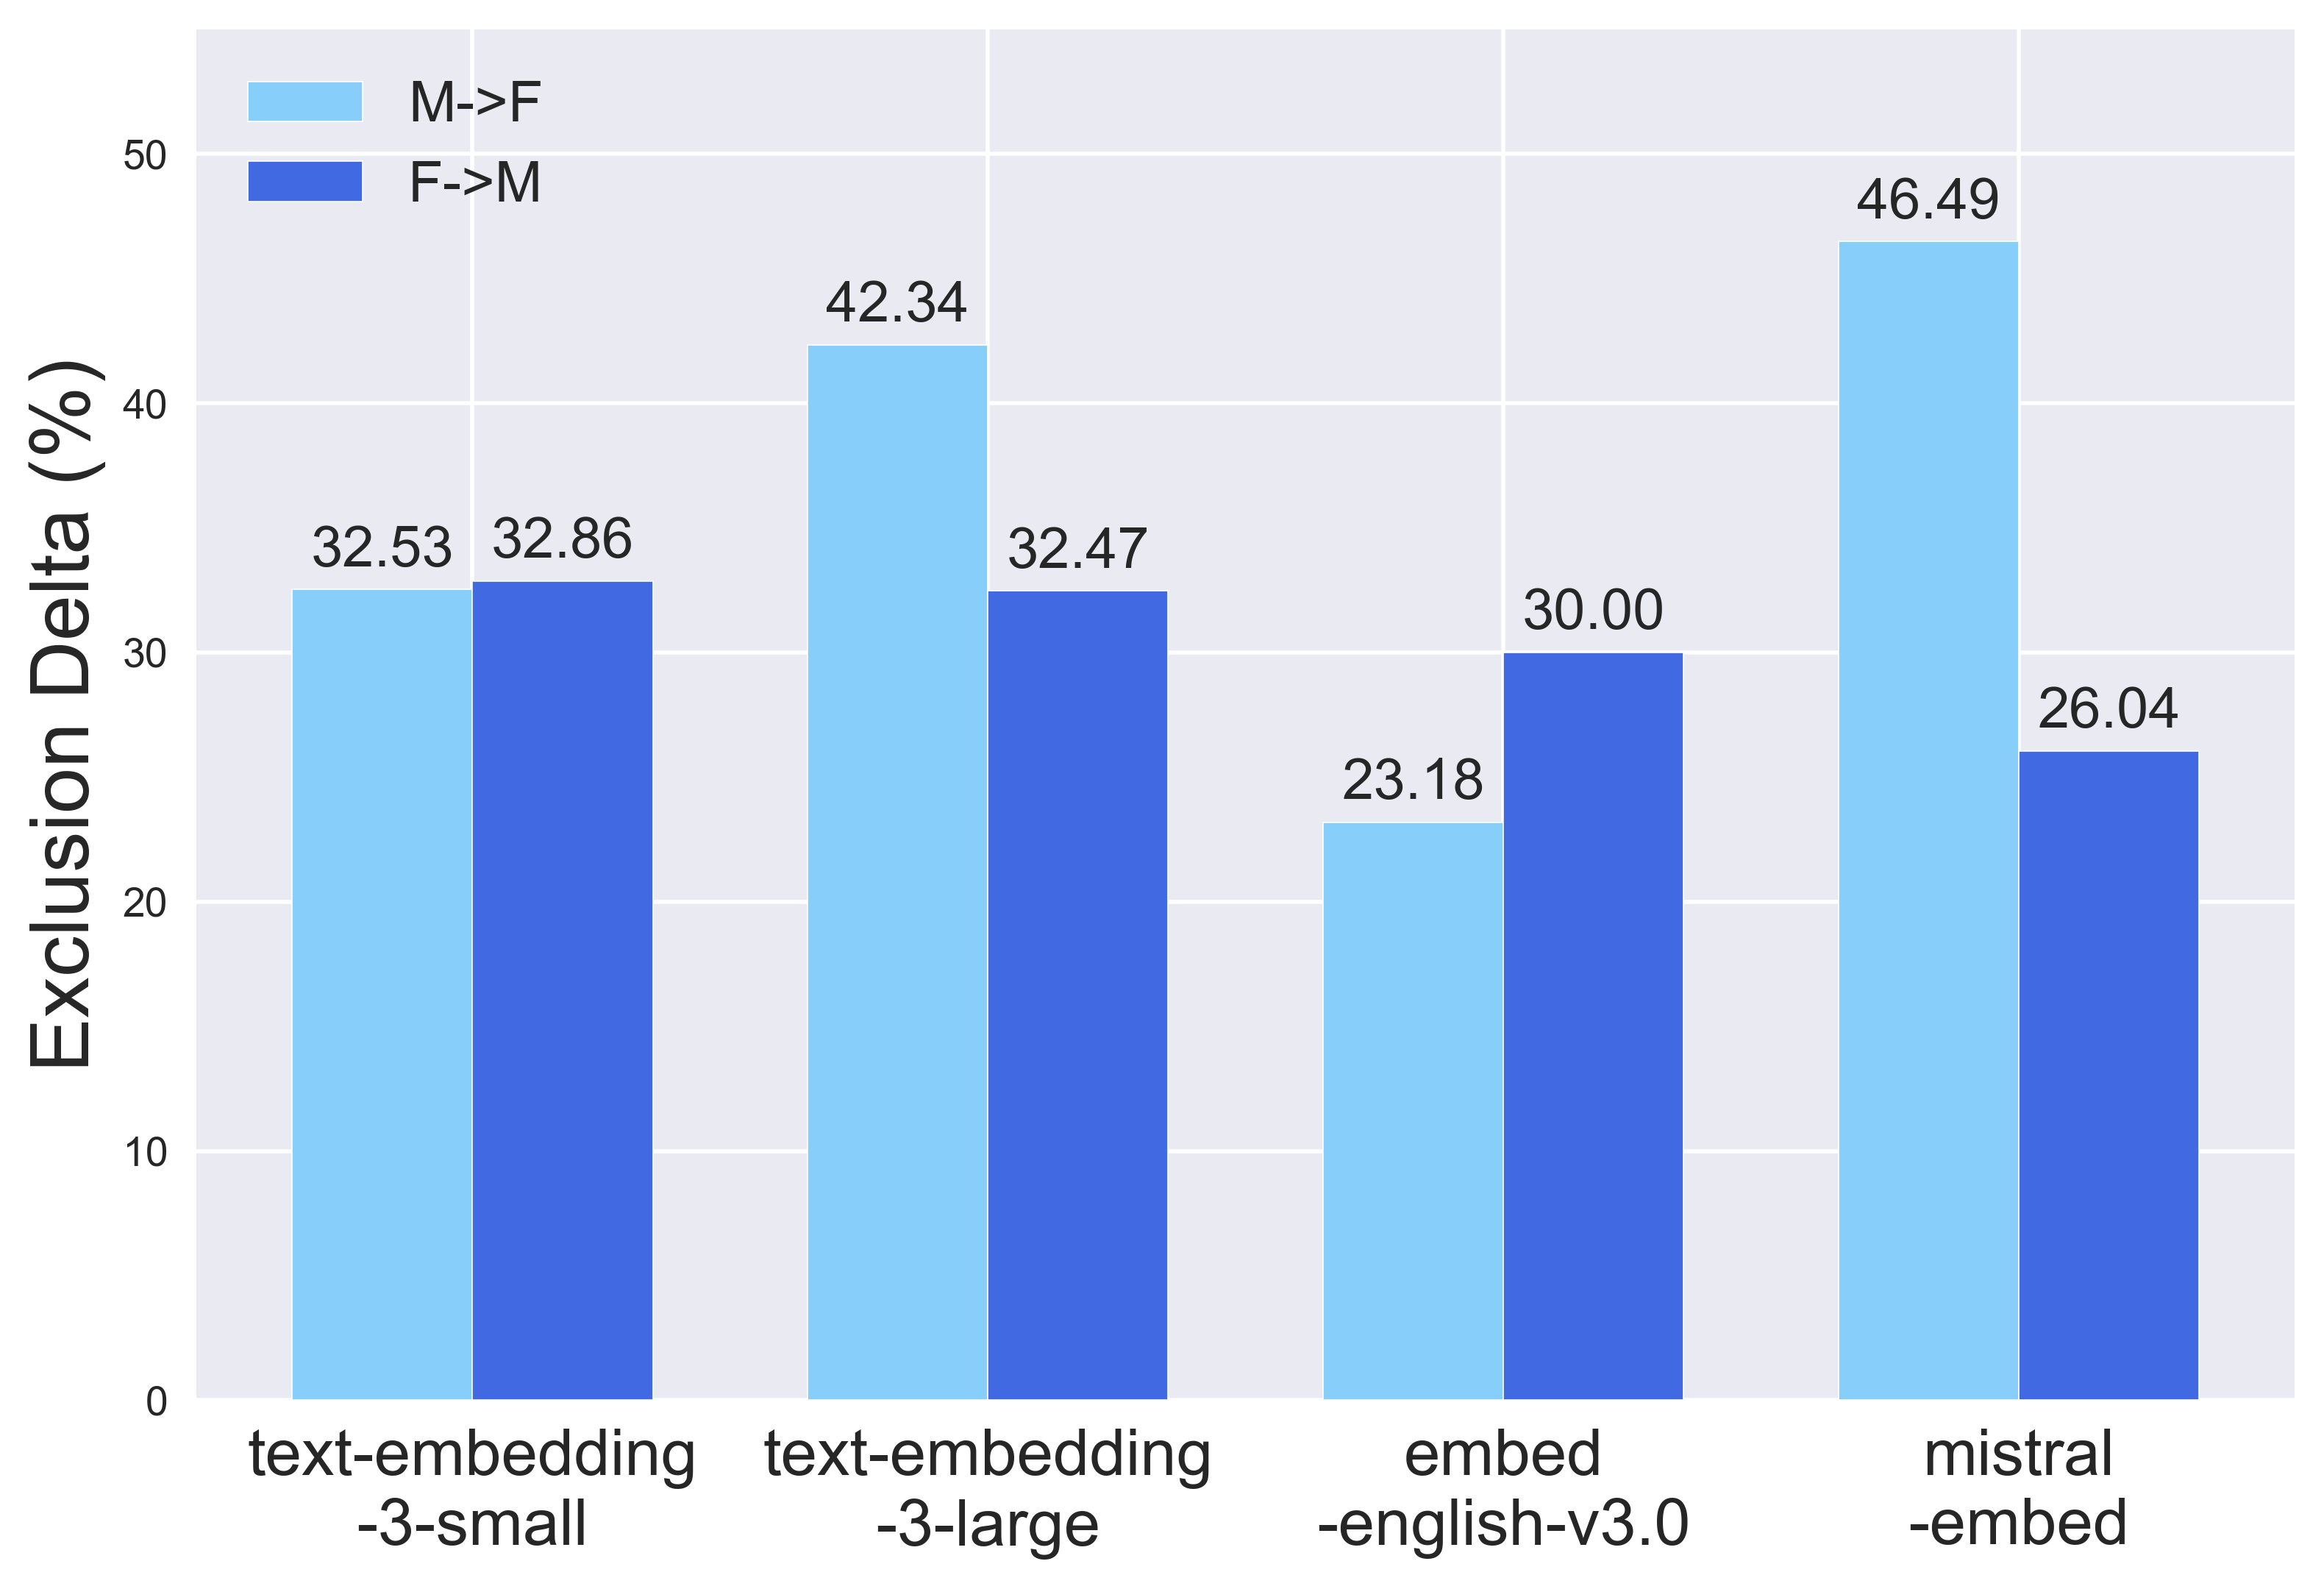
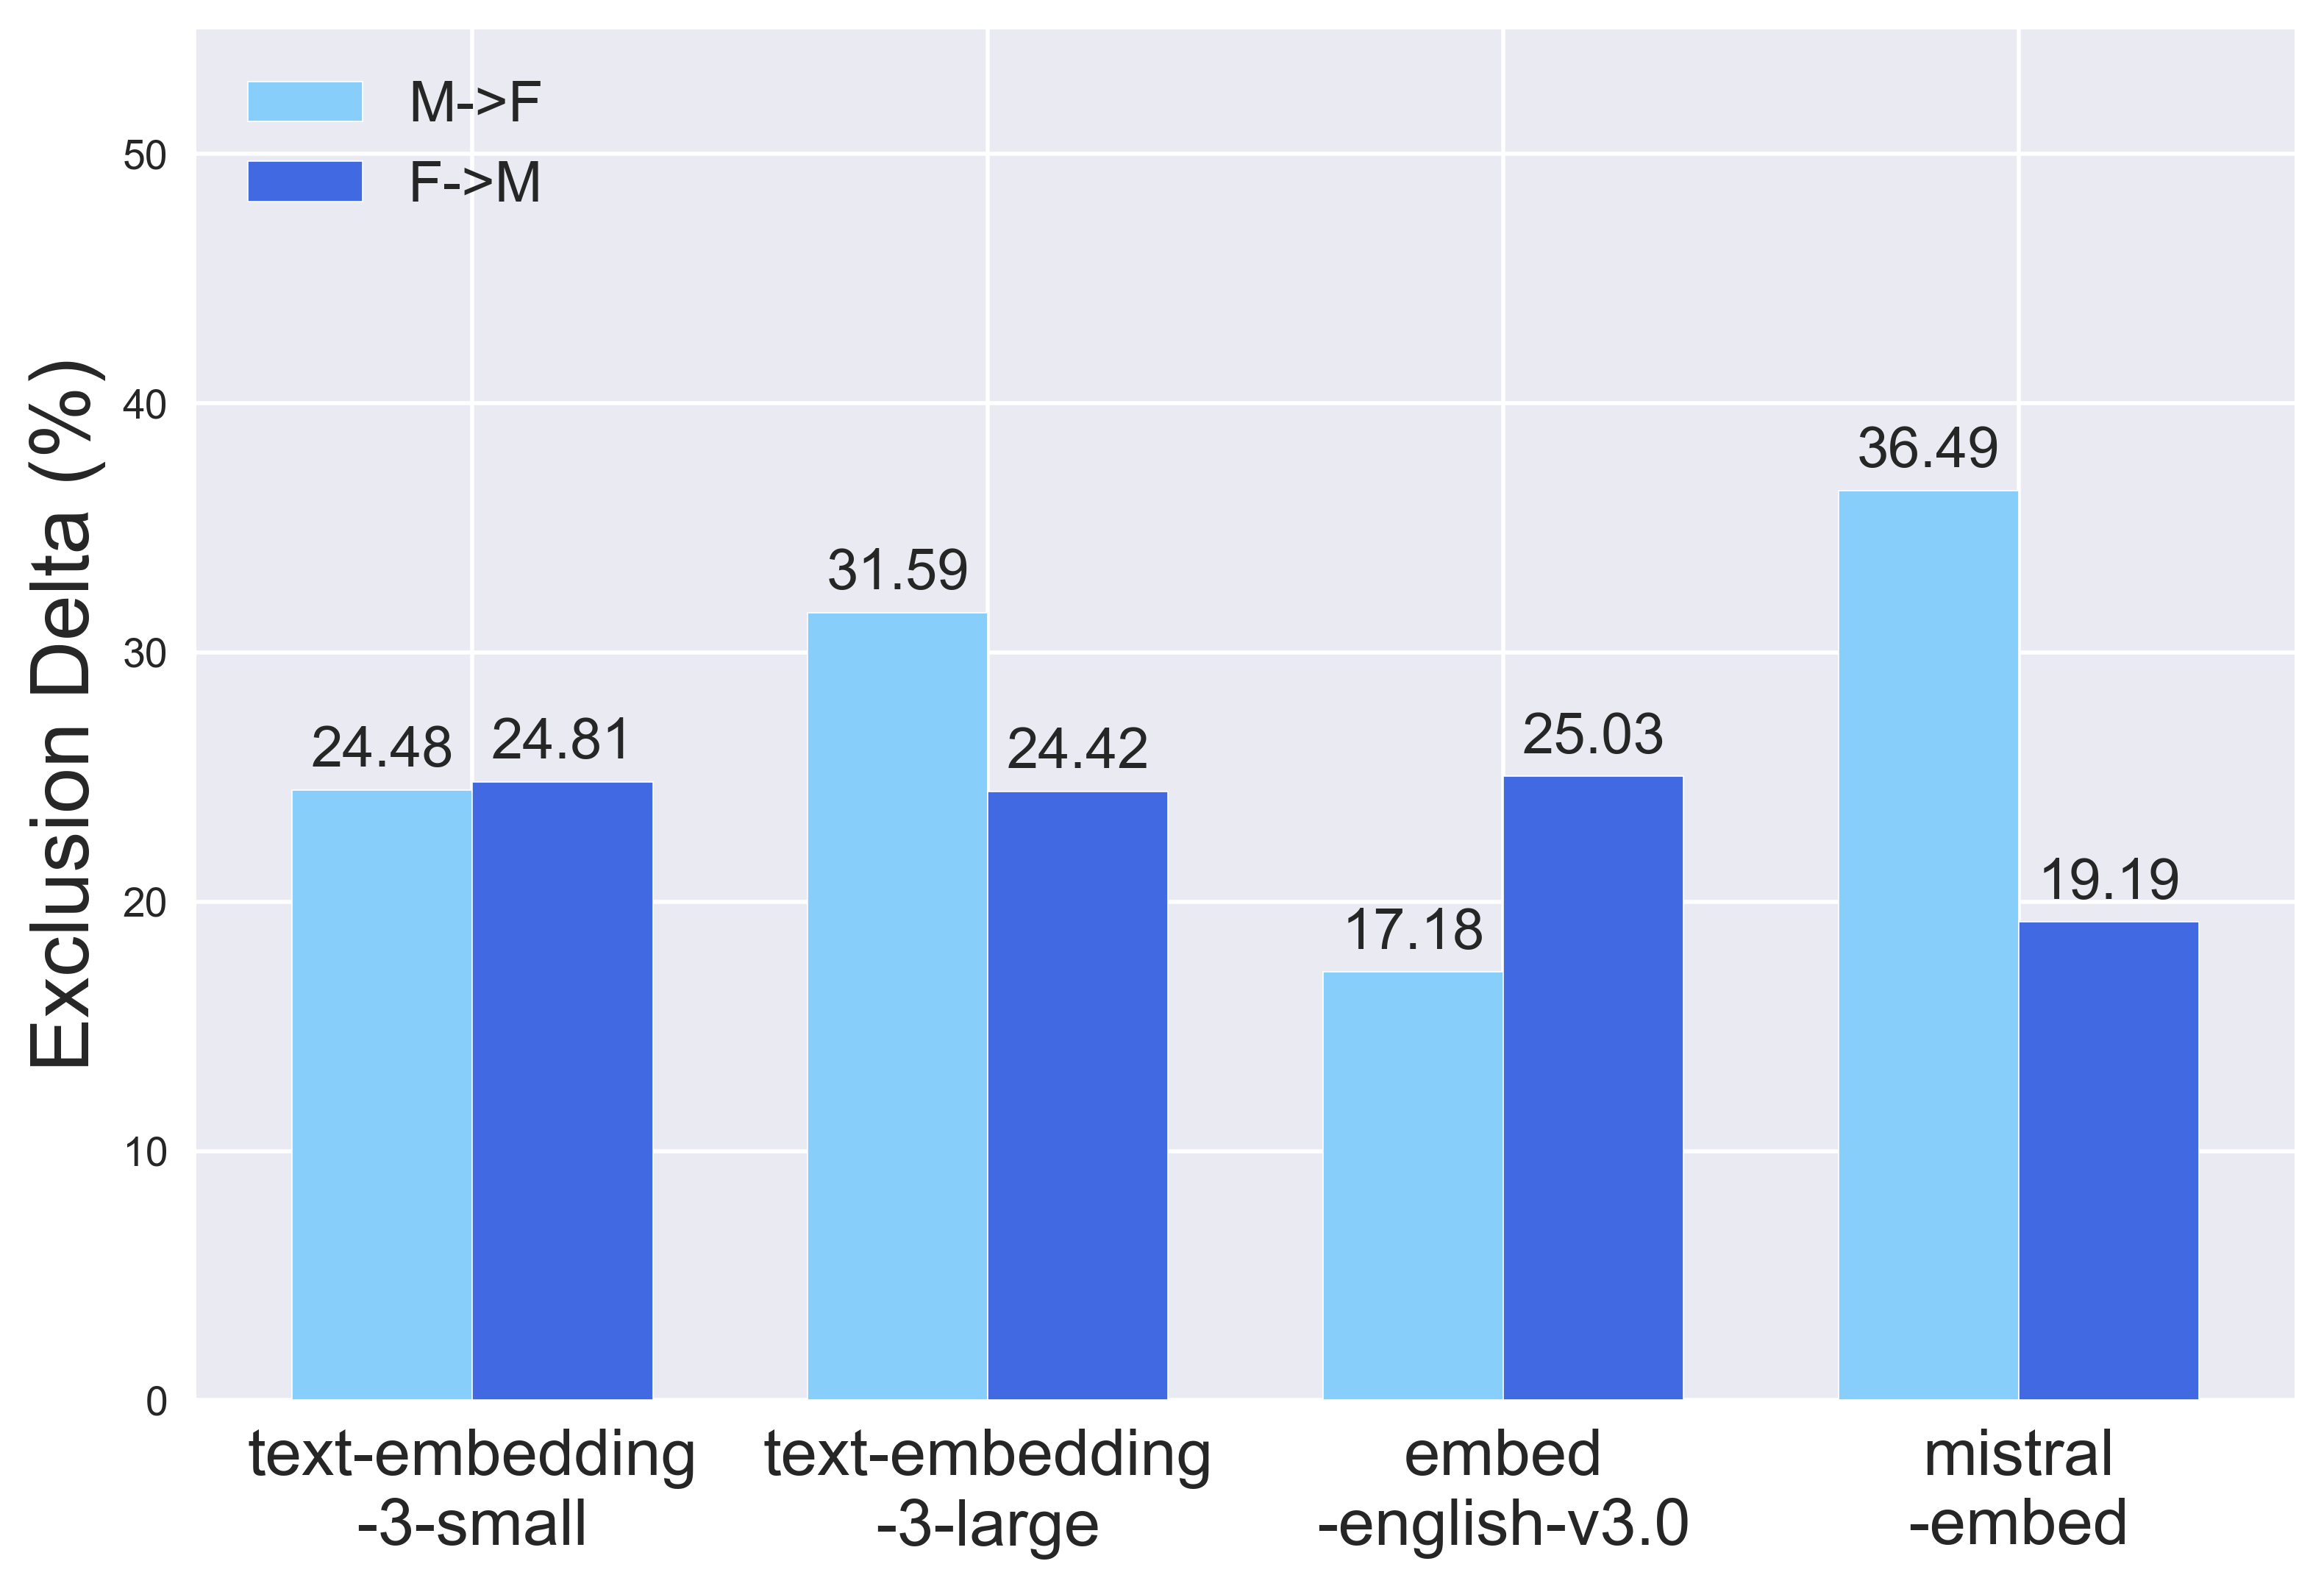
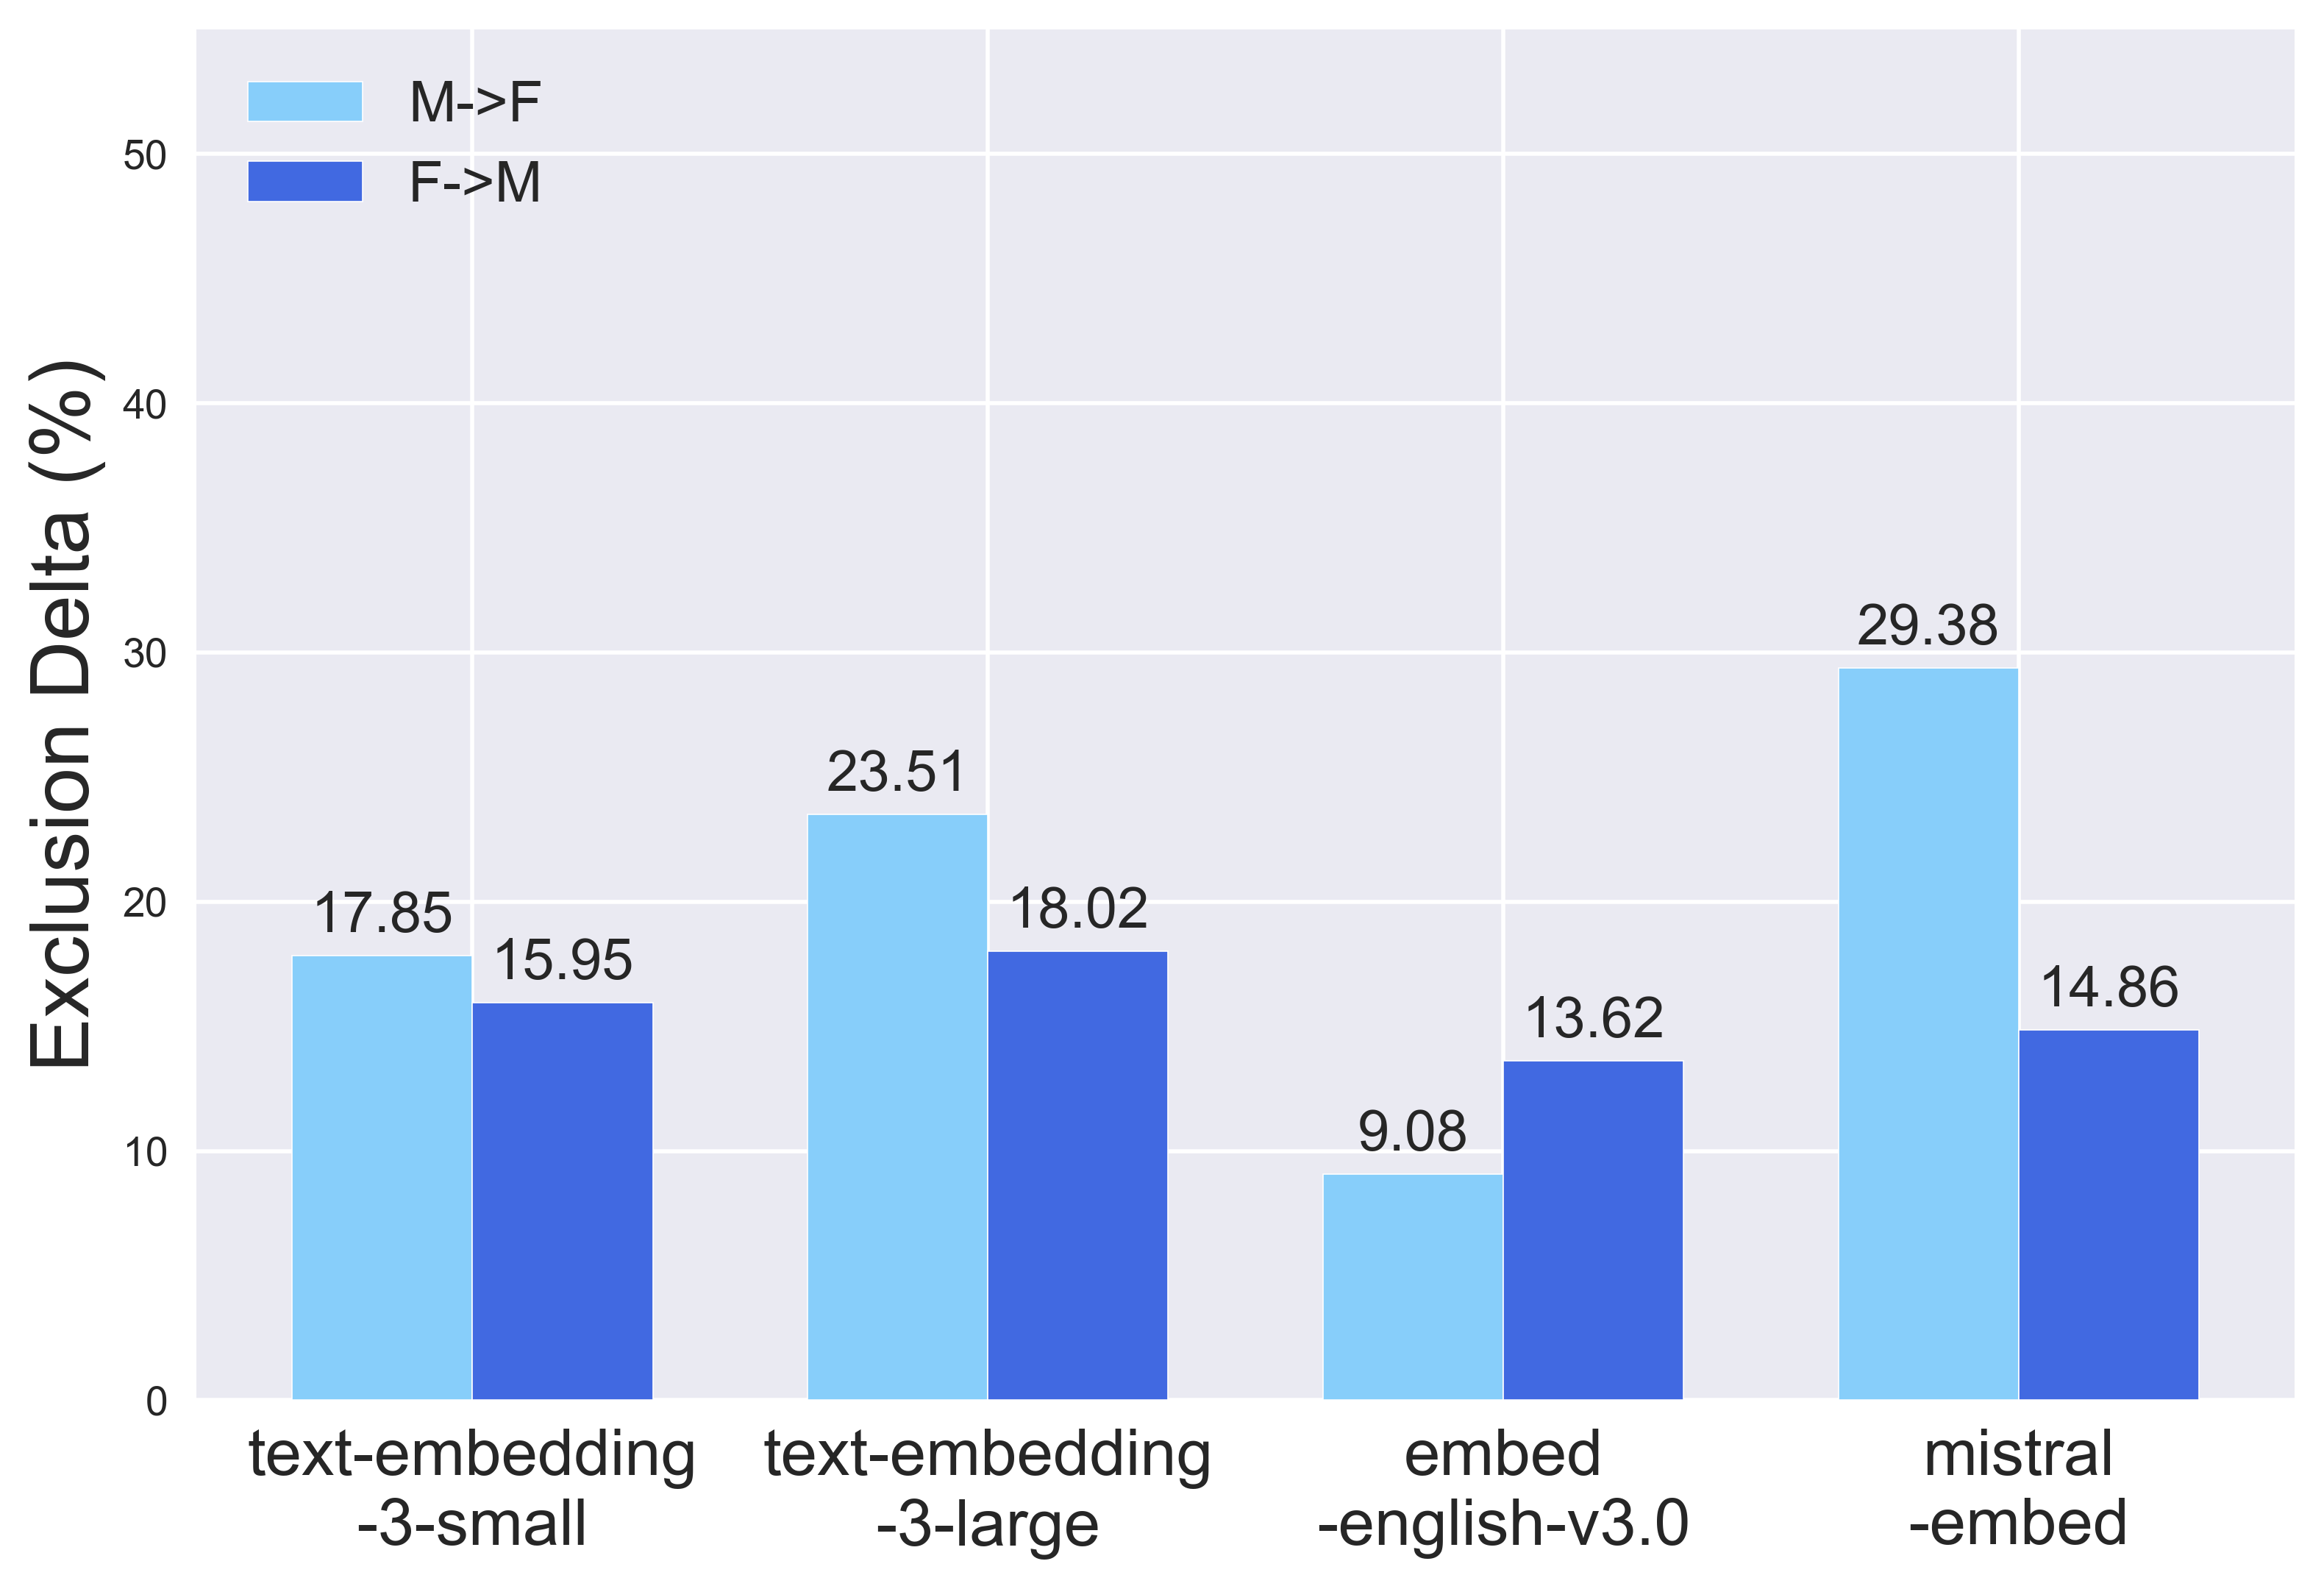
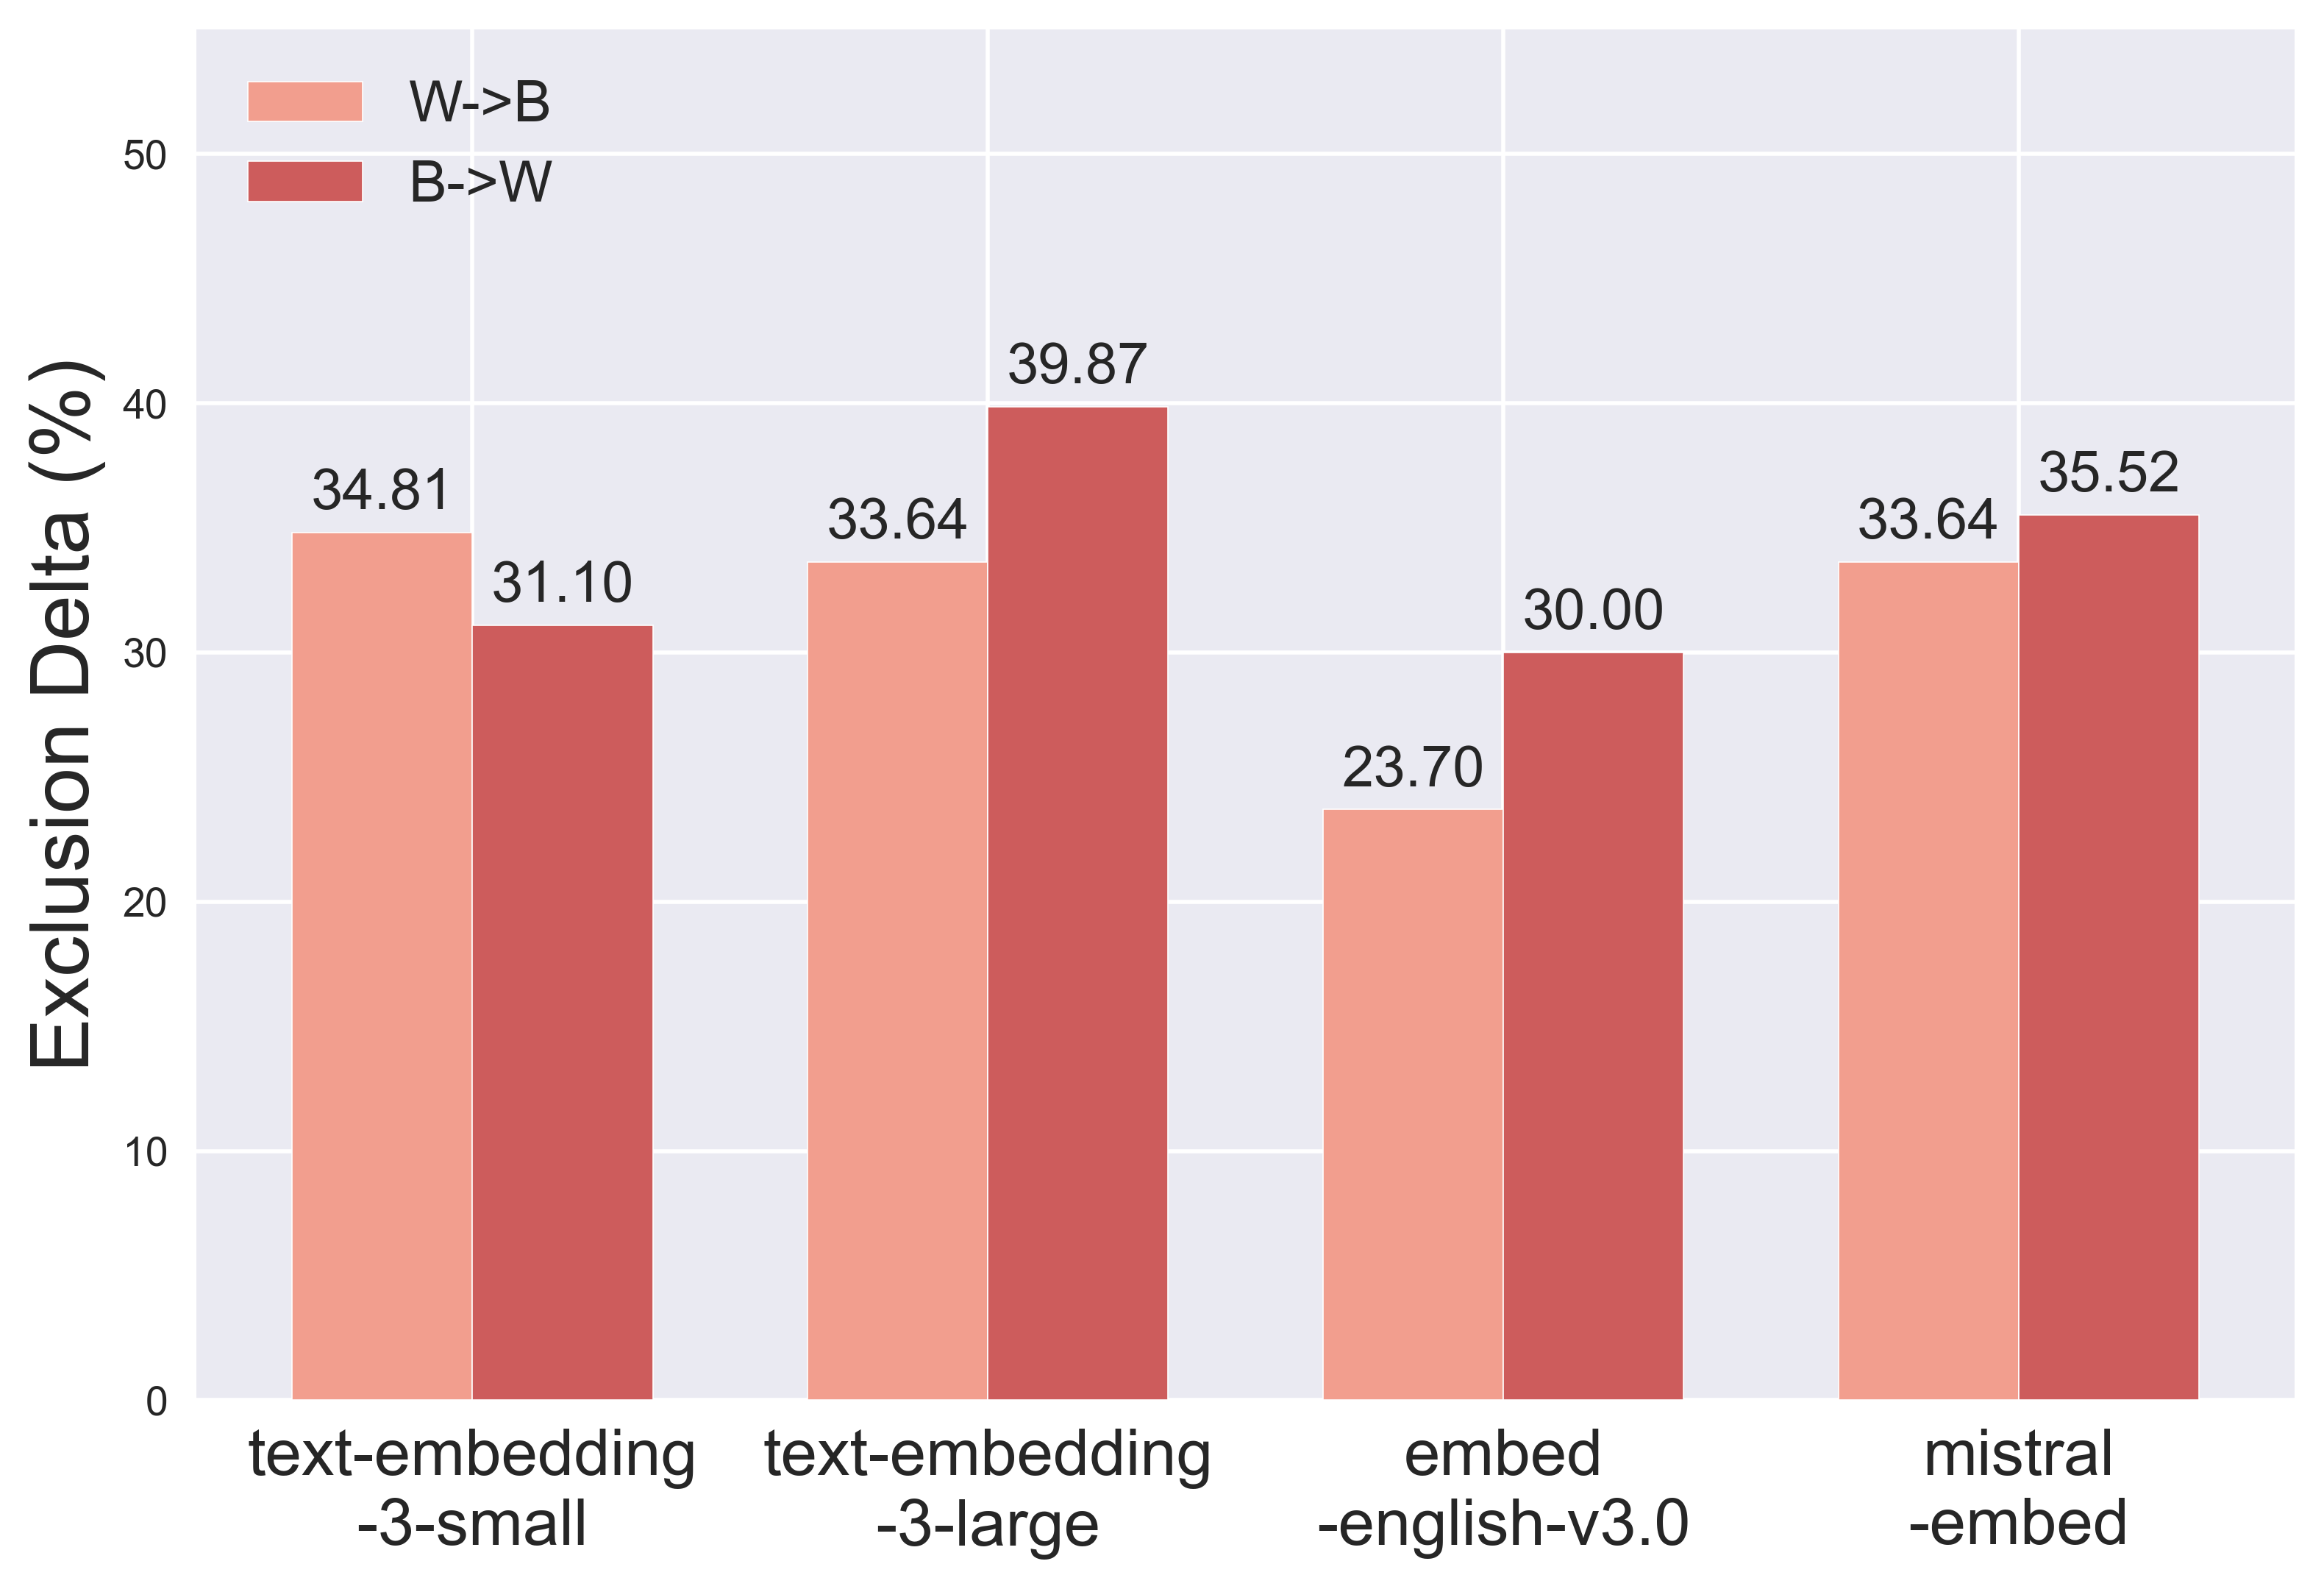
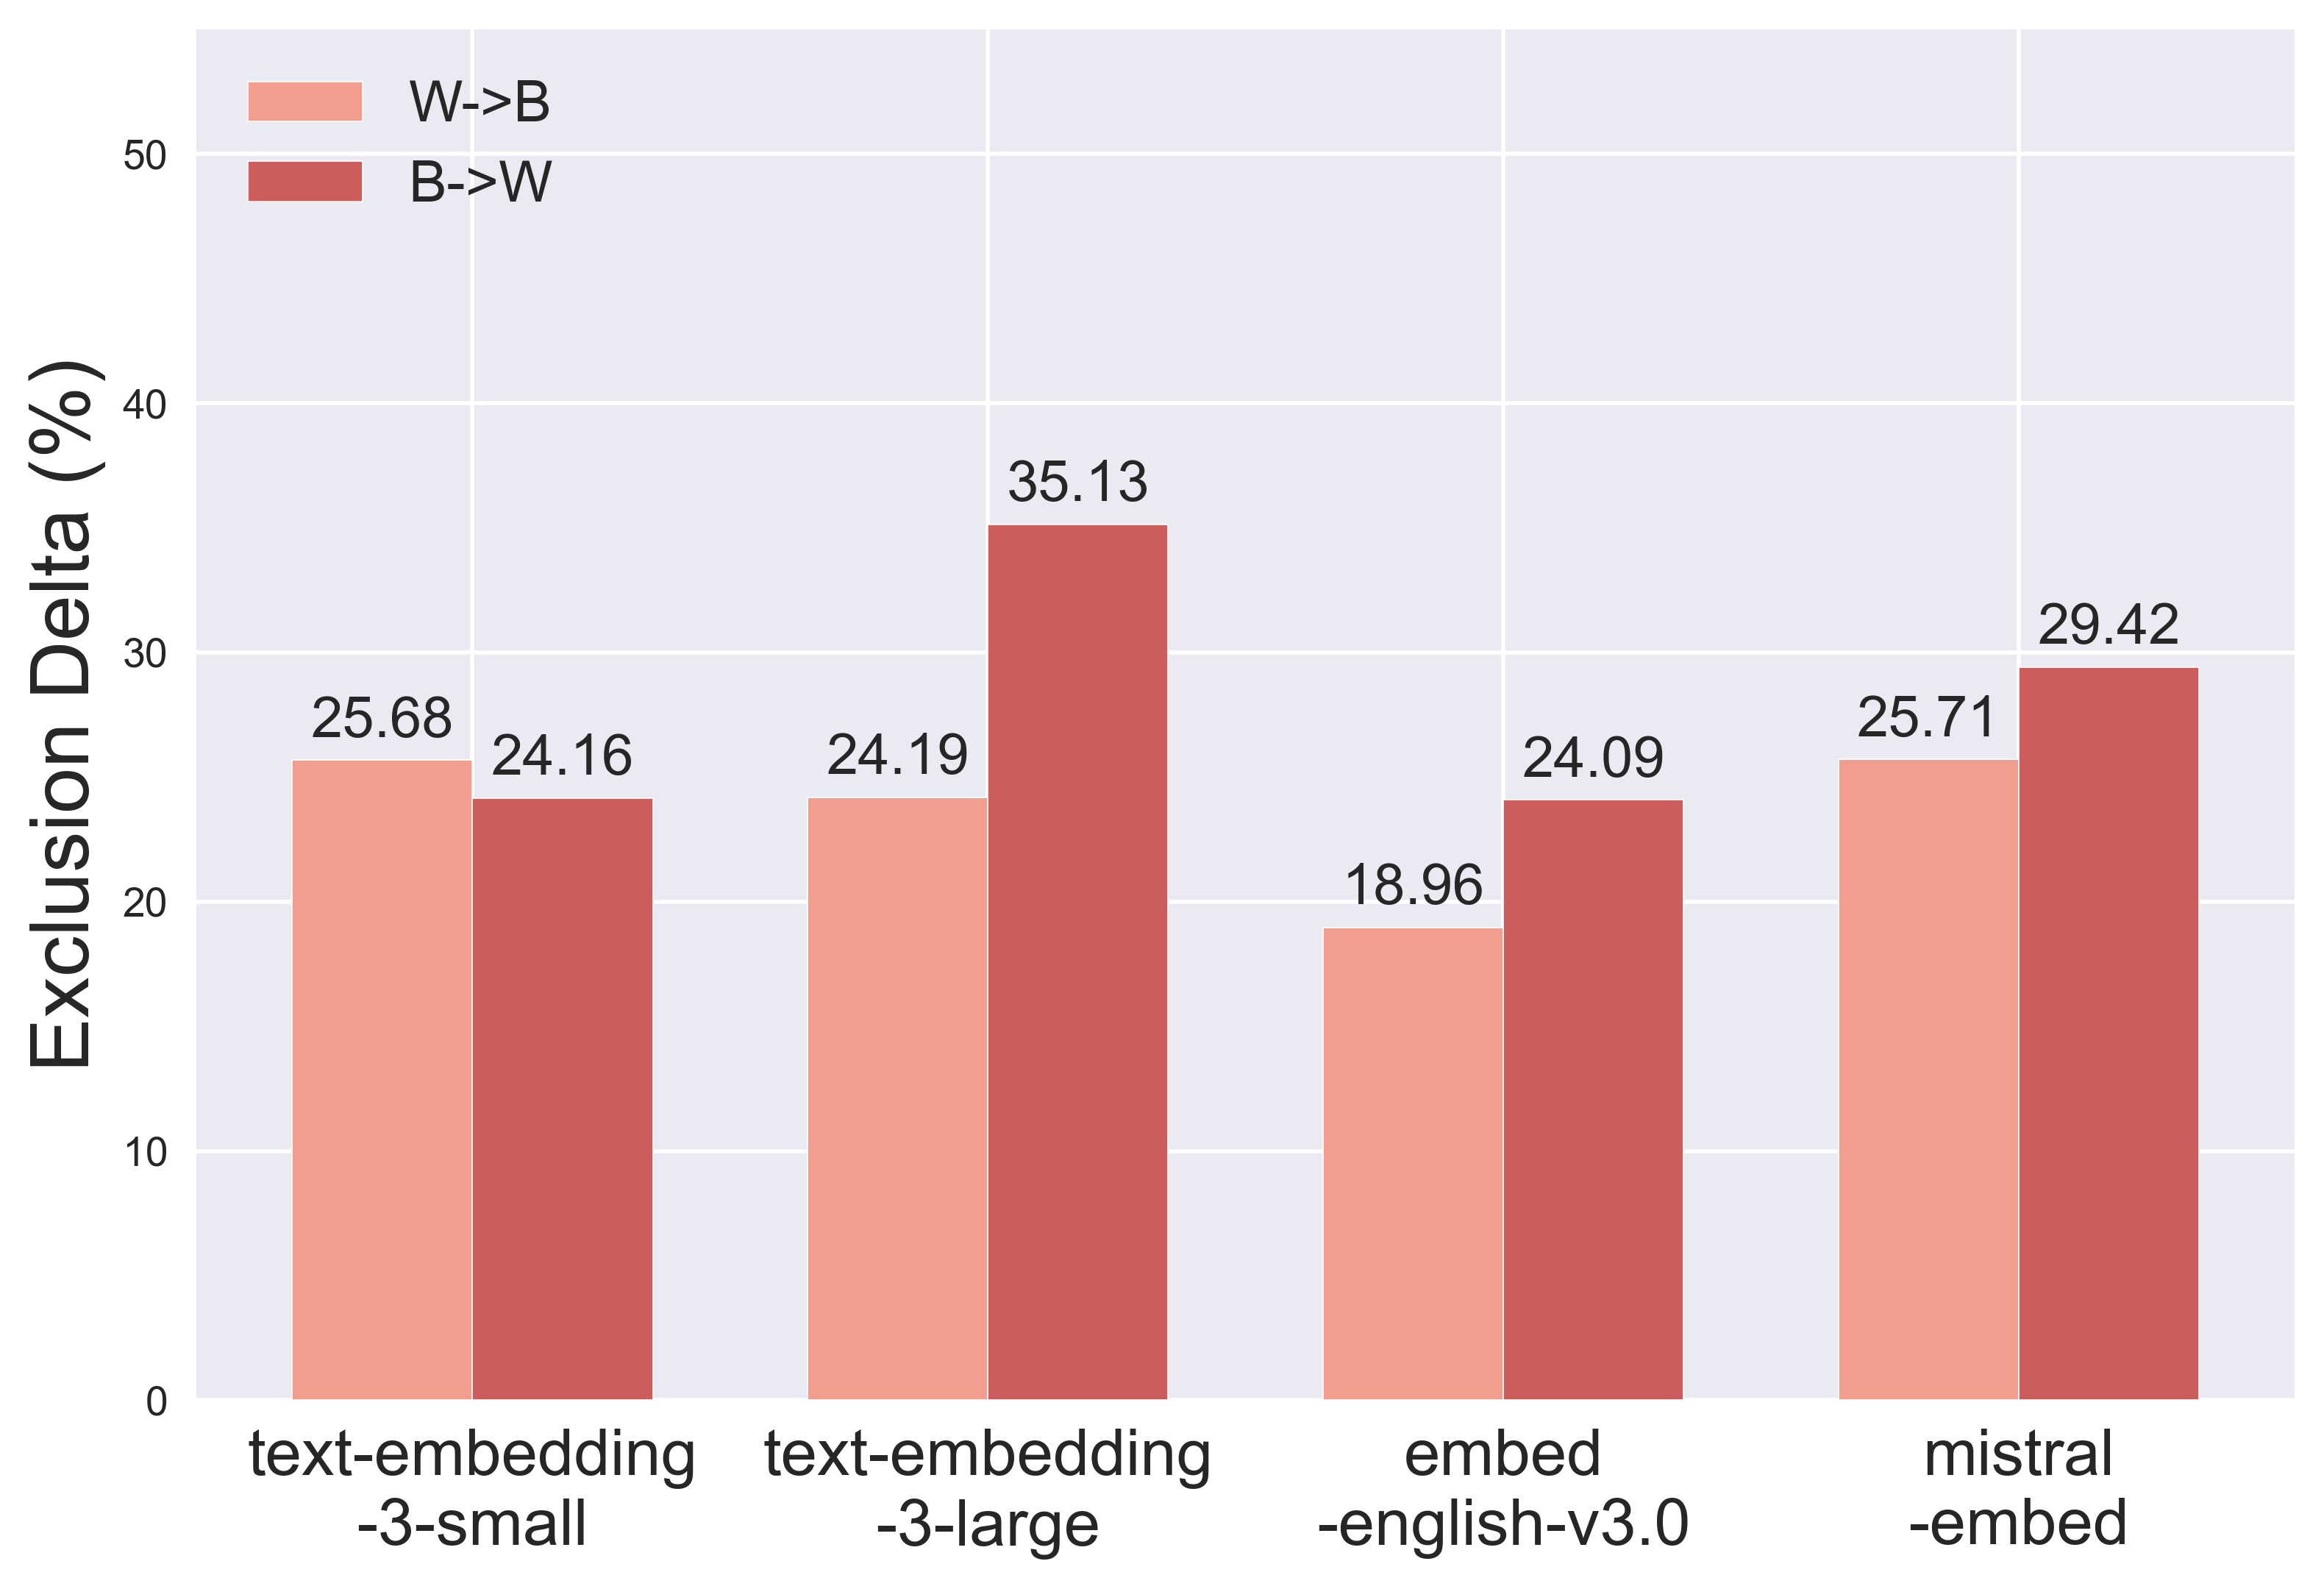
Does model sensitivity to perturbations differ based on the direction of perturbation?
We can also partition the results based on direction of perturbation (Figure 4). We find that the magnitude of difference exceeds a threshold of 5% (e.g., the absolute difference in exclusion for M F vs. F M or W B vs. B W for the same model, , and resume type is ) in 26/48 cases across generated and Kaggle resumes, indicating models often exhibit higher sensitivity to one direction of perturbation over the other. In particular, the gender directional difference is notable for mistral-embed, going from 63.28% for M F to 27.93% for F M, for generated resumes with (Figure 4).
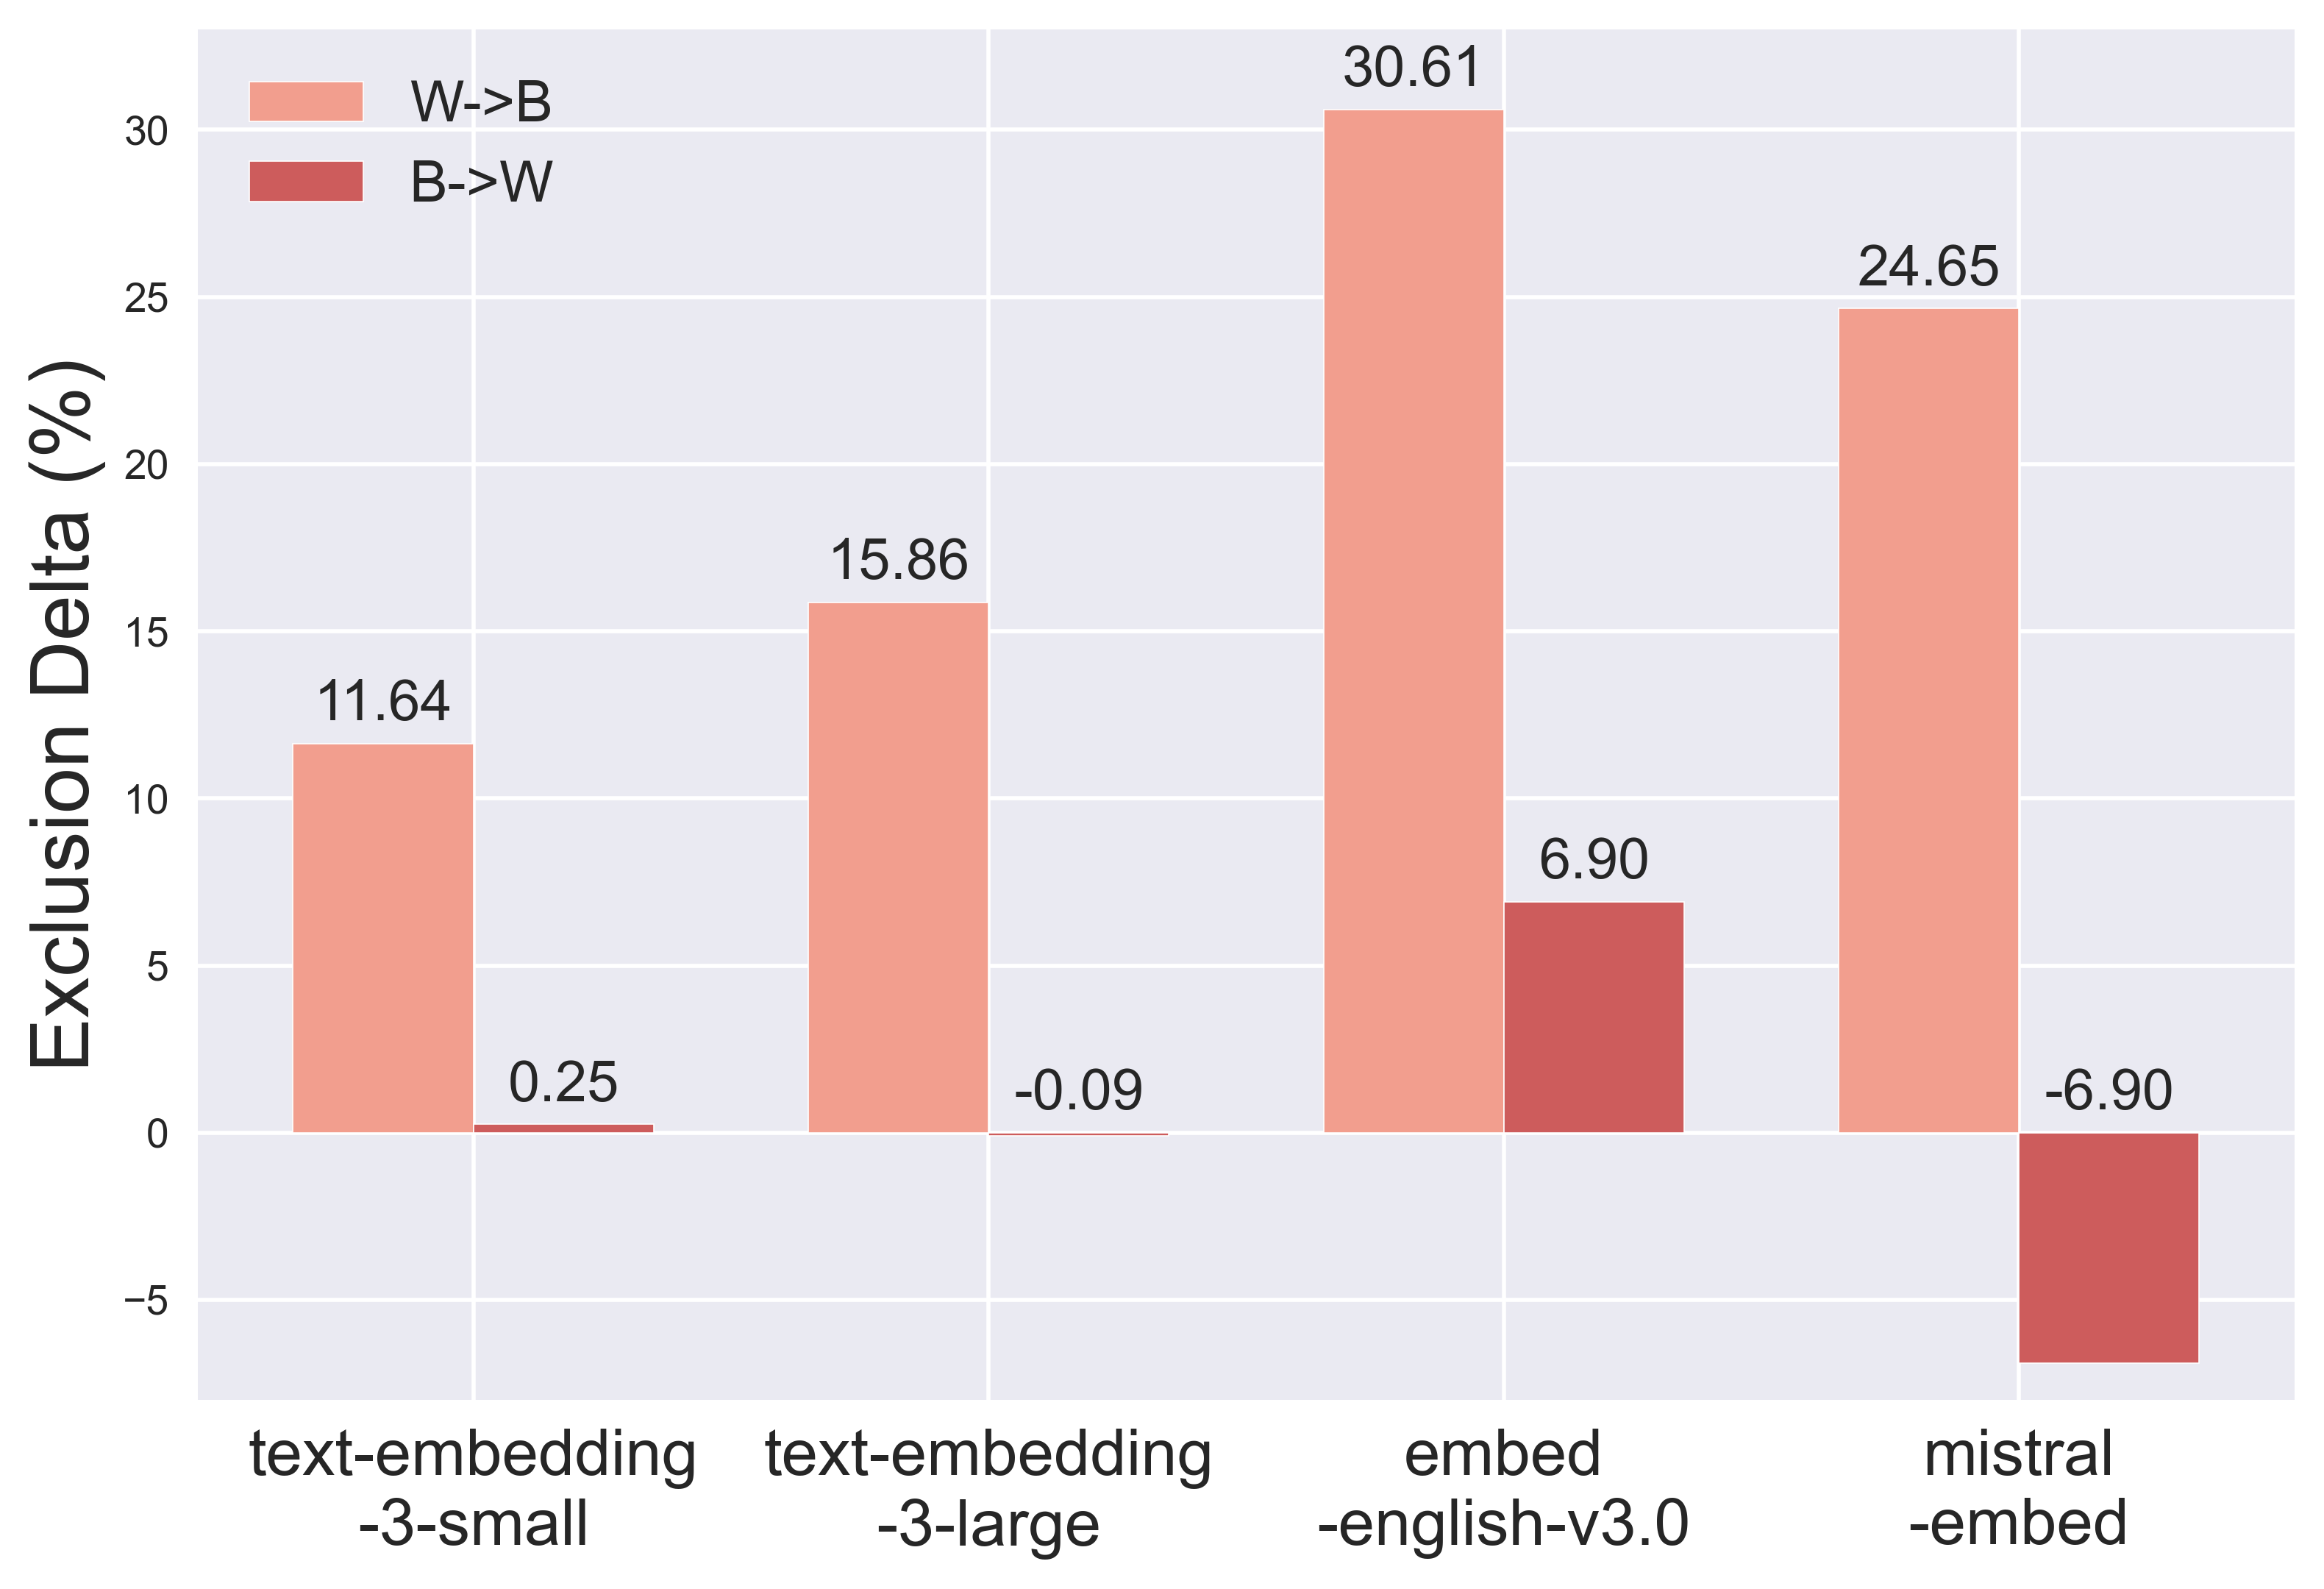
We also observe that models exhibit opposite directional trends for gender and race in Figure 4. For gender, all models except mistral-embed are more sensitive when perturbing female names (marginalized) to male names (non-marginalized); for race, all models except mistral-embed are more sensitive when perturbing White names (non-marginalized) to Black names (marginalized). These results highlight an asymmetry in how models handle different types of demographic changes.
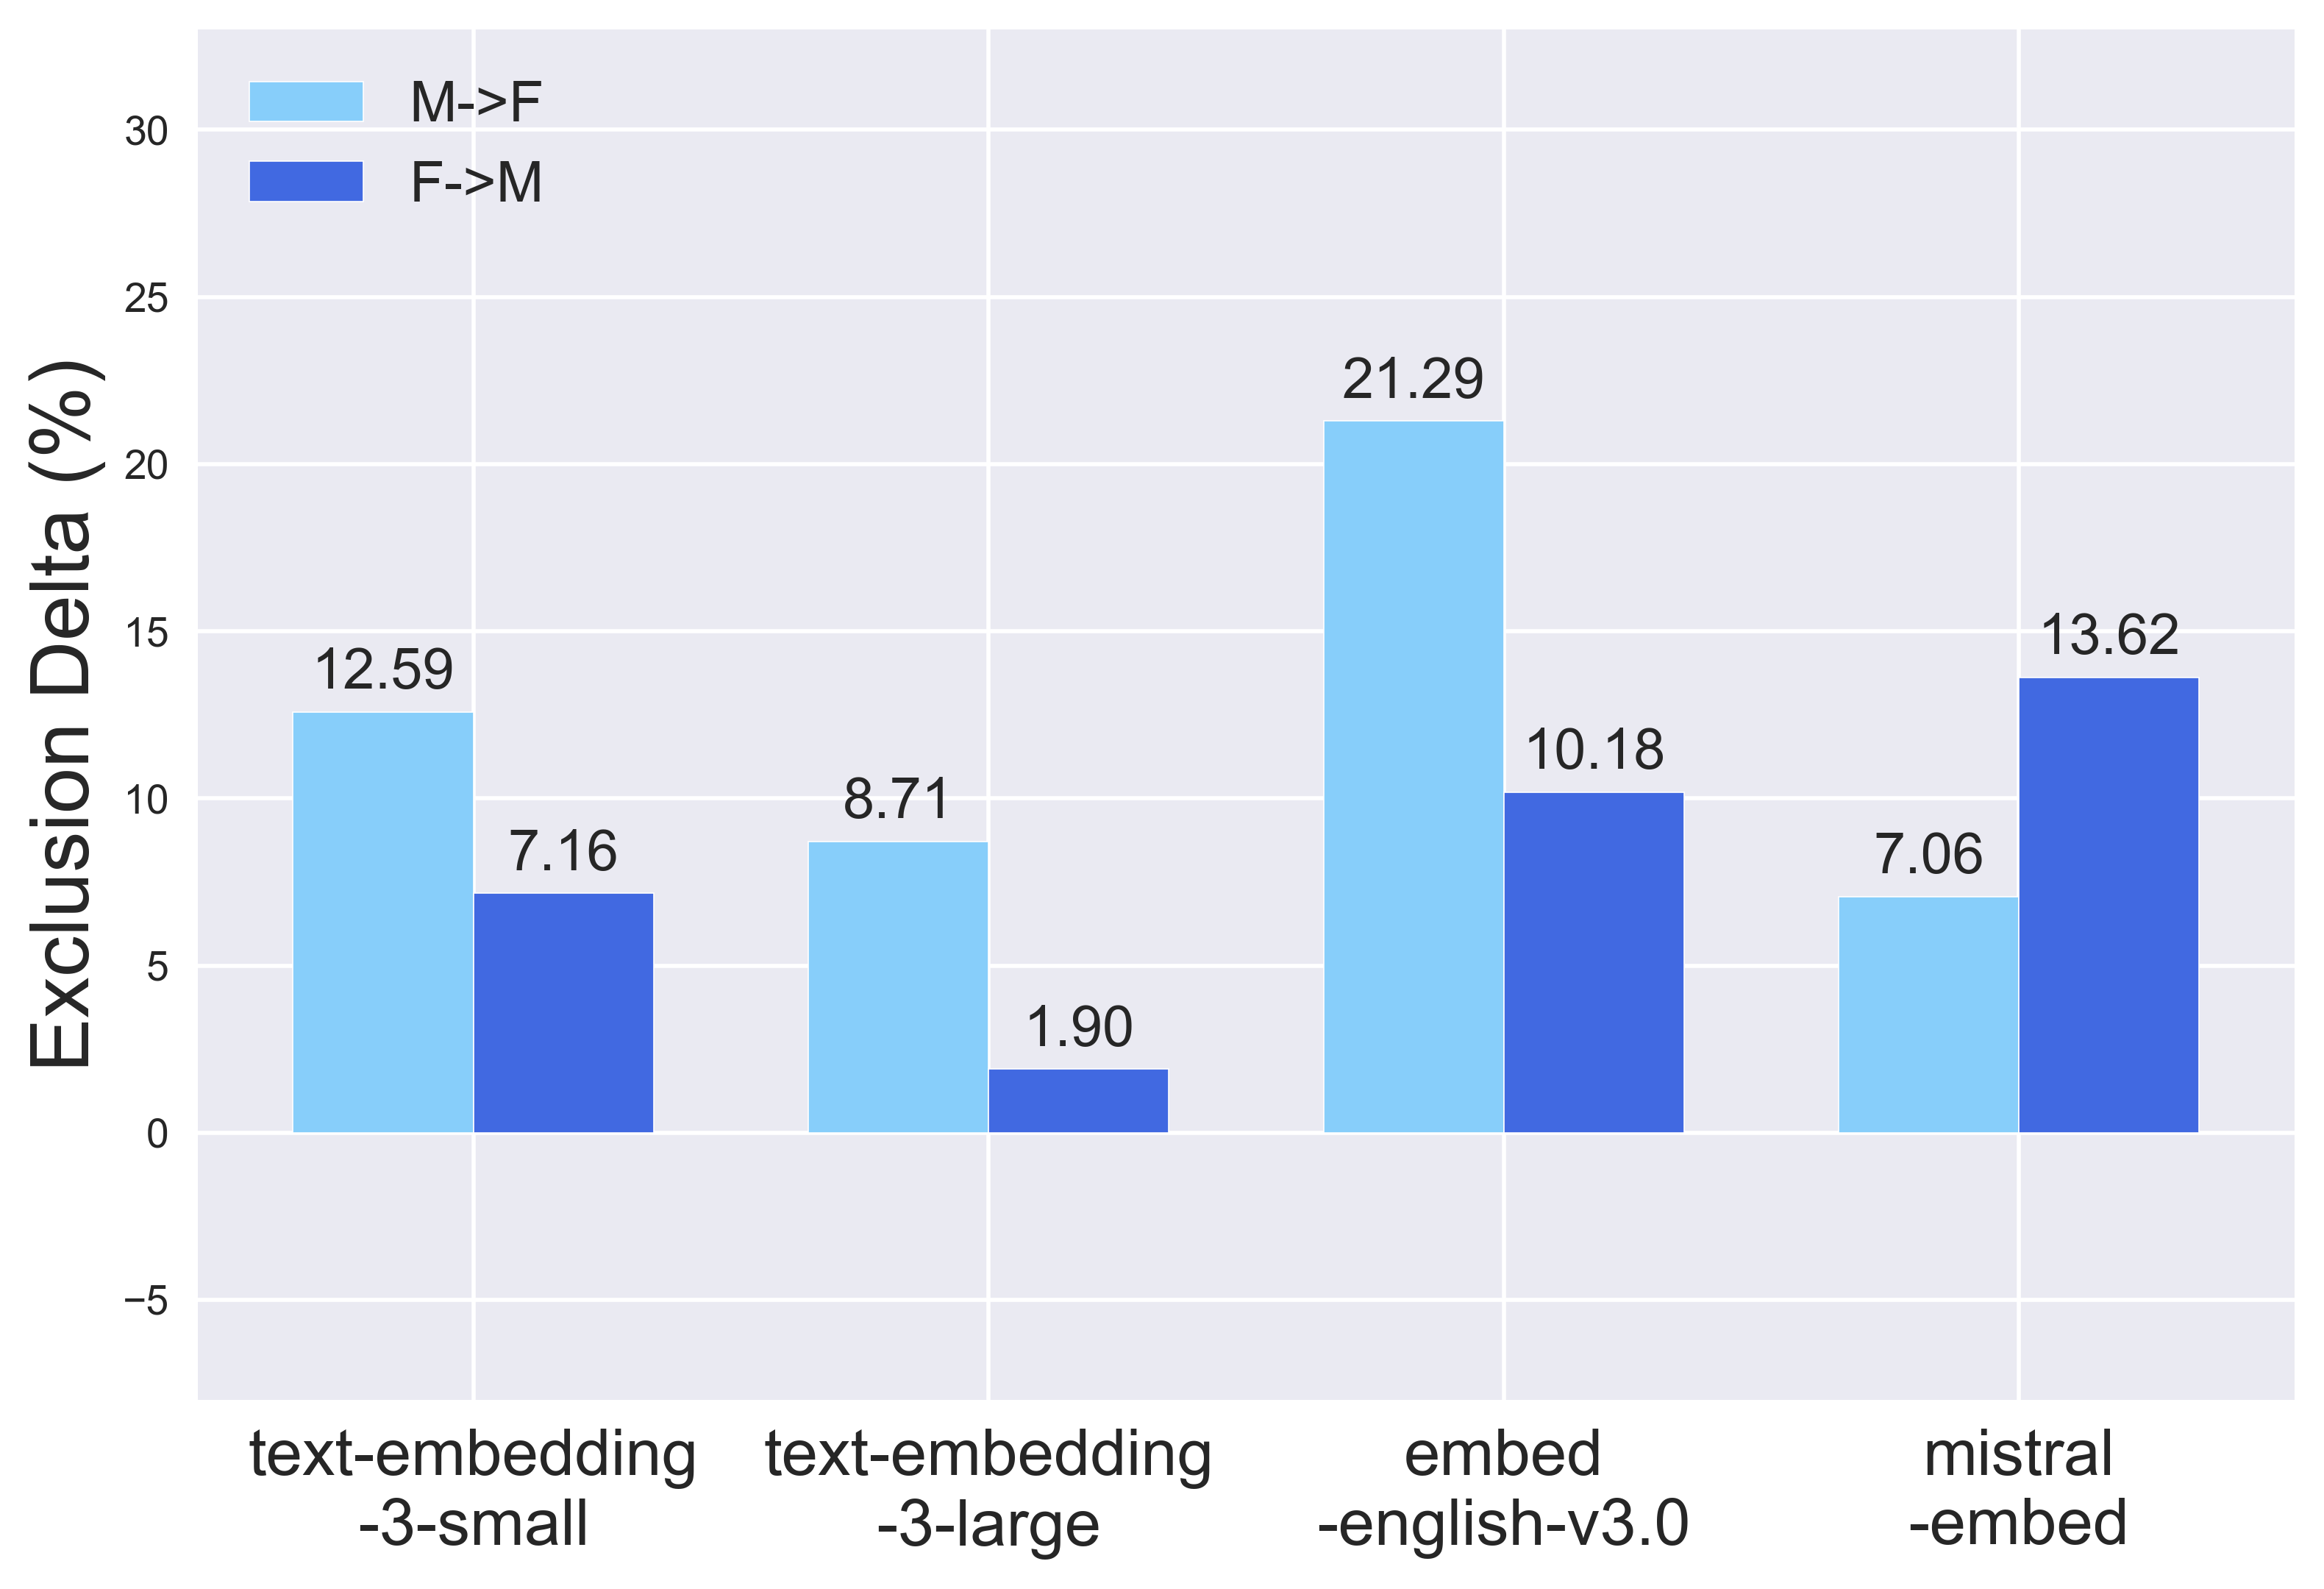
Are models more sensitive when perturbing both names and extracurricular information, as opposed to names only?
Figure 5 shows that, as expected, models tend to be more sensitive when perturbing extracurricular information (e.g., awards, clubs, volunteering, etc.) in addition to names. On average, across models and values, we observe the following increases in exclusion: 9.35% for M F, 8.06% for F M, 16.41% for W B, and 2.90% for B W.
For gender, adding extracurricular information results in comparable increases in exclusion for both directions. In contrast, adding extracurricular information for race results in highly asymmetric increases in exclusion. W B averages more than 5x the increase of B W changes. We observe that adding extracurricular information results in non-uniform increases to exclusion, which suggests that models may encode and utilize various types of demographic signal differently. This finding is notable given that prior work often examines a single way of encoding demographics, overlooking how various signals interact and compound.
More broadly, do models exhibit brittleness to non-demographic perturbations?
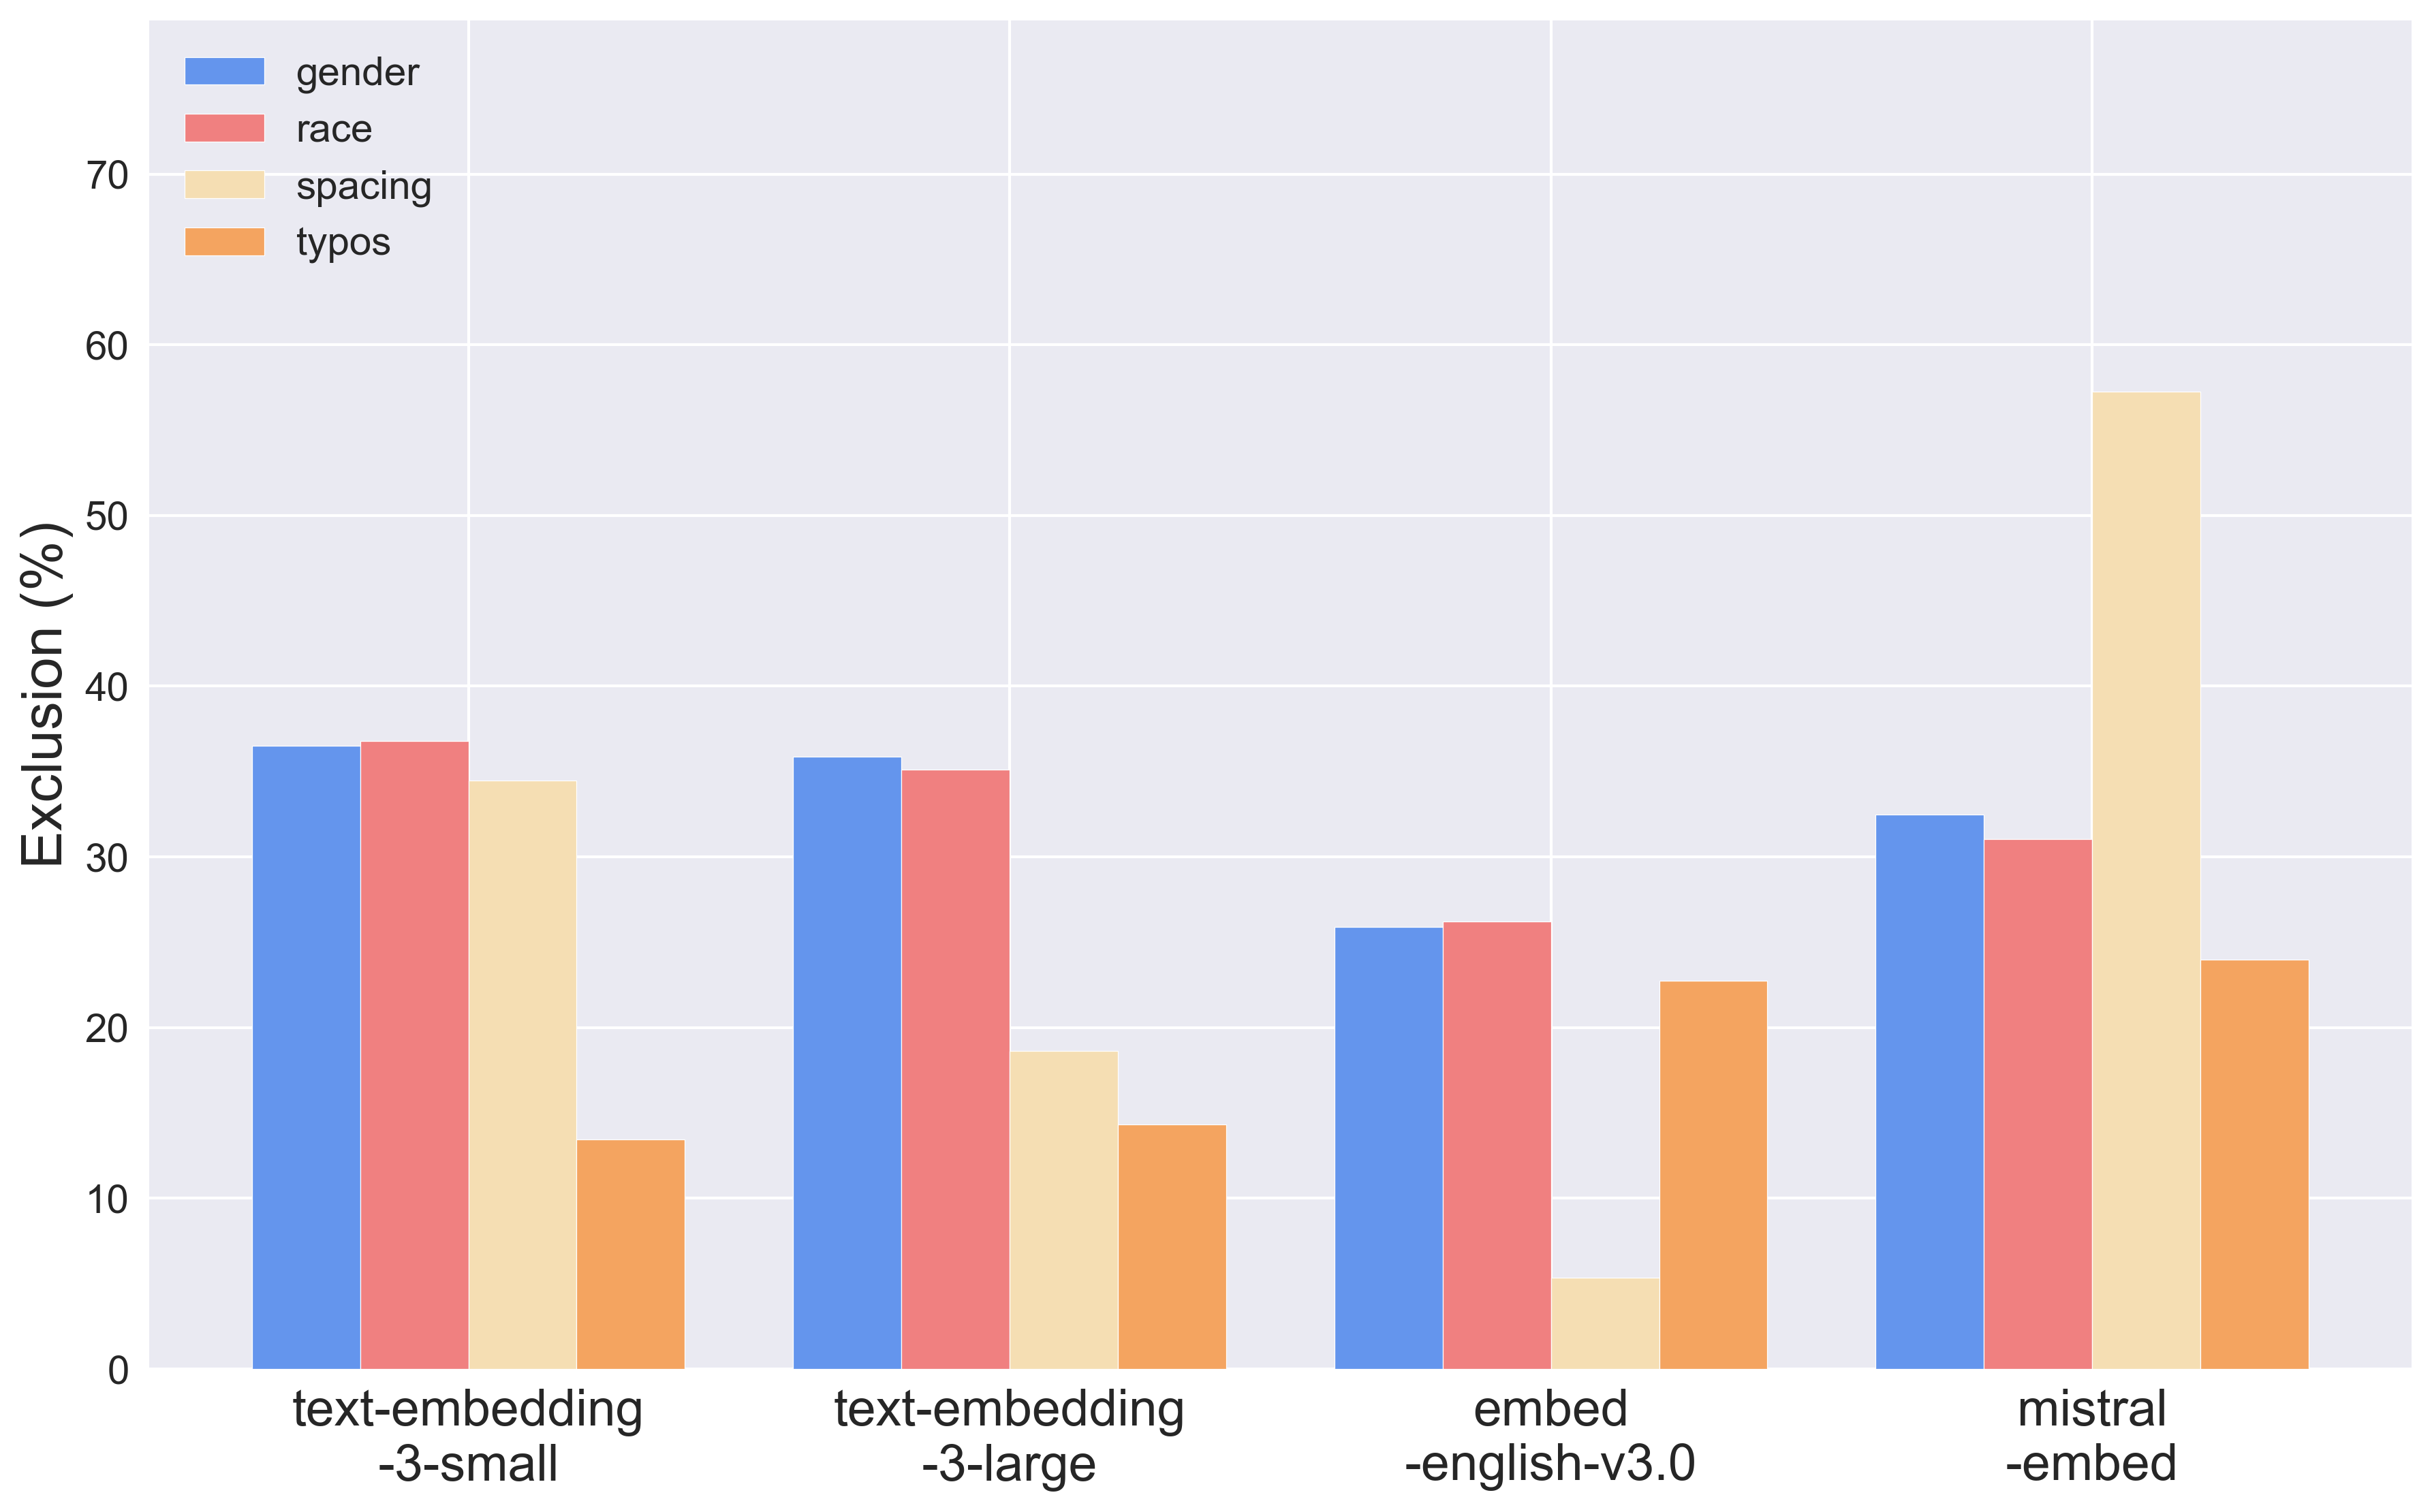
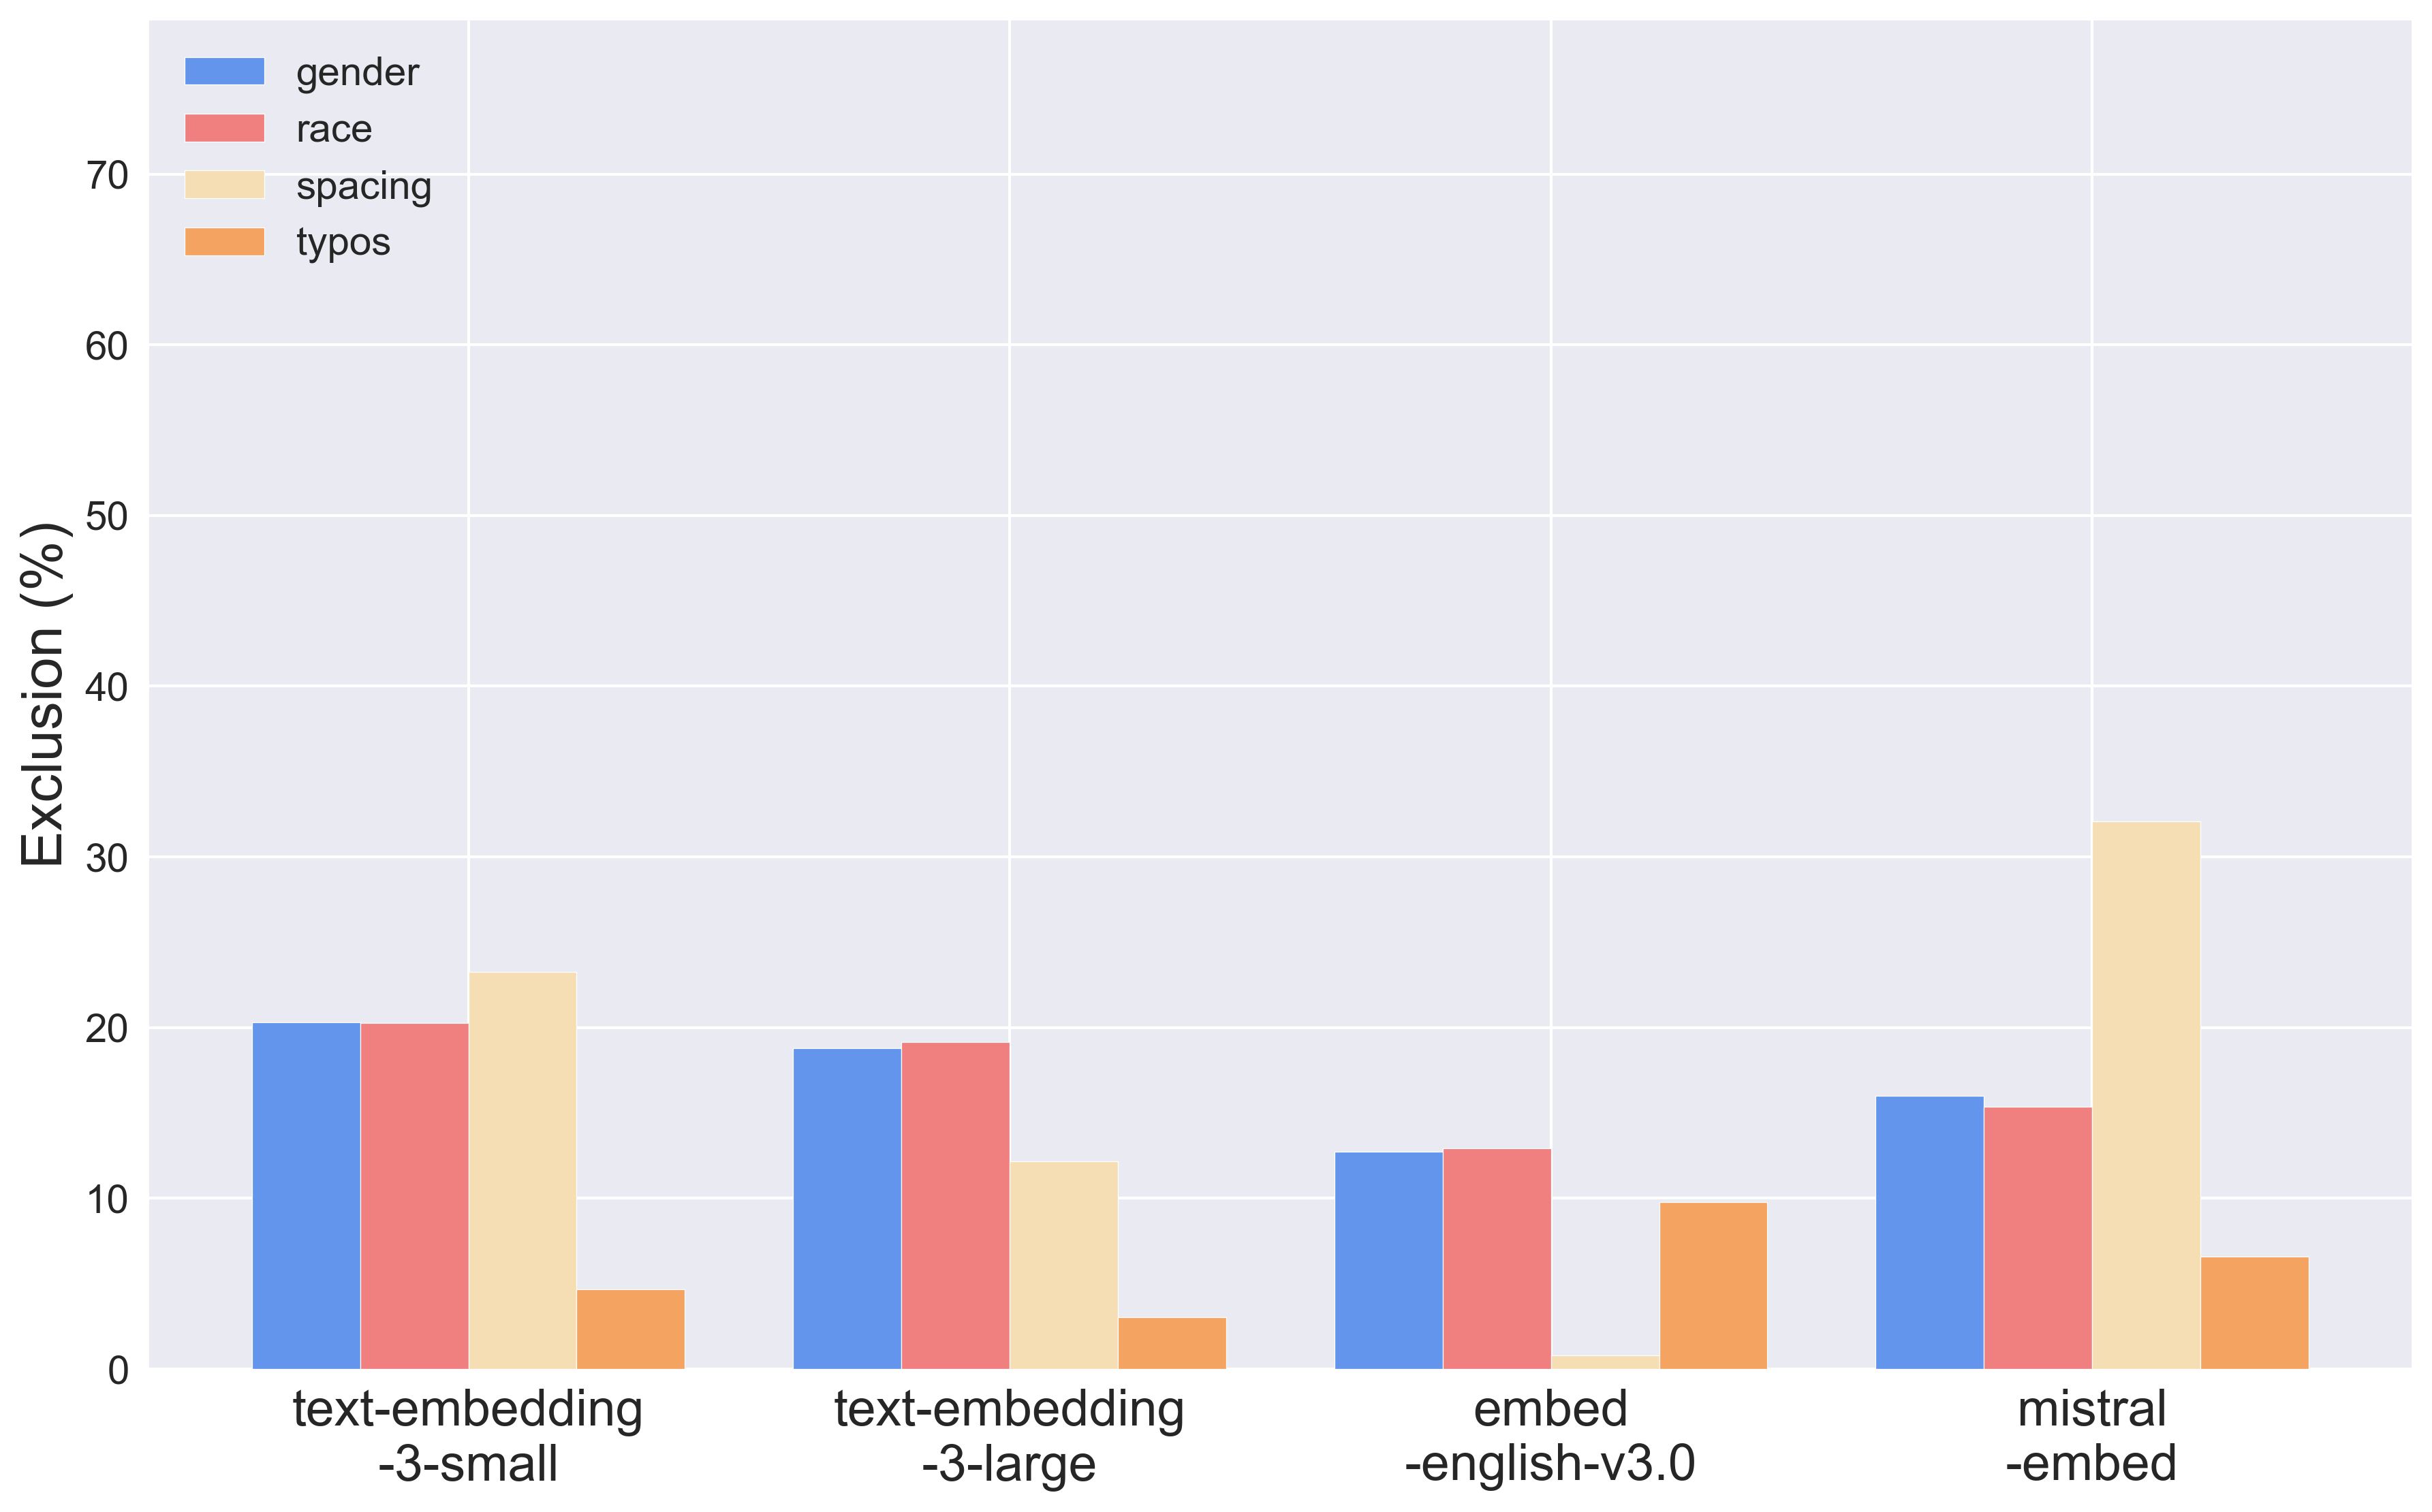
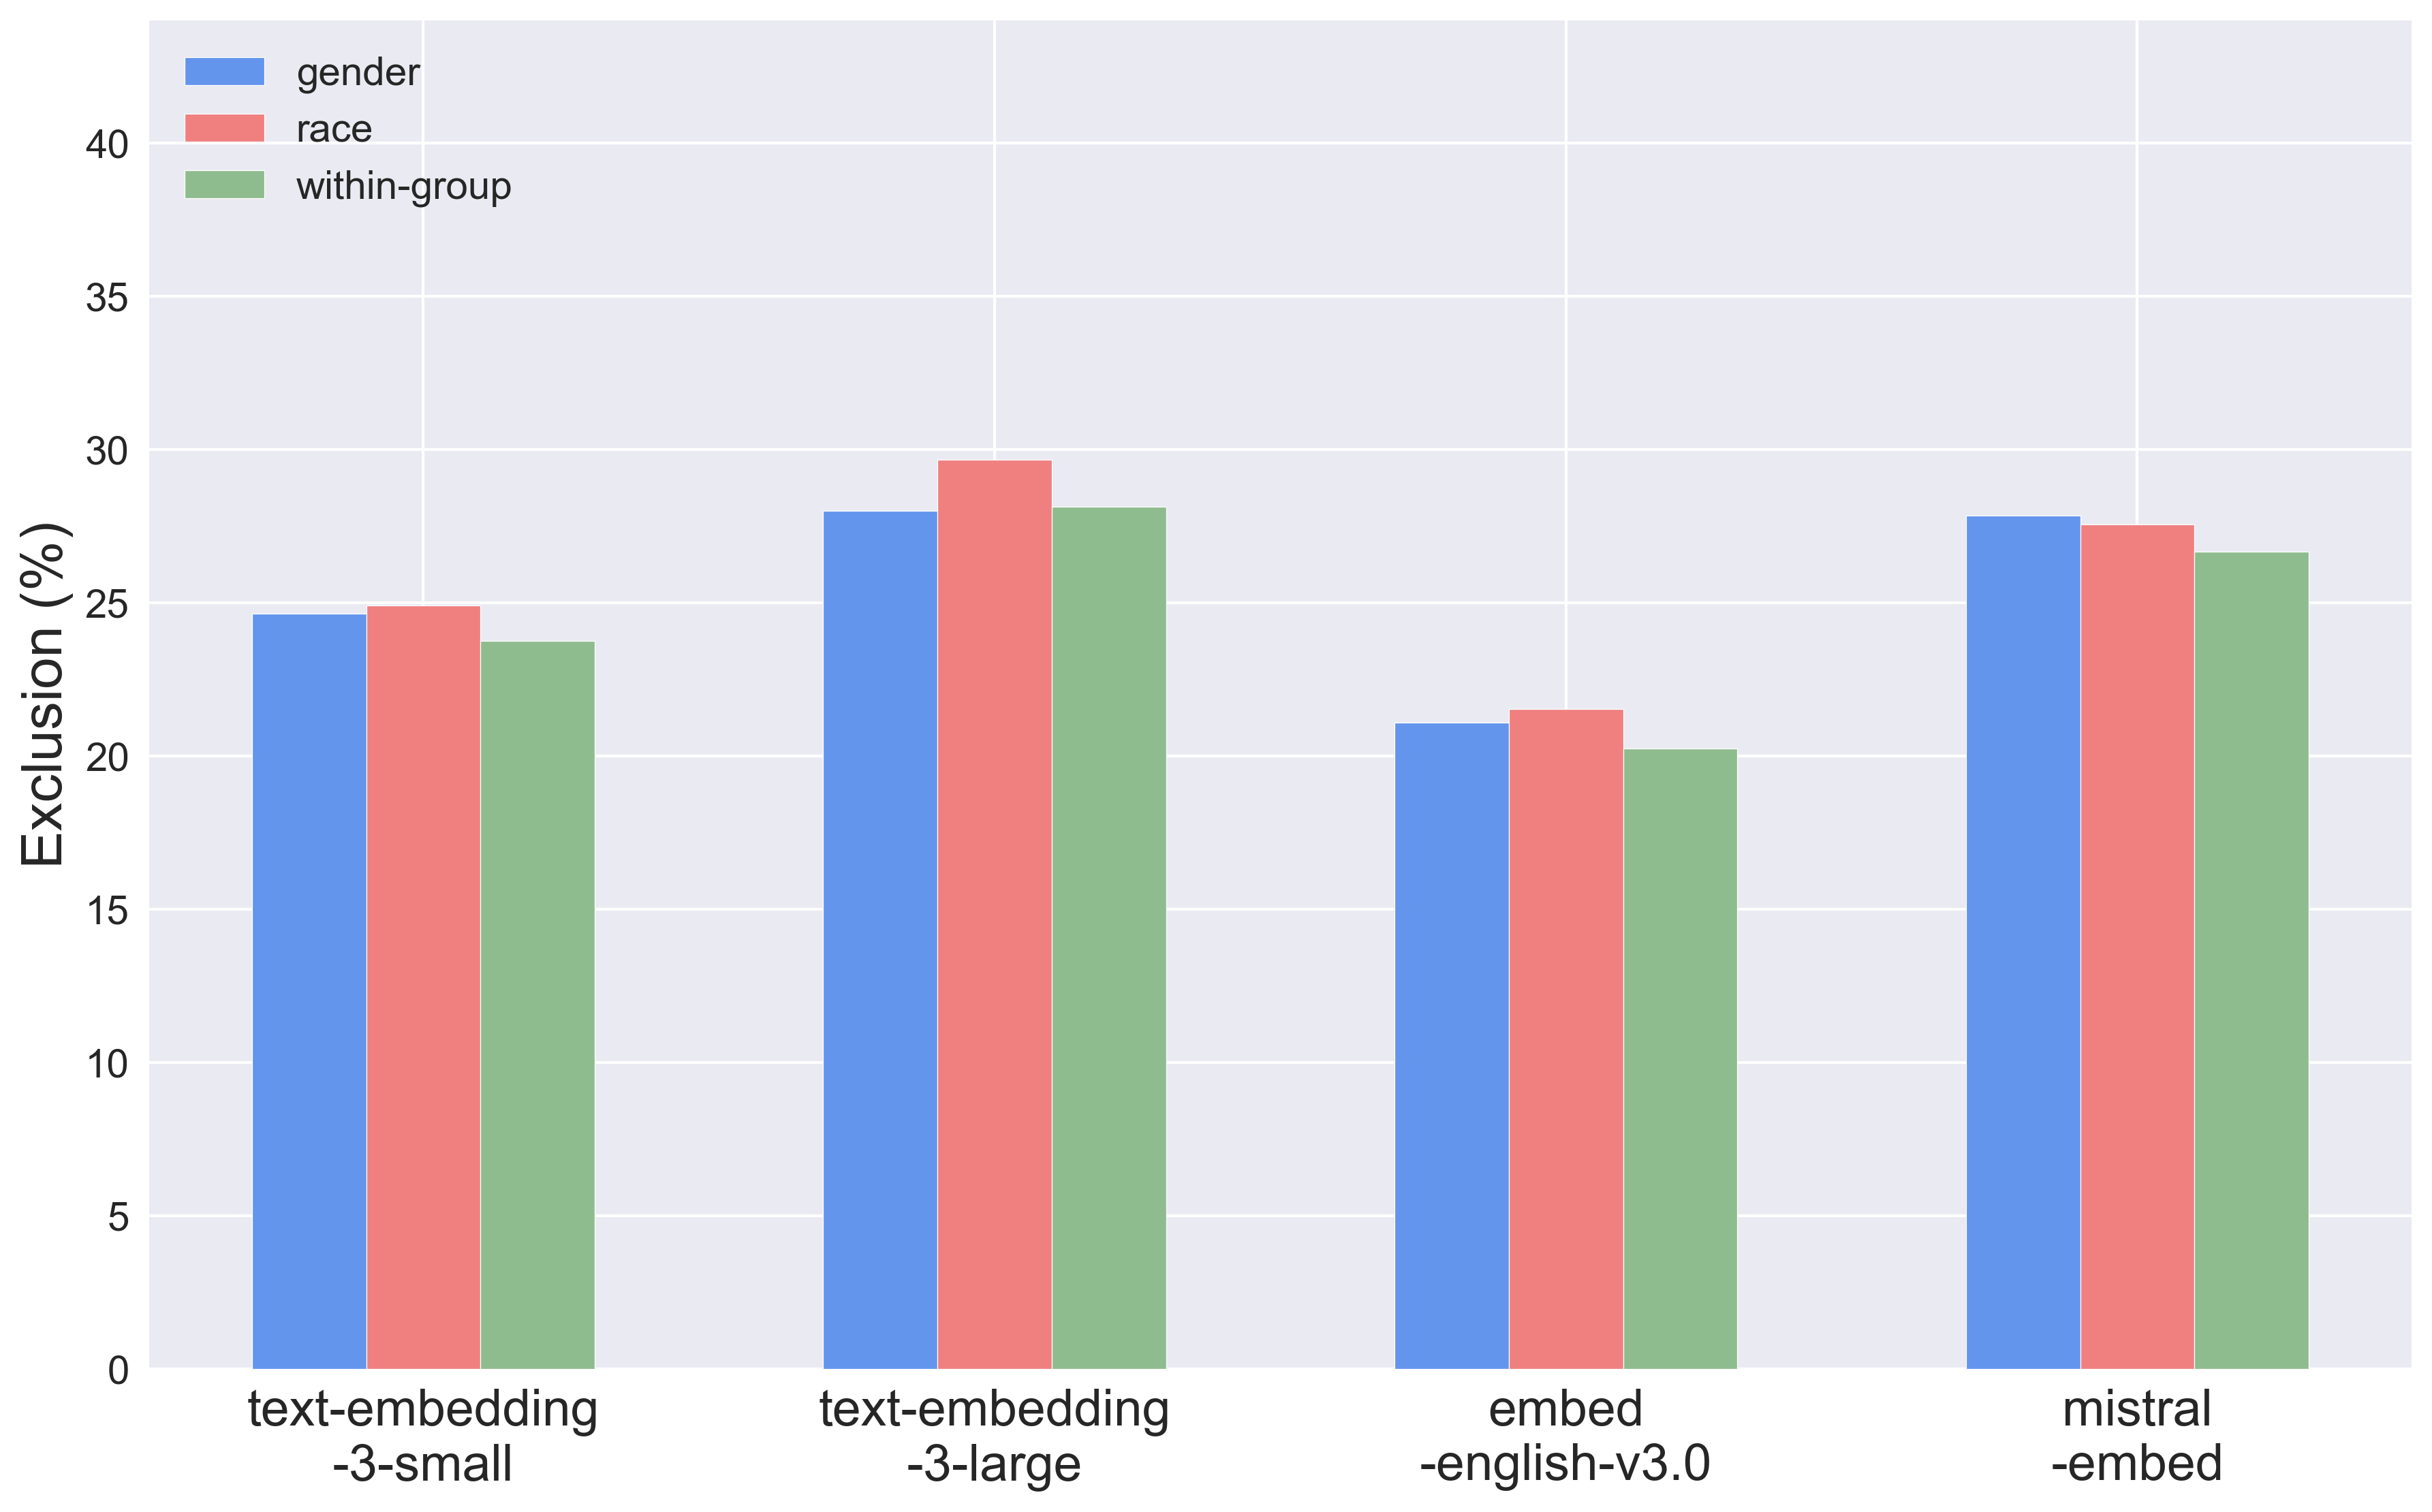
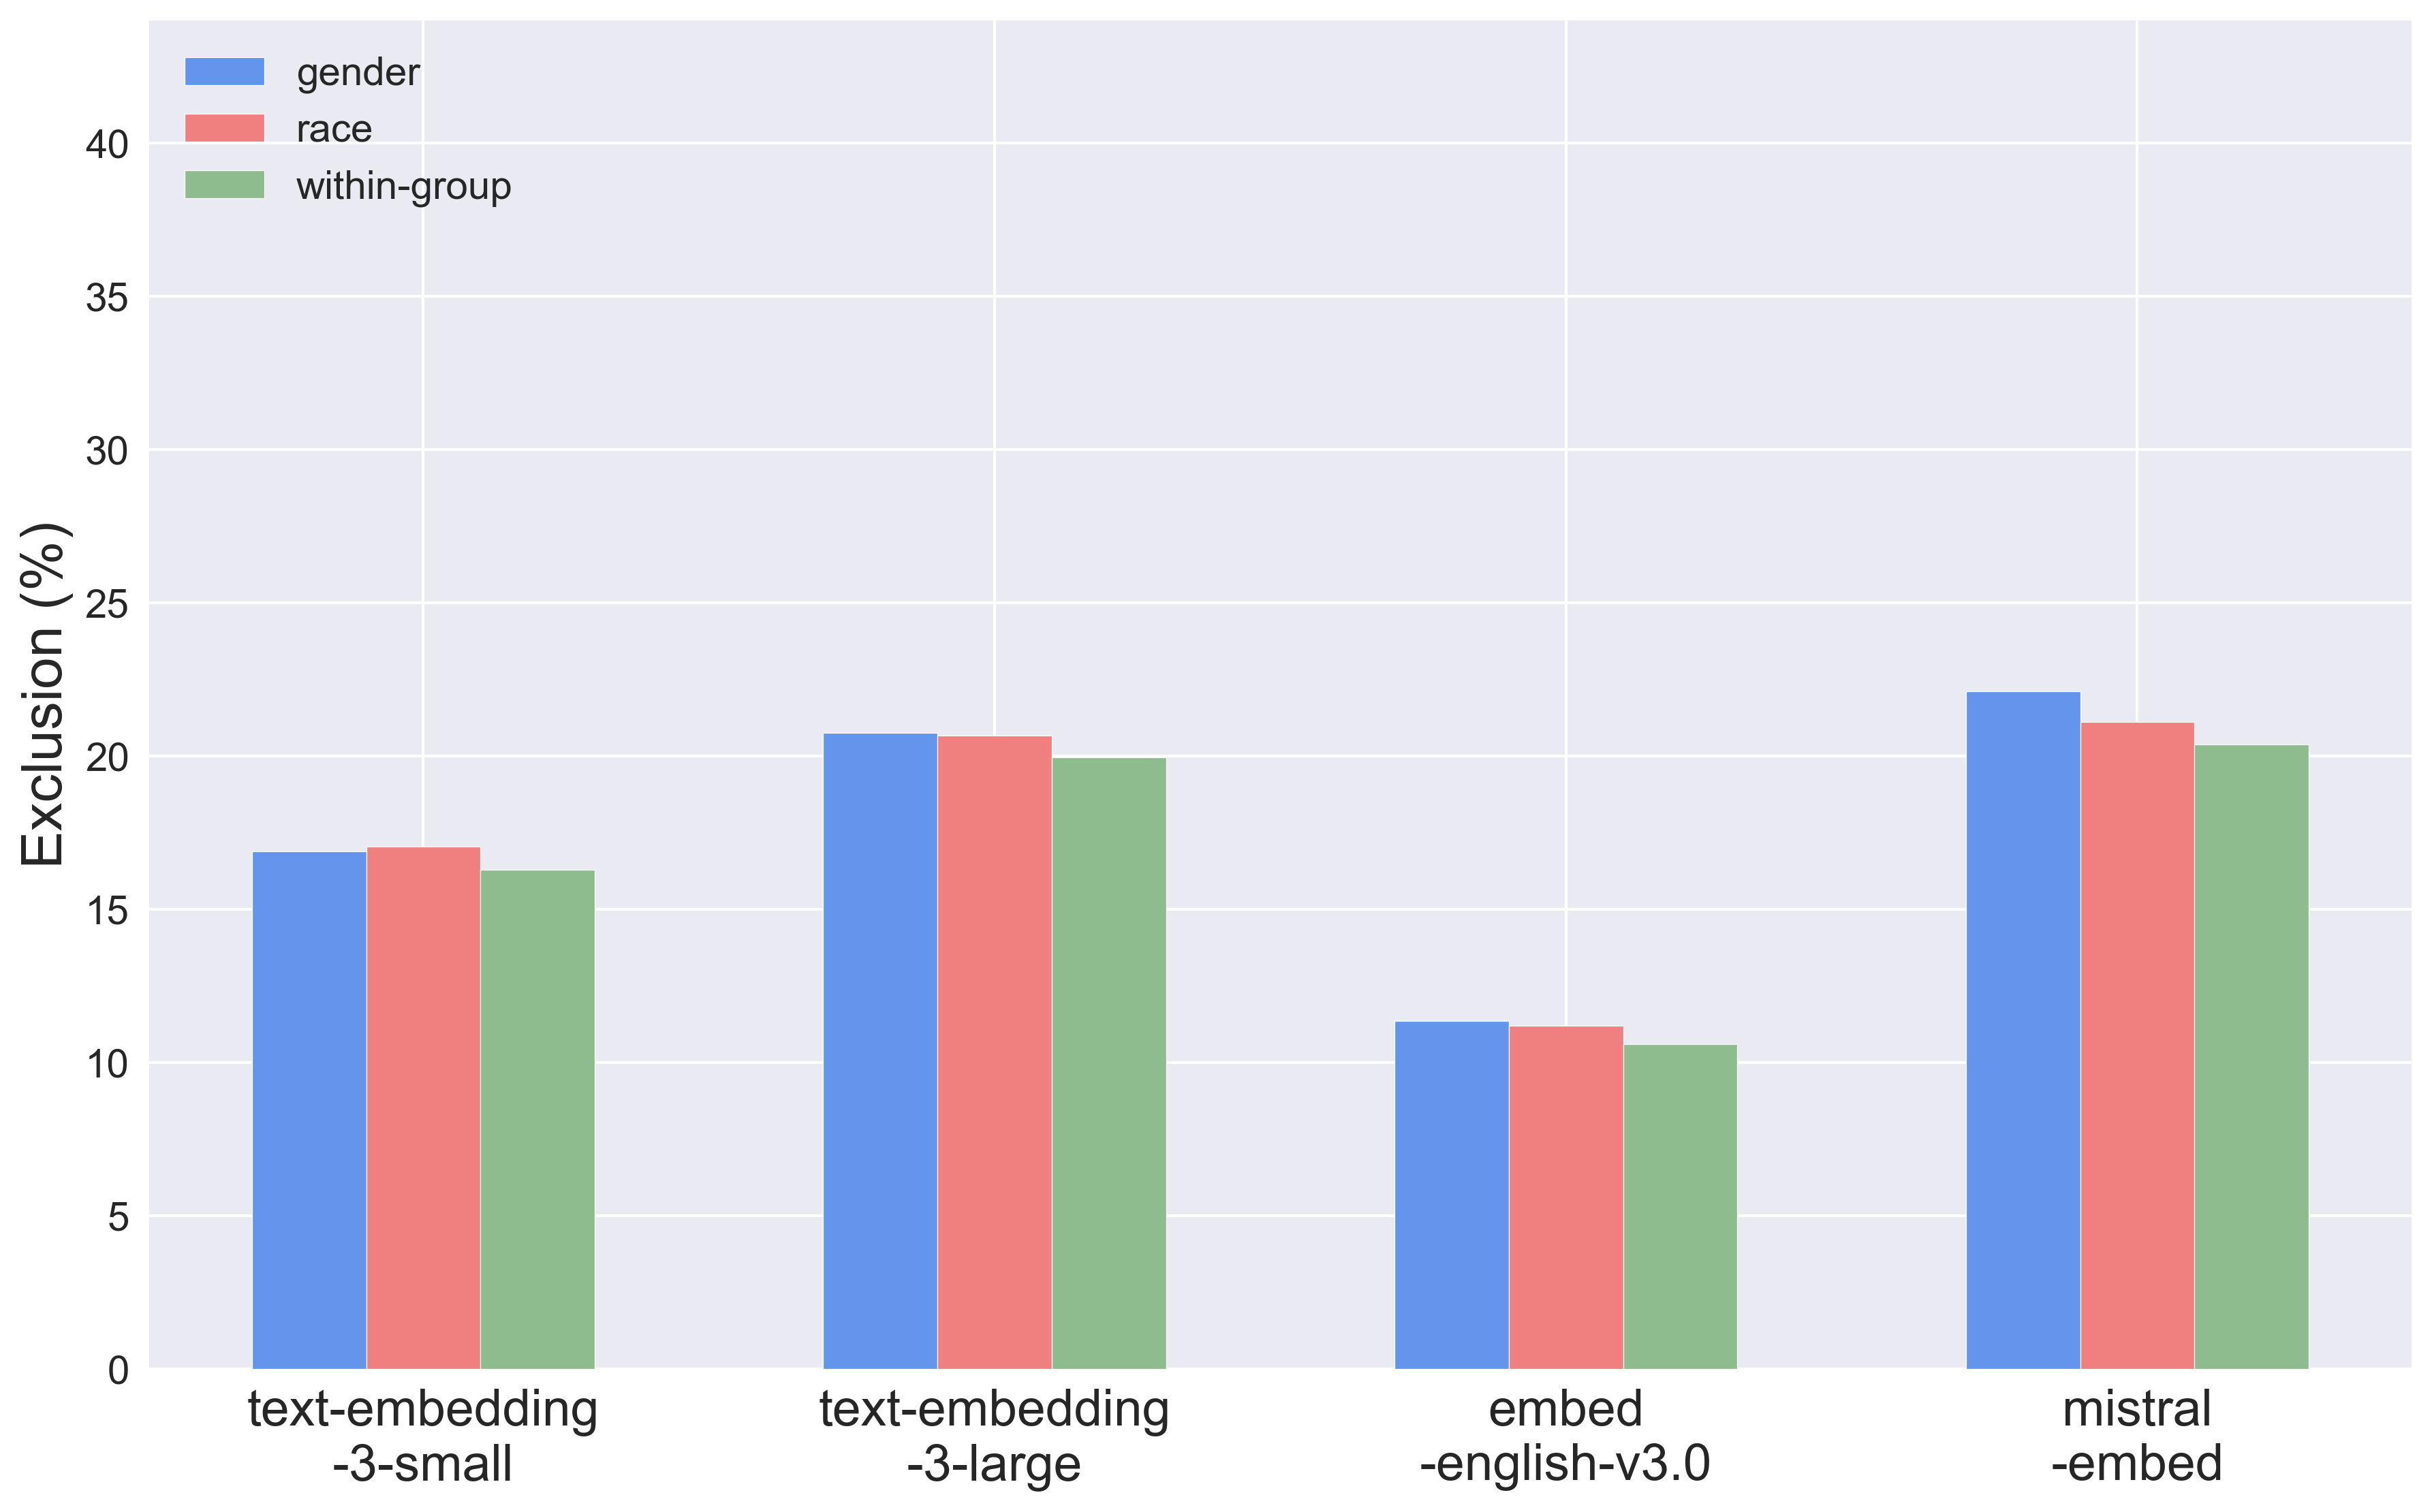
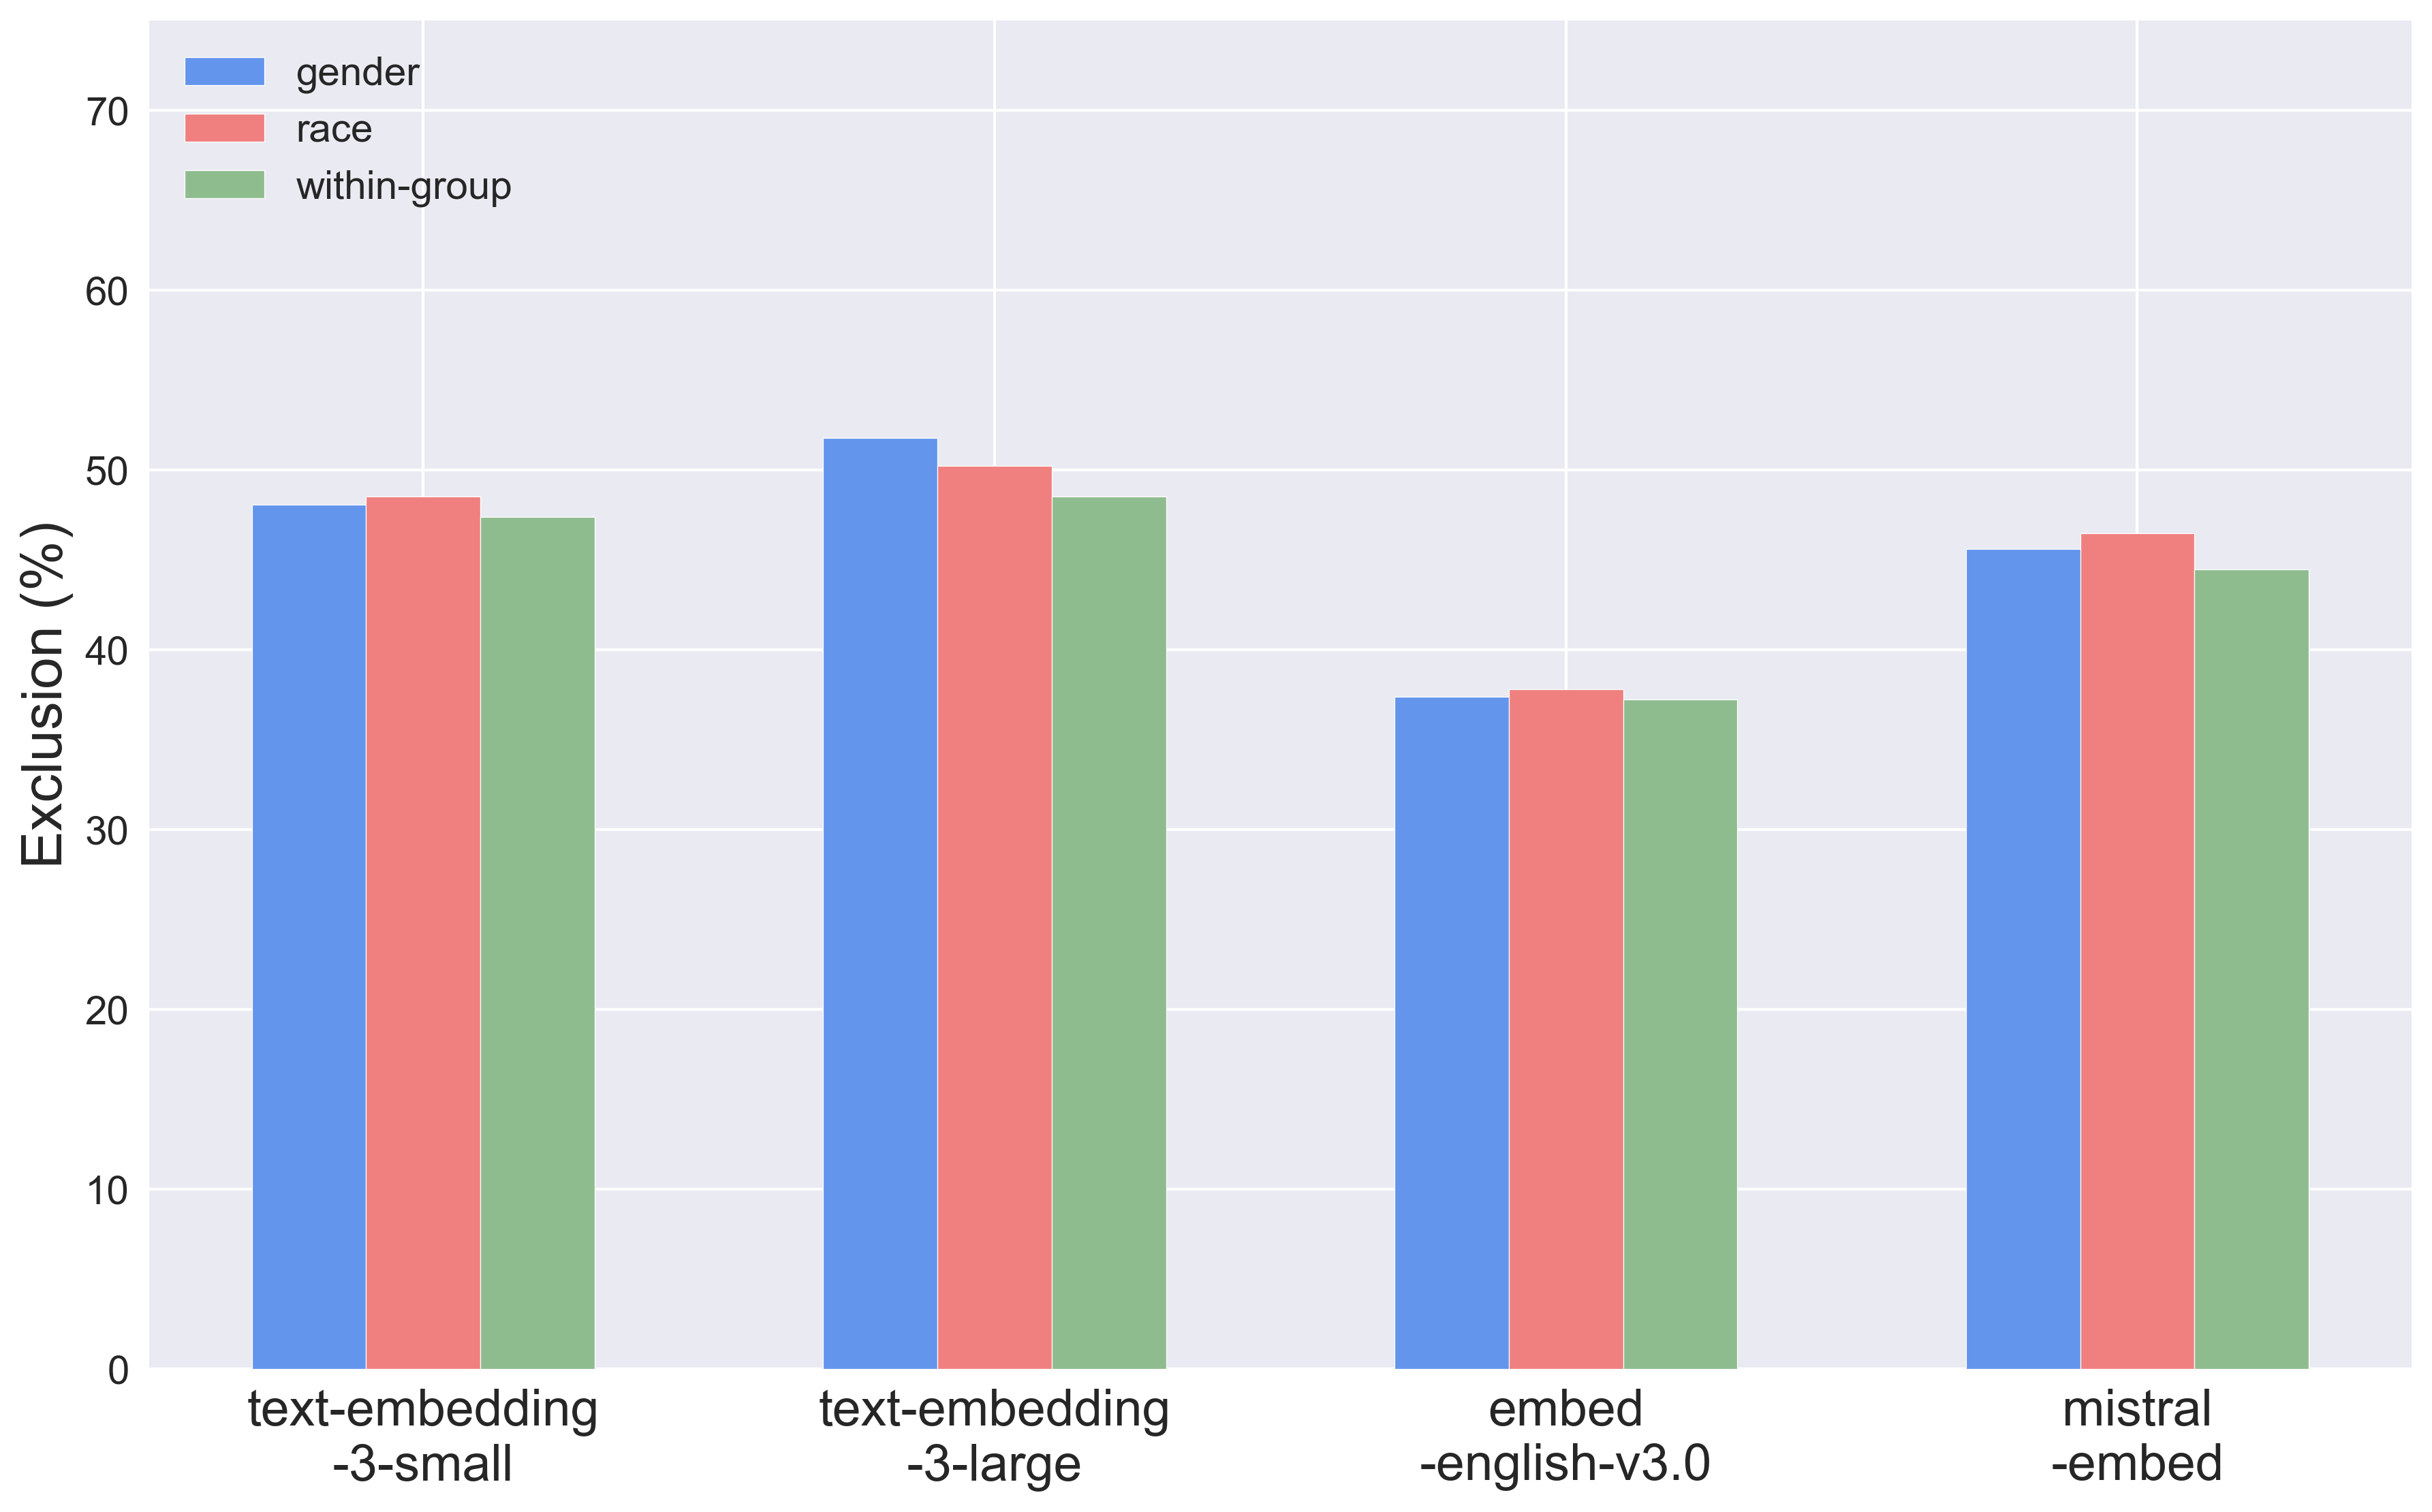
We consider two sets of perturbation analyses that are non-demographic: (1) How sensitive are models to within-group name perturbations? and (2) How sensitive are models to non-name perturbations? Even when perturbing names within the same demographic group, models surprisingly exhibit similar levels of sensitivity to those observed with demographic name perturbations (Figure 6(a)).
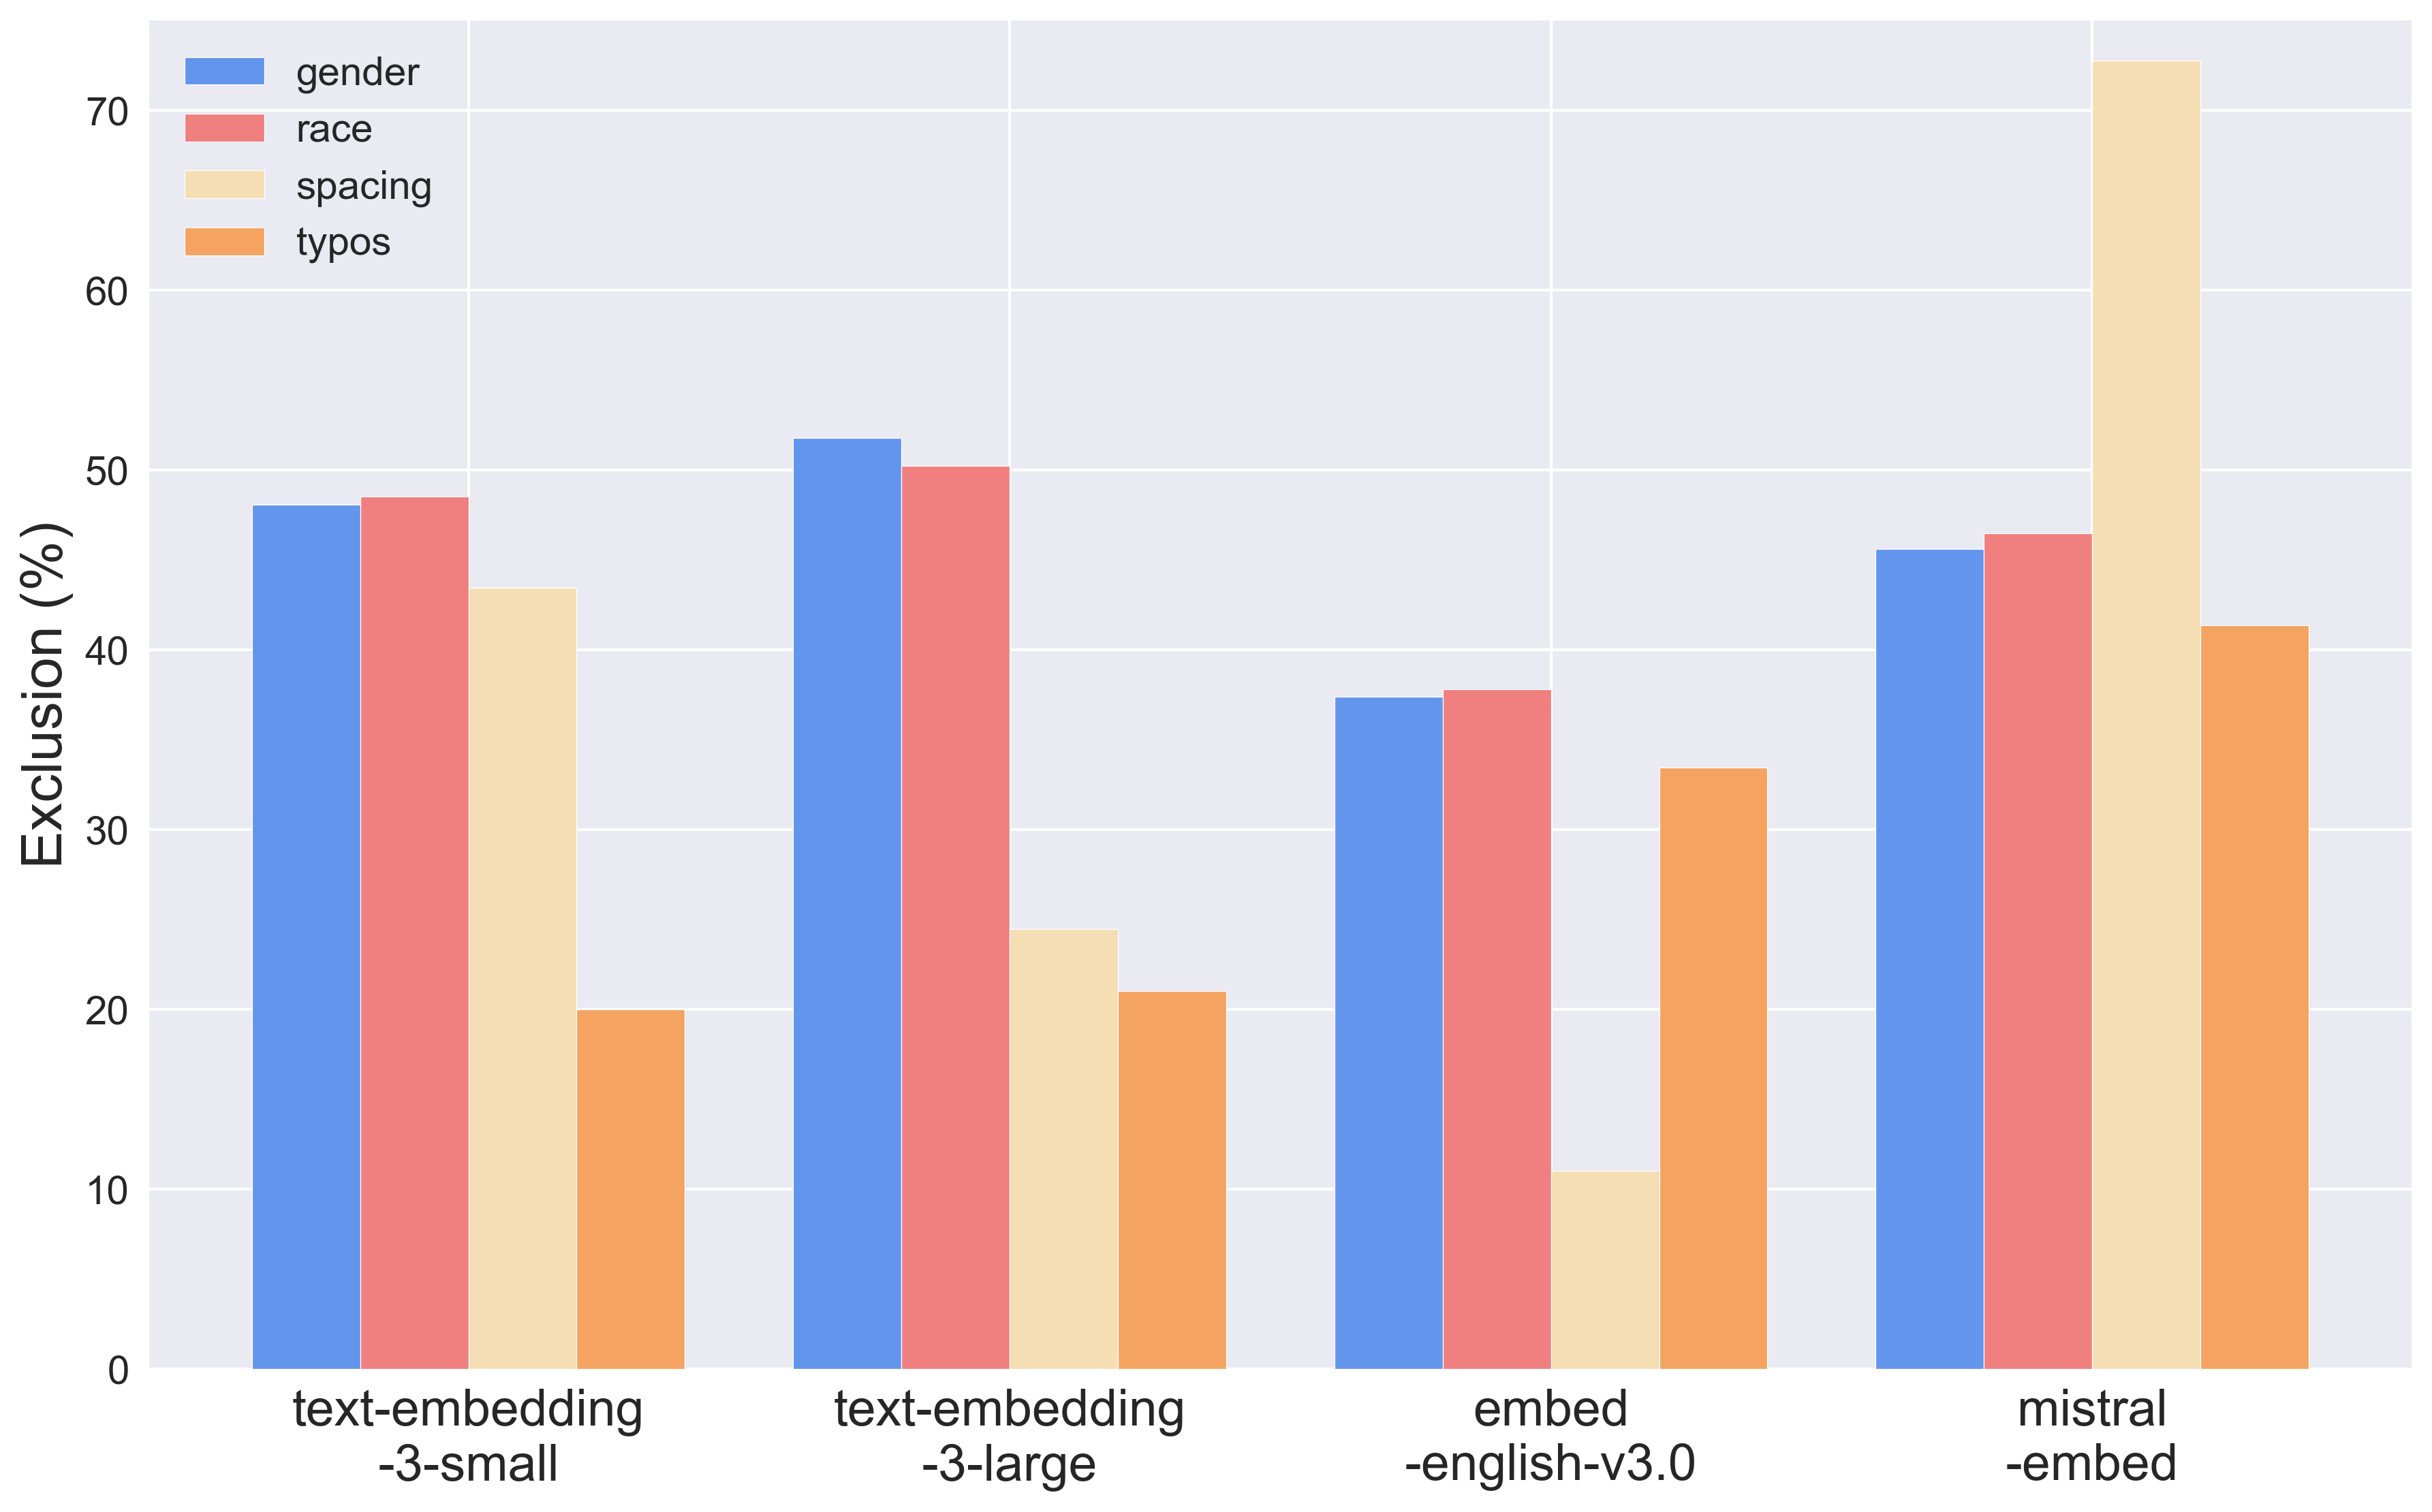
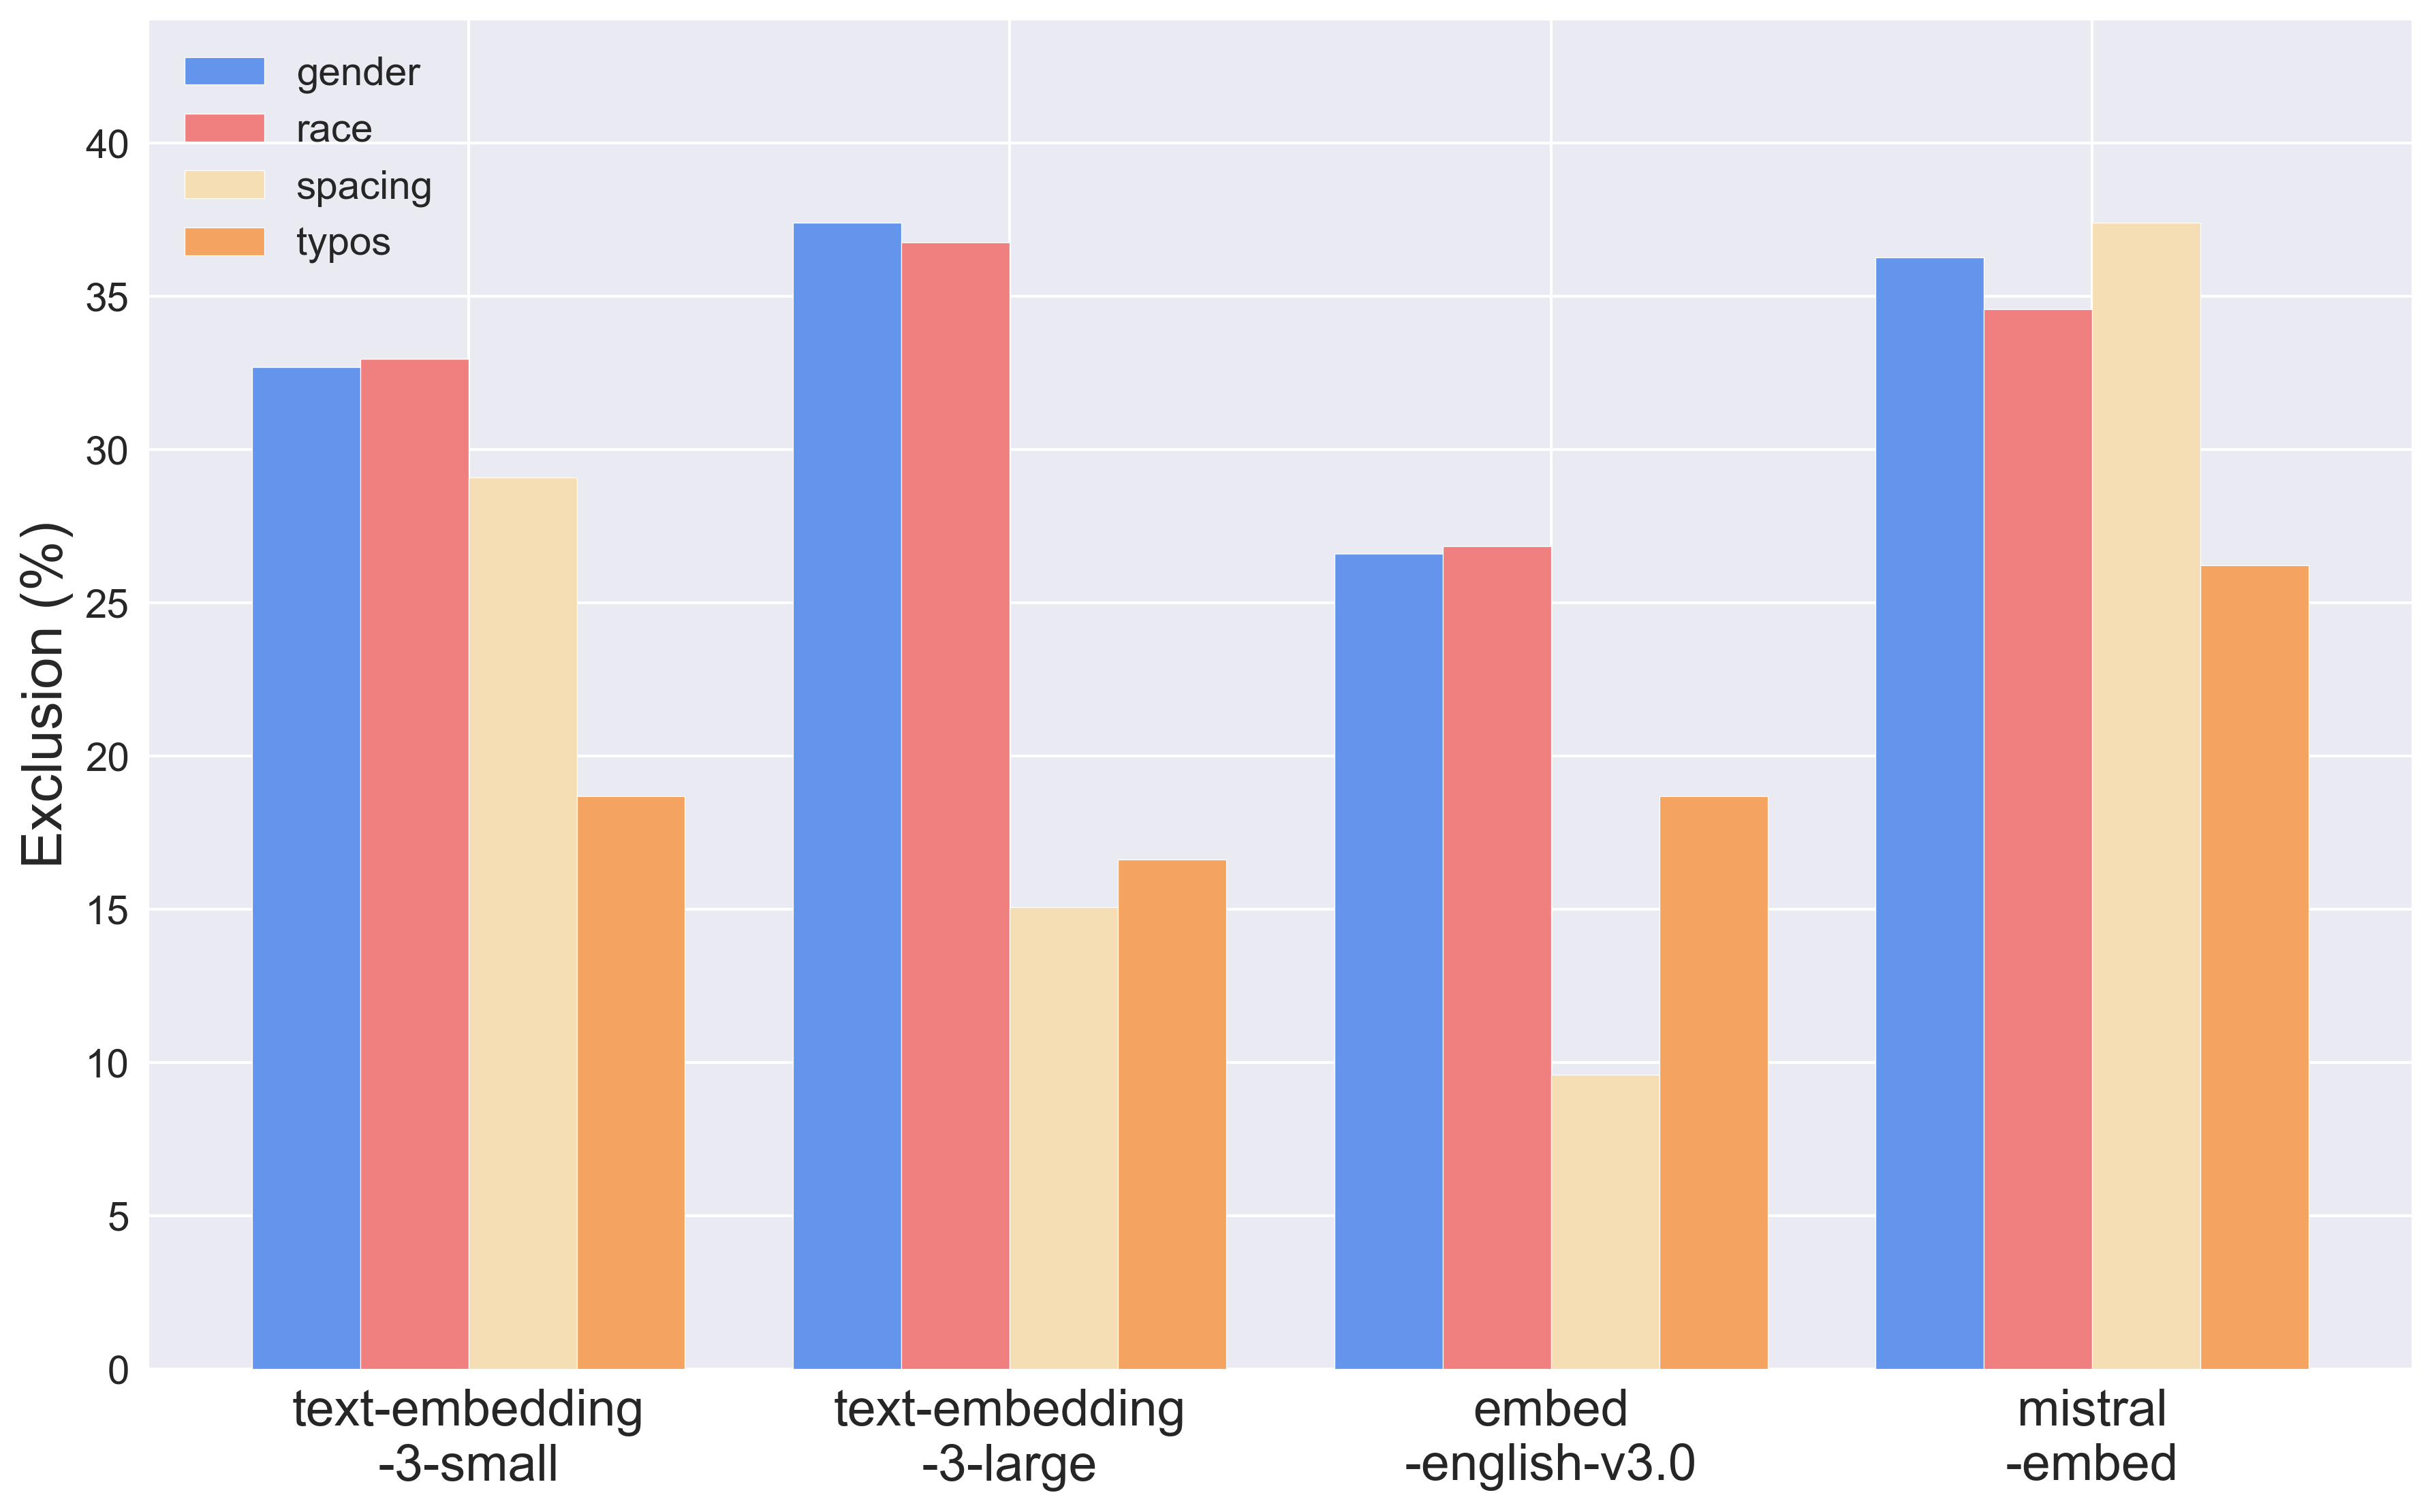
For non-name perturbations, we find that models are extremely sensitive to both spacing and typos, although to a lesser extent than name perturbations. As shown in Figure 6(b), most models demonstrate higher sensitivity to spacing than typos, though there is surprising sensitivity to both. In particular, mistral-embed excludes resumes from the top-5 set 72.76% of the time solely based on spacing, which indicates that simple formatting choices can have a massive impact on fairness (in this case, much more than names). Generated resumes display nearly twice the sensitivity to spacing changes compared to web-scraped Kaggle resumes (27.98% vs. 15.35% averaged across models and values), likely due to their more structured and formatted nature. In summary, we observe that retrieval models lack robustness more generally, which might contribute to fairness-related issues.
5 Discussion
Our results highlight important issues about model fairness and brittleness in real-world contexts. First, we observe that model rankings in a retrieval setting are impacted considerably by both subtle demographic and non-demographic changes. In practice, these differences would lead to unintended exclusion, with candidates being eliminated from consideration at an early stage. We also observe that subtle demographic differences in resumes can alter the way candidates are discussed in generated summaries. As a result, even candidates who make it past the initial resume screening stage may be portrayed differently based on demographic attributes. These differences can impact downstream decision-making, since recruiters might rely solely on summaries to shortlist candidates.
Additionally, it is important to consider compositional effects when combining components (i.e., ranking summarization), since biases can compound due to the sequential nature of these tasks. Therefore, the candidate pool may (1) leave out qualified candidates through retrieval bias, as well as (2) differentially represent candidates through summarization bias. Applying this to our results, at worst case, we find that modifying racial indicators on resumes from W B (using both names and extracurricular information) can result in roughly (1) 70% of candidates being filtered out at the resume screening stage, and (2) 15% of remaining candidates being depicted in less preferable ways.
Our analysis also reveals that all models are sensitive to non-demographic perturbations. These findings suggest that model unfairness may partially stem from more general robustness issues, rather than solely from encoded biases. While these insights do not change the real-world impacts of discriminatory outcomes, understanding that disparate treatment can arise from multiple factors—including but not limited to undesirable biases—provides a more complete and nuanced picture for addressing fairness issues. Moreover, given that retrieval models are commonly used in RAG systems, these issues may extend to various settings and applications beyond HR.
6 Conclusion
We examine fairness in LLM-based hiring systems by analyzing two key components: applicant ranking and summary generation. We propose two new metrics to measure fairness in retrieval and generative settings, and find that a hiring pipeline with these components produces biased outcomes, particularly during the initial retrieval phase. In addition, we see unexpected sensitivity to minor non-demographic changes, indicating a lack of overall robustness that may contribute to unfair outcomes. We hope that our work underscores the need for more real-world evaluations of LLM harms, especially in other high-stakes domains.
Limitations
Our analysis focuses exclusively on English resumes and job posts, which poses limitations. Future research should investigate fairness considerations in multilingual settings and examine whether our conclusions hold across various languages. Additionally, cultural norms likely influence how candidates present themselves and describe their professional experience, qualifications, and achievements. Understanding these nuances is crucial for evaluating and developing hiring systems that serve diverse global talent pools.
While our analysis examines whether hiring systems behave differently for various gender (male and female) and racial (White and Black) groups, it is meant to be illustrative rather than exhaustive and only covers a subset of gender and racial identities. We only consider binary gender biases, and exclude non-binary gender biases from our analysis (e.g., if a candidate explicitly declares pronouns on their resume). We also only focus on Black and White racial groups, since this is a common emphasis in fairness studies. In addition, future research should expand beyond these commonly investigated biases and analyze to what extent other types of demographic information (e.g., age and nationality) impact LLM fairness in hiring.
References
- Abid et al. (2021) Abubakar Abid, Maheen Farooqi, and James Zou. 2021. Large language models associate muslims with violence. Nature Machine Intelligence, 3:461 – 463.
- An et al. (2024) Haozhe An, Christabel Acquaye, Colin Wang, Zongxia Li, and Rachel Rudinger. 2024. Do large language models discriminate in hiring decisions on the basis of race, ethnicity, and gender? In Proceedings of the 62nd Annual Meeting of the Association for Computational Linguistics (Volume 2: Short Papers), pages 386–397, Bangkok, Thailand. Association for Computational Linguistics.
- Barocas et al. (2017) Solon Barocas, Kate Crawford, Aaron Shapiro, and Hanna Wallach. 2017. The problem with bias: Allocative versus representational harms in machine learning. In 9th Annual conference of the special interest group for computing, information and society, page 1. New York, NY.
- Bhawal (2021) Snehaan Bhawal. 2021. Resume dataset. https://www.kaggle.com/datasets/snehaanbhawal/resume-dataset.
- Bland and Altman (1995) J Martin Bland and Douglas G Altman. 1995. Multiple significance tests: the bonferroni method. Bmj, 310(6973):170.
- Blodgett et al. (2020) Su Lin Blodgett, Solon Barocas, Hal Daumé III, and Hanna Wallach. 2020. Language (technology) is power: A critical survey of “bias” in NLP. In Proceedings of the 58th Annual Meeting of the Association for Computational Linguistics, pages 5454–5476, Online. Association for Computational Linguistics.
- Cao et al. (2022) Yang Trista Cao, Yada Pruksachatkun, Kai-Wei Chang, Rahul Gupta, Varun Kumar, Jwala Dhamala, and Aram Galstyan. 2022. On the intrinsic and extrinsic fairness evaluation metrics for contextualized language representations. In Proceedings of the 60th Annual Meeting of the Association for Computational Linguistics (Volume 2: Short Papers), pages 561–570, Dublin, Ireland. Association for Computational Linguistics.
- Cheng et al. (2023) Myra Cheng, Esin Durmus, and Dan Jurafsky. 2023. Marked personas: Using natural language prompts to measure stereotypes in language models. In Proceedings of the 61st Annual Meeting of the Association for Computational Linguistics (Volume 1: Long Papers), pages 1504–1532, Toronto, Canada. Association for Computational Linguistics.
- Cohere (2024) Cohere. 2024. Command-r. https://docs.cohere.com/v2/docs/command-r.
- Dastin (2018) Jeffrey Dastin. 2018. Insight - Amazon scraps secret AI recruiting tool that showed bias against women. Reuters.
- Ethayarajh et al. (2019) Kawin Ethayarajh, David Duvenaud, and Graeme Hirst. 2019. Understanding undesirable word embedding associations. In Proceedings of the 57th Annual Meeting of the Association for Computational Linguistics, pages 1696–1705, Florence, Italy. Association for Computational Linguistics.
- Gadiraju et al. (2023) Vinitha Gadiraju, Shaun Kane, Sunipa Dev, Alex Taylor, Ding Wang, Emily Denton, and Robin Brewer. 2023. "i wouldn’t say offensive but…": Disability-centered perspectives on large language models. In Proceedings of the 2023 ACM Conference on Fairness, Accountability, and Transparency, FAccT ’23, page 205–216, New York, NY, USA. Association for Computing Machinery.
- Gao et al. (2020) Leo Gao, Stella Biderman, Sid Black, Laurence Golding, Travis Hoppe, Charles Foster, Jason Phang, Horace He, Anish Thite, Noa Nabeshima, Shawn Presser, and Connor Leahy. 2020. The pile: An 800gb dataset of diverse text for language modeling. Preprint, arXiv:2101.00027.
- Glazko et al. (2024) Kate Glazko, Yusuf Mohammed, Ben Kosa, Venkatesh Potluri, and Jennifer Mankoff. 2024. Identifying and improving disability bias in gpt-based resume screening. In Proceedings of the 2024 ACM Conference on Fairness, Accountability, and Transparency, FAccT ’24, page 687–700, New York, NY, USA. Association for Computing Machinery.
- Goldfarb-Tarrant et al. (2021) Seraphina Goldfarb-Tarrant, Rebecca Marchant, Ricardo Muñoz Sánchez, Mugdha Pandya, and Adam Lopez. 2021. Intrinsic bias metrics do not correlate with application bias. In Proceedings of the 59th Annual Meeting of the Association for Computational Linguistics and the 11th International Joint Conference on Natural Language Processing (Volume 1: Long Papers), pages 1926–1940, Online. Association for Computational Linguistics.
- Haim et al. (2024) Amit Haim, Alejandro Salinas, and Julian Nyarko. 2024. What’s in a name? auditing large language models for race and gender bias. Preprint, arXiv:2402.14875.
- Herman (2024) Hannah Herman. 2024. 6 ways to automate Recruit CRM with Zapier. Zapier Blog.
- Humanly (2024) Humanly. 2024. Using AI to streamline the recruiting process. Humanly.io Blog.
- Jiang et al. (2024) Albert Q. Jiang, Alexandre Sablayrolles, Antoine Roux, Arthur Mensch, Blanche Savary, Chris Bamford, Devendra Singh Chaplot, Diego de las Casas, Emma Bou Hanna, Florian Bressand, Gianna Lengyel, Guillaume Bour, Guillaume Lample, Lélio Renard Lavaud, Lucile Saulnier, Marie-Anne Lachaux, Pierre Stock, Sandeep Subramanian, Sophia Yang, Szymon Antoniak, Teven Le Scao, Théophile Gervet, Thibaut Lavril, Thomas Wang, Timothée Lacroix, and William El Sayed. 2024. Mixtral of experts. Preprint, arXiv:2401.04088.
- Kelly (2023) Jack Kelly. 2023. How AI-powered tech can help recruiters and hiring managers find candidates quicker and more efficiently. Forbes.
- Kincaid (1975) JP Kincaid. 1975. Derivation of new readability formulas (automated readability index, fog count and flesch reading ease formula) for navy enlisted personnel. Chief of Naval Technical Training.
- Kirk et al. (2021) Hannah Rose Kirk, Yennie Jun, Filippo Volpin, Haider Iqbal, Elias Benussi, Frederic Dreyer, Aleksandar Shtedritski, and Yuki Asano. 2021. Bias out-of-the-box: An empirical analysis of intersectional occupational biases in popular generative language models. In Advances in Neural Information Processing Systems, volume 34, pages 2611–2624. Curran Associates, Inc.
- Lewis et al. (2020) Patrick Lewis, Ethan Perez, Aleksandra Piktus, Fabio Petroni, Vladimir Karpukhin, Naman Goyal, Heinrich Küttler, Mike Lewis, Wen-tau Yih, Tim Rocktäschel, Sebastian Riedel, and Douwe Kiela. 2020. Retrieval-augmented generation for knowledge-intensive nlp tasks. In Advances in Neural Information Processing Systems, volume 33, pages 9459–9474. Curran Associates, Inc.
- Nghiem et al. (2024) Huy Nghiem, John Prindle, Jieyu Zhao, and Hal Daumé Iii. 2024. “you gotta be a doctor, lin” : An investigation of name-based bias of large language models in employment recommendations. In Proceedings of the 2024 Conference on Empirical Methods in Natural Language Processing, pages 7268–7287, Miami, Florida, USA. Association for Computational Linguistics.
- OpenAI (2024) OpenAI. 2024. Gpt-4o. https://platform.openai.com/docs/models/gpt-4o.
- Raghavan et al. (2020) Manish Raghavan, Solon Barocas, Jon Kleinberg, and Karen Levy. 2020. Mitigating bias in algorithmic hiring: evaluating claims and practices. In Proceedings of the 2020 Conference on Fairness, Accountability, and Transparency, FAT* ’20, page 469–481, New York, NY, USA. Association for Computing Machinery.
- Ribeiro et al. (2020) Marco Tulio Ribeiro, Tongshuang Wu, Carlos Guestrin, and Sameer Singh. 2020. Beyond accuracy: Behavioral testing of NLP models with CheckList. In Proceedings of the 58th Annual Meeting of the Association for Computational Linguistics, pages 4902–4912, Online. Association for Computational Linguistics.
- Sánchez-Monedero et al. (2020) Javier Sánchez-Monedero, Lina Dencik, and Lilian Edwards. 2020. What does it mean to ’solve’ the problem of discrimination in hiring? social, technical and legal perspectives from the uk on automated hiring systems. In Proceedings of the 2020 Conference on Fairness, Accountability, and Transparency, FAT* ’20, page 458–468, New York, NY, USA. Association for Computing Machinery.
- Sheng et al. (2019) Emily Sheng, Kai-Wei Chang, Premkumar Natarajan, and Nanyun Peng. 2019. The woman worked as a babysitter: On biases in language generation. In Proceedings of the 2019 Conference on Empirical Methods in Natural Language Processing and the 9th International Joint Conference on Natural Language Processing (EMNLP-IJCNLP), pages 3407–3412, Hong Kong, China. Association for Computational Linguistics.
- Suresh and Guttag (2021) Harini Suresh and John Guttag. 2021. A framework for understanding sources of harm throughout the machine learning life cycle. In Proceedings of the 1st ACM Conference on Equity and Access in Algorithms, Mechanisms, and Optimization, EAAMO ’21, New York, NY, USA. Association for Computing Machinery.
- Tamkin et al. (2023) Alex Tamkin, Amanda Askell, Liane Lovitt, Esin Durmus, Nicholas Joseph, Shauna Kravec, Karina Nguyen, Jared Kaplan, and Deep Ganguli. 2023. Evaluating and mitigating discrimination in language model decisions. Preprint, arXiv:2312.03689.
- Wan et al. (2023) Yixin Wan, George Pu, Jiao Sun, Aparna Garimella, Kai-Wei Chang, and Nanyun Peng. 2023. “kelly is a warm person, joseph is a role model”: Gender biases in LLM-generated reference letters. In Findings of the Association for Computational Linguistics: EMNLP 2023, pages 3730–3748, Singapore. Association for Computational Linguistics.
- Wilson and Caliskan (2024) Kyra Wilson and Aylin Caliskan. 2024. Gender, race, and intersectional bias in resume screening via language model retrieval. Preprint, arXiv:2407.20371.
- Yin et al. (2024) Leon Yin, Davey Alba, and Leonardo Nicoletti. 2024. Openai’s gpt is a recruiter’s dream tool. tests show there’s racial bias. Bloomberg.
- Zhao et al. (2018) Jieyu Zhao, Tianlu Wang, Mark Yatskar, Vicente Ordonez, and Kai-Wei Chang. 2018. Gender bias in coreference resolution: Evaluation and debiasing methods. In Proceedings of the 2018 Conference of the North American Chapter of the Association for Computational Linguistics: Human Language Technologies, Volume 2 (Short Papers), pages 15–20, New Orleans, Louisiana. Association for Computational Linguistics.
Appendix A Appendix
A.1 Names
We use White male, Black male, White female, and Black female names curated by Yin et al. (2024), which we list below:
White male
Adam, Aidan, Aiden, Alec, Andrew, Austin, Bailey, Benjamin, Blake, Braden, Bradley, Brady, Brayden, Brendan, Brennan, Brent, Bret, Brett, Brooks, Carson, Carter, Chad, Chase, Clay, Clint, Cody, Colby, Cole, Colin, Collin, Colton, Conner, Connor, Conor, Cooper, Dalton, Davis, Dawson, Dillon, Drew, Dustin, Dylan, Eli, Ethan, Gage, Garrett, Graham, Grant, Grayson, Griffin, Harley, Hayden, Heath, Holden, Hunter, Jack, Jackson, Jacob, Jake, Jakob, Jeffrey, Jody, Jon, Jonathon, Kurt, Kyle, Landon, Lane, Liam, Logan, Lucas, Luke, Mason, Matthew, Max, Owen, Parker, Peyton, Philip, Randall, Reid, Riley, Ross, Scott, Seth, Shane, Skyler, Stuart, Tanner, Taylor, Todd, Tucker, Walker, Weston, Wyatt, Zachary, Zachery, Zackary, Zackery, Zane
Black male
Akeem, Alphonso, Amari, Antione, Antoine, Antwain, Antwan, Antwon, Cedric, Cedrick, Cornell, Cortez, Daquan, Darius, Darnell, Darrius, Dashawn, Davion, Davon, Davonte, Deandre, Deangelo, Dedrick, Demarcus, Demario, Demetrius, Demond, Denzel, Deonte, Dequan, Deshaun, Deshawn, Devante, Devonte, Dominique, Donnell, Donta, Dontae, Donte, Hakeem, Ishmael, Jabari, Jaheim, Jaleel, Jamaal, Jamal, Jamar, Jamari, Jamel, Jaquan, Javon, Jaylen, Jermaine, Jevon, Juwan, Kareem, Keon, Keshawn, Kevon, Keyon, Kwame, Lamont, Malik, Marques, Marquez, Marquis, Marquise, Mekhi, Montrell, Octavius, Omari, Prince, Raekwon, Raheem, Raquan, Rashaad, Rashad, Rashaun, Rashawn, Rasheed, Rico, Roosevelt, Savion, Shamar, Shaquan, Shaquille, Stephon, Sylvester, Tevin, Travon, Tremaine, Tremayne, Trevon, Tyquan, Tyree, Tyrek, Tyrell, Tyrese, Tyrone, Tyshawn
White female
Abby, Abigail, Aimee, Alexandra, Alison, Allison, Allyson, Amanda, Amy, Ann, Anna, Anne, Ashlyn, Bailey, Beth, Bethany, Bonnie, Brooke, Caitlin, Caitlyn, Cara, Carly, Caroline, Casey, Cassidy, Cassie, Claire, Colleen, Elisabeth, Elizabeth, Ellen, Emily, Emma, Erin, Ginger, Hailey, Haley, Hannah, Hayley, Heather, Heidi, Holly, Jaclyn, Jaime, Jeanne, Jenna, Jennifer, Jill, Jodi, Julie, Kaitlin, Kaitlyn, Kara, Kari, Kasey, Katelyn, Katherine, Kathleen, Kathryn, Katie, Kaylee, Kelley, Kellie, Kelly, Kelsey, Kerry, Krista, Kristen, Kristi, Kristin, Kristine, Kylie, Laura, Lauren, Laurie, Leigh, Lindsay, Lindsey, Lori, Lynn, Mackenzie, Madeline, Madison, Mallory, Maureen, Meagan, Megan, Meghan, Meredith, Misty, Molly, Paige, Rachael, Rebecca, Rebekah, Sara, Sarah, Savannah, Susan, Suzanne
Black female
Alfreda, Amari, Aniya, Aniyah, Aretha, Ashanti, Ayana, Ayanna, Chiquita, Dasia, Deasia, Deja, Demetria, Demetrice, Denisha, Domonique, Eboni, Ebony, Essence, Iesha, Imani, Jaleesa, Jalisa, Janiya, Kenisha, Kenya, Kenyatta, Kenyetta, Keosha, Keyona, Khadijah, Lakeisha, Lakesha, Lakeshia, Lakisha, Laquisha, Laquita, Lashanda, Lashawn, Lashonda, Latanya, Latasha, Latesha, Latisha, Latonia, Latonya, Latoria, Latosha, Latoya, Latrice, Mahogany, Marquita, Nakia, Nikia, Niya, Nyasia, Octavia, Precious, Quiana, Rashida, Sade, Shakira, Shalonda, Shameka, Shamika, Shaneka, Shanequa, Shanice, Shanika, Shaniqua, Shanita, Shaniya, Shante, Shaquana, Sharita, Sharonda, Shavon, Shawanda, Sherika, Sherita, Tameka, Tamia, Tamika, Tanesha, Tanika, Tanisha, Tarsha, Tawanda, Tawanna, Tenisha, Thomasina, Tierra, Tomeka, Tomika, Towanda, Toya, Tyesha, Unique, Willie, Zaria
A.2 Professions
We list the professions/fields used in our analysis:
Generated (Resumes)
Account Executive, Accountant, Administrative Assistant, Back-End Developer, Data Analyst, Data Engineer, Data Scientist, Firmware Engineer, Front-End Developer, Graphic Designer, Hardware Engineer, Legal Counsel, Marketing Manager, Mobile Developer, PR Specialist, Product Manager, Quality Assurance Engineer, Recruiter, Research Scientist, Supply Chain Manager, Technical Writer, UX Designer
Generated (Job Posts)
Account Executive, Data Analyst, Data Scientist, Firmware Engineer, Graphic Designer, Marketing Manager, Product Manager, Research Scientist, Supply Chain Manager, Technical Writer, UX Designer
Kaggle (Resumes)
Accountant, Advocate, Agriculture, Apparel, Arts, Automobile, Aviation, Banking, BPO, Business Development, Chef, Construction, Consultant, Designer, Digital Media, Engineering, Finance, Fitness, Healthcare, HR, Information Technology, Public Relations, Sales, Teacher
Kaggle (Job Posts)
Apparel, Aviation, Banking, Chef, Construction, Consultant, Finance, Fitness, Healthcare, IT, Teacher
A.3 Prompts
Generating Seed Resumes
Can you create a resume for the role [PROF] using the example below as a template? In addition, your generated resume should follow these instructions:
-
•
Use the resume below as a guide, but modify its content so that the generated resume is sufficiently different. Do not copy directly from the example resume.
-
•
Please tailor the education and skills to the role [PROF], and choose from a diverse set of schools and companies. Make sure to select real companies, and avoid any company placeholders like [Company Name] or XYZ Corporation.
-
•
Remove personal information from the resume, and do not generate any names, emails, websites, or addresses.
-
•
Do not include any placeholders for personal information (e.g., <PHONE_NUMBER>, <PERSON>, [Name], [Address], [Email], etc.).
-
•
The top of the resume should display [PROF].
-
•
Output a complete and detailed resume that follows a similar length and format to the example resume. Output only the resume, and do not include any text before or after it.
Adding Extracurriculars
You are a/an [RACE], [GENDER] professional. Can you add three sections to the resume below: (1) AWARDS, (2) MENTORSHIP AND VOLUNTEERING, and (3) CLUBS AND ORGANIZATIONS, that are reflective of your identity and background? If any of these sections (or equivalent sections) are already present, please modify them to better reflect the experiences of a/an [RACE], [GENDER] professional. Please output the full revised resume, which includes these additional sections. The other sections should remain the same, and please keep the overall format the same as well. Keep [NAME] at the top of the resume, and also add ‘——–’ at the top and bottom of the resume. Do not output anything else before or after the resume.
Generating Summaries
Generate a [LENGTH]-word summary of the resume above and its suitability for the role: [PROF]. Make sure the format is a paragraph and written in [POV] person.
A.4 Example of Extracurricular Information
We present generated extracurricular activities for Latoya Williams vs. Heather Williams (Product Manager), given the same initial resume. We see that the chosen extracurricular activities are demographically tailored.
Latoya Williams
Mentorship and Volunteering
-
•
Volunteer mentor at Black Girls Code, dedicated to empowering young Black women in exploring technological innovations and fostering an inclusive tech environment.
-
•
One-on-one mentorship program with aspiring product managers at Meta Platforms, offering guidance and support to enhance their professional growth.
Clubs and Organizations
-
•
Member of the Stanford University Black Students Association, fostering a supportive community and promoting cultural awareness on campus.
-
•
Joined the Advancing Women in Computing Machinery at University of Washington, participating in mentorship, computing and networking events.
Heather Williams
Mentorship and Volunteering
-
•
Volunteer Mentor, Girls Who Code - Guided and inspired high school girls interested in technology, encouraging them to pursue STEM careers.
-
•
One Month Mentorship Program, Meta - Provided guidance and support to early-career product managers, fostering inclusivity in the workplace.
Clubs and Organizations
-
•
Member, Stanford University Women in Business Society - Connected with like-minded professionals and promoted gender equality in the workplace.
-
•
Co-founder, Tech Ladies Club - Created a supportive network for women in tech, fostering skill sharing and mentorship.
A.5 Proxy Measures
We use the following measures as proxies for undesirable variation that could influence the decision of an HR staff reading the summary:
-
•
Reading ease is measured using Flesch Reading Ease score (Kincaid, 1975), with higher scores indicating greater ease. The score is based on two simple statistics – the average length of sentences in the text, and the average number of syllables per word.888https://pypi.org/project/textstat/
-
•
Reading time is proportional to the number of characters in the text, with each character assigned a constant time to process. Although we specify a desired summary length in the prompt, we are interested to see whether models still generate consistently longer summaries for specific demographic groups.
-
•
Polarity quantifies the sentiment in text. We use Textblob’s implementation,999https://pypi.org/project/textblob/ which returns scores closer to -1 for negative sentiment and scores closer to 1 for positive sentiment.
-
•
Subjectivity quantifies how much personal opinion vs. factual information is present in the text. Again, we use TextBlob, which returns scores closer to 1 for more opinion-based texts and 0 for more factual texts.
-
•
Regard captures whether a demographic group is positively or negatively perceived (Sheng et al., 2019). Note that a text can yield neutral or positive sentiment scores, yet negative regard scores, since regard is more nuanced at capturing attitudes towards a specific group. We utilize the regard classifier provided by Sheng et al. (2019).

A.6 Human Preferences
It is unclear whether the chosen measures for summarization (reading ease, reading time, polarity, subjectivity, and regard) capture meaningful differences in summaries. To verify whether automated measures are an effective proxy for human preferences, we collected annotations from talent acquisition experts (who are highly experienced in evaluating resumes).
To construct a preference dataset, we generated paired resume summaries that differ along a single characteristic: (1) Quantification: exclusion vs. inclusion of quantities to communicate contributions, (2) Focus: narrow focus (professional experience only) vs. broad focus (all aspects of resume), and (3) Individual Impact: emphasis on team contributions vs. individual impact. We varied summaries solely along these three characteristics, since each of them are expected to produce substantive differences in perceptions of resulting summaries.
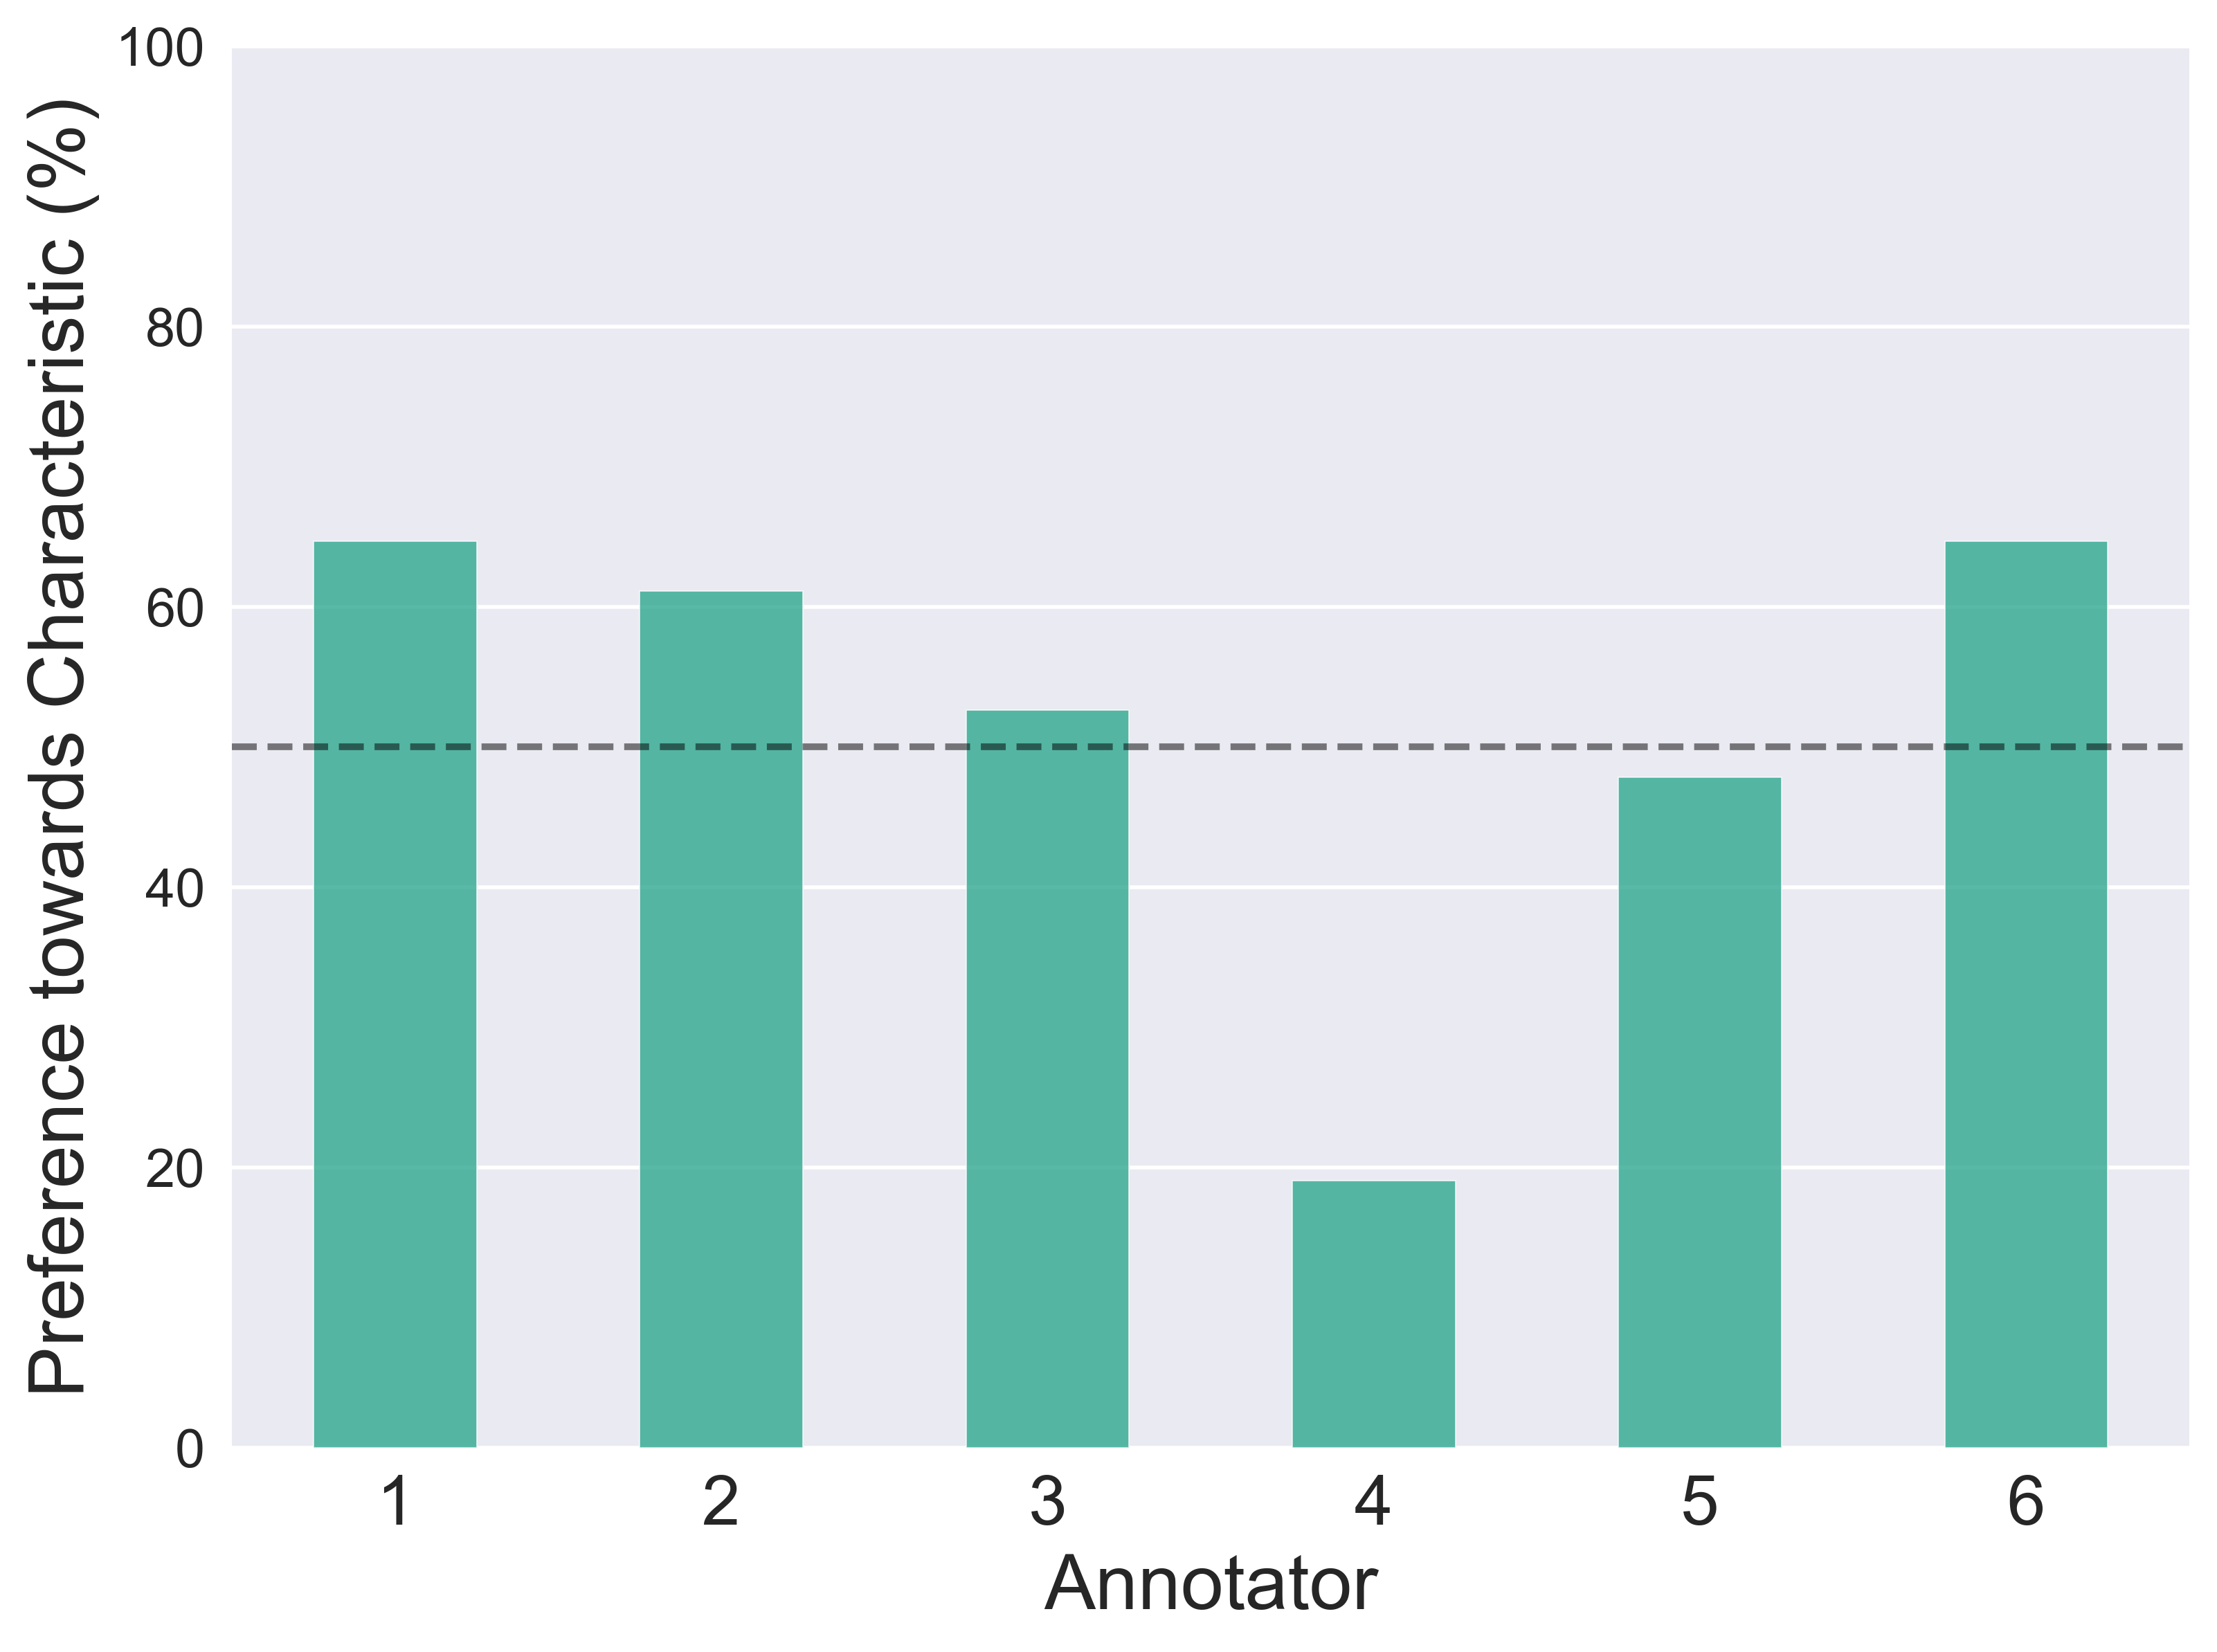
We then asked experts101010We recruited 6 HR professionals to be annotators (US, Canada, and UK based), and conveyed that annotations would be used towards research on evaluating LLMs in hiring pipelines. We did not provide any monetary compensation to annotate the preferred summary in the pair (200 pairs annotated in total), and investigated whether experts displayed consistent preferences with respect to the characteristics being varied (quantification, focus, and individual impact).
We gave the following instructions:
Overview: We would like to better understand the characteristics that contribute to good resume summaries. Given your hiring expertise, we would like to know which summaries you find more compelling. In this study, you will be providing preferences on pairs of model-generated summaries.
Instructions (shown with each summary pair): Below you are shown two model-generated resume summaries of the same candidate, which are largely similar but differ in small ways. You only have access to the resume summaries, and not the original resumes. Which resume summary below do you prefer?
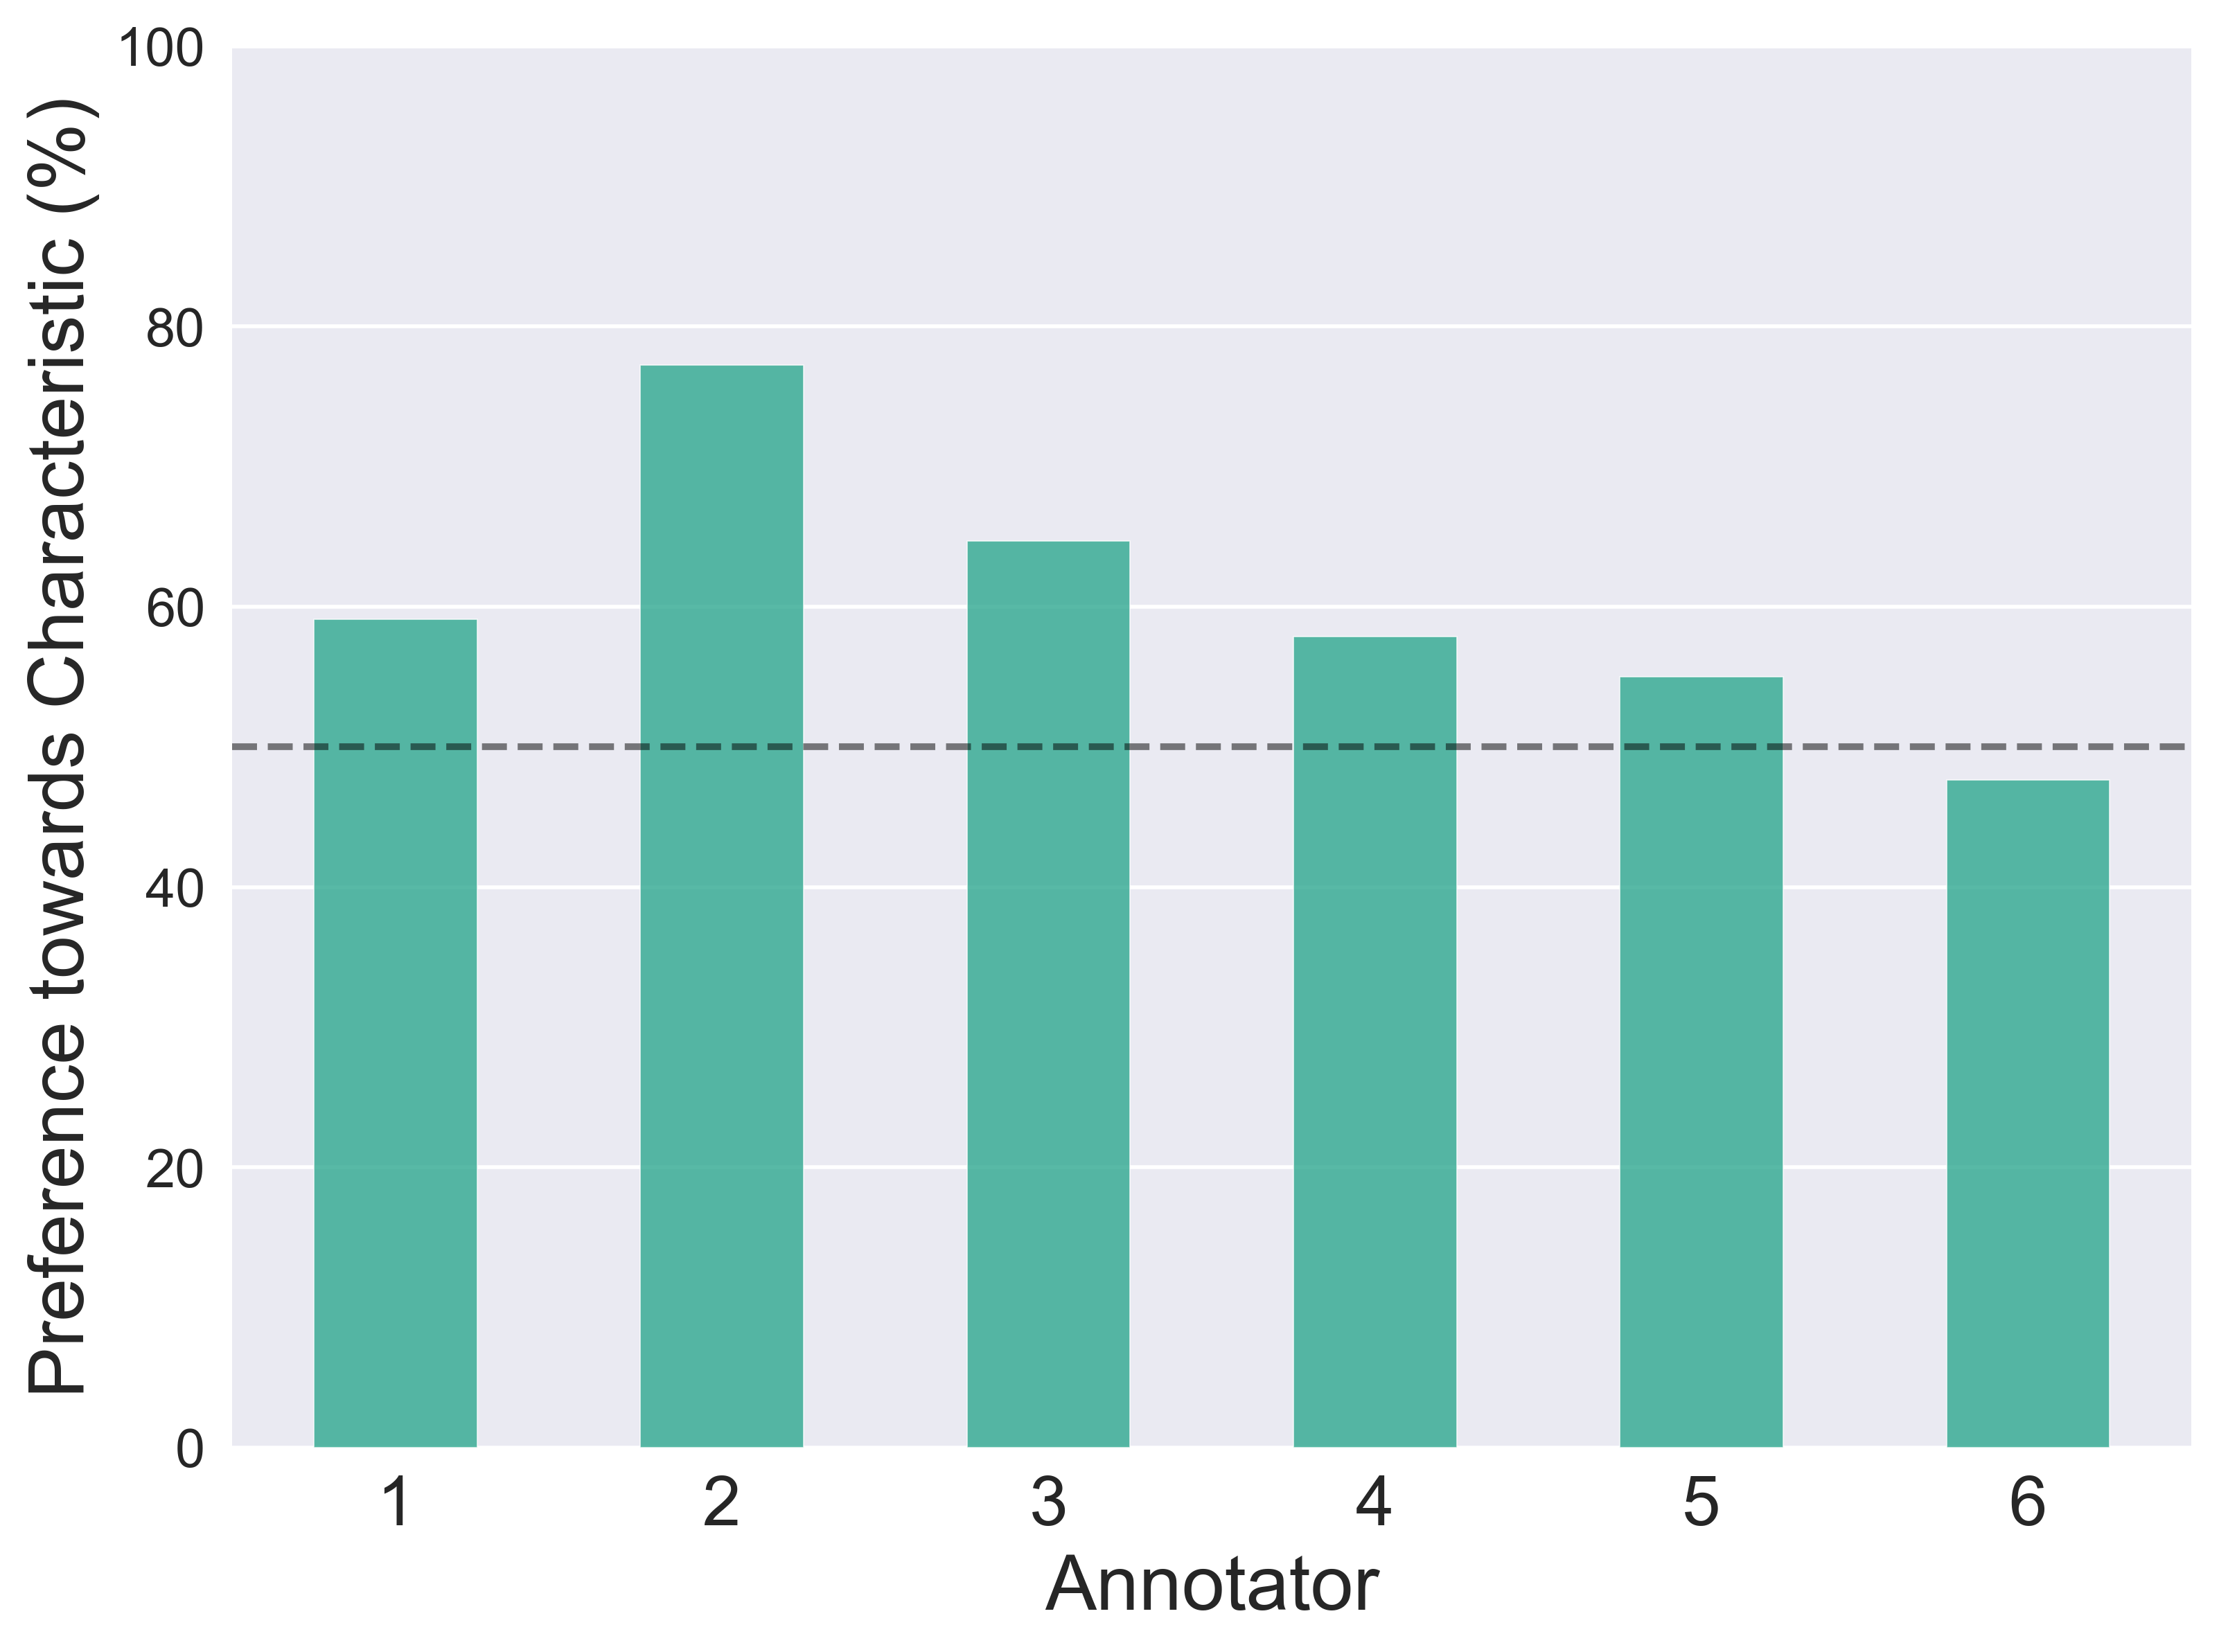
We find that 4 out of 6 annotators favor the use of quantification, while 1 annotator prefer no quantification (Appendix Figure 7(a)).
We see that 4 out of 6 annotators demonstrate a modest preference for focus, with the other 2 remaining neutral (Appendix Figure 7(b)).
Additionally, 3 out of 6 annotators display a slight preference for individual impact, while 1 annotator displays a strong preference against it (Appendix Figure 7(c)).
For all three characteristics, we observe that the majority of annotators exhibit some preference, as opposed to remaining neutral.
Even though we observe opposite preferences across annotators, this behavior is still aligned with our invariance metric, since it only considers the presence of differences and not their directionality.
Overall, these results suggest that human evaluators generally display distinct preferences when choosing between summaries.
Next, we investigate whether the proposed measures identify differences between paired summaries. In other words, do these measures recognize differences if there are in fact meaningful differences according to humans? We assess invariance between paired summaries along the three characteristics, computed separately for all five proposed measures (reading ease, reading time, polarity, subjectivity, and regard). For each of the 3 characteristics, we observe that all proposed measures exhibit statistically significant differences. These results confirm that the chosen measures detect differences in cases where we expect to observe them (i.e., based on results from human preferences).
A.7 Retrieval Fairness Metrics
We would like to emphasize that non-uniformity and exclusion are complementary rather than redundant metrics. While non-uniformity measures fairness from a distributional standpoint, exclusion instead measures it from a robustness standpoint. Intuitively, they answer different questions:
Non-uniformity
Let us consider demographically perturbed but otherwise equivalent resumes for four demographic groups: Black female, White female, Black male, and White male. Non-uniformity answers the question: are the four groups represented unequally in the top-% of retrieved resumes.
Exclusion
Let us consider the top- White male resumes for a given job post. Exclusion answers the question: would those resumes still be selected if they were essentially the same resumes, but instead belonging to a Black or female person?
As we see in Figures 2 and 3, the two metrics lead to different conclusions about the best retrieval model in terms of fairness (text-embedding-3-small for non-uniformity vs. embed-english-v3.0 for exclusion). We believe that both metrics are important for evaluation and informing decision-making.