Fuzzy Information Entropy and Region Biased Matrix Factorization for Web Service QoS Prediction
Abstract
Nowadays, there are many similar services available on the internet, making Quality of Service (QoS) a key concern for users. Since collecting QoS values for all services through user invocations is impractical, predicting QoS values is a more feasible approach. Matrix factorization is considered an effective prediction method. However, most existing matrix factorization algorithms focus on capturing global similarities between users and services, overlooking the local similarities between users and their similar neighbors, as well as the non-interactive effects between users and services. This paper proposes a matrix factorization approach based on user information entropy and region bias, which utilizes a similarity measurement method based on fuzzy information entropy to identify similar neighbors of users. Simultaneously, it integrates the region bias between each user and service linearly into matrix factorization to capture the non-interactive features between users and services. This method demonstrates improved predictive performance in more realistic and complex network environments. Additionally, numerous experiments are conducted on real-world QoS datasets. The experimental results show that the proposed method outperforms some of the state-of-the-art methods in the field at matrix densities ranging from 5% to 20%.
Index Terms:
Web service, QoS prediction, fuzzy information entropy, region bias, matrix factorizationI Introduction
With the continuous advancement and maturation of cloud computing technology, developers from enterprises and organizations are increasingly inclined to deploy their web services to the cloud, further driving the development of web services [1, 2]. However, with the increasing number of web services on cloud platforms, there is a proliferation of homogeneous web services with similar or identical functionalities [3]. This presents a challenge for users in selecting services that suit their needs. In this scenario, QoS becomes a crucial consideration for users in selecting web services. Therefore, QoS-based service recommendation emerges as an important approach to address this issue, helping users better match their desired web services.
As one of the most popular model-based collaborative web service recommendation technology, matrix factorization (MF) is often used for QoS prediction [4, 5, 6]. It decomposes the user-service matrix into a user feature matrix and a service feature matrix, and the inner product of these two feature matrices is used to represent the prediction of the QoS values [7]. MF can capture the interactions between users and services and the global similarity between users and services well [8, 9, 10, 11, 12]. However, it struggles to capture the effect of non-interactions on the QoS values, such as resource capacity and service load, which heavily depend on service-specific factors and will cause prediction errors if not taken into account[13], as well as ignores the local similarity between users and services, which is the similarity between a user or service and its similar neighbors[2].
In this paper, we propose a fuzzy information entropy and region biased matrix factorization (FIEMF) which can capture the non-interactive features of users and services more fully by clustering users by region. Moreover, fuzzy information entropy (FIE) is used to measure the uncertainty of users’ rating preferences, which globally makes full use of the users’ rating information to find more similar neighboring users. Finally, it is demonstrated experimentally that the method proposed in this paper can achieve more effective QoS prediction.
In summary, this paper makes the following main contributions:
-
•
Users are clustered based on their regions to obtain more detailed bias centers. The location information of users and services is fully utilized to capture the effects of non-interactive features of users and services, making the model more consistent with real-world network scenarios.
-
•
A FIE-based similarity measurement method is proposed. This method measures the uncertainty of user rating preferences using FIE, fully exploring the hidden rating preferences in user rating data. As a result, the discovered neighbors are more representative and better aligned with the rating habits of real-world users.
-
•
Numerous experiments were conducted on real large-scale QoS dataset to evaluate FIEMF. The experimental results indicate that our proposed method outperforms the most advanced methods currently available.
The rest of the paper is organized as follows. Section II introduces the QoS prediction problem and the architecture of the methodology proposed in this paper. Section III describes in detail the methodology proposed in this paper. Section IV shows the experimental results. Section V describes the related work and Section VI concludes.
II Preliminaries
II-A Problem Formulation
Given a set of users and a set of services , a user-service invocation record can be recorded as a triplet , where , , and is the QoS value obtained when user invokes service . By collecting these invocation records, we can obtain a QoS matrix . Since in the real world most users only invoke a limited number of web services, the matrix is sparse. The QoS prediction problem can be defined as: Given a sparse QoS matrix , predict the missing QoS values in the matrix .
As a commonly used method based on latent feature analysis (LFA), MF decomposes the QoS matrix into a user feature matrices and a service feature matrices , and the inner product of these two matrices is used to predict the missing QoS values. represents the dimension of the feature. To determine the value of each element in the user feature matrix and service feature moments, we can minimize the following objective function:
| (1) |
where returns 1 if there is a invocation record and 0 if there is not, and represent the feature vectors of user and service , respectively.
Taking the effects of some factors specific to users and services into consideration, user bias and service bias are added to the model to improve the model performance. Therefore, the object function for bias-based MF can be derived as follows:
| (2) | ||||
where represents the bias specific to user and represents the bias specific to service . is Frobenius norm[14]. is a parameter that controls the degree of regularization and is used to prevent overfitting.
II-B Method Review
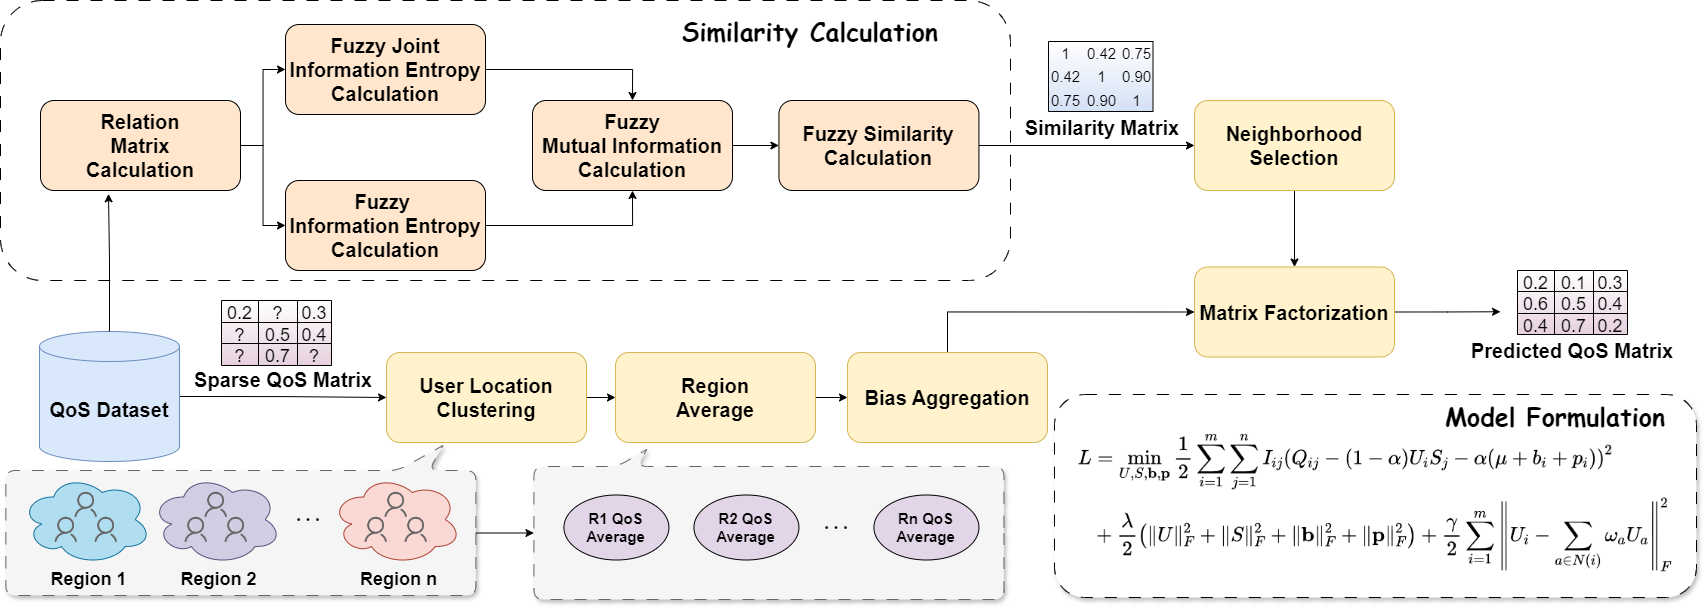
Traditional approaches cannot capture the hidden rating preferences of users in the QoS matrix, and the capture of bias is not sufficient. Therefore, FIEMF is proposed in this paper. The overall flow of FIEMF for integrating neighborhood information and bias information is shown in Fig. 1, which can be divided into 3 steps:
-
•
First, the users are clustered into regions according to their location information, then the QoS mean of each region is calculated as a bias center, and finally the bias of each user and service is integrated into the bias center.
-
•
In order to get a measure of the users’ rating preferences, the relationship matrix of each user is first calculated, then the FIE of each user and the fuzzy joint information entropy (FJIE) between users are derived from the relationship matrix. After that, the fuzzy mutual information (FMI) of the users is obtained base on FIE and FJIE, then the fuzzy similarity between the users is calculated based on FMI, and finally the neighbor selection is performed.
-
•
Finally, we linearly combine the bias model into MF and incorporate a neighborhood regularization term based on FIE into the model to enhance the accuracy and robustness of the model.
The details of the process will be described in the next section.
III Proposed Approach
III-A Neighborhood Selection
User ratings of services can reflect their rating preferences. For instance, some users have stringent QoS requirements, leading to generally lower service ratings, while others tend to give higher ratings. Based on this, we combine all user rating information and propose a measurement method based on FIE to assess the uncertainty of user preferences.
Definition 1.
Assuming U is the set of users, where user , and the set of service is denoted as (n2).Then the relationship matrix of user u on the service set S is
| (3) |
where , representing the fuzzy equivalence relationship between service (1 x n) and service (1 y n) regarding user u. The calculation formula for is defined as:
| (4) |
where is the rating of user u on service and is the median of the rating.
In Eq.(3), we can gather information about their rating preferences by fully utilizing user ratings. If the difference between and is not less than the median rating , it indicates that considering the ratings of user on services and separately does not help in determining the preferences of user , = 0. If the difference between and is less than , we can infer that the ratings of services and to some extent reflect the rating preferences of user . Specifically, if the ratings of user on services and are the same, then = 1.
After generating the relationship matrix , we can calculate the FIE of user based on the fuzzy equivalence relations in the matrix .
Definition 2.
Given the relationship matrix of user u as , The formula of fuzzy information entropy of user u is:
| (5) |
FIE can reflect users’ rating preferences. The closer the FIE between users, the more likely these two users have similar rating preferences, thereby indicating a higher similarity between them. Conversely, it is unlikely that these two users are neighbors to each other.
Definition 3.
If a and b are two users in the user set U, and the relationship matrices of and are represented by and , then the fuzzy joint information entropy of a and b is obtained as:
| (6) |
where , representing the smaller value of the elements in the x-th row and y-th column of matrices and .
Expanding on this, we take the correlation between the rating preferences of pairwise users into consideration and propose a measurement method based on FMI to reflect the similarity between users.
Definition 4.
If and have the same rating preferences, meaning = = , then achieves its maximum value. Conversely, if and have dissimilar rating preferences, attains its minimum value.
To account for differences in FIE between users, we normalize the FMI and use the following formula instead of FMI for similarity calculations between users:
| (8) |
where represents the FIE similarity of user and user with a value between [0,1], which is symmetric in nature.
After obtaining the similarity between the current user and other users, we select the Top-K similar users as neighbors. Therefore, for user , its neighboring users can be identified by the following formula:
| (9) |
where is the set of Top-K users with the highest similarity to the current user’s FIE.
III-B Bias Integration
Users in the same region tend to enjoy similar network facilities and communication environments, so their QoS values are more similar. Thus, each user in the same region has a smaller bias from the regional average, in order to capture this bias more accurately, we cluster the users by region, the region where user is located can be represented by the following equation:
| (10) |
where is the set of users in the same region as user . When the region is too small, the QoS averages of the region are contingent and do not provide a good assessment of the local network conditions[2], so we set the level of the region to the country level.
After clustering the users, we calculate the mean value of each user region. The mean value of the region of user can be calculated by:
| (11) |
where represents the QoS average value of the region of user , represents the number of services with rating records in the region, represents the rating of each service by user in the region.
Considering the impact of user-specific and service-specific factors in the region, we add the user bias and service bias to to obtain the following bias model:
| (12) |
where represents the QoS prediction of user invoking service , is the bias of user and service , respectively.
III-C Matrix Factorization
Compared to Eq.(2), FIEMF provides a more accurate delineation of the bias centers, followed by a linear integration of the bias information proposed in Eq.(12) into the MF to improve the accuracy and robustness of the predictions. Based on these facts discussed above, the prediction model proposed in this paper is:
| (13) |
where is the QoS prediction value of user invoking service . Thus, the minimization objective function can be calculated by :
| (14) |
where is the coefficient of the regularization term to prevent overfitting.
Eq.(14) can effectively estimate the overall structure associated with users or services (global similarity). However, the model performs poorly in detecting users or services that are similar to a small subset of users or services, and the neighborhood model can solve this problem well. Therefore, in this paper, a neighborhood regularization term based on FIE is added to Eq.(14), aiming at capturing the local similarity between users and services and reflecting the users’ rating preferences. The objective function is as follows:
| (15) | ||||
where is the coefficient of the regular term, is the Top-K similar users of user , is the similarity weight of user to user , which can be calculated by:
| (16) |
since the loss function is not convex, we use stochastic gradient descent (SDG)[15] to solve for the optimal parameters of the with the following update rule:
| (17) | ||||
| (18) | ||||
| (19) | ||||
| (20) |
where is the learning rate of gradient descent, and the gradient of is calculated by:
| (21) | ||||
| (22) | ||||
| (23) | ||||
| (24) | ||||
IV Experiments
In this section, we conduct several experiments on real QoS datasets to validate the effectiveness of FIEMF and verify its performance against 7 existing QoS prediction methods. The experiments have 3 main objectives: (1) Validating the validity and robustness of the FIEMF. (2) Comparing the performance of FIEMF with other methods. (3) Analyzing the effect of parameters on performance.
IV-A Experimental environment
We conducted experiments using Python3.7 and PyCharm on a computer with a 64-bit Windows 10 operating system using an AMD R7 6800H 3.2GHz CPU and 16GB RAM.
IV-B Dataset
We conducted experiments on the real-world QoS dataset WS-DREAM111https://github.com/wsdream. It contains 1,974,675 QoS records from 339 distributed users from 30 different regions making invocations to 5,825 Web services in 73 different regions. The region information is included in the user list. We select response time as the evaluation metric for performance.
IV-C Metrics
The accuracy of QoS prediction directly reflects the effectiveness of the model. Therefore, we focuses on the accuracy of the model and uses mean absolute error (MAE) and root mean square error (RMSE) as evaluation metrics.
| (25) |
and RMSE is calculated as:
| (26) |
where is the QoS value observed by user when user invokes service and is the QoS prediction value, and represents the number of entries in the test set.
IV-D Performance Comparison
To validate the accuracy of our method, we compared FIEMF with the following 7 methods:
-
•
UMEAN: This method utilizes the known QoS values of the target user to find an average value.
-
•
IMEAN: This method utilizes the known QoS values of the target service to find an average value.
-
•
UIPCC: This method combines user-based CF and item-based CF.
-
•
PMF: This method uses probabilistic matrix factorization to factorize QoS matrix for the prediction.
-
•
BiasedMF: This method uses user bias and service bias.
-
•
NIMF: This method integrates neighborhood information using Pearson Correlation Coefficient(PCC).
-
•
NBMF: This method utilizes network bias to predict QoS.
In the real world, the user-service matrix is usually sparse, so we take 5%, 10%, 15%, and 20% of the QoS data from the original dataset as the training set and the rest as the test set. We set the parameters of the baseline method as a control experiment according to the corresponding paper. For our method, we set the parameters to . The maximum number of iterations of the model is set to 300.
| Method | MAE | Improve | RMSE | Improve | ||||||
|---|---|---|---|---|---|---|---|---|---|---|
| D=5% | D=10% | D=15% | D=20% | D=5% | D=10% | D=15% | D=20% | |||
| UMEAN | 0.8816 | 0.8776 | 0.8743 | 0.8734 | 46.26% | 1.8573 | 1.8558 | 1.8558 | 1.8579 | 32.57% |
| IMEAN | 0.7036 | 0.6888 | 0.6848 | 0.6799 | 31.69% | 1.5722 | 1.5382 | 1.5312 | 1.5297 | 18.91% |
| UIPCC | 0.6398 | 0.5360 | 0.4876 | 0.4608 | 10.77% | 1.4742 | 1.3461 | 1.2704 | 1.2216 | 5.77% |
| PMF | 0.5686 | 0.4861 | 0.4512 | 0.4306 | 2.40% | 1.5373 | 1.3143 | 1.2197 | 1.1695 | 4.16% |
| BiasedMF | 0.5947 | 0.5124 | 0.4777 | 0.4559 | 7.44% | 1.3822 | 1.2602 | 1.2086 | 1.1782 | 0.52% |
| NIMF | 0.5455 | 0.4817 | 0.4503 | 0.4287 | 1.02% | 1.4659 | 1.2858 | 1.2088 | 1.1650 | 2.20% |
| NBMF | 0.5265 | 0.4827 | 0.4618 | 0.4488 | 1.94% | 1.4255 | 1.2721 | 1.2235 | 1.1905 | 2.08% |
| FIEMF | 0.5326 | 0.4752 | 0.4470 | 0.4302 | - | 1.4079 | 1.2560 | 1.1893 | 1.1544 | - |
Table. I shows the results of our experiments. Compared to all baseline methods, FIEMF improved MAE by 1.02%46.26% and RMSE by 0.52%32.57%. In terms of average improvement rates, our method outperforms all baseline methods in the range of 5% to 20% matrix density. Compared to BiasedMF, which takes into account user bias and service bias, MAE and RMSE are improved by 7.44% and 0.52%, respectively. However, when the density is 5%, FIEMF performs slightly worse than BiasedMF in terms of RMSE. This is because the neighborhood regularization term in FIEMF can reduce the prediction performance of the bias term when the data is extremely sparse. Compared to the NBMF method that additionally considers network bias, the MAE and RMSE are improved by 1.94% and 2.08%, which is due to the fact that our method additionally utilizes the user’s neighborhood information. Compared with NIMF, our method outperforms it in most cases, which indicates that our method is more reasonable for neighborhood selection. Moreover, we can also see that the accuracy of the prediction improves significantly as the density of the matrix increases, which indicates that the more QoS information is available, the more accurate the prediction is.
IV-E Impact of Parameters
In this part, we analyze the effect of different parameters on FIEMF, including the effect of dimension , the effects of parameter and parameter .
-
•
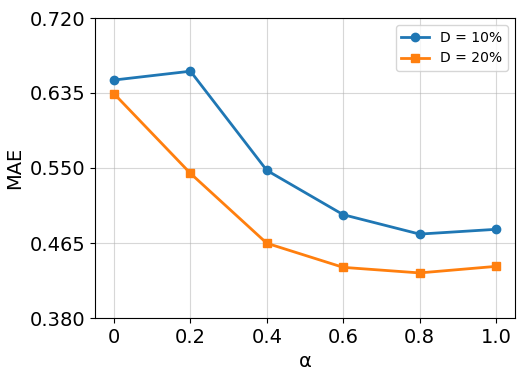
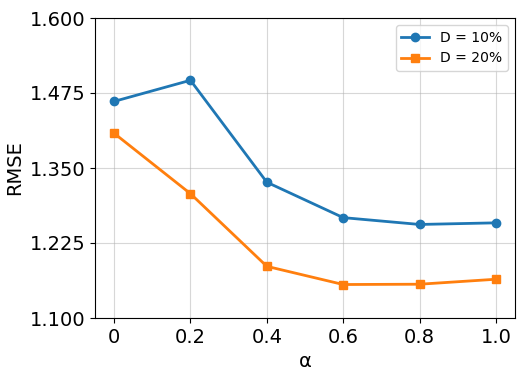
Impact of Parameter : The parameter controls the ratio of the weights of the user service interaction term to the region bias term. When , the prediction will completely rely on the region bias term without considering the effect of user service interaction. When , FIEMF degenerates into a MF with the addition of the neighborhood regular term. At this point, we can explore the improvement that the mere addition of the FIE-based neighborhood regular term brings to the traditional MF method. Fig.(4) shows the change in MAE and RMSE when increases, the values of both MAE and RMSE are decreasing to a certain threshold and then increase, and when , the values of MAE and RMSE are much smaller than those of the PMF method under the corresponding density, which indicates that the inclusion of the FIE-based neighborhood regularity term significantly improves the accuracy of the prediction.
-
•
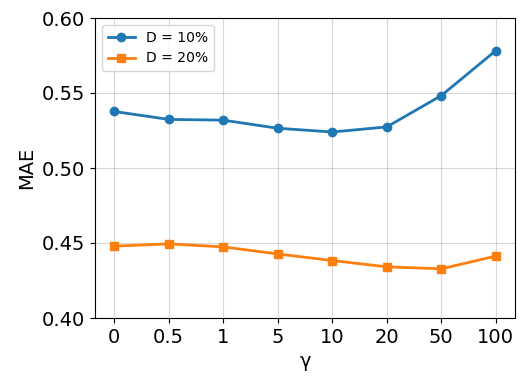
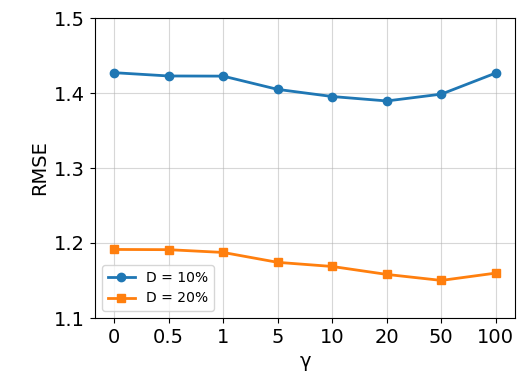
Impact of Parameter : The parameter controls the weight of the FIE-based neighborhood regularization term. Fig.(4) shows the variation of MAE and RMSE when varies from 0 to 100. It should be noted that when , the FIEMF degenerates into a MF that merely incorporates the region bias, so we can explore whether the FIE-based neighborhood regular term improves the performance of the MF. It can be seen that when increases, both MAE and RMSE first drop to a certain threshold and then start to rise, which indicates that the regular term improves the accuracy of prediction.
-
•
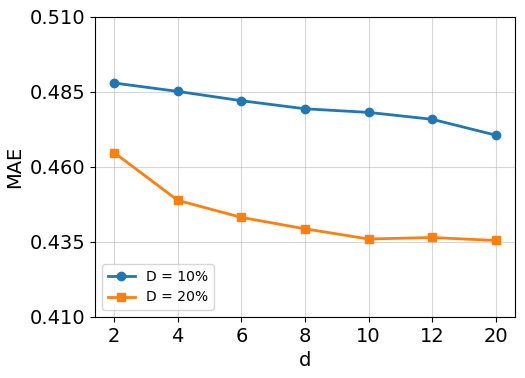
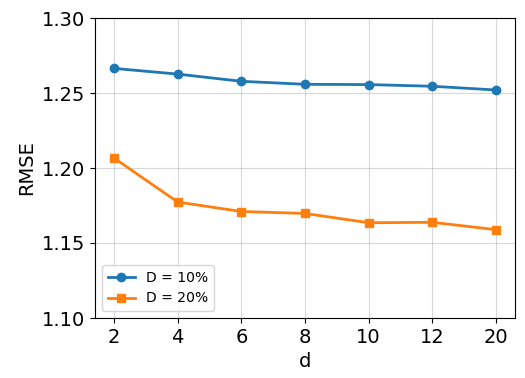
Impact of Dimension : The dimension represents the number of latent features of the user service matrix, appropriate values of dimension can greatly improve the accuracy and efficiency of the prediction. To explore the impact of dimension, we vary the value of the dimension from 0 to 20. Fig.(4) demonstrates the changes in MAE and RMSE when the dimension varies. When the matrix density is 10%, there is a slight decrease in MAE and RMSE, and when the matrix density is 20%, both MAE and RMSE decrease, and the decrease slows down dramatically by . Since the computation of the user and service feature matrices increases dramatically when the dimension increases, we should balance accuracy and computational efficiency. When , the efficiency and accuracy of the computation can be achieved with good results.
V Related Work
Collaborative filtering(CF) methods are often used for QoS prediction [2], including memory-based and model-based CF. Memory-based CF calculate the similarity between users using PCC [16] or cosine similarity, and then predict the QoS value of the target user based on the QoS values feedback from similar users. Model-based CF construct a global model using rating data, which has the ability to predict unknown data.
Matrix factorization has become the most popular model-based CF technique due to its efficiency and scalability[8, 10]. Zhu et al[13]. proposed a MF method that takes into account the biases of users and services for capturing the effect of some user-specific and service-specific features, such as resource capacity and service load, on the QoS prediction values, but they ignored the fact that users in the same area often enjoy similar network facilities and communication environments, and also enjoy more similar bias centers. Tang et al.[17] improved the classic factorization machine model by incorporating the location of service users. In order to fully utilize neighborhood information. Zheng et al.[18] proposed a neighborhood integrated matrix factorization (NIMF), which tries to capture the local similarity of users and services by linearly combining the similar neighbor information of users into MF. However, the similarity measure they used only considers a small number of services where users have common rating items, so two users with large similarity do not necessarily have the same rating preferences. This leads to a high degree of chance in the prediction results [19, 20]. He et al.[21] used the K-means method to cluster based on the latitude and longitude information of user nodes and service nodes to optimize the neighborhood.
These methods have improved prediction accuracy to some extent, but they have not simultaneously considered the influence of user location information and non-interaction features, as well as user rating preferences.
VI Conclusion
In this paper, we propose a QoS prediction method FIEMF based on fuzzy information entropy and region bias. Firstly, clustering is performed based on the user’s location information, and then bias information is added, followed by calculating the user’s fuzzy information entropy, calculating the similarity according to the fuzzy information entropy, and then choosing the neighborhood based on the similarity, and finally, incorporating the bias model and the neighborhood model into MF in order to predict the QoS more accurately. The FIEMF model captures the non-interactive features of users and services more accurately by combining the user location information, and the fuzzy information entropy is utilized to measure the similarity between users, which can reflect the uncertainty of the user’s rating preference well. Finally, this paper integrates neighborhood information into the MF model, which effectively exploits the local similarity in the MF model. In the future, we consider adding the time factor into our model to enable our model to perform real-time QoS prediction. In addition, we will consider better region partitioning, and more reasonable neighborhood selection to make our model more accurate and robust.
References
- [1] Q. Duan, Y. Yan, A. V. Vasilakos, A survey on service-oriented network virtualization toward convergence of networking and cloud computing, IEEE Transactions on Network and Service Management 9 (4) (2012) 373–392.
- [2] Z. Zheng, X. Li, M. Tang, F. Xie, M. R. Lyu, Web service qos prediction via collaborative filtering: A survey, IEEE Transactions on Services Computing 15 (4) (2020) 2455–2472.
- [3] R. Xiong, J. Wang, N. Zhang, Y. Ma, Deep hybrid collaborative filtering for web service recommendation, Expert systems with Applications 110 (2018) 191–205.
- [4] D. Goldberg, D. Nichols, B. M. Oki, D. Terry, Using collaborative filtering to weave an information tapestry, Communications of the ACM 35 (12) (1992) 61–70.
- [5] S. H. Ghafouri, S. M. Hashemi, P. C. Hung, A survey on web service qos prediction methods, IEEE Transactions on Services Computing 15 (4) (2020) 2439–2454.
- [6] F. Chen, Y. Du, W. Zhong, H. Wang, Web service qos prediction based on reputation and location aware matrix factorization, in: 2022 IEEE Smartworld, Ubiquitous Intelligence & Computing, Scalable Computing & Communications, Digital Twin, Privacy Computing, Metaverse, Autonomous & Trusted Vehicles (SmartWorld/UIC/ScalCom/DigitalTwin/PriComp/Meta), IEEE, 2022, pp. 1722–1729.
- [7] X. Luo, J. Liu, D. Zhang, X. Chang, A large-scale web qos prediction scheme for the industrial internet of things based on a kernel machine learning algorithm, Computer Networks 101 (2016) 81–89.
- [8] W. Zhong, Y. Du, C. Shan, H. Wang, F. Chen, Collaborative web service quality prediction via network biased matrix factorization., in: SEKE, 2022, pp. 418–423.
- [9] W. Lo, J. Yin, S. Deng, Y. Li, Z. Wu, Collaborative web service qos prediction with location-based regularization, in: 2012 IEEE 19th international conference on web services, IEEE, 2012, pp. 464–471.
- [10] D. Wu, P. Zhang, Y. He, X. Luo, A double-space and double-norm ensembled latent factor model for highly accurate web service qos prediction, IEEE Transactions on Services Computing 16 (2) (2022) 802–814.
- [11] S. Zhang, L. Yao, B. Wu, X. Xu, X. Zhang, L. Zhu, Unraveling metric vector spaces with factorization for recommendation, IEEE Transactions on Industrial Informatics 16 (2) (2019) 732–742.
- [12] C.-K. Hsieh, L. Yang, Y. Cui, T.-Y. Lin, S. Belongie, D. Estrin, Collaborative metric learning, in: Proceedings of the 26th international conference on world wide web, 2017, pp. 193–201.
- [13] J. Zhu, P. He, Z. Zheng, M. R. Lyu, Online qos prediction for runtime service adaptation via adaptive matrix factorization, IEEE Transactions on Parallel and Distributed Systems 28 (10) (2017) 2911–2924.
- [14] B. Recht, M. Fazel, P. A. Parrilo, Guaranteed minimum-rank solutions of linear matrix equations via nuclear norm minimization, SIAM review 52 (3) (2010) 471–501.
- [15] R. Gemulla, E. Nijkamp, P. J. Haas, Y. Sismanis, Large-scale matrix factorization with distributed stochastic gradient descent, in: Proceedings of the 17th ACM SIGKDD international conference on Knowledge discovery and data mining, 2011, pp. 69–77.
- [16] P. Resnick, N. Iacovou, M. Suchak, P. Bergstrom, J. Riedl, Grouplens: An open architecture for collaborative filtering of netnews, in: Proceedings of the 1994 ACM conference on Computer supported cooperative work, 1994, pp. 175–186.
- [17] M. Tang, W. Liang, Y. Yang, J. Xie, A factorization machine-based qos prediction approach for mobile service selection, IEEE Access 7 (2019) 32961–32970.
- [18] Z. Zheng, H. Ma, M. R. Lyu, I. King, Collaborative web service qos prediction via neighborhood integrated matrix factorization, IEEE Transactions on Services Computing 6 (3) (2012) 289–299.
- [19] J. Zhang, Y. Lin, M. Lin, J. Lin, H. Li, Entropy-based collaborative filtering algorithm, Journal of Shandong University 46 (2) (2016) 43–50.
- [20] Z. Jia, L. Yaojin, L. Menglei, et al., Target user’s neighbors modification based collaborative filtering, Pattern Recognition and Artificial Intelligence 28 (9) (2015) 802–810.
- [21] P. He, J. Zhu, Z. Zheng, J. Xu, M. R. Lyu, Location-based hierarchical matrix factorization for web service recommendation, in: 2014 IEEE international conference on web services, IEEE, 2014, pp. 297–304.