si
Spanish heat waves curb discretionary mobility and alter work behavior
Abstract
Extreme heat is a growing problem in European countries, with rising temperatures especially affecting aging populations. While research has documented how high temperatures affect individual decisions in cities—such as consumer spending and pedestrian behavior—less is known about how these decisions vary across demographic groups or how they aggregate to reshape mobility networks. Using open human mobility data derived from both passive and active connections to mobile networks, we examine the effects of extreme heat on mobility patterns in Spain, stratifying the data by age, gender, socioeconomic class, and activity. Our findings reveal that activity falls by as much as 10% on hot days generally and as much as 20% during hot afternoons specifically, when temperatures are highest. Individuals reduce infrequent activities most, frequent activities less so, and rarely miss work. Furthermore, significant demographic differences emerge on hot days. Older adults are more likely to avoid work-related travel and cut back substantially on other activities, while those earning less are less able to reduce work-related mobility, highlighting socioeconomic disparities. Our results show evidence that extreme heat not only disrupts mobility but exacerbates intergroup differences, disproportionately affecting the most vulnerable groups.
Introduction
Extreme heat poses a serious threat to lives, livelihoods, and the economy [1, 2]. Rising temperatures have been linked to higher mortality rates [3, 4] and heat waves are responsible for increased hospital admissions [5, 6]. Extreme heat reduces productivity in both manufacturing [7] and agriculture [8], and slows economic growth [9, 10]. These challenges have been compounded by the increasing intensity and duration of heat waves over the past century [11, 12]; in Europe, summers that were once 1 in 100 year events by temperature may become 1 in 20 year events [13]. Here we develop our understanding of how human behavior responds to extreme heat by linking mobility data, stratified by a rich set of attributes, with climatic conditions. Our findings provide the first estimates of how different groups adapt to heat, revealing constraints and trade-offs, at the national level and in the European context.
The effects of extreme heat are not distributed evenly across population groups, as some are more vulnerable or exposed than others [1, 14]. For example, the elderly are disproportionately affected by extreme temperatures [15, 16] due to increased vulnerability, often associated with chronic conditions such as diabetes [17, 18], which heighten their risk during heat events [19]. Similarly, while not inherently vulnerable, some workers face significant risks due to prolonged exposure to extreme temperatures, particularly those that engage in sectors of the economy that rely on physical labor [20], such as construction and agriculture [21]. Socioeconomic status is also known to play a key role in determining the impacts of extreme heat, as wealthier households turn on air conditioning at lower temperatures than poorer households [22]. In relatively affluent regions such as the US, the widespread adoption of air conditioning has significantly reduced heat-related mortality, highlighting the importance of wealth in adapting to climate stress [23, 24].
Individuals respond to hot weather based on their level of vulnerability and exposure to high temperatures, adjusting their behavior and adapting to the risks posed by extreme heat. For example, time-use studies suggest that individuals reduce outdoor activities and shift towards indoor spaces during heat waves [25], yet such shifts may be constrained by income, occupation, or urban design [26]. Cities in many contexts see more cyclists and pedestrians on warm days, but fewer on hot and humid days [27], demonstrating a parabolic relationship between temperature and active travel. On hot days, more employees report missing work and employees who do work report being less productive [28]. Social and economic incentives may moderate behavioral adaptations, as there is evidence that the risk of heat stroke is heightened in the military and during athletic competitions [29]. Further, shocks to infrastructure may either encourage or discourage adaptation, with railways, roadways, and energy grids experiencing greater strain during heat waves [30]. Such disruptions could, in turn, indirectly influence behavior, compounding the challenges posed by extreme heat.
While research has identified connections between extreme heat and its impacts on health, behavior, and economic activity, critical questions remain about the complex ways in which heat shapes human mobility at scale and across different populations [27]. Mobility data derived from digital traces offers a powerful lens to study these behavioral dynamics. Recent advances in GPS mobility tracking have revealed stark differences in how socioeconomic groups respond to extreme heat [31]. For example, wealthier groups can reduce outdoor activity for longer durations, while disadvantaged groups are often compelled to return to work or other activities sooner, despite continued risks [32].
The European context provides a valuable setting for examining these behavioral dynamics. Unlike many developing regions, much of Europe has historically experienced temperate climates, yet the frequency of extreme heat events has risen sharply in recent decades [33]. This combination of historically moderate temperatures and increasing heat exposure creates a natural laboratory for studying behavioral adaptation. Notably, compared to many other regions, Europeans show vulnerability to heat at lower temperatures [34], making even moderate heat waves consequential for public health and human behavior. Research shows that around the world, the point at which both cold and hot temperatures cause mortality and morbidity varies with the average temperature [35], suggesting that populations learn to live in different climatic conditions, but it is not clear that adaptation along the necessary cultural and technological dimensions will occur at the speed of climate change in Europe, as recent heat waves have been equally fatal as those in prior decades [36, 37].
Several additional factors make Europe particularly suitable for studying heat-related behavioral changes. First, the continent faces distinct vulnerabilities due to its aging population, as the elderly are disproportionately affected by extreme temperatures [15, 16]. This demographic challenge is compounded by rising rates of chronic conditions like diabetes [17, 18] that heighten risks from extreme heat [19]. Second, Europe’s relatively low adoption of air conditioning compared to regions like the United States [38] means that populations must rely more heavily on behavioral adaptations to cope with rising temperatures [39]. Third, European cities differ markedly from their global counterparts in their cultural norms around mobility and leisure during periods of extreme heat [40], offering insights into how social factors shape adaptation strategies.
Spain, where we focus our study, exemplifies these European dynamics while facing intensifying challenges. Projections for the next 50 years suggest that Southern Europe, including Spain, will experience a combination of rising temperatures, increased drought frequency, and aging infrastructure [41]. Heat waves in this region are expected to become not only more intense but also more spatially expansive [42], affecting larger portions of the peninsula during any given event. These challenges highlight the urgent need for behavioral studies that can inform adaptation strategies tailored to European cities and populations.
Here we examine the effect of extreme heat on daily mobility patterns in Spain, thereby shedding light on the behavioral foundations that shape the economic and human impacts of high temperatures. We combine large-scale mobility data collected in 2021 and 2022 with high-resolution estimates of thermal comfort. By focusing on Spain, we explore how extreme heat alters activity patterns in a European context, considering factors such as the type of activity as well as demographic and socioeconomic disparities. We find a clear distinction between routine and non-routine activities: for a given person, work and study patterns change least, visits to places infrequently visited by that person change most, and those to places frequently visited change some but not as much. Activity falls most in the afternoon, when the temperature is hottest, and least in mornings and evenings. Commensurate with greater risk from extreme heat, the oldest populations adjust behaviors more than the youngest, and even travel to work less; further, we identify possible economic constraints, as the less affluent groups change behaviors less than the wealthy. This research offers new insights into how populations manage the challenges of extreme heat, trading off relative risks and needs, and informs adaptation strategies for European cities.
Results
To understand the effect of heat on activity we start by linking data on thermal comfort with data on daily mobility. We then apply several modeling techniques to detect statistically significant changes in mobility behaviour across various population groups.
To analyze mobility patterns, we use data provided by the Spanish Ministry for Transport [43], which contains records for the movements of million individuals, or of the population. The data represent flows within and between 3,999 districts, including mainland Spain and the Balearic Islands, and are stratified according a variety of important characteristics, including a broad classification of the activity and the trip distance, as well as the age, gender and economic class of the person making the trip. Trips are logged from both active events like texts and calls as well as passive events in the form of probes from the network operator, allowing high temporal and spatial resolution. Because they come from network operators rather than applications, these data have comparably less bias than data from aggregators of GPS location data and they are validated and balanced with surveys and administrative statistics to ensure quality and reliability (see Methods for more detail). Fig. 1A shows the networks for each month, demonstrating its strong coverage in both urban and rural areas. While many studies using GPS location data are only able to impute demographic attributes using administrative statistics [44, 45], often aggregated to large areal units that make the estimates crude, the data that we leverage here allow us to decompose travel according to demographic attributes without resorting to imputation. Because the data are aggregated into districts, we cannot see the precise activity, but each activity is given a category: home, work/study, and frequently- or infrequently-visited places. According to the Ministry for Transport, an activity is “frequent” if a given person visits that place once per month, and it is “infrequent” if not.
We measure daily variations in experienced heat using ERA5-HEAT data from the Copernicus program [46], which provides the Universal Thermal Climate Index (UTCI). This metric reflects perceived ambient conditions by incorporating temperature, humidity, solar radiation, and wind into a standardized formula. Focusing specifically on the impact of extreme heat, our analysis is restricted to the summer months, defined as May through September, for the years 2021 and 2022. Fig. 1B show the mean UTCI across months, with the strongest temperatures in July and August. In both periods of study, Spain experienced significant heat waves: heat waves occurred in June, July and August of 2022, and while 2021 was milder relative to 2022, and temperatures hit record highs in August.
Heat drives a sharp decline in travel for discretionary activities, with minimal impact on work or study mobility
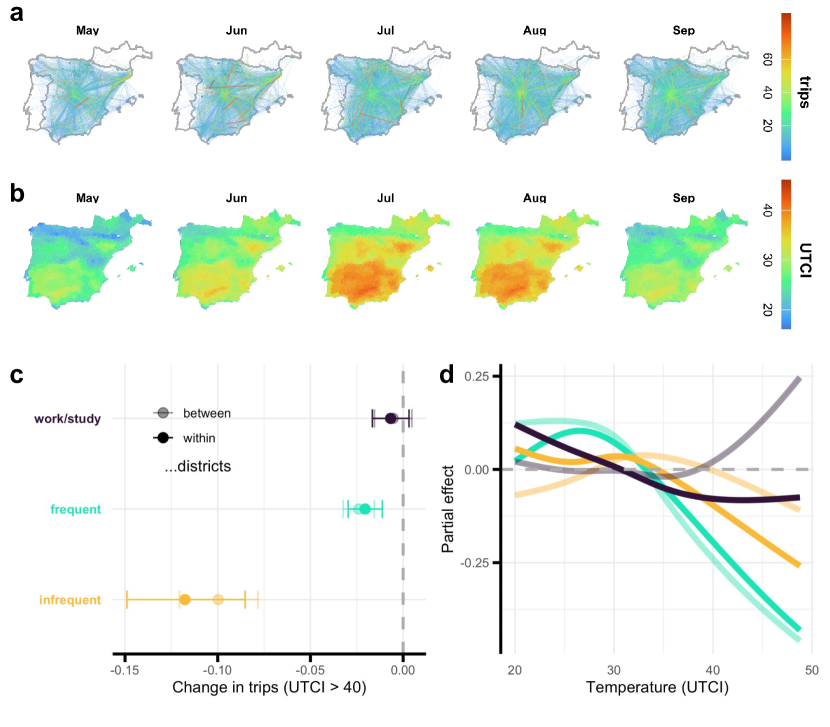
We use a two-way fixed effects model (TWFE) to estimate the causal effect of temperature on activity by exploiting variation in temperature while controlling for both time-invariant attributes and spatially-uniform shocks through district and date fixed effects. The district controls are necessary to strip out spatial confounds and the date controls are important to adjust for temporal patterns, as Spain sees activity change considerably in August as many people make holidays during this month. Shown in Fig. 1C, infrequent trips fall around 10% and trips to work or school see little change, with frequent trips falling almost 3%. We see no differences comparing trips within districts and trips between differences.
To identify the form of the relationship between temperature and activity, which will allow us to make predictions across the full spectrum of temperatures, we turn to a generalized additive model (GAM), which fits smooth functions to capture nonlinear relationships in data and in doing so extract effects across different temperatures. In this model, we use province rather than district fixed effects because of the computing demands of fitting a GAM. We fit a cyclic cubic spline by day-of-year to model the seasonality, and include day-of-week and holiday terms to account for variations across days. Combined, these model any variance that is attributable to timing. When we attempt to isolate this continuous relationship between heat and activity in Fig. 1D, we see that higher temperatures result in lower activity. Although this model disagrees with the TWFE in which activities—frequent or infrequent—are most responsive to heat, which likely comes from using fixed effects at the level of the province rather than the district, the GAM shows that there is a temperature at which activity in both categories peaks—something which will we see further evidence of below. (In Fig. S3, we show these patterns are consistent when we limit our sample to large cities or small cities, and when we hold out 2022 or 2023.) This suggests that as climate patterns shift over time, some seasons and places will see visits and trips increase as warmer weather generates activity while others will see them decrease as hotter weather destroys activity.
A placebo test looks for confounding variables by shuffling temperature and examining whether our model detects an effect that should not exist. Our data allow us to test both spatial and temporal confounding, and we do so by permuting the temperature either within a district, so that each district on each day is treated with temperatures from another day of the year, or within a date, so that each district on each day is treated with temperatures from a another district in a different part of Spain. We show these results in S4 but report here that all specifications show no effect of permuted UTCI on activity.
In both models, work and study are not responsive to heat. Further, infrequent trips within a district—those that are more likely to be traversed on foot—fall more than those between districts. Next we leverage the rich demographic and geographic attributes in our data to examine how these effects vary across different populations and contexts.
Extreme heat affects mobility most for the elderly and poor, with no significant gender differences
In addition to activities, we can also disaggregate our data according to various demographic attributes, including age, gender and income. Our preferred specification is the TWFE which, under certain assumptions (see Methods section), allows us to estimate a causal effect of extreme heat on mobility. In the following investigation, we use temperature bins to assess the effects of different temperatures on activity, from mild to hot, rather than a binary indicator of extreme heat. Because of the expansive nature of the data, our estimates are significant and precise, but the effect sizes vary.
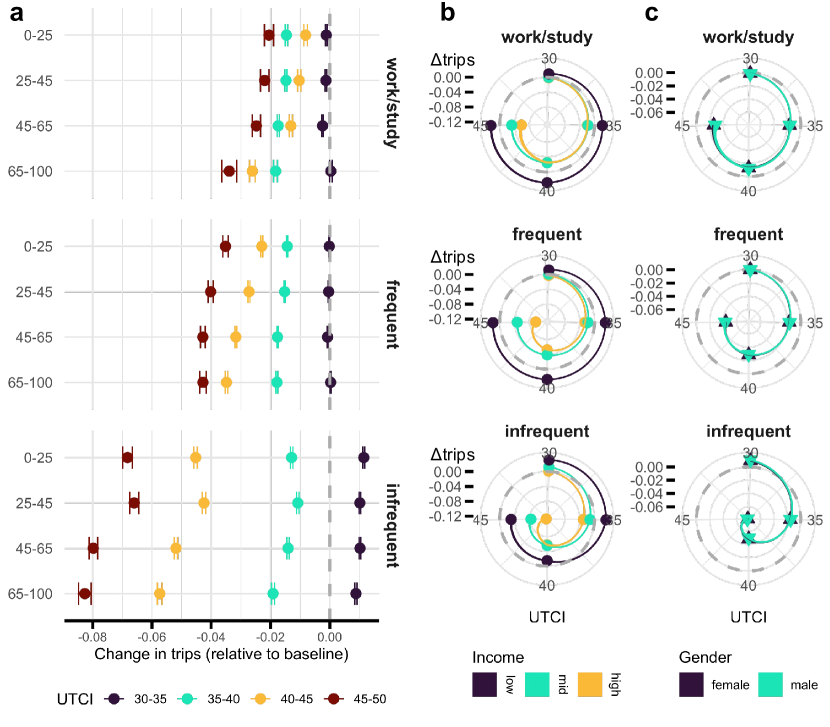
In Fig. 2A we see a gradient, with higher temperatures corresponding to stronger declines in activity across all age groups. Looking at how different ages respond to extreme heat, our results are clear: mobility for the young is the least affected by high temperatures and the impact becomes larger as age increases. For the oldest group in our data, a given day with heat index above C corresponds to an 8% decline in infrequent activity, a 4% decline in frequent activity, and even a 3% change in work or study. Because we are using data from 2022 and 2023, we must note that these effects do not necessarily mean a reduction in work, because much if not all of the foregone travel could be to work from home. Yet this change in behavior would still have implications for cities as Spain warms over time: if the elderly are missing work, there is a direct economic cost to the workers, but if they are simply working from home, then the economic burden falls on the shops and restaurants that rely on business from commuters.
This is consistent with the fact that heat poses a greater risk to older populations than it does to younger ones [16]. In relative terms, the oldest are most affected by extreme heat but because they constitute a larger and more active population, the greatest decline in absolute terms comes from the middle-aged population, while younger populations are least impacted in both absolute and relative terms.
There are many plausible channels by which income and heat could interact but here we propose two that we then compare to the data: on the one hand, the wealthy might be more capable of coping with extreme heat, via air conditioned homes and cars, and thus remain unaffected; on the other hand, the poor might be less able to afford missing work. There is also a disparity in who can work from home, with many white collar jobs allowing at least some remote work and many blue collar jobs not allowing it at all. Shown in Fig. 2C, our results accord with the conjecture that the poor cannot afford to, or are not able to, miss work. Particularly, individuals from households in the lowest income bracket are unaffected by high temperatures while those from households in the highest income bracket reduce travel across all classes of activity.
Supporting the hypothesis that work compels the least affluent group to stay active, we see that this group still curbs infrequent activities while holding steady trips for work or study as well as for frequent activities even when the heat index surpasses C. These frequent activities could be attached to daily or weekly routines like lunch breaks, or taking children to school and therefore co-occur with work. For the wealthiest group, all three classes of activity fall at that level of discomfort—by as much as 10% and 15% for frequent and infrequent activities respectively.
With large differences large differences in labor force participation between men and women [47], and differences in both unpaid work and care work between men and women [48], we might expect routines to vary enough to see variation in responses to heat. Instead, once we stratify on the type of activity, we observe no gender differences in mobility. The lack of any difference here is consistent with research that shows relative progress toward gender equality in Spain [49], but because we cannot identify parents in our data, we cannot make any more specific claims. (We also note in Fig. S6 that there are no statistically significant differences between the trip counts in the network when we stratify on gender.)
Larger drops in the afternoon and on short trips that may involve active travel
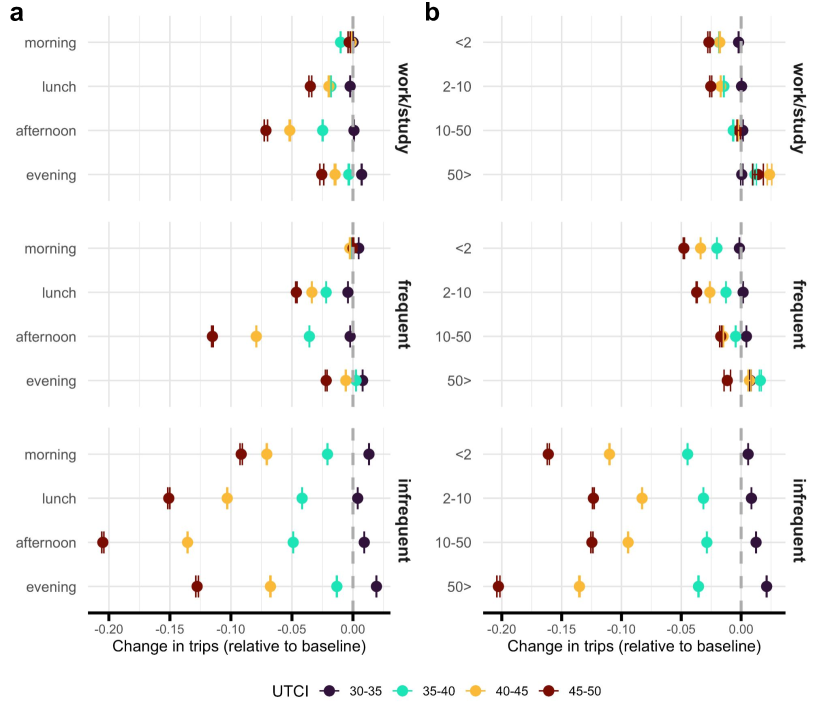
Because heat is variable throughout the day, starting off cooler in the morning, heating up in the afternoon and cooling later in the evening, we test whether or not the patterns we see demonstrate that people respond to changes in temperature as the day progresses. Fig. 3A shows that visits to all classes of activity fall more in the afternoon on hot days than they do in the morning, by as much as 20% for infrequent activities on the hottest days of the year. Yet even frequent activities, which may be coupled with work or study, fall by more than 10%. Taken together, this also lends credibility to our earlier estimates because it shows that mobility responds not just to hot days but the hottest part of the day, which would be less likely if we were observing a spurious effect.
In Fig. 3B, we explore effects across different journey lengths. Our data do not allow us to interrogate why people might be avoiding certain kinds of travel, but in our models we see that the largest reduction in activity that comes from trips that span less than 2 km, which are less likely to involve a car. This agrees with literature showing that cycling and walking are most impacted by hot days [27]. Again we see tight coupling between mobility for work or study and for frequent activities, suggesting that certain activities might go hand-in-hand with a routine that includes both professional obligations and personal needs. Although long trips are generally the least affected by high temperatures, they experience the largest declines when they involve infrequent activities, specifically when UTCI exceeds C.
While we again see evidence that long trips for infrequent activities increase when temperatures are mild and decrease when they are hot, we find no evidence that people are moving from hot to cool with long trips. In Table S6, we modify a standard “gravity model”, which estimates flows between districts based on distance and population, to include the temperature gradient between origin and destination; this gradient shows no effect on flows.
Reduced social mixing as temperature rises
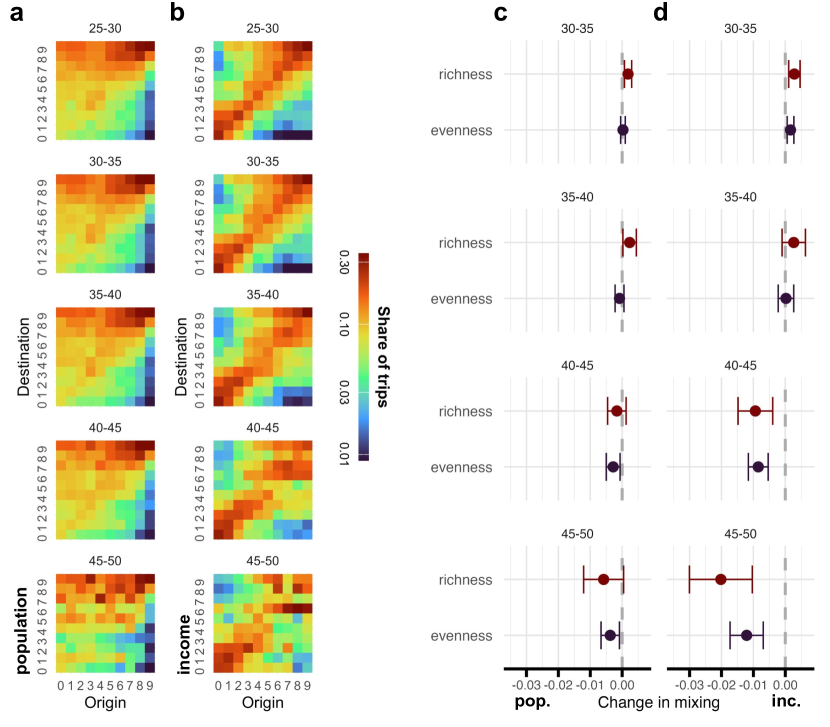
We also document significant changes to the structure of the mobility network as temperature changes, which may have implications for how urban areas function and how social groups mix. Fig. 4A and 4B show how trips flow to and from districts with different populations and different incomes (in deciles), respectively. Generally, trips flow from less populous to more populous areas (urban bias), and from lower income to higher income (wealth bias). These patterns are marked by the higher values in the upper triangles of the matrices in Fig. 4A and 4B. We stratify on UTCI to show how these mixing profiles vary under different climatic conditions, and plot results by row according to different UTCI bands. When it becomes hotter, these twin biases attenuate. More trips occur within middle quantiles, and in particular few trips flow from middle income to high income. Agreeing with our earlier results showing limited change amongst the poorest, flows within and between low income districts holds constant. (Note that districts are large units, with thousand residents, ratio of (between)-district to within-district flows is 3:1, so while many needs are met within each district here is substantial potential for mixing.)
Building on these descriptive results, we introduce another TWFE design to relate mixing with temperature, again controling for district and date. To do this, we compute two metrics, borrowing from ecology [50]: richness, defined as the raw number of income or population groups who visit, and evenness, measured using the Shannon entropy of visitor distribution across population or income groups. Note that we are testing for something subtly different, because in the mixing matrices we look at correlation between origin and destination and here we are looking at the diversity of origins present for a given destination. The new metrics, richness and evenness, are used as the dependent variables in our model. Looking at mixing between low and high population districts in Fig. 4C, we see less of a change in than what is visible in the matrices, although there may be a slight reduction in mixing between rural, exurban, suburban, and urban classes at the highest extremes. Looking at mixing by economic class in Fig. 4D, however, richness falls by and evenness falls by on very hot days in this more controlled setting. Taken together, this suggests that much of the change in mobility that we see in the matrices is attributable to seasonal variations, yet it also shows a direct effect from heat on mixing. As we move from lower to higher temperatures, we see a consistent progression; we also see evidence from more mixing on mild days, fitting with earlier indications that some temperatures are conducive to new activities.
Projecting into the future
We use modeled estimates of Earth’s future climate, derived from CMIP6 [51], which represents the state-of-the-art in climate projections (see Methods for further detail). The strategy that we employ here is simple: we switch out the UTCI for a given district and day in 2023 for the UTCI on that day in 2073, 50 years later. Holding all else constant allows us to predict activity using our fitted models. The simplicity of this approach introduces limitations, which we discuss now, but it does allow us to understand the implications of our findings in possible future with little adaptation.

Our estimates assume that temperature and nothing else changes going forward. Although the “Lucas Critique” [52] tells us to be wary of making projections when humans can adapt to changing circumstances [53], Spain is aging and thus the demographic issues that we highlight above could be exacerbated. The exercise is also informative because activity is fundamentally different to mortality and morbidity, where we do see evidence for adaptation in recent years [24, 23]: travel within and between cities will likely require, for the foreseeable future, contact with the ambient air. Coping with heat may reduce mobility more, not less, as we attempt to reduce its worst effects on health. For example, it may become more common for employees to work from home on hot days, as telework has changed the demand for face-to-face interaction [54]. For this reason, we believe our estimates to have important implications for the future economy of cities and towns, including, for example, urban business that depend on office workers or rural areas that depend on tourists.
Our model predicts a 3.5% reduction in frequent activities during summer months, May to September, and a 4.7% reduction in infrequent activities. Travel to work or school is projected to fall by 2.2% during that same period. Yet over the full year, all activities will decline by just 1%, as warmer weather during what were once cold periods increases mobility while hotter weather during already hot seasons decreases it.
Next we explore how this could vary across cities and regions. Fig. 5A shows the number of days spent in a given UTCI range, from C to C to C. All of these temperatures correspond to reductions in activity according to our models, and they will be common in the South of the country. In particular, parts of Andalusia will see temperatures exceed C for more than 75 days each year. The North of Spain will experience more days that exceed C, but will only have a few days a year at the extremes that the South will endure.
Fig. 5B shows that the effects of these changes may change mobility if adaptations do not address rising temperatures. Our estimates here show the change on a given day at a given temperature, compared to the baseline. Effect sizes are larger at lower temperatures in the North, where society is not as well acclimated to heat. Because extremes that will occur in the South will not be prevalent there, we concentrate on temperatures between C and C; days in this range would still reduce activity by as much as 6% on days when they occur. While the South is largely unaffected by these temperatures, it see strong changes to activity when temperatures exceed C; when this occurs, activity in the South will fall by 6-12% while activity in the remainder of the country could fall be 15%.
Discussion
We find that mobility behaviours respond to heat in ways that are consistent with expectations rooted in the literature on extreme heat and health. First, daily movement patterns for the elderly are most affected by extreme heat; second, afternoons see the greatest decline in mobility levels across population groups, as temperature—and thus risk—crests. Commensurate with heightened risk, we find that those older than 65 are more likely to reduce activity in response to high temperatures, and that their reductions are greater at higher temperatures. Compatible with the daily temperature dynamics, we see that on hot days activity falls most during the early and late afternoon, and least in the mornings and evenings. Again, our results show that as temperature increases, so does the effect size in our model estimations.
Yet we document opposing effects from extreme heat amongst another vulnerable group. While the oldest dramatically reduce discretionary activities and skip travel to work, possibly to either work from home or miss work, the poorest do not miss work and reduce activities less. This means that the group most at risk, because age magnifies the threat of heat, is responding according to that risk, but it also suggests that the poor are least able to compensate for extreme heat by foregoing work and travel. This reveals important economic constraints that may influence mortality and morbidity.
Lending confidence to our estimates and findings here is the consistency with which our models behave: higher temperatures correspond with larger effects in all of our specifications. Although these findings appear intuitive, our study is the first to document these changes accounting for trip and individual attributes; in doing so, it demonstrates the adaptive nature of human mobility in the presence of extreme heat: populations respond to high temperatures by changing routines and avoiding certain activities. Without more granular data, we cannot shed light on what all of these activities are specifically, but we do see patterns in the analysis we are able to make.
With an aging population and a warming world, our results suggest that policies to adapt to extreme heat will be important for keeping Spain and possibly other European countries active and productive in the coming decades. Yet many existing strategies to mitigate the worst health effects of extreme heat involve air conditioning [23], which is difficult to apply to activity. To be clear, there are still strategies to mitigate extreme heat between buildings, like greening [55], and certain modes of travel can also be air conditioned, but a broad drive to move between air conditioned spaces could change the social fabric in cities, and we find preliminary evidence of how this might occur here. The short trips that are more likely to be walked are also more likely to be avoided in extreme heat. On the hottest days, many also avoid travel to work, so businesses that depend on commuters for foot traffic might suffer. The very adaptations that make heat survivable might erode the subtle interactions that make cities engines of innovation [56, 57] and culture [58].
Although our results are consistent, intuitive and suggestive, the mechanisms underlying the behavioral changes we see in the data during extreme heat are not clear. For example, we cannot prove a link between short trips and active travel, and although we know that frequent trips appear linked to work/study, which agrees with research on trip chaining [59], we cannot determine which classes of amenities are most affected when people avoid travel to work. Our study thus limited, providing strong evidence for adaptation while much of the details are left to speculation.
Finally, our work demonstrates the value of open mobility data: the Spanish government makes the mobility patterns used in this study freely available and further software development has made it easily manipulable [60]. Despite aggregation and suppression to preserve anonymity, our results are clear and robust. More governments should make data of this nature available in order to allow researchers to advance our understanding of human mobility in a changing world. While the data here reveals important insights into who adapts to heat, as well as how and when, it is still limited by how activities are classified and locations are aggregated. With access to data on human mobility expanding over time, future work should replicate this work in other contexts and decompose mobility patterns according to more specific activities, occupations and locations, which will allow governments and philanthropies to target cooling efforts at those most exposed and least able to compensate for extreme heat.
Methods
Data
We use origin-destination data provided by the Spanish Ministry for Transport [43], which integrates anonymized mobile phone records with demographic, land use, and transport network information to produce a mobility data product. This dataset captures trips over 500 meters within Spain and infers key travel characteristics, including origin and destination points, travel modes, and trip purposes. The Ministry leverages state-of-the-art algorithms to transform raw mobile network data into structured and scalable matrices, offering high-resolution insights into mobility patterns across spatial and temporal scales.
The data are stratified to allow for interrogation variations across demographic groups and trip purposes [61]. Balance is achieved using official statistics from the national statistics agency to account for differences in age, income, and regional population distributions. This ensures that the dataset is representative of the broader population, minimizing biases associated with the uneven distribution of mobile phone users. The integration of demographic and geographic information also allows for the segmentation of mobility patterns by municipality, province, and other spatial units, providing a flexible foundation for granular analysis.
The Ministry for Transport employs rigorous quality controls to ensure the reliability of these data [62]. Anomalies in travel patterns are monitored through automated systems, which compare data against historical trends and predefined thresholds. Possible errors, such as geolocation inaccuracies or missing records, are flagged and investigated to ensure data integrity. The data are also validated with independent sources, such as FAMILITUR survey data, to confirm the consistency of observed trends with government statistics. Additionally, logical consistency checks, such as evaluating the symmetry of origin-destination flows, are conducted to ensure that the data align with expected behaviors. These efforts, combined with transparent methodological documentation, make this dataset an important resource for understanding mobility in Spain.
We link these data on mobility with an index of thermal comfort from ERA5-HEAT climate reanalysis data [46], provided by the Copernicus program. Universal Thermal Climate Index (UTCI) combines temperature, wind, radiation and humidity to measure not just how hot it is but how it feels—for example, if humidity limits evaporative cooling through perspiration. We use zonal statistics to compute the UTCI at 16:00 for each district on each day.
Models
We employ twin modeling strategies to understand the relationship between heat and mobility, the first to measure the causal effect and the second to estimate the functional form. Both assume the number of trips terminating in district at time follow a Poisson distribution such that . Our first approach uses a two-way fixed effects model (TWFE):
where represents the expected number of trips, represents district fixed effects controlling for characteristics of the place, while captures date fixed effects accounting for patterns common across districts at a given time. The interaction with activity type allows us to estimate differential temperature responses across activities. This specification leverages within-district variation in temperature after accounting for common temporal shocks, providing causal estimates under the assumption that temperature variation is as-good-as-random after controlling for location and time fixed effects. We cluster standard errors at the province level to account for spatial correlation in the error terms.
Our TWFE model enables us to make causal inferences if certain conditions are met, but there are threats to the model. A key assumption is that mobility patterns would have evolved similarly across districts in the absence of temperature shocks (parallel trends). This is plausible in our setting because temperature variation is as-good-as-random after conditioning on location and time fixed effects, and districts cannot select into heat “treatment”. A more serious threat to identification would be if extreme heat causes people to substitute between districts, violating the stable unit treatment value assumption (SUTVA). We test for such spillovers using a gravity model of bilateral flows between districts, explained and shown in S6. After controlling for origin and destination populations and distance, we find no evidence that temperature gradients between districts drive mobility patterns, suggesting SUTVA violations are unlikely to bias our estimates.
To explore and model the potential curvilinear relationship between heat and activity, we complement the TWFE analysis with a Generalized Additive Model (GAM):
where represents a cubic regression spline with 4 knots, is a cyclic cubic smooth for the day-of-year, capturing seasonality and drifts in the data, and we control for mean visitation (popularity) and geographic variation (province). We also add day-of-week and holiday fixed effects because, for example, weekends and holidays might have different levels of activity and this allows the intercept to vary on those days. While the TWFE isolates the causal effect, the GAM reveals the functional form of behavioral responses to temperature variation through its flexible smooth functions. The GAM’s strength lies in its ability to detect and convey nonlinear relationships without imposing a priori assumptions about the functional form, allowing us to identify potential threshold effects and complex response patterns in human mobility.
Projections
In order to understand possible futures according to our models, we use climate scenarios derived from state-of-the-art “general circulation" models [51], which are used by the Intergovernmental Panel on Climate Change to make projections about Earth’s future climate. We extract data on temperature, humidity, radiation, and wind to compute UTCI manually for the year 2050 under the C of warming, using the simulation from the Centre National de Recherches Météorologiques in France, because it shows high accuracy against observed data [63] and of comparably accurate models it performed best in Spain when we checked it against our data for 2022 and 2023.
Our strategy for estimating mobility in the future is simple yet crude: we replace the UTCI for a given day-of-year in 2023 with the UTCI for that same day 50 years later in 2073, predicting with the new temperatures and all else equal. We compare predicted values using 2023 temperatures to predicted values using 2073 data to ensure that we are comparing like with like, modeled estimates in both cases, rather than using observed values in one and predicted values in another. Because the GAM allows us to produce estimates across the full range of temperatures, we make our predictions using this model rather than the TWFE.
References
- [1] Zhao, Q. et al. Global, regional, and national burden of heatwave-related mortality from 1990 to 2019: A three-stage modelling study. \JournalTitlePLoS medicine 21, e1004364 (2024).
- [2] Masselot, P. et al. Excess mortality attributed to heat and cold: a health impact assessment study in 854 cities in europe. \JournalTitleThe Lancet Planetary Health 7, e271–e281 (2023).
- [3] Vicedo-Cabrera, A. M. et al. The burden of heat-related mortality attributable to recent human-induced climate change. \JournalTitleNature climate change 11, 492–500 (2021).
- [4] Kaiser, R. et al. The effect of the 1995 heat wave in chicago on all-cause and cause-specific mortality. \JournalTitleAmerican Journal of Public Health 97, S158–S162 (2007).
- [5] Zhang, K., Chen, Y. & Begley, C. E. Impact of the 2011 heat wave on mortality and emergency department visits in houston, texas. \JournalTitleEnvironmental Health 14, 1–7 (2015).
- [6] Schaffer, A., Muscatello, D., Broome, R., Corbett, S. & Smith, W. Emergency department visits, ambulance calls, and mortality associated with an exceptional heat wave in sydney, australia, 2011: a time-series analysis. \JournalTitleEnvironmental Health 11, 1–8 (2012).
- [7] Somanathan, E., Somanathan, R., Sudarshan, A. & Tewari, M. The impact of temperature on productivity and labor supply: Evidence from indian manufacturing. \JournalTitleJournal of Political Economy 129, 1797–1827 (2021).
- [8] Schlenker, W. & Roberts, M. J. Nonlinear temperature effects indicate severe damages to us crop yields under climate change. \JournalTitleProceedings of the National Academy of sciences 106, 15594–15598 (2009).
- [9] Dell, M., Jones, B. F. & Olken, B. A. What do we learn from the weather? the new climate-economy literature. \JournalTitleJournal of Economic literature 52, 740–798 (2014).
- [10] Colacito, R., Hoffmann, B. & Phan, T. Temperature and growth: A panel analysis of the united states. \JournalTitleJournal of Money, Credit and Banking 51, 313–368 (2019).
- [11] Perkins, S. E., Alexander, L. & Nairn, J. Increasing frequency, intensity and duration of observed global heatwaves and warm spells. \JournalTitleGeophysical Research Letters 39 (2012).
- [12] Perkins-Kirkpatrick, S. & Lewis, S. Increasing trends in regional heatwaves. \JournalTitleNature communications 11, 3357 (2020).
- [13] Lüthi, S. et al. Rapid increase in the risk of heat-related mortality. \JournalTitleNature communications 14, 4894 (2023).
- [14] Kenny, G. P., Yardley, J., Brown, C., Sigal, R. J. & Jay, O. Heat stress in older individuals and patients with common chronic diseases. \JournalTitleCmaj 182, 1053–1060 (2010).
- [15] Xu, Z. et al. The impact of heat waves on children’s health: a systematic review. \JournalTitleInternational Journal of Biometeorology 58, 239–247 (2014).
- [16] Oudin Åström, D., Bertil, F. & Rocklöv, J. Heat wave impact on morbidity and mortality in the elderly population: A review of recent studies. \JournalTitleMaturitas 69, 99–105 (2011).
- [17] Organization, W. H. Diabetes. https://www.who.int/europe/news-room/fact-sheets/item/diabetes (2023). Accessed: 2023-12-19.
- [18] Organization, W. H. The challenge of obesity. https://www.who.int/europe/news-room/fact-sheets/item/the-challenge-of-obesity (2022). Accessed: [Current Date].
- [19] Zanobetti, A., O’neill, M. S., Gronlund, C. J. & Schwartz, J. D. Summer temperature variability and long-term survival among elderly people with chronic disease. \JournalTitleProceedings of the National Academy of Sciences 109, 6608–6613 (2012).
- [20] Romanello, M. et al. The 2021 report of the lancet countdown on health and climate change: code red for a healthy future. \JournalTitleThe Lancet 398, 1619–1662 (2021).
- [21] Cruz, J.-L. Global warming and labor market reallocation. \JournalTitleAvailable at SSRN 4946752 (2024).
- [22] Cong, S., Nock, D., Qiu, Y. L. & Xing, B. Unveiling hidden energy poverty using the energy equity gap. \JournalTitleNature communications 13, 2456 (2022).
- [23] Barreca, A., Clay, K., Deschenes, O., Greenstone, M. & Shapiro, J. S. Adapting to climate change: The remarkable decline in the us temperature-mortality relationship over the twentieth century. \JournalTitleJournal of Political Economy 124, 105–159 (2016).
- [24] Heutel, G., Miller, N. H. & Molitor, D. Adaptation and the mortality effects of temperature across us climate regions. \JournalTitleReview of Economics and Statistics 103, 740–753 (2021).
- [25] Batur, I. et al. Understanding how extreme heat impacts human activity-mobility and time use patterns. \JournalTitleTransportation Research Part D: Transport and Environment 136, 104431 (2024).
- [26] Graff Zivin, J. & Neidell, M. Temperature and the allocation of time: Implications for climate change. \JournalTitleJournal of Labor Economics 32, 1–26 (2014).
- [27] Böcker, L., Dijst, M. & Prillwitz, J. Impact of everyday weather on individual daily travel behaviours in perspective: a literature review. \JournalTitleTransport reviews 33, 71–91 (2013).
- [28] Zander, K. K., Botzen, W. J., Oppermann, E., Kjellstrom, T. & Garnett, S. T. Heat stress causes substantial labour productivity loss in australia. \JournalTitleNature climate change 5, 647–651 (2015).
- [29] Périard, J. D., DeGroot, D. & Jay, O. Exertional heat stroke in sport and the military: epidemiology and mitigation. \JournalTitleExperimental physiology 107, 1111–1121 (2022).
- [30] Ferranti, E. et al. Heat-related failures on southeast england’s railway network: Insights and implications for heat risk management. \JournalTitleWeather, Climate, and Society 8, 177–191 (2016).
- [31] Ly, A., Davenport, F. V. & Diffenbaugh, N. S. Exploring the influence of summer temperature on human mobility during the covid-19 pandemic in the san francisco bay area. \JournalTitleGeoHealth 7, e2022GH000772 (2023).
- [32] Li, W., Wang, Q., Liu, Y., Small, M. L. & Gao, J. A spatiotemporal decay model of human mobility when facing large-scale crises. \JournalTitleProceedings of the National Academy of Sciences 119, e2203042119 (2022).
- [33] Yin, Q., Wang, J., Ren, Z., Li, J. & Guo, Y. Mapping the increased minimum mortality temperatures in the context of global climate change. \JournalTitleNature communications 10, 4640 (2019).
- [34] Tobías, A. et al. Geographical variations of the minimum mortality temperature at a global scale: a multicountry study. \JournalTitleEnvironmental epidemiology 5, e169 (2021).
- [35] Hess, J. J. et al. Public health preparedness for extreme heat events. \JournalTitleAnnual Review of Public Health 44, 301–321 (2023).
- [36] Ballester, J. et al. Heat-related mortality in europe during the summer of 2022. \JournalTitleNature medicine 29, 1857–1866 (2023).
- [37] Gallo, E. et al. Heat-related mortality in europe during 2023 and the role of adaptation in protecting health. \JournalTitleNature medicine 1–5 (2024).
- [38] International Energy Agency. The future of cooling. Tech. Rep., International Energy Agency (2018). Accessed on November 29, 2024.
- [39] Gu, X., Chen, P. & Fan, C. Socio-demographic inequalities in the impacts of extreme temperatures on population mobility. \JournalTitleJournal of Transport Geography 114, 103755 (2024).
- [40] Albouy, D., Graf, W., Kellogg, R. & Wolff, H. Climate amenities, climate change, and american quality of life. \JournalTitleJournal of the Association of Environmental and Resource Economists 3, 205–246 (2016).
- [41] Wu, Y. et al. Temperature frequency and mortality: Assessing adaptation to local temperature. \JournalTitleEnvironment international 187, 108691 (2024).
- [42] Lorenzo, N., Díaz-Poso, A. & Royé, D. Heatwave intensity on the iberian peninsula: Future climate projections. \JournalTitleAtmospheric Research 258, 105655 (2021).
- [43] Ministry of Transport, Mobility and Urban Agenda of Spain, MITMA. Open Data Movilidad 2020-2021. https://www.transportes.gob.es/ministerio/proyectos-singulares/estudios-de-movilidad-con-big-data/opendata-movilidad (2024).
- [44] Moro, E., Calacci, D., Dong, X. & Pentland, A. Mobility patterns are associated with experienced income segregation in large us cities. \JournalTitleNature communications 12, 4633 (2021).
- [45] de la Prada, À. G. & Small, M. L. How people are exposed to neighborhoods racially different from their own. \JournalTitleProceedings of the National Academy of Sciences 121, e2401661121 (2024).
- [46] Di Napoli, C., Barnard, C., Prudhomme, C., Cloke, H. L. & Pappenberger, F. Era5-heat: a global gridded historical dataset of human thermal comfort indices from climate reanalysis. \JournalTitleGeoscience data journal 8, 2–10 (2021).
- [47] OECD. Usual working hours per week by gender (2024). Accessed on December 30, 2024.
- [48] OECD. Time use for work, care and other day-to-day activities (2016). Accessed on December 30, 2024.
- [49] Borràs, V., Ajenjo, M. & Moreno-Colom, S. More time parenting in spain: a possible change towards gender equality? \JournalTitleJournal of Family Studies (2021).
- [50] Pyron, M. Characterizing communities. \JournalTitleNature Education Knowledge 3, 39 (2010).
- [51] Thrasher, B. et al. Nasa global daily downscaled projections, cmip6. \JournalTitleScientific data 9, 262 (2022).
- [52] Lucas Jr, R. E. Econometric policy evaluation: A critique. In Carnegie-Rochester conference series on public policy, vol. 1, 19–46 (North-Holland, 1976).
- [53] Kahn, M. E. Adapting to climate change (Yale University Press, 2021).
- [54] Barrero, J. M., Bloom, N. & Davis, S. J. The evolution of work from home. Tech. Rep., National Bureau of Economic Research (2023).
- [55] Jay, O. et al. Reducing the health effects of hot weather and heat extremes: from personal cooling strategies to green cities. \JournalTitleThe Lancet 398, 709–724 (2021).
- [56] Arzaghi, M. & Henderson, J. V. Networking off madison avenue. \JournalTitleThe Review of Economic Studies 75, 1011–1038 (2008).
- [57] Atkin, D., Chen, M. K. & Popov, A. The returns to face-to-face interactions: Knowledge spillovers in silicon valley. Tech. Rep., National Bureau of Economic Research (2022).
- [58] Glaeser, E. Triumph of the city (2011).
- [59] Miyauchi, Y., Nakajima, K. & Redding, S. J. The economics of spatial mobility: Theory and evidence using smartphone data. Tech. Rep., National Bureau of Economic Research (2021).
- [60] Kotov, E., Lovelace, R. & Vidal-Tortosa, E. spanishoddata, 10.32614/CRAN.package.spanishoddata (2024).
- [61] Secretaría de Estado de Transportes y Movilidad Sostenible. Estudio de movilidad de viajeros de ámbito nacional aplicando la tecnología Big Data: Informe metodológico. Technical Report, Ministerio de Transportes y Movilidad Sostenible (2024).
- [62] Subdirección General de Planificación, Red Transeuropea y Logística. Controles de calidad realizados a los análisis de movilidad con BigData. Parte 1. Estudios básicos. Technical Report, Ministerio de Transportes y Movilidad Sostenible (2024).
- [63] Craigmile, P. F. & Guttorp, P. Comparing cmip6 climate model simulations of annual global mean temperatures to a new combined data product. \JournalTitleEarth and Space Science 10, e2022EA002468 (2023).
Acknowledgements
The authors would like to thank Mattia Mazzoli and Complexity72h for introducing us to the data, and Elsa Arcaute and Neave O’Clery for helping refine the paper.
Author contributions statement
A.R. Conceptualization, methodology, investigation, writing, reviewing, editing; C.C.A. Conceptualization, methodology, investigation, writing, reviewing, editing.
Data and code availability
Mobility data are available from the Ministry for Transport. ERA5 climate recordings and CMIP6 climate projections are accessible via Google Earth Engine. All code is available upon request.
Competing interests
The authors declare no conflict of interest.