Semise: Semi-supervised learning for severity representation in medical image
Abstract
This paper introduces SEMISE, a novel method for representation learning in medical imaging that combines self-supervised and supervised learning. By leveraging both labeled and augmented data, SEMISE addresses the challenge of data scarcity and enhances the encoder’s ability to extract meaningful features. This integrated approach leads to more informative representations, improving performance on downstream tasks. As result, our approach achieved a 12% improvement in classification and a 3% improvement in segmentation, outperforming existing methods. These results demonstrate the potential of SIMESE to advance medical image analysis and offer more accurate solutions for healthcare applications, particularly in contexts where labeled data is limited.
Index Terms— Semi-Supervised Learning, Severity Representation, Constractive Learning, Medical Image
1 Introduction
Severity study [1, 2] in medical domain is critical problems in which medical experts identify severity of illness of subjects by different levels (mild, moderate, severe, extremely severe) [3, 4, 5, 6, 7, 8] or preferred comparison (one is more severe than the other) [9]. Investigating severity can help putting hospital in order by clustering patients have same level of illness or better queue for timely treatment. Several severity study [10, 11] have been conducted to relate severity level to length of hospital stay or inpatient mortality. Yet, taking doctors to rank thousand to millions of patients’ reports is either time consuming or economic inefficient. This paper aim to develop an AI model to learn severity knowledge in medical images and generalize well on multiple tasks including severity classification and pathology segmentation. We put our focus on images although there is more than one medium to identify severity of pathologies, such as bioSignal [12], EEG [13], etc.
Recently, representation learning has emerged as a foundational component in any advance AI systems, as it facilitate the automatic features extraction to learn signature contextual information from data. In literature, representation learning can be categorized into Self-Supervise, Supervised and Semi-Supervised Learning.
Self-Supervised Representaion Learning (SSL): SSL methods, categorized into contrastive and generative models. Contrastive methods [14, 15, 16, 17, 18], enhance local embedding understanding by maximizing similarity between augmented views of the same image while generative models [19, 20, 21] focus on embedding visual knowledge into low-dimensional vectors to regenerate original images from noisy versions.
Supervised Represenation Learning (SRL): SRL models such as SupCon [22] and SERL [23] utilize labeled datasets to incorporate cross-subject information, yielding promising results in downstream tasks. However, these approaches construct embedding space base on similarity measure but not relative relation between classes, e.g in medical context, mild severity class close to normality than extreme severity. Recently, ConPro [9] employ preference comparisons to rank disease severity, optimizing latent embeddings based on preference information. However, these models often rely on limited severity labels and focus primarily on classification tasks. This study aims to extend these approaches to broader downstream tasks while addressing their limitations.

Semi-Supervised Representation Learning (SemiSL): SemiSL combines labeled and unlabeled data, with frameworks like ROPAWS[24], FixMatch [25], and Mean Teacher [26] addressing semi-supervised task challenges. Despite their potential, these methods face issues related to unreliable pseudo-labels and class imbalance. The proposed approach leverages SemiSL to integrate the strengths of the aforementioned techniques.
To address mentioned challenges, we summarized our contribution as follow
-
•
We proposed SemiSe: A Semi-supervised learning framework that leverages both in-context self-learning and cross-subject label information to optimally enrich Severity knowledge into latent embedding vectors.
-
•
We quantitatively evaluate our framework on multiple downstream tasks and show that our proposed framework outperform predecessors in term of F1 score, MAEE, IoUs and DICE.
2 Methodology
The proposed methodology, SemiSe as detailed in [9] and depicted in Fig. 1, comprises two main phases. The initial phase discriminates Healthy-Anomalie, while the subsequent phase centers around preference optimization. In the latter phase, self-supervised learning techniques, particularly SimCLR, are incorporated along with reference opt to both learn the in-context and cross-subject representation.
| VinDr-Mammo | Papilledema | ISIC | |||||||
| Methods | F1 | MAEE | Recall | F1 | MAEE | Recall | F1 | MAEE | Recall |
| SODA | 16.10 | 3.04 | 20,00 | 43,90 | 1.37 | 50,00 | 10,70 | 58,51 | 14,30 |
| SupCon-2 | 17.70 | 2.94 | 20,20 | 24.16 | 2.74 | 33.30 | 56.38 | 27.94 | 53.46 |
| SupCon-n | 18.80 | 2.93 | 20,30 | 24.16 | 2.74 | 33.30 | 55.72 | 29.69 | 54.58 |
| SimCLR | 17.64 | 2.96 | 20.10 | 34.24 | 2.32 | 40.26 | 54.62 | 28.08 | 53.52 |
| ConPrO | 20.50 | 2.60 | 21.70 | 94.10 | 1.13 | 93.76 | 55.92 | 28.11 | 54.14 |
| SEMISE ( | 32.34 | 2.57 | 29.60 | 94.84 | 1.13 | 94.56 | 55.10 | 31.90 | 52.40 |
| SEMISE ( | 26.80 | 2.61 | 26.10 | 94.80 | 1.06 | 93.00 | 59.40 | 26.80 | 56.60 |
| Methods | IoU (%) | DICE (%) |
|---|---|---|
| SODA | 28.09 | 39.80 |
| SimCLR | 41,62 | 56,58 |
| SupCon-2 | 41,54 | 56,85 |
| SupCon-n | 40,68 | 55,71 |
| ConPro | 42,22 | 57,17 |
| SEMISE | 43,10 | 58,06 |
2.1 Healthy-Anomaly Discrimination
To classify a sample as healthy or anomalous, it is processed through a feature extraction block and a projection block to create its representation. Utilizing contrastive loss [22] with labeled data enhances the feature extraction process, enabling the model to distinguish the unique characteristics of healthy samples from anomalies. The contrastive loss function can be defined as follows:
| (1) |
where is the total number of sample pairs, indicates whether the samples are similar (1) or dissimilar (0), represents the distance between the representations of the samples (with cosine distance used in this work), and is the margin that separates dissimilar pairs.
2.2 Contrastive Representation Learning
After distinguishing between healthy and anomalous samples, self-supervised contrastive learning allows the model to examine multiple perspectives of an anomalous sample by contrasting the original with its augmented counterpart, using the augmentation function and projection head . This process encourages the formation of distinct clusters of similar features in the latent space. To achieve this, the NT-Xent loss [27] from the SimCLR framework [14] is utilized:
| (2) |
where and are the feature representations of the original sample and its augmented version, respectively, sim(, ) denotes the cosine similarity between and , is a temperature scalar that helps control the sharpness of the distribution and typically refers to the number of examples in a mini-batch.
2.3 Preference Optimization
Preference optimization enhances the representations of samples in latent space, using a healthy sample as a reference. Anomalous samples are evaluated as pairs, with the more severe sample positioned further from the reference. We modified the Preference Comparison Loss [9] to better address our specific issue. Instead of using negative log-likelihood loss for re-parameterizing the feature space, we opted for binary cross-entropy loss (BCE), as it helps the model converge faster in our experiments. The modified loss function is defined as follows:
| (3) |
in which the reference feature vector. The goal is to assess the distances from and to . If is more dangerous than (label 1), should be further from than , and vice versa.
2.4 Combined Loss Function between SSL and SRL
To learn domain knowledge and cross-subject correlation simultaneously, the objective functions of SSL and SRL are combined to enhance model performance. The two previously described loss functions (2), (3) are combined into a unified loss function. This function includes a weighting parameter to adjust the relative importance of each component:
| (4) |
3 Experimental Settings
3.1 Datasets
VinDr-Mammography: The VinDr-Mammography dataset [28] consists of over 5,000 annotated mammograms labeled by radiologists. It includes various abnormalities and has 5 levels of severity. The dataset also includes bounding-box annotation for lesions, such as masses and calcification’s.
Papilledema is Kaggle public dataset in which the pathology [29] is presented by the swelling of the optic disc due to increased intracranial pressure, indicating serious neurological conditions. Without loss of generality, we assume that the condition can be classified into three severity levels: normal, pseudo-papilledema, and papilledema. Among these, normal presents the least risk, while papilledema is the most severe, requiring immediate medical attention.
ISIC Skin Lesion The ISIC skin lesion dataset [30] is a comprehensive collection of dermoscopic images for melanoma and skin lesion classification, annotated by dermatologists. It supports research in skin cancer detection, segmentation, and classification.
3.2 Experimental Setup.
All experiments used the same ResNet-50 encoder architecture for upstream task and downstream tasks such as classification and segmentation task, conducted on a GTX 4070 with a batch size of 256. Datasets were split to prevent leakage: 72/8/20 for VinDr-Mammo, 70/15/15 for Papilledema and ISIC dataset. For preference optimization, pairs were randomly selected for training and pairs were chosen for evaluation. SGD with a momentum of 0.9 was used, updating the encoder with a learning rate of and the projection heads at . The ResNet-50 outputs 2048-dimensional vectors. The projection head is a fully connected layer with a 256-dimensional output, and the preference comparison head maintains normality in the preference vector dimensions.
Without loss of generality, we select representative models SODA [20], SimCLR [14], SupCon-n [22] and ConPro [9]. for comparion. To evaluate the methods, performance is assessed through downstream tasks, including classification and segmentation. For classification, F1 Score, Recall, and MAEE are used to evaluate the effectiveness of our model. In segmentation, Intersection over Union (IoU) and Dice Coefficient are employed, where higher values reflect improved segmentation accuracy.
4 Results
4.1 Severity Classification
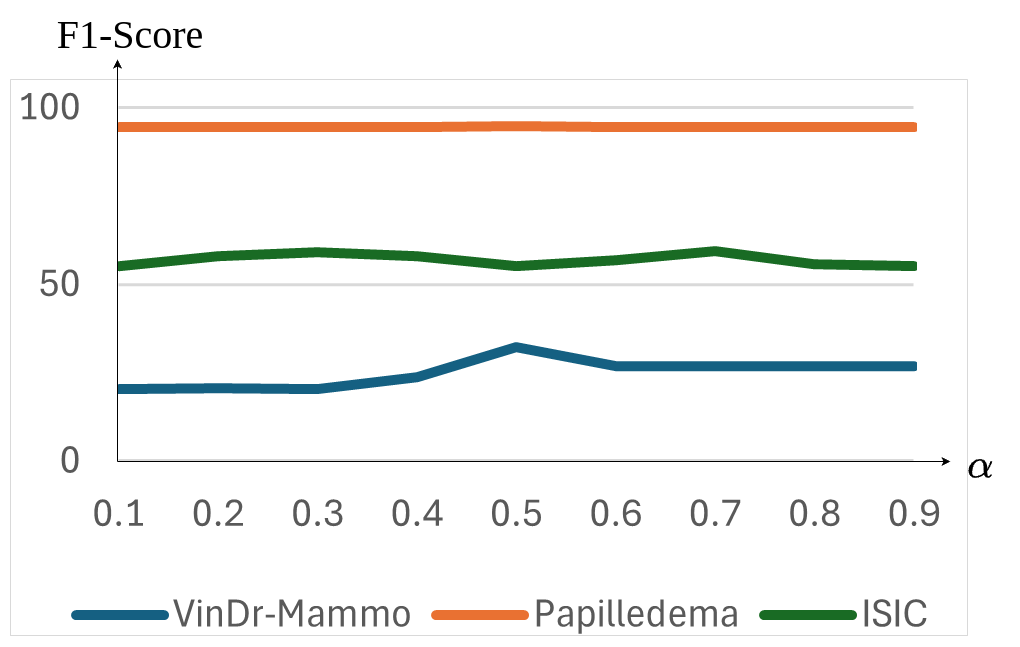
A simple architecture with two dense ReLU-activated layers and a Dropout layer (0.3 probability) follows the ResNet embedding to mitigate overfitting. Only the fully connected layer is trained, while the ResNet encoder remains frozen. These results which is shown in Table 1 demonstrate the model’s effectiveness in feature extraction, leading to significant classification improvements. The enhancements in F1 Score and Recall show that our approach addresses the limitations of methods like ConPro and SODA, establishing it as a robust solution for medical image classification. Our model is superior than others because the pre-trained encoder can learn features from multiple views of the same sample while distinguishing key features in paired images, resulting in more accurate and robust representations. Fig 3 illustrates the effect of the alpha parameter on classification performance through the F1-Score metric.
4.2 Segmentation Task
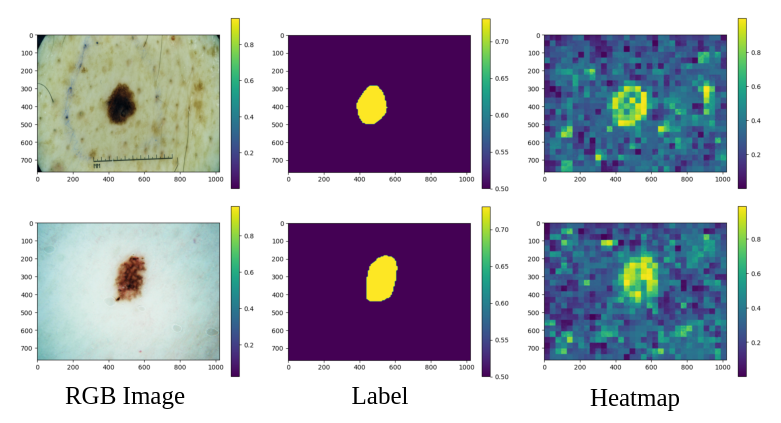
A pretrained encoder extracts features from input images, processed by a segmentation network to identify regions of interest. The encoder is frozen, and the decoder is fine-tuned using a reused UNet architecture for pixel-level segmentation. The same encoder is used for feature extraction across all tasks. Results of segmentation task are shown in Table 2. Our segmentation model is designed based on the U-Net architecture. After freezing the encoder block and constructing the segmentation model, we evaluated its performance on the ISIC dataset. Figure 2 presents the heatmaps resulting from the segmentation outputs of this model. These heatmaps provide a quantitative visualization of the model’s effectiveness in accurately delineating significant features within medical images, underscoring its capacity for robust feature identification and spatial awareness.
5 Conclusions
This paper introduces a novel representation learning approach that enhances upstream tasks through a new feature extraction method. The proposed method demonstrates significant improvements in both classification and segmentation tasks, outperforming techniques SOTA representation learning methods across various medical imaging datasets. Key metrics, including F1 Score, IoU, and Dice Coefficient, highlight the robustness of the approach. These results confirm that strengthening upstream representation learning can substantially enhance downstream task performance.
References
- [1] Dimitrios Kollias et al. AI-MIA: Covid-19 detection & severity analysis through medical imaging, 2022.
- [2] Jayashree et al. Plus disease in retinopathy of prematurity: Improving diagnosis by ranking disease severity and using quantitative image analysis. Ophthalmology, 2016.
- [3] Tej Bahadur Chandra, Bikesh Kumar Singh, and Deepak Jain. Disease localization and severity assessment in chest x-ray images using multi-stage superpixels classification. Comput. Methods Prog. Biomed., 222(C), July 2022.
- [4] Matthew et al. Li. Siamese neural networks for continuous disease severity evaluation and change detection in medical imaging. NPJ Digit. Med., 3(1):48, March 2020.
- [5] Zongyun Gu, Yan Li, Zijian Wang, Junling Kan, Jianhua Shu, and Qing Wang. Classification of diabetic retinopathy severity in fundus images using the vision transformer and residual attention. Comput. Intell. Neurosci., January 2023.
- [6] Yazan Qiblawey et al. Detection and severity classification of covid-19 in ct images using deep learning, 2021.
- [7] Sam B. Tran et al. A novel transparency strategy-based data augmentation approach for bi-rads classification of mammograms. 2023 IEEE Statistical Signal Processing Workshop (SSP), pages 681–685, 2022.
- [8] İlkay et al. Yıldız. Classification and comparison via neural networks. Neural Netw., 118:65–80, October 2019.
- [9] Hong Nguyen et al. Conpro: Learning severity representation for medical images using contrastive learning and preference optimization, 2024.
- [10] Dominique et al. Lauque. Length-of-stay in the emergency department and in-hospital mortality: A systematic review and meta-analysis. J. Clin. Med., 12(1):32, December 2022.
- [11] Nasibeh Azadeh-Fard, Navid Ghaffarzadegan, and Jaime A Camelio. Can a patient’s in-hospital length of stay and mortality be explained by early-risk assessments? PLoS One, 11(9):e0162976, September 2016.
- [12] Lou Ancillon, Mohamed Elgendi, and Carlo Menon. Machine learning for anxiety detection using biosignals: A review. Diagnostics (Basel), 12(8):1794, July 2022.
- [13] Ryan et al. Tesh. VE-CAM-S: Visual EEG-based grading of delirium severity and associations with clinical outcomes. Crit. Care Explor., 4(1):e0611, January 2022.
- [14] Ting Chen, Simon Kornblith, Mohammad Norouzi, and Geoffrey Hinton. A simple framework for contrastive learning of visual representations, 2020.
- [15] Zhenda Xie, Zheng Zhang, Yue Cao, Yutong Lin, Jianmin Bao, Zhuliang Yao, Qi Dai, and Han Hu. Simmim: A simple framework for masked image modeling, 2022.
- [16] Kaiming He, Haoqi Fan, Yuxin Wu, Saining Xie, and Ross Girshick. Momentum contrast for unsupervised visual representation learning, 2020.
- [17] Mathilde Caron, Ishan Misra, Julien Mairal, Priya Goyal, Piotr Bojanowski, and Armand Joulin. Unsupervised learning of visual features by contrasting cluster assignments, 2021.
- [18] Mathilde Caron, Hugo Touvron, Ishan Misra, Hervé Jégou, Julien Mairal, Piotr Bojanowski, and Armand Joulin. Emerging properties in self-supervised vision transformers, 2021.
- [19] Kaiming He, Xinlei Chen, Saining Xie, Yanghao Li, Piotr Dollár, and Ross Girshick. Masked autoencoders are scalable vision learners, 2021.
- [20] et al. Drew A. Hudson. Soda: Bottleneck diffusion models for representation learning, 2023.
- [21] Konpat Preechakul, Nattanat Chatthee, Suttisak Wizadwongsa, and Supasorn Suwajanakorn. Diffusion autoencoders: Toward a meaningful and decodable representation, 2022.
- [22] et al Prannay Khosla. Supervised contrastive learning, 2021.
- [23] Jianlan Luo, Zheyuan Hu, Charles Xu, You Liang Tan, Jacob Berg, Archit Sharma, Stefan Schaal, Chelsea Finn, Abhishek Gupta, and Sergey Levine. Serl: A software suite for sample-efficient robotic reinforcement learning, 2024.
- [24] Sangwoo Mo, Jong-Chyi Su, Chih-Yao Ma, Mido Assran, Ishan Misra, Licheng Yu, and Sean Bell. Ropaws: Robust semi-supervised representation learning from uncurated data, 2023.
- [25] Kihyuk Sohn et al. Fixmatch: Simplifying semi-supervised learning with consistency and confidence, 2020.
- [26] Antti Tarvainen and Harri Valpola. Mean teachers are better role models: Weight-averaged consistency targets improve semi-supervised deep learning results, 2018.
- [27] Wilhelm Ågren. The nt-xent loss upper bound, 2022.
- [28] Hieu T. Nguyen et al. Vindr-mammo: A large-scale benchmark dataset for computer-aided diagnosis in full-field digital mammography, 2023.
- [29] Kleanthis Avramidis, Mohammad Rostami, Melinda Chang, and Shrikanth Narayanan. Automating detection of papilledema in pediatric fundus images with explainable machine learning, 2022.
- [30] David Gutman et al. Skin lesion analysis toward melanoma detection: A challenge at ISBI, 2016.